Article

Founding Family Ownership and Firm Performance: Some Evidence from the Italian Stock Market

Department of Economics and Management, University of Pavia, Via S. Felice, 5, 27100 Pavia, Italy
*
Author to whom correspondence should be addressed.
J. Risk Financial Manag. 2022, 15(5), 231; https://doi.org/10.3390/jrfm15050231
Submission received: 28 April 2022 / Revised: 18 May 2022 / Accepted: 20 May 2022 / Published: 23 May 2022
(This article belongs to the Special Issue Business Performance)

Abstract

:
This study investigates the relationship between founding family ownership and firm performance in the Italian stock market. Making use of a precise definition of Founding family ownership factor, an empirical analysis on the stock monthly returns has been carried out, from an investor’s point of view facing an asset allocation problem. Portfolios built on the basis of the Founding family factor show superior returns with respect to both a benchmark index and a portfolio strategy based on alternative (non-family-owned) firms on the market. Furthermore, there is evidence that an active role of family in the company governance, at least in Italy, may be beneficial for the superior performance of the Founding family portfolio. The results may suggest that the Founding family feature deserves attention in asset allocation.

1. Introduction

In the last twenty years, the impact of family ownership on performance of listed firms has attracted the efforts of worldwide scholars (Poutziouris et al. 2015; Villalonga and Amit 2020). A large part of the available research (Poutziouris et al. 2015) focuses on performance metrics related to financial ratios, and balance sheet items. However, the evidence on the stock market performance of these firms is very limited, (Eugster and Isakov 2019). A question still deserving a conclusive answer is whether there exists a Family factor able to impact on stock performances, and whether this feature can be a guideline to obtain superior portfolio allocation rules. The first objective of this paper is to fill the literature gap, by proposing a detailed analysis of the stock returns of family-owned firms, compared to the rest of the market, in the last decade. Secondly, this paper aims to assess the impact of family ownership on stock performances, from an investor’s point of view. Using a comprehensive sample of non-financial firms, and an accurate definition of family-owned firm, evidence has been found that family ownership has a beneficial effect, and these firms consistently outperform counterparts and the entire Italian stock market. The detected abnormal return is impressive—(about) 7% per year. The obtained results may be a useful guide for investors and fund managers interested in stock selection criteria. The focus on the Italian market is, as far as we know, the first attempt to provide an extensive study concerning this country. The Italian case may be interesting due to the large number of family-owned firms.
Family ownership is the most common ownership in listed companies around the world (La Porta et al. 1999; Villalonga and Amit 2020). In the U.S., Anderson and Reeb Anderson and Reeb (2003) show the frequency of family ownership, concerning around 35% of the listed companies in the S&P 500. In Western Europe as well, the presence of family ownership is predominant: around 44% of the listed companies (Faccio and Lang 2002). In Italy, the portion of family ownership is 60%, above the European average, although it reduces to 20% in the largest 20 listed firms (Barontini and Caprio 2006). In the reported studies, the definition of family property requires that at least 20% of voting rights be handled by a family.
These findings on the dominance of family as ownership structure have prompted researchers to shed light on its impact on firm performance. Poutziouris et al. (2015) reported that the relationship between family ownership and profitability is mostly investigated, through the analysis of two financial ratios: ROA, return on assets, and Tobin’s Q. The impact of the family factor has been also evaluated through cross-sectional or panel data regressions, where the regressors include key quantitative and qualitative characteristics of firms. Although it could be relevant for investors attempting to pick stocks successfully, there are few studies investigating the impact of the family factor on stock returns (e.g., see Eugster and Isakov 2019).
The results available in the literature about the impact of family ownership on firm performance, which could generate its effect also through an active involvement in governance and management (Anderson and Reeb 2003; Poutziouris et al. 2015; Sraer and Thesmar 2007), may appear inconclusive at first sight, because of its complexity. In fact, some authors (see Anderson and Reeb 2003; Barontini and Caprio 2006; Eugster and Isakov 2019; Isakov and Weisskopf 2014; Koji et al. 2020; Poutziouris et al. 2015; Sraer and Thesmar 2007) argue that family ownership creates value per se, while few others (see Filatotchev et al. 2005; Miller et al. 2007; Villalonga and Amit 2006) state that, except when the founder plays a role in the governance, it does not create value more than its counterparts, and it even destroys value when the leadership transfers to descendants.
Anderson and Reeb (2003) and Poutziouris et al. (2015) find that, in the Anglo-Saxon stock markets, family ownership has generally a beneficial effect, however, they identify a reversed-U-shape relation between ownership level and performance. When family shareholding overcomes a certain threshold, it is likely that firm performance begins to decline. Eugster and Isakov (2019), using the investor’s point of view, find that the Founding family property has a positive impact on stock returns in the Swiss stock market, with an annual outperformance of 4% to 7%, compared to counterparts. Barontini and Caprio (2006) find that family firms in continental Europe have higher market valuations compared to non-family ones. This is also true after the founding stage, although families heavily use control-enhancing devices. The best results come from firms where a family has an active role, alongside a hired-hand executive.
The authors claiming better performance of family firms agree on the fact that some additional conditions are involved, especially a strong minority shareholder protection. In contrast, Villalonga and Amit (2006) find that the outperformance of American family firms fades when founders’ descendants follow. In the same context, Miller et al. (2007) suggest that the outperformance detected in the previous works could be due to an excessively broad definition of family. In fact, in firms with multiple family members, the potential value of far-sighted family guidance may likely be weakened by possible internal family conflicts. Filatotchev et al. (2005) find that firms listed in the Taiwan stock market whose dominant shareholder is an institutional investor have better performance than any other family counterparts, and the independence of the board from family ownership has a positive impact.
In short, for these scholars, the governance role of family members and their heirs appears to play a significant role, even though it can be negative. In addition, the separation between control and ownership in contexts of weak minority shareholder protection (see Claessens et al. 2002; Cronqvist and Nilsson 2003) seems to impact firm performances negatively. Notwithstanding, all of that reinforces the argument that in contexts of sound minority shareholders’ protection, the family firms have higher market valuations, regardless of family management involvement. In fact, in a cross-national study at the European level, Maury (2006) finds that family firms have superior profitability, reflected in higher market valuations, when the protection of minority shareholders is strong enough. Isakov and Weisskopf (2014) reach the same conclusion for the Swiss stock market. Sraer and Thesmar (2007), in a similar institutional context, find family outperformance in descendants’ management rather than founders’. It is evident that the difference in some conclusions could be attributed to multifaceted factors across the countries such as minority shareholder protection, control-enhancing devices, family generation, and cultural background Isakov and Weisskopf (2014).
The results presented above may seem in contrast to market efficiency (Fama 1970). In fact, the type of ownership, as public information, should be already incorporated in the stock market price. Therefore, there should be no reason to believe that picking stocks based on this information might lead to superior portfolios. However, the fact that some information is in the public domain does not ensure it is properly assessed, especially if it is qualitative.
The family ownership impact is somewhat puzzling because it is shaped by several forces. The agency and stewardship theories (Davis et al. 1997; Fama 1970; Fox and Hamilton 1994; Jensen and Meckling 1976) are the two core domains identifying these forces (Miller and Le Breton-Miller 2006). The positive impact of family arises when the property concentration reduces the risks of expropriation by hired-hand management and limits, at the same time, those by other dominant shareholders (see Anderson and Reeb 2003; Jensen and Meckling 1976; Mork and Yeung 2003; Nahapiet and Ghoshal 1998). The stewardship attitude (a characteristic of a family ownership, especially if “founding”) vigorously mitigates risks of dominant shareholders’ opportunistic behaviors at the expense of minority ones. Above all, it could create far-sighted contributions that sustain distinctive firm capabilities, which, in turn, will provide superior financial returns over time (see Davis et al. 1997; Donaldson and Davis 1991). Usually, a family has a longer investment horizon and a personal connection to the firm, which means seeking long-term sustainability of profitability with far-sighted investments (see Gallo and Vilaseca 1996; Hoopes and Miller 2006; Isakov and Weisskopf 2014; Miller and Le Breton-Miller 2005; Miller et al. 2007).
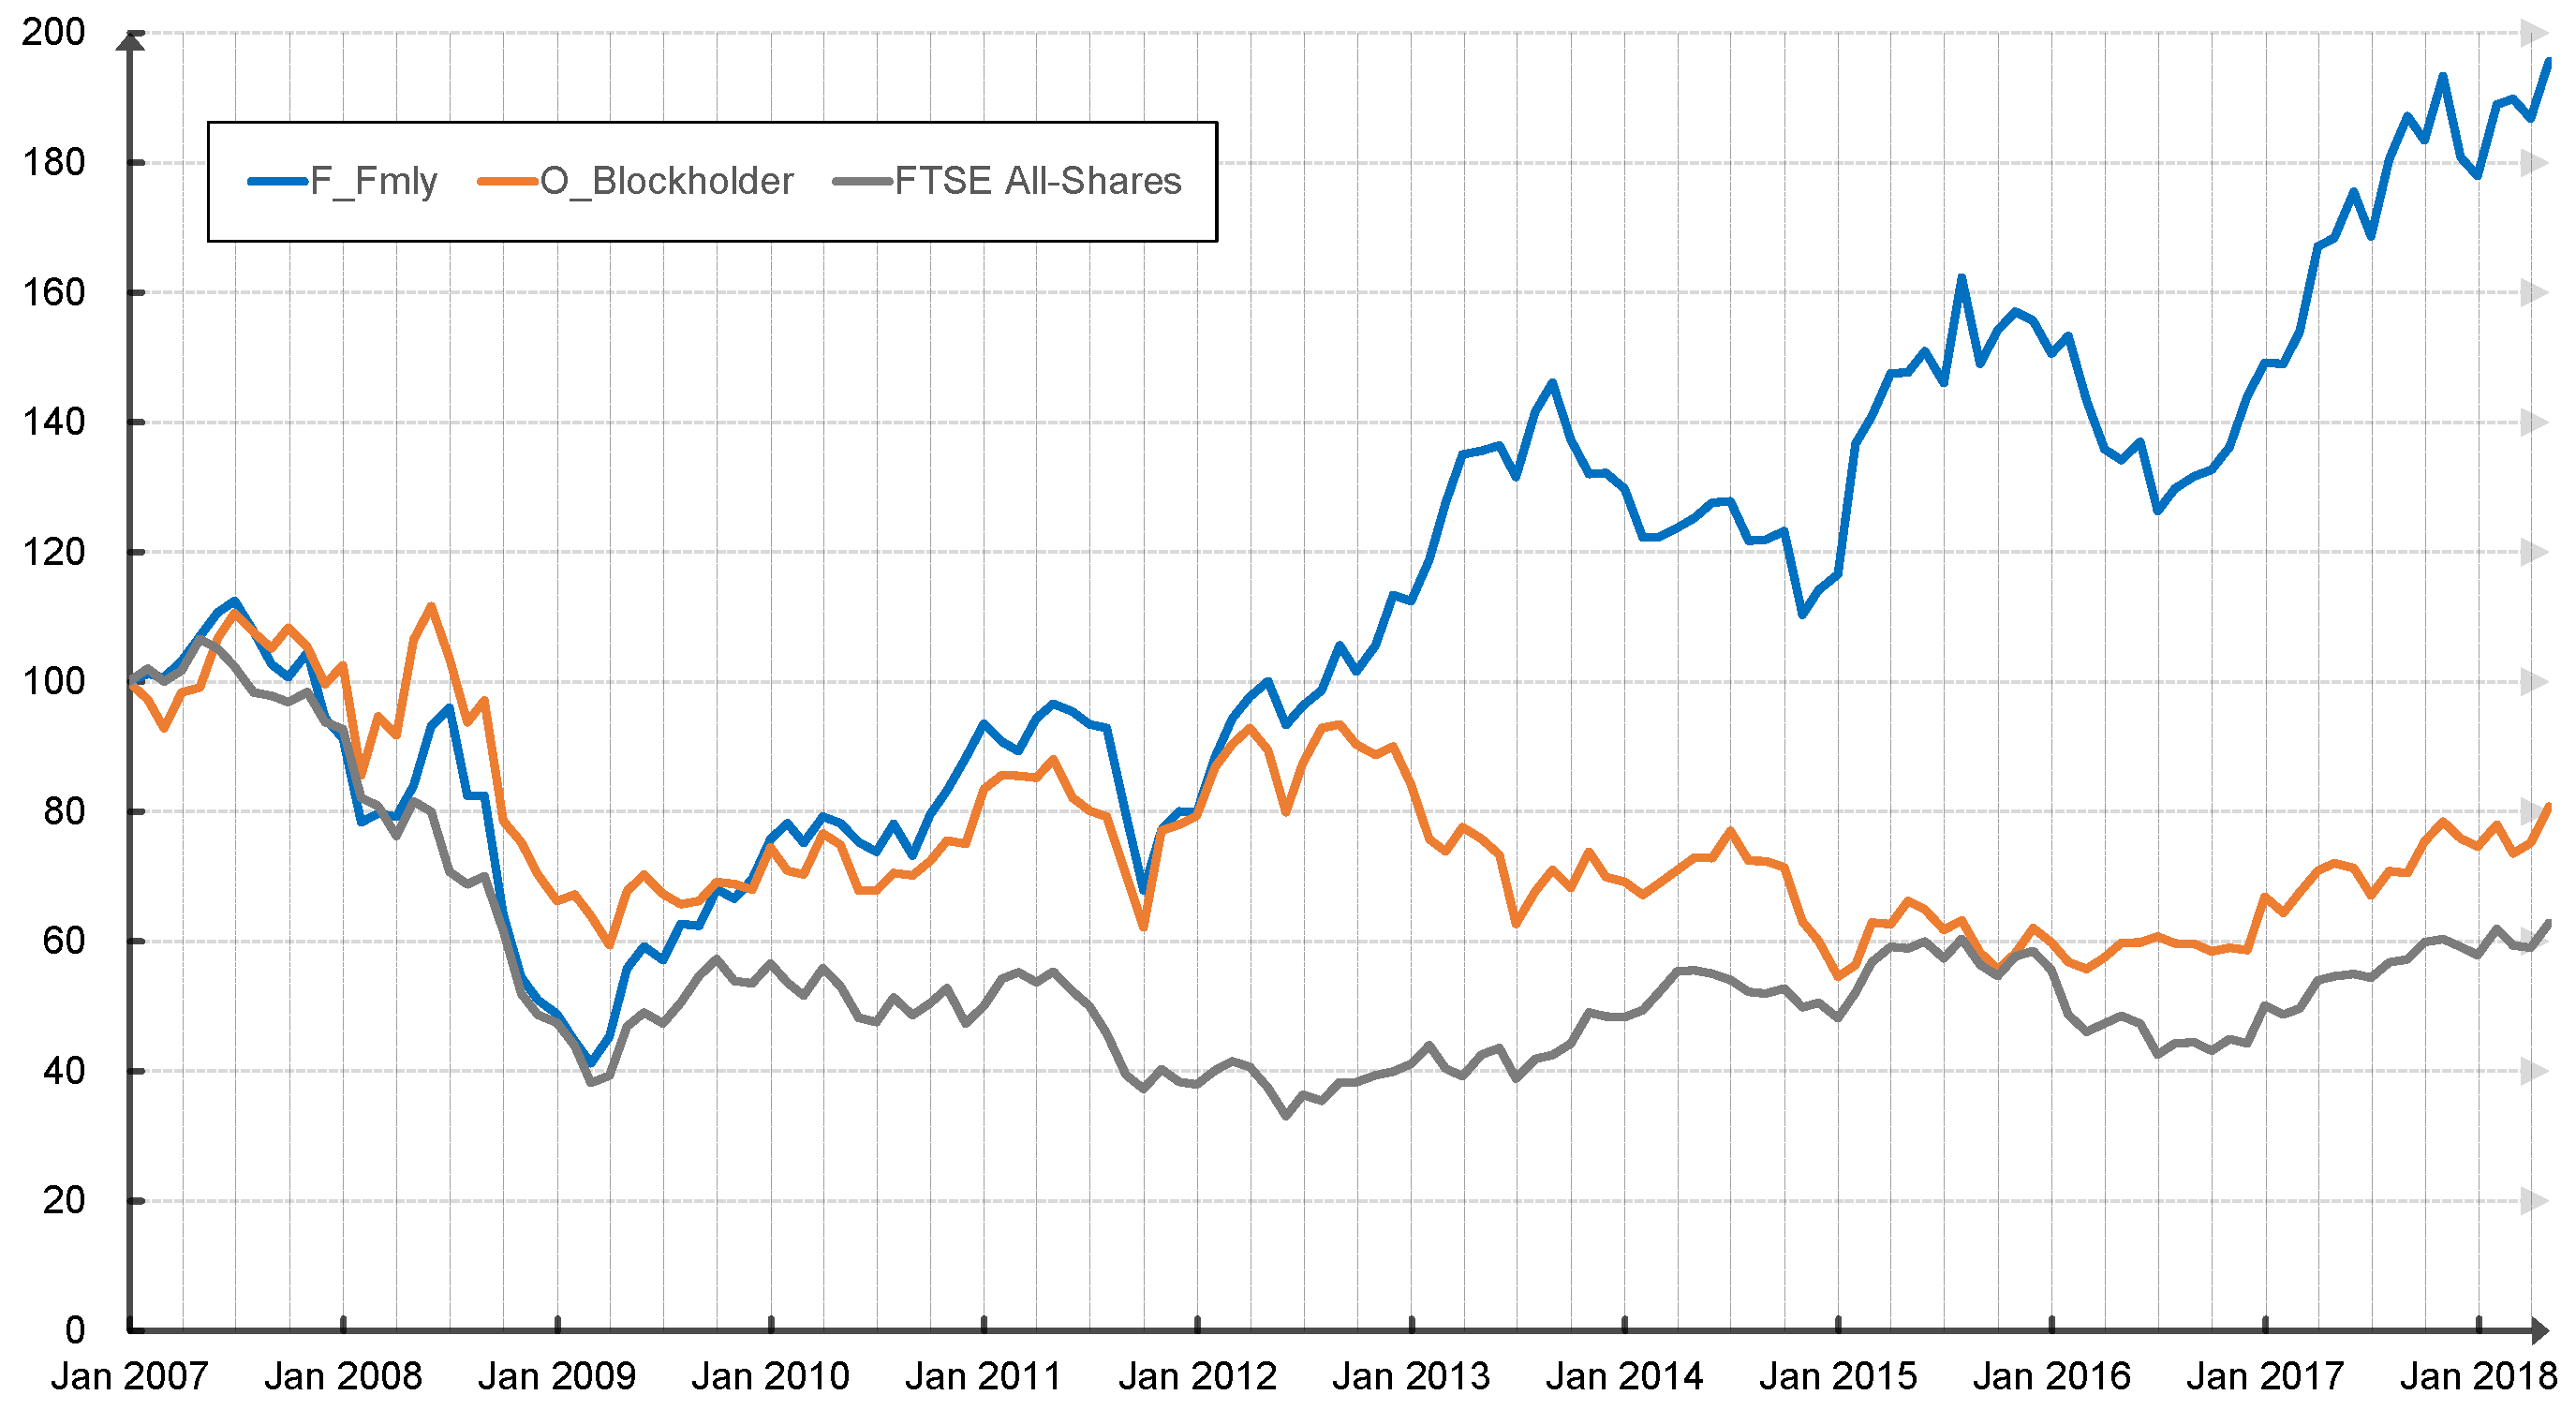
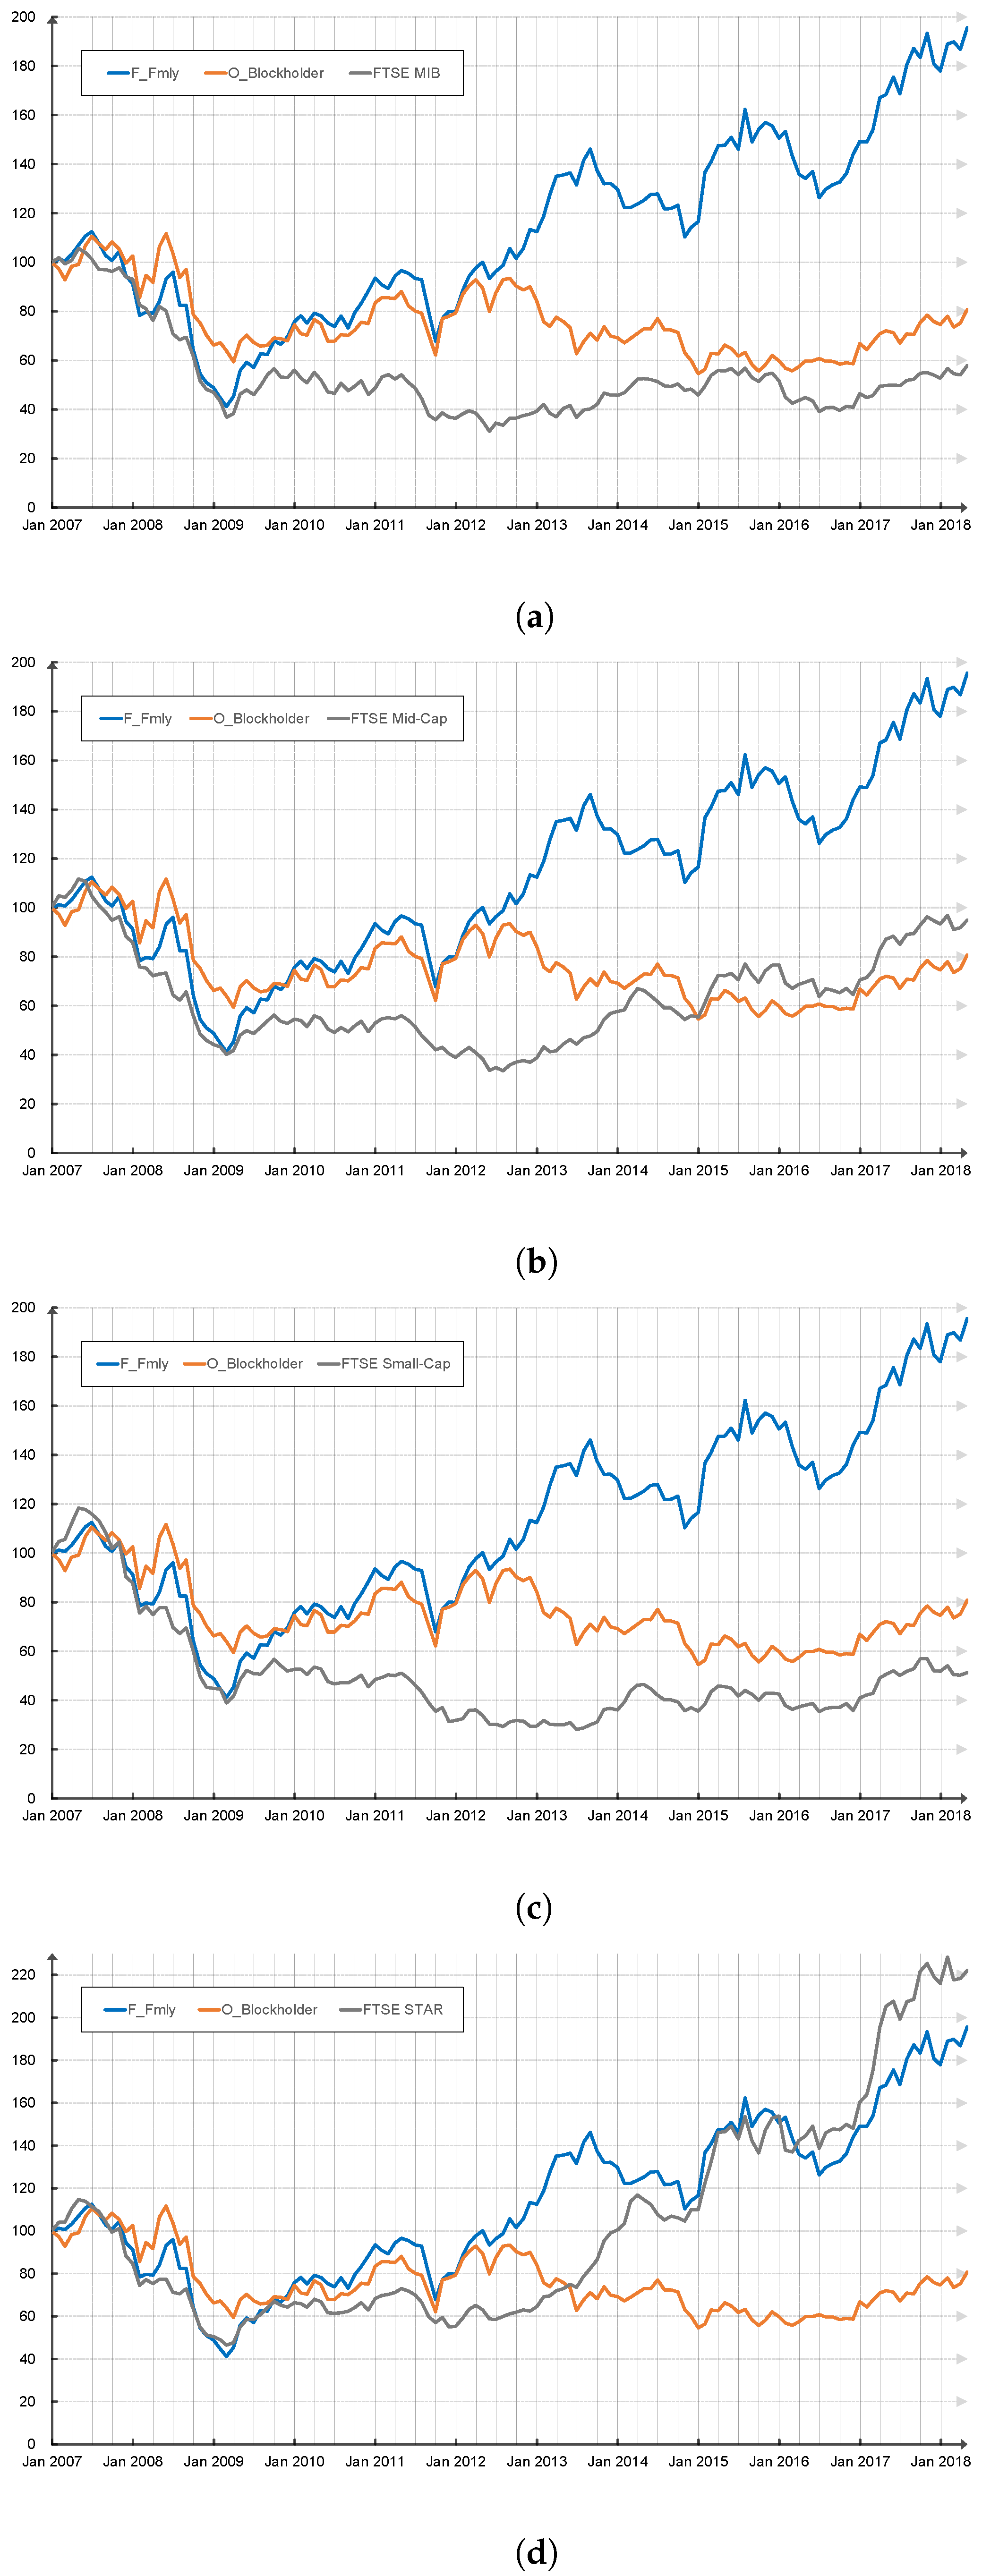
This paper proposes an empirical analysis of panel data, from January 2007 to April 2018, for a sample of 116 firms listed on the FTSE Italia All-Shares index. Although the Italian stock market is relatively small compared to its US or UK peers, Italy is still one of the most important economies in the world. In addition, Italian companies are characterized by high ownership concentration, the presence of many families, and a sound minority shareholder protection. Therefore, it may appear interesting for investigating the family property impact on stock performance.
The impact of ownership identity on stock returns is addressed through different methods. Initially, a specific definition of Founding family is formulated. Afterwards, two market-value portfolios are built, representing the investment strategies based on the ownership identity. Then, the portfolio returns are analyzed in a framework including a four-factor model of Carhart (1997) and Fama and French (1992, 1993), to control for abnormal returns, taking into account exposure to various risk factors. To provide more robust assessment, the single stock returns are also analyzed by taking into account industry and firm characteristics, by using a control model.
The main results are that (i) a portfolio strategy based on founding families greatly outperforms the benchmark index and the alternative portfolio strategy; (ii) that is not explained by exposure to risk factors; and (iii) the single stock return benefits from the Founding family property, with other things being equal. Overall, the emerging evidence is for a positive impact of Founding family ownership, which is rewarded by the stock market returns.
This research contributes to the existing literature in two ways. First, this work is, to our knowledge, the first one to analyze the impact of family ownership on the Italian stock market. Second, it is one of the few papers that evaluate the firm performance from an investor’s point of view, which is too often neglected, even though it represents the most severe evaluation for a firm.
The paper is organized as follows: Section 2.1 describes the data and variables used in the analysis, with a focus on the family factor definition. Section 2.1.4 presents some descriptive statistics and insights of the sample. Section 2.2 presents the methodology. Section 3 presents the results. Section 4 concludes.

2. Materials and Methods

2.1. Sources of Data and Information

The empirical research presented in this paper is performed on monthly data of 116 listed non-financial firms belonging to the Italian stock market. These firms are the “survivors”, i.e., the ones still listed at the end of April 2018. The 116 firms are components of FTSE-MIB, FTSE Italia Mid Cap, FTSE Italia Star, as listed on website www.borsaitaliana.it (accessed on 1 July 2018). The financial data are collected from the Bloomberg database, from January 2007 to April 2018. The data on shareholding structures of each firm were obtained by the Orbis database, while the data on board composition of each firm are obtained by CONSOB, the Italian financial supervisory authority (www.consob.it, accessed on 1 September 2018). Information about family history, kinships, and affinities with founders was provided by companies and other authoritative sources.

2.1.1. The Reference Stock Market

The Italian stock market is relatively small compared to the Italian GDP (34% of it), and, above all, it has few stocks (228 companies at the end of 2017). In addition, the stock market capitalization is concentrated. In detail, the stock market exchange is basically composed of three stock segments/indexes ordered by market capitalization: FTSE-MIB (Large Cap) (40 stocks), FTSE Italia Mid Cap (60 stocks), FTSE Italia Small Cap (128 stocks). All three indexes represent the FTSE Italia All-Share (228 stocks on 29 December 2017). More than 75% of market capitalization is collected in the FTSE-MIB, whereas the FTSE Italia Mid Cap and the FTSE Italia Small Cap collect 18% and 3%, respectively. The FTSE-MIB, combined with the FTSE Italia Mid Cap, includes almost the entire market capitalization. In addition, these two segments are the most liquid. On the contrary, the FTSE Small Cap Italia is characterized by low liquidity, making its stocks less appealing for investors. However, to mitigate the small number of small-cap firms in the sample, and to improve the significance of econometric analysis, some of them, the ones listed in the FTSE Italia Star index, are included. This last index collects mid and small-cap firms meeting strict requirements on corporate governance, transparency on financial statements, and liquidity on the stock market.

2.1.2. Definition of Family Firm

In the literature, the definition of the family firm is broad (Poutziouris et al. 2015), a consensus definition is hard to establish. A first element commonly used to identify family-controlled firms is the shareholding held by a family, often the largest shareholder as additional requirement (Barontini and Caprio 2006). However, the threshold of shareholding varies among authors. A further distinction in shareholding held by a family arise from voting rights that it confers. In this case, the shareholding threshold is tied to conferred control, rather than fractional ownership. Other authors reinforce the definition, requiring at least a family member in an executive role (sometimes this is the only criterion) (Villalonga and Amit 2006).
The following definition of family firms also aims to pay particular attention to the stewardship attitude.
Definition 1.
A Founding family firm is a firm whose life is tied to the family which created or developed it, and maintains a stable property and control of it, with a minimum threshold of 20% of shareholdings.
Definition 1 includes a threshold of shareholding held by a family which must, in turn, control the firm. The fractional ownership held by a family is supposed to be proportional to the control. The control rights could be even stronger than cash flow rights, thanks to control-enhancing devices, such as the attribution of major voting right to ordinary shares held for a long time span, or the issuance of special class shares whose voting rights are lesser than cash-flow rights, mainly held by minority shareholders. Moreover, this control must be stable in time, in the sense that the shareholding threshold must not drop below 20% in the reference period.
The distinctive element, supposed to better identify family firms with a strong stewardship attitude, is the connection between family and firm: a firm needs to be founded by a family or, at least, its acquisition must be tied to its history. The key element that may lead owners and managers to put the collective interest before the individual interest is the existence of a financial and, above all, emotional link between them and the firm. Not only their wealth, but also their name, public reputation, and honor must be tied to the firm life. In some cases, even though the firm is not held by the founder, the owner engagement in the expansion and development of the business is regardless evaluated in conjunction with family history, allowing to classify a firm as Founding family. (Fortunately, the identified Founding family whose family’s contribution is only a significant development are few special cases. One case is associated with the privatization of government-held firms in the highways sector in the late 1990s (Atlantia, held in the reference period by the Benetton family). The other two cases are Massimo Zanetti Beverage and Ferrari. The founder of the Massimo Zanetti Beverage firm started its business with the acquisition of a coffee factory in the 1970s and its name has been always combined and linked to the name of that factory (Segafredo). Whereas, Ferrari, the luxury and sportive automotive constructor, was acquired by the Agnelli family in the 1970s and the later engaging history of Ferrari can no longer be separated from that of the Agnelli family).

2.1.3. The Sample

The reference market provides a sample of 116 firms at the end of 2017. According to Definition 1, 59 of them are Founding family firms, and the remaining 57 are Other blockholder firms (whose major shareholder is an entity different from a Founding family). The collection of financial data starts from January 2007 and includes encountered initial public offerings. In Table 1, the composition over time of the two groups and the related IPOs are presented.
The Founding family group is mainly composed of firms operating in the Industrial, Consumer goods, and Services sectors. In the Other blockholder group, Industrial is the main sector, the firms are more homogeneously distributed across other sectors. Notice that Founding family firms are nonexistent or marginal in the Technology, Telecommunications, and Utilities sectors (see Table 2). Table 3 reports the distribution of the firms in the segments of the Italian stock market: it appears quite equal between the two groups.
In Table 4, some statistics about sales, net income, and the market cap of the firms are reported, for the years 2007 and 2017. Note that the most interesting fact is the increasing weight of the Founding family group for the three balance-sheet items. The Other blockholder group maintains stable weights, except for sales, whose weight noticeably decreases.
Table 5 shows a first evidence of the outperformance of Founding family firms. In fact, on average, the monthly stock return of Founding family firms is remarkably superior to the counterpart (3.70% vs. 0.36%). Other significant differences emerge in market valuations (Tobin’s Q and Book-to-Market) and profitability (Return on Asset and Return on Equity) in favor to Founding family firms. In addition, the Founding family firms seem to be more conservative than counterparts in the financial structure through an smaller use of debt (as found in France by Sraer and Thesmar 2007). Comparing the total asset values, it is clear that Founding family firms are on average far smaller than Other blockholders ones. No significant difference was noted in volatility, dividend yield, and liquidity of stocks, this last measured by Amihud’s Illiquidity ratio (see Amihud 2002).

2.1.4. Descriptive Statistics: Similarities and Differences in the Founding Family Group

As Table 6 shows, the shareholding held by the Founding family firms appears not only stable, but, as expected (see Barontini and Caprio 2006; Faccio and Lang 2002), it is higher than the defined lower bound (20%). The annual mean of shareholding has a range of 4% and its maximum relative standard deviation is 13%. It is interesting to consider the distribution of the Founding family firms’ age (see Table 7). Most family firms have a long history (70% of them are at least 40 years old). The age, combined with the adopted definition of Founding family, dispels a potential endogeneity issue (Filatotchev et al. 2005), which means a reversal causal effect of the variables: the family ownership could be an effect and not a cause of the firm performance (The scholars’ rationale behind this issue is that families exploit their position of insiders to discern sustainability of firm profitability and, consequently, decide to increase or decrease their shareholding.). In this case, the endogeneity issue may be excluded, because the old age makes it unlikely. Old age would imply that the families have been able to forecast the future of their firm for a long time. Other interesting characteristics of Founding family firms emerge from an analysis of corporate boards. The Founding family ownership is strictly connected to an involvement of family members in the governance. In 58 out of 59 firms (about 98%), there is at least a family member on the board and at least 2 family members in 78% of cases. However, the executive role of the CEO is not always in the hands of a family member, but the appointment of role between a family member and a professional (under the family control regardless) is quite balanced: 47% vs. 53%.

2.2. Methodology

The first question to be considered is to what degree an investor would have obtained an “abnormal return” with respect to the market if they had invested in the Founding family portfolio or Other blockholder portfolio. For each firm group, a value-weighted portfolio is built. The abnormal return of each portfolio is measured through two models: a 4-factor model (FF4), and the CAPM. The first model partially follows the methodology of Eugster and Isakov (2019) and considers the 4-factor extension, by Carhart (1997), of the Fama–French 3-factor model (Fama and French 1992, 1993). These models allow to capture the systemic risk of the portfolios, and the non-diversifiable risk. Moreover, the FF4 also allows to measure the investment style, implicitly adopted with the qualitative stock selection. For the CAPM, the estimated model is
R t = α + β · R t M + ε t ,
where R t is the return of portfolio minus the risk-free rate r f , R t M is the Market return minus the risk-free rate r f . The parameters α and β are the coefficients to estimate. β measures the systemic risk of the considered risky asset, while α eventually detects an abnormal return. The error term ε t has zero mean, and it is uncorrelated with the Market return. The Fama–French 4-factors model has been developed by Carhart (1997) based on classic Fama–French 3 factors Fama and French (1992, 1993). The extension is given by the introduction of the fourth factor related to the momentum. The model tries to explain the risky asset return R t , not only with respect to market return, as the CAPM, but also through its exposure to risk factors that may be associated with the main active investing strategies. The multi-factor model is
R t = α + β 1 · R t M + β 2 · SMB t + β 3 · H M L t + β 4 · WML t + ε t
where R t is the return of portfolio minus the risk-free rate, R t M is the market return minus the risk-free rate (as in Equation (1)), the second factor S M B t is the return of a portfolio composed of small stocks minus the return of a portfolio composed of large stocks on the entire market, the third factor H M L t is the return of a portfolio composed of stocks with higher multiple Book Equity to Market Equity minus the return of a portfolio composed of stocks with lower multiple Book Equity to Market Equity, the fourth factor W M L t is the return of a portfolio composed of stocks with the best past performance minus the return of a portfolio composed of stocks with the worst past performance in the last 12 months.
Each factor represents an investing strategy that is funded by a short position in the alternative investing strategy. Therefore, they capture the premium risk associated with each specific strategy. Moreover, the signs of estimated factors’ coefficients can be indicative of which investment style prevails in a portfolio. The error term ε t has zero mean and it is uncorrelated with the factors, and the constant α is the abnormal return.

The Multivariate Regression

To detect a differential performance that can be caused by the ownership of a (Founding family/Other blockholder), a multivariate regression is estimated, where independent variables are the firm characteristics, including ownership identity. The estimated model is
r i t = a i + b i · D i t + c i · Z i t + e t
where r i t is the total return for firm i in the month t, D i t is the dummy variable which identifies the Founding family ownership, Z i t is a vector containing a set of control variables of characteristics of firm i, in the month t, as indicated in Table A1 in Appendix A. The model constant a i , in this case, does not capture abnormal return. Among the control variables, there are dummy variables identifying industry according to the industry classification taxonomy ICB. Following Eugster and Isakov (2019), the model is estimated using two methods: (i) Pooled OLS 2-ways clustered: an Ordinary Least Squares regression run on panel data (data with cross-sectional and time-series dimensions), where the standard errors are clustered along firm and time; (ii) Fama–MacBeth regression: the procedure consists of running a cross-sectional regression for each month of the sample period and, in a second step, the final value of the parameters is determined taking the mean, and then tested for the statistical significance.

3. Results

3.1. Main Results

The two market-value-weighted portfolios, Founding family and Other blockholder, can be directly compared to the general FTSE Italia All-shares, see Figure 1. Both portfolios seem to outperform the benchmark. The Founding family portfolio value boosts starting from late 2011. From the end of 2012, the Other blockholder portfolio begins a value reduction and then stabilizes its value in April 2018. The Other blockholder portfolio and the benchmark lost around 30–40% in the considered period, whereas the Founding family portfolio almost doubled its initial value.
Table 8 presents the results of the performance attribution models. FF4 detects a statistically significant monthly abnormal return of 0.69% for the Founding family portfolio (Column A). The abnormal return for the Other blockholder portfolio (Column B) is far smaller and, above all, it is not statistically significant. The systemic risk, which is the coefficient associated with R M (the difference between FTSE Italia All-Shares’s return and risk-free rate), is greater for the Other blockholder portfolio.
Some interesting facts appear in the FF4 model. As regards the Founding family portfolio, there is a relevant negative exposure to the factors S M B (preference to invest in small firms) and H M L (preference to invest in lower P/B, i.e., price to book), and a neutral exposure to W M L (preference to invest relying onpast good performance). These negative exposures suggest that the larger firms with higher P/B multiple than the median value prevail. Although the preference to invest in firms larger than median value (in market capitalization terms) has been affected by the reference stock market (see Section 2.1.1), the preference to invest in firms with higher P/B was not affected. That could mean that the Founding family portfolio’s investment style is implicitly oriented to growth investment, while the Other blockholder is lesser (only the H M L factor is significant). It is important to keep in mind that the factors of the model are built with a one-factor screening which is a reduced way of implementing growth or value investment strategies, therefore, any conclusion is subject to this limitation. The CAPM model further confirms the presence of monthly abnormal return (0.72%) for the Founding family portfolio (Column C) and the absence of it for the Other blockholder portfolio (Column D).
In Figure 2, the overall performance (not adjusted for risk) of the portfolios in comparison to the Italian stock market indexes is reported. The Founding family portfolio outperforms the relative benchmarks, in three cases out of four (a, b, c). The only case (d) where the Founding family portfolio does not outperform is that of comparison with the FTSE Star. In this case, however, the difference is not as wide as in the other cases.

3.2. The Persistence of the Founding Family Effect in the Control Model

To provide robustness to the primary findings, a control for firm characteristics is introduced. Table 9 summarizes the results of a pooled panel regression estimated with the two methods aforementioned. The dependent variable is the monthly stock return adjusted for dividends, the independent variables are various firm characteristics. The dummy variable F_Fmly is equal to 1 when the company belongs to the Founding family group, 0 otherwise. The coefficients of F_Fmly are in both versions of the control model highly statistically significant. Notice that the explanatory power (R2) of the model estimated by the POLS2C method is quite low, while it is excellent for the Fama–MacBeth method. The impact of Founding family ownership is estimated around 0.6% to 0.8% of additional monthly stock return. The coefficient values are in line with those obtained in Section 3.1, as Table 10 shows.

3.3. Further and Secondary Analysis

Some statistics of the Founding family group, composed of 59 firms, suggest some aspects of homogeneity. The Founding family firms have a stable and high ownership share in the reference period, and it is reasonable that they did the same in the past due to fact that ownership is concatenated to the firm foundation. In fact, 70% of the Founding family group are at least 40 years old, see Table 11.
The family presence in the boards is another common characteristic among Founding family firms (98% of cases), see Section 2.1.4. Only in 47% of cases, the CEO is a family member. The presence of family members in a board has an important role of effect mediation (Maury 2006), which comes to be more important when a family member holds the position of CEO (Anderson and Reeb 2003; Koji et al. 2020; Poutziouris et al. 2015). Moreover, the balanced distribution of CEO identity allows splitting the founding-family group into two sub-groups whose dimensions are quite similar and, therefore, comparable. To control for this characteristic, the dummy variables “Fmly_CEO” and “Hired_CEO” are separately introduced in the control models. They represent the family and non-family identity of the CEO over the entire sample. Table 11 shows that a family CEO seems to produce a statistically significant larger additional monthly stock return in comparison with a hired CEO, when the estimate is run by the Fama–McBeth method (column B). In the other cases, the coefficients of dummies are not statistically significant, and the model estimated with the POLS2C method is quite disappointing in terms of R2.
To control for the firm’s age, the dummies “F_Fmly_Over50”and “F_Fmly_Under50” are separately introduced. The detected additional monthly stock return, other things being equal, see Table 12, for the Founding family firms younger than 50 years is not statistically significant and is anyway small in comparison with the one related to ownership, see regressions columns A and B. The detected additional monthly stock return for the Founding family firms older than 50 years is quite significant for the model estimated with POL2SC (regression column C) and highly significant when estimated with the Fama–MacBeth method (regression column D). To highlight, the returns are remarkable (0.58% and 1.28%), although POL2SC has a disappointing R2.

4. Discussion and Conclusions

4.1. The Founding Family Outperformance

The first and most remarkable evidence provided by this study is that a portfolio strategy based on family ownership would have produced a significant excess return. A market value-weighted portfolio composed of Founding family firms would have yielded a considerable total return in 11 years (+96%). This return is even more remarkable when compared with the opposite portfolio strategy, a market value-weighted portfolio of firms with non-family blockholders, which would have yielded a negative return (−20%). Moreover, the passive strategy based on the market portfolio would have yielded an even worse return (−42%). The abnormal return of the Founding family portfolio is highlighted by models that measure the performance in relation to the risk exposures. This last analysis attributes an abnormal monthly stock return of about 0.70% to the Founding family portfolio. Moreover, the exposure to systemic risk is lower or in line with that of the counterpart portfolio.

4.2. Growth Is the Investing Style

From the Fama–French 4-factor model (Carhart 1997), it is possible to gain some insights into the implicit investing style of the Founding family portfolio. The investing style seems to be oriented towards the growth approach, more than the Other blockholder portfolio, suggesting that Founding family firms are those better able to exhibit a superior potential growth, which in this case appears to be realized. Therefore, the investment strategy based on Founding family ownership could be defined, with the limitations of the model insights, successful and classifiable as a growth investing style. Additionally, this evidence highlights the complexity of an investment strategy where the only quantitative screening is not enough and the difficult evaluation of qualitative factors, such as Founding family ownership, could be relevant in implementing successful strategies.

4.3. Family Governance Is Beneficial

The second part of the proposed analysis relies on multivariate regressions to control whether the positive impact of the family factor persists, even taking into account all the firm characteristics that usually determine most of the firm value reflected in the stock price. The results obtained in the first part of this work are confirmed.
Further analysis, through the same control model, allowed to evaluate some characteristics of the Founding family group such as the involvement of family in the management and the age of firms.
The involvement of family ownership in the management has a positive role in producing the expected benefits, according to the literature (Anderson and Reeb 2003; Maury 2006; Poutziouris et al. 2015). In this case, the family CEO seems to produce an additional monthly stock return, whereas the hired CEO does not seem to do the same, although the results are not strong from a statistical point of view. The possible explanation is that the family CEO, for their link to the firm, has stronger motivations and ability to conduct far-sighted firm strategies that lead to a superior return in the long run (Miller 2003; Miller and Le Breton-Miller 2006). The presence of other family members in the board can be a counterbalance for the equilibrium of strategic management, because they could frankly propose their point of views and that does not necessarily lead to irremediable detrimental contrasts, at least in this case (Miller and Le Breton-Miller 2005 2006).
As regards the age, the older Founding family firms seem to have a significant additional monthly stock return in both control model versions, whereas the younger Founding family firms do not. This evidence is consistent with the literature (Koji et al. 2020; Poutziouris et al. 2015; Sraer and Thesmar 2007) where the younger Founding family firms have an inferior outperformance because they tend to invest in developing the distinctive capabilities that will be later exploited by the future generations of family (Miller 2003; Miller and Le Breton-Miller 2005), with a more professional education, maintaining and maximizing accumulated competitive advantages.

4.4. The Context and the Technical Limitations

All these conclusions are related to the Italian stock market. The legal regime plays a role, according to the literature (Isakov and Weisskopf 2014; Poutziouris et al. 2015). Scholars are in line with the hint suggesting that strong protection of minority shareholders is an important counterbalance that prompts major shareholders to act for the collective good (Daily and Dollinger 1992; Wang and Shailer 2017). Families as major shareholders are the best performer in this type of context (Anderson and Reeb 2003; Barontini and Caprio 2006; Isakov and Weisskopf 2014; Maury 2006; Poutziouris et al. 2015; Sraer and Thesmar 2007), and the present findings are further evidence. The limitations of the work are mainly related to the sample size, constrained by the Italian stock market’s characteristics, and the statistical weakness of one control model’s setting, used to investigate the features of the Founding family factor. In each case, the core result on the abnormal return of Founding family portfolio is statistically sound and the entire empirical research provides an interesting and recent picture of the Founding family firms’ performance in the Italian stock market.

4.5. Future Development

The methodological settings applied in this paper can be extended to analyze other markets. In fact, as pointed out in the introduction, founding family firms are widespread, and each country display its own framework that can impact on the effectiveness of the Founding family factor. Given the results of the present paper, together with the findings indicated in the introduction, a likely outcome could be that the Founding family factor is present in many countries. However, the effects of the factor can be weakened in wider and more liquid markets. In general a multicountry study can provide valuable insight concerning the impact of the Founding family factor, and can validate more robustly the present results.
From a practical point of view, the present findings may contribute to defining some asset management strategies that assign a larger weight on Founding family companies, when composing growth-style portfolios. Additionally, in this case, an international analysis can be beneficial to exploring cross-country diversification opportunities.
In addition to the suggestions asset managers and investors can obtain from the presented results, some policy implications may be considered. The more direct policy implication is the reinforcement of minority shareholder protection, in countries where the legal regime is substantially different from the Italian one. The Founding family factor basically represents an ownership concentration which seems to be an advantage rather than a disadvantage, if the legal regime allows minority shareholders to be protected effectively. It is not excluded that the introduction of this legal regime may encourage a stewardship attitude in the long run also in countries where the cultural approach is historically different.

Author Contributions

Conceptualization, D.M.M., and P.P.; methodology, D.M.M., P.P. and M.M.; software, P.P.; validation, D.M.M. and M.M.; formal analysis, P.P.; investigation, P.P.; resources, D.M.M., and P.P.; data curation, P.P.; writing—original draft preparation, P.P.; writing—review and editing, M.M.; visualization, P.P.; supervision, M.M. and Montagna D.M.M.; project administration, M.M. All authors have read and agreed to the published version of the manuscript.

Funding

This research received no external funding.

Institutional Review Board Statement

Not applicable.

Informed Consent Statement

Not applicable.

Data Availability Statement

Data sources: Borsa Italiana www.borsaitaliana.it (accessed on 1 July 2018), Bloomberg database, Orbis database, CONSOB www.consob.it (accessed on 1 September 2018).

Conflicts of Interest

The authors declare no conflict of interest.

Appendix A

Table A1. The list of control variables.
VariableDescription
stock returnMonthly stock return adjusted for the eventual dividend distribution
AgeThe age of a firm is computed as the current year minus the founding year
BetaMonthly average of regression coefficient CAPM on 104 weekly return
AmihudratioThe Amihud (2002) illiquidity ratio is the monthly average of a daily ratio: the daily return over the daily trading volume
VolaThe volatility based on previous 30 daily returns
LeverageLong-term debt divided by total asset
LogsizeThe natural logarithm of the firm’s market capitalization
LogbmThe natural logarithm of the firm’s book value to market capitalizaton
LogtaThe natural logarithm of the firm’s total asset
DyThe percentage of dividend per share
PriceThe closing price on the stock market at which the share is traded
OP_mOperating margin, the firm’s operating income over net sales.
previousm_retThe monthly stock return of firm in the previous month
sales_to_tot_assetThe ratio between the firm’s net sales and total asset
trailing_12m_sales_growthThe sales growth in the last 12 months
ag_1yearThe firm’s total asset growth in the last 12 months
ag_5yearsThe firm’s total asset growth in the last 60 months
sales_5yr_avg_grThe average firm’s sales growth in the last 60 months
Table A2. The list of firms in the sample.
#TypeTickerComplete Name
1Founding familyAEFAeffe SpA
2Founding familyAGLAutogrill SpA
3Founding familyAMPAmplifon SpA
4Founding familyASTAstaldi SpA
5Founding familyATAutostrada Torino-Milano SpA
6Founding familyATLAtlantia SpA
7Founding familyBCBrunello Cucinelli SpA
8Founding familyBECB& C Speakers SpA
9Founding familyBREBrembo SpA
10Founding familyBSSBiesse SpA
11Founding familyBZUBuzzi Unicem SpA
12Founding familyCAICairo Communication SpA
13Founding familyCEMCementir Holding SpA
14Founding familyCIRCIR-Compagnie Industriali Riunite S.p.A.
15Founding familyCMBCembre SpA
16Founding familyCNHICNH Industrial NV
17Founding familyCPRDavide Campari-Milano SpA
18Founding familyDALDatalogic SpA
19Founding familyDANDanieli & C Officine Meccaniche SpA
20Founding familyDIBDigital Bros SpA
21Founding familyDISd’Amico International Shipping SA
22Founding familyDLGDe’Longhi SpA
23Founding familyELCElica SpA
24Founding familyERGERG SpA
25Founding familyFCAFiat Chrysler Automobiles NV
26Founding familyFDAFidia SpA
27Founding familyFILAFila SpA
28Founding familyFKRFalck Renewables SpA
29Founding familyGEGefran SpA
30Founding familyGEOGeox SpA
31Founding familyGGTVGiglio Group SpA
32Founding familyGIMAGima TT SpA
33Founding familyIMAIndustria Macchine Automatiche SpA
34Founding familyITMItalmobiliare SpA
35Founding familyJUVEJuventus Football Club SpA
36Founding familyLDLa Doria SpA
37Founding familyLRLandi Renzo SpA
38Founding familyLUXLuxottica Group SpA
39Founding familyMARRMARR SpA
40Founding familyMSMediaset SpA
41Founding familyMTVMondo TV SpA
42Founding familyMZBMassimo Zanetti Beverage Group SpA
43Founding familyNICENice SpA
44Founding familyPANPanariagroup Industrie Ceramiche SpA
45Founding familyPSFPoligrafica San Faustino SpA
46Founding familyRACEFerrari NV
47Founding familyRECRecordati SpA
48Founding familyREYReply SpA
49Founding familySABSabaf SpA
50Founding familySALSalini Impregilo SpA
51Founding familySESSesa SpA
52Founding familySFERSalvatore Ferragamo SpA
53Founding familySOLSOL SpA
54Founding familySRSSaras SpA
55Founding familyTENTenaris SA
56Founding familyTESTesmec SpA
57Founding familyTGYMTechnogym SpA
58Founding familyTODTod’s SpA
59Founding familyZVZignago Vetro SpA
60Other blockholderA2AA2A SpA
61Other blockholderACEACEA SpA
62Other blockholderACOAcotel Group SpA
63Other blockholderADBAeroporto Guglielmo Marconi Di Bologna SpA
64Other blockholderASCAscopiave SpA
65Other blockholderAVIOAvio SpA
66Other blockholderBBBB Biotech AG
67Other blockholderBETBE
68Other blockholderCADCAD IT SpA
69Other blockholderCERVCerved Group SpA
70Other blockholderClICentrale del Latte di Torino & C SpA
71Other blockholderDIADiaSorin SpA
72Other blockholderEITDigital Multimedia Technologies SpA
73Other blockholderELNEl.En. SpA
74Other blockholderEMEmak SpA
75Other blockholderENAVEnav SpA
76Other blockholderENELEnel SpA
77Other blockholderENIENI SpA
78Other blockholderETHEurotech SpA
79Other blockholderFCTFincantieri SpA
80Other blockholderFMFiera Milano SpA
81Other blockholderGAMEGamenet Group SpA
82Other blockholderHERHera SpA
83Other blockholderIGItalgas SpA
84Other blockholderINWInfrastrutture Wireless Italiane SpA
85Other blockholderIPInterpump Group SpA
86Other blockholderIRCIrce SpA
87Other blockholderIREIren SpA
88Other blockholderITWIT Way SpA
89Other blockholderLDOLeonardo SpA
90Other blockholderLITRetelit SpA
91Other blockholderMNArnoldo Mondadori Editore SpA
92Other blockholderMONCMoncler SpA
93Other blockholderMTMaire Tecnimont SpA
94Other blockholderOJMOpenjobmetis Spa agenzia per il lavoro
95Other blockholderOVSOVS SpA
96Other blockholderPIAPiaggio & C SpA
97Other blockholderPIRCPirelli & C SpA
98Other blockholderPLTParmalat SpA
99Other blockholderPRIPrima Industrie SpA
100Other blockholderPRTEsprinet SpA
101Other blockholderPRYPrysmian SpA
102Other blockholderRCSRCS MediaGroup SpA
103Other blockholderRMReno de Medici SpA
104Other blockholderRWAYRAI Way SpA
105Other blockholderSISSocietà Iniziative Autostradali e Servizi SpA
106Other blockholderSOSogefi SpA
107Other blockholderSPMSaipem SpA
108Other blockholderSRGSnam Rete Gas SpA
109Other blockholderSRIServizi Italia SpA
110Other blockholderSTMSTMicroelectronics NV
111Other blockholderSTSAnsaldo STS SpA
112Other blockholderTITTelecom Italia SpA
113Other blockholderTRNTerna Rete Elettrica Nazionale SpA
114Other blockholderTXTTXT e-solutions SpA
115Other blockholderUNIRUnieuro SpA
116Other blockholderXPRExprivia SpA

References

  1. Amihud, Yakov. 2002. Illiquidity and stock returns: Cross-section and time-series effects. Journal of Financial Markets 5: 31–56. [Google Scholar] [CrossRef] [Green Version]
  2. Anderson, Ronald C., and David M. Reeb. 1999. Founding-Family Ownership and Firm Performance: Evidence from the S&P 500. Journal of Finance 58: 1301–27. [Google Scholar] [CrossRef]
  3. Barontini, Roberto, and Lorenzo Caprio. 2006. The Effect of Family Control on Firm Value and Performance: Evidence from Continental Europe. European Financial Management 12: 689–723. [Google Scholar] [CrossRef]
  4. Carhart, Mark M. 1997. On persistence in mutual fund performance. Journal of Finance 52: 57–82. [Google Scholar] [CrossRef]
  5. Claessens, Stijn, Simeon Djankov, Joseph P. H. Fan, and Larry H. P. Lang. 2002. Disentangling the Incentive and Entrenchment Effects of Large Shareholdings. Journal of Finance 57: 2741–71. [Google Scholar] [CrossRef]
  6. Cronqvist, Henrik, and Mattias Nilsson. 2003. Agency Costs of Controlling Minority Shareholders. Journal of Financial and Quantitative Analysis 38: 695. [Google Scholar] [CrossRef]
  7. Daily, Catherine M., and Marc J. Dollinger. 1992. An Empirical Examination of Ownership Structure in Family and Professionally Managed Firms. Family Business Review 5: 117–36. [Google Scholar] [CrossRef]
  8. Davis, James H., F. David Schoorman, and Lex Donaldson. 1997. Toward a stewardship theory of management. Academy of Management Review 22: 20–47. [Google Scholar] [CrossRef]
  9. Donaldson, Lex, and James H. Davis. 1991. Stewardship Theory or Agency Theory: CEO Governance and Shareholder Returns. Australian Journal of Management 16: 49–64. [Google Scholar] [CrossRef] [Green Version]
  10. Eugster, Nicolas, and Dušan Isakov. 2019. Founding family ownership, stock market returns, and agency problems. Journal of Banking and Finance 107: 105600. [Google Scholar] [CrossRef] [Green Version]
  11. Faccio, Mara, and Larry H. P. Lang. 2002. The ultimate ownership of Western European corporations. Journal of Financial Economics 65: 365–95. [Google Scholar] [CrossRef]
  12. Fama, Eugene F. 1970. Efficient Capital Markets: A Review of Theory and Empirical Work. Journal of Finance 25: 383. [Google Scholar] [CrossRef]
  13. Fama, Eugene F., and Kenneth R. French. 1992. The Cross-Section of Expected Stock Returns. Journal of Finance 47: 427–65. [Google Scholar] [CrossRef]
  14. Fama, Eugene F., and Kenneth R. French. 1993. Common risk factors in the returns on stocks and bonds. Journal of Financial Economics 33: 3–56. [Google Scholar] [CrossRef]
  15. Filatotchev, Igor, Yung-Chih Lien, and Jenifer Piesse. 2005. Corporate Governance and Performance in Publicly Listed, Family-Controlled Firms: Evidence from Taiwan. Asia Pacific Journal of Management 22: 257–83. [Google Scholar] [CrossRef]
  16. Fox, Mark A., and Robert T. Hamilton. 1994. Ownership and Diversification: Agency Theory or Stewardship Theory. Journal of Management Studies 31: 69–81. [Google Scholar] [CrossRef]
  17. Gallo, Miguel A., and Alvaro Vilaseca. 1996. Finance in family business. Family Business Review 9: 387–401. [Google Scholar] [CrossRef]
  18. Hoopes, David G., and Danny Miller. 2006. Ownership preferences, competitive heterogeneity, and family-controlled businesses. Family Business Review 19: 89–101. [Google Scholar] [CrossRef]
  19. Isakov, Dušan, and Jean-Philippe Weisskopf. 2014. Are founding families special blockholders? An investigation of controlling shareholder influence on firm performance. Journal of Banking and Finance 41: 1–16. [Google Scholar] [CrossRef] [Green Version]
  20. Jensen, Michael C., and William H. Meckling. 1976. Theory of the firm: Managerial behavior, agency costs and ownership structure. Journal of Financial Economics 3: 305–60. [Google Scholar] [CrossRef]
  21. Koji, Kojima, Bishnu Kumar Adhikary, and Le Tram. 2020. Corporate governance and firm performance: A comparative analysis between listed family and non-family firms in Japan. Journal of Risk and Financial Management 13: 215. [Google Scholar] [CrossRef]
  22. La Porta, Rafael, Florencio Lopez-de-Silanes, and Andrei Shleifer. 1999. Corporate ownership around the world. Journal of Finance 54: 471–517. [Google Scholar] [CrossRef]
  23. Maury, Benjamin. 2006. Family ownership and firm performance: Empirical evidence from Western European corporations. Journal of Corporate Finance 12: 321–41. [Google Scholar] [CrossRef]
  24. Miller, Danny. 2003. An asymmetry-based view of advantage: Towards an attainable sustainability. Strategic Management Journal 24: 961–76. [Google Scholar] [CrossRef]
  25. Miller, Danny, and Isabelle Le Breton-Miller. 2005. Managing for the Long Run: Lessons in Competitive Advantage from Great Family Businesses. Boston: Harvard Business School Press. [Google Scholar]
  26. Miller, Danny, and Isabelle Le Breton-Miller. 2006. Family governance and firm performance: Agency, stewardship, and capabilities. Family Business Review 19: 73–87. [Google Scholar] [CrossRef]
  27. Miller, Danny, Isabelle Le Breton-Miller, Richard H. Lester, and Albert A. Cannella. 2007. Are family firms really superior performers? Journal of Corporate Finance 13: 829–58. [Google Scholar] [CrossRef]
  28. Morck, Randall, and Bernard Yeung. 2003. Agency Problems in Large Family Business Groups. Entrepreneurship Theory and Practice 27: 367–82. [Google Scholar] [CrossRef]
  29. Nahapiet, Janine, and Sumantra Ghoshal. 1998. Social Capital, Intellectual Capital, and the Organizational Advantage. Academy of Management Review 23: 242. [Google Scholar] [CrossRef]
  30. Poutziouris, Panikkos, Christos S. Savva, and Elias Hadjielias. 2015. Family involvement and firm performance: Evidence from UK listed firms. Journal Family Business Strategies 6: 14–32. [Google Scholar] [CrossRef]
  31. Sraer, David, and David Thesmar. 2007. Performance and behavior of family firms: Evidence from the French stock market. Journal of the European Economic Association 5: 709–51. [Google Scholar] [CrossRef] [Green Version]
  32. Villalonga, Belen, and Raphael Amit. 2006. How do family ownership, control and management affect firm value? Journal of Financial Economics 80: 385–417. [Google Scholar] [CrossRef] [Green Version]
  33. Villalonga, Belen, and Raphael Amit. 2020. Family ownership. Oxford Review of Economic Policy 36: 241–57. [Google Scholar] [CrossRef]
  34. Wang, Kun Tracy, and Greg Shailer. 2017. Family ownership and financial performance relations in emerging markets. International Review of Economics & Finance 51: 82–98. [Google Scholar] [CrossRef]
Figure 1. Comparison of the portfolios with the general Italian stock market.
Jrfm 15 00231 g001
Figure 2. Comparison of portfolios with the main Italian stock market indexes.
Jrfm 15 00231 g002
Table 1. Time evolution of the two groups of firms.
At the End ofFounding FamilyOther Blockholder
#Firms#IPOs#Firms#IPOs
200746 45
2008471461
200947 471
201049247
201150147
2012511514
2013521514
2014553521
2015561531
2016593552
201759 572
Total59135712
Table 2. Industrial membership.
ICB_IndustryFounding FamilyOther Blockholder%Sample
#% Fmly#% Other
Basic Materials23%00%2%
Consumer Goods2034%814%24%
Consumer Services712%59%10%
Health Care23%24%3%
Industrial2441%1730%35%
Oil&Gas12%47%4%
Technology23%916%9%
Telecommunications00%47%3%
Utilities12%814%8%
Total59100%57100%100%
Table 3. The distribution of two groups according to FTSE index segments.
IndexFounding FamilyOther Blockholder%Sample
Ftse Mib121322%
Ftse Italia Mid-Cap272242%
Ftse Star (Small)202236%
Total5957100%
Table 4. Some statistics on main balance sheet items (in M EUR) and their weight with respect to the Italian stock market.
Group: Founding FamilyYear%Group/TotalAverageMinMax
Sales200713%16622310,166
201726%391032110,934
Net Income200712%125 21 1924
201728%183−1063978
Market Cap200714%1918192964
201730%3311824,808
Group:Other BlockholderYear%Group/TotalAverageMinMax
Sales200740%49782787,256
201730%47371772,664
Net Income200740%422 477 10,011
201738%265 58 3558
Market Cap200742%635732100,334
201738%44481052,155
Note: “Total” indicates the value obtained by aggregation of all firms composing the FTSE Italia All-Shares.
Table 5. Descriptive statistics and difference in means tests for the two groups. The t-test statistics for equality of the means are reported.
Founding FamilyOther Blockholder
MeanMeanDifferencet-TestSignificance
Stock_return (%)3.700.363.340.01***
Return on Asset0.050.020.020.00***
Tobin’s Q1.501.250.250.00***
Book-to-Market0.820.90−0.080.00***
Return on Equity0.110.060.050.00***
Volatility0.330.330.000.97
Age (years)56.248.18.060.00***
Amihud’s Illiquidity * 0.016 0.001 0.02 0.51
Dividend Yield (%)2.452.48 0.03 0.50
Leverage0.160.17 0.02 0.00***
Market Value2015.234391.89−2376.660.00***
Total Asset3597.7610,624.65−7026.890.00***
N80247752
*** p < 0.01, ** p < 0.05, * p < 0.1. Note: Balance sheet items in M EUR.
Table 6. Founding family’s shareholdings over time.
YearMeanStandard Deviation
201857%11%
201757%10%
201656%10%
201556%9%
201457%8%
201358%10%
201261%12%
201161%13%
201058%9%
200960%11%
200860%11%
Table 7. Quantiles of the firm age (years) in the Founding family group.
QuantileAge
14 years
216 years
325 years
440 years
545 years
649 years
761 years
868 years
990 years
10100 years
Average56y
Table 8. Fama–French 4-factor and CAPM models applied to the monthly returns of portfolios.
ABCD
F_Fmly-Risk FreeO_Block-Risk FreeF_Fmly-Risk FreeO_Block-Risk Free
R M 0.582 **0.877 ***0.655 ***0.694 ***
(0.234)(0.264)(0.0717)(0.0689)
SMBF−0.693 **−0.238
(0.298)(0.336)
HMLF−0.737 ***−0.495***
(0.0752)(0.0847)
WML−0.07560.0980
(0.0803)(0.0905)
Alpha0.00690 **0.001270.00722 *0.000871
(0.00335)(0.00378)(0.00432)(0.00415)
Observations136136136136
R-squared0.6680.5780.3840.431
Robust standard errors in parentheses. *** p < 0.01, ** p < 0.05, * p < 0.1. Note: Columns A and B represent FF4 regressions, while columns C and D represent CAPM regressions. RM is the difference between FTSE Italia All-Shares’s return and risk-free rate.
Table 9. Multivariate regressions (A and B) with dummy variable Founding family.
AB
F_Fmly0.00609 **0.00817 ***
(0.00257)(0.00263)
ControlsYesYes
Industry dummyYesYes
MethodPOL2SCFMB
R20.0260.526
Observations10,11910,119
Robust standard errors in parentheses. *** p < 0.01, ** p < 0.05, * p < 0.1. Note: Column A is estimated using pooled panel regression (POL2SC), where standard errors are two-dimensional clustered along firm and time dimensions. Column B is estimated using Fama–MacBeth and then the values of final parameters are determined with the mean and statistical significance of the time-series statistics of these monthly estimates. The list of control variables is presented in Table A1.
Table 10. Comparison of the abnormal returns and additional returns detected by models.
Founding family
abnormal monthly return
Fama–French 4 factors0.69%
CAPM0.72%
Founding family
additional monthly return
POLS2C method0.61%
Fama–MacBeth method0.82%
Table 11. Multivariate regressions (A, B, C, and D) with dummy variables: Family CEO and Hired CEO.
ABCD
Fmly_CEO0.003680.00868 ***
(0.00268)(0.00231)
Hired_CEO 0.002650.000248
(0.00242)(0.00292)
Observations10,11910,11910,11910,119
ControlsYesYesYesYes
Industry dummiesYesYesYesYes
MethodsPOL2SCFMBPOL2SCFMB
R20.0260.5240.0260.525
Robust standard errors in parentheses. *** p < 0.01, ** p < 0.05, * p < 0.1. Note: Columns A and C are estimated using pooled panel regression (POL2SC), where standard errors are two-dimensional clustered along firm and time dimensions. Columns B and D are estimated using Fama–MacBeth and then the values of final parameters are determined with the mean and statistical significance of the time-series statistics of these monthly estimates. The list of control variables is presented in Table A1.
Table 12. Multivariate regressions (A, B, C, and D) with dummy variables related to the firm’s age.
ABCD
F_Fmly_Under500.00247−0.00162
(0.00331)(0.00277)
F_Fmly_Over50 0.00582 **0.0128 ***
(0.00287)(0.00293)
Observations10,11910,11910,11910,119
ControlsYesYesYesYes
Industry dummiesYesYesYesYes
MethodsPOL2SCFMBPOL2SCFMB
R20.0260.5230.0260.526
Robust standard errors in parentheses. *** p < 0.01, ** p < 0.05, * p < 0.1. Note: Columns A and C are estimated using pooled panel regression (POL2SC), where standard errors are two-dimensional clustered along firm and time dimensions. Columns B and D are estimated using Fama–MacBeth and then the values of final parameters are determined with the mean and statistical significance of the time-series statistics of these monthly estimates. The list of control variables is presented in Table A1.
Publisher’s Note: MDPI stays neutral with regard to jurisdictional claims in published maps and institutional affiliations.

