
Market Misreaction? Leverage and Mergers and Acquisitions


Abstract
:1. Introduction
2. Data, Variables, and Methodology
2.1. Data
2.2. Variables
2.3. Methodology
3. Descriptive Statistics
4. Returns and Performance
β4*Bank dummy*High Capital Ratio dummy +
β5*Industry dummies+ β6*Year dummies + ε
β5*Bank dummy*High Capital Ratio dummy +
β6*Industry dummies + β7*Year dummies + ε,
Bank- and Non-Bank-Specific Post-Acquisition Performance
5. Discussion of Results and Conclusions
Author Contributions
Funding
Informed Consent Statement
Data Availability Statement
Conflicts of Interest
References
- Aboody, David, Omri Even-Tov, and Jean Zeng. 2021. What Drives Acquisition Premiums and Why Do Targets Reject Offers? Evidence from Failed Acquisition Offers. Amsterdam: SSRN. [Google Scholar]
- Aggarwal, Reena, and Pietra Rivoli. 1990. Fads in the Initial Public Offering Market? Financial Management 19: 45–57. [Google Scholar] [CrossRef]
- Ahern, Kenneth R. 2012. Bargaining power and industry dependence in mergers. Journal of Financial Economics 103: 530–50. [Google Scholar] [CrossRef]
- Andrade, Gregor, Mark Mitchell, and Erik Stafford. 2001. New Evidence and Perspectives on Mergers. Journal of Economic Perspectives 15: 103–20. [Google Scholar] [CrossRef]
- Angwin, Duncan. 2001. Acquisitions and Acquisitions across European Borders: National, Perspectives on Pre-acquisition Due Diligence and the use of professional advisers. Journal of World Business 36: 32–57. [Google Scholar] [CrossRef]
- Barber, Brad M., and John D. Lyon. 1997. Detecting Long-Run Abnormal Stock Returns: The Empirical Power and Specification of Test Statistics. Journal of Financial Economics 43: 341–72. [Google Scholar] [CrossRef] [Green Version]
- Beccalli, Elena, and Pascal Frantz. 2009. M&A Operations and Performance in Banking. Journal of Financial Services Research 36: 203–26. [Google Scholar]
- Becher, David, Tyler K. Jensen, and Tingting Liu. 2020. Acquisitions and Funding Conditions. Journal of Corporate Finance 65: 101760. [Google Scholar] [CrossRef]
- Berg, Tobias, and Jasmin Gider. 2016. What Explains the Difference in Leverage between Banks and Non-Banks? Journal of Financial and Quantitative Analysis (JFQA) 52: 2677–702. [Google Scholar] [CrossRef]
- Bhabra, Gurmett S., Harjeet S. Bhabra, and Glenn W. Boyle. 2010. Leverage, and the Wealth Gains from Acquisition Program Announcements. Corporate Ownership and Control 8: 267. [Google Scholar] [CrossRef]
- Biswas, Swarnava, Neslihan Ozkan, and Junyang Yin. 2019. Non-Bank Loans, Corporate Investment and Firm Performance. Amsterdam: SSRN. [Google Scholar]
- Brealey, Richard A., Ian A. Cooper, and Evi Kaplanis. 2005. A Test of International Equity Market Integration Using Evidence from Cross-Border Mergers. London Business School Institute of Finance Paper No. 433. London: London Business School. [Google Scholar]
- Carter, David, Frank P. D’Souza, Betty J. Simkins, and W. Gary Simpson. 2010. The Diversity of Corporate Board Committees and Firm Financial Performance. Amsterdam: SSRN. [Google Scholar]
- Chan, Wesley S. 2000. Stock Price Reaction to News and No-News: Drift and Reversal after Headlines. Journal of Financial Economics 70: 223–60. [Google Scholar] [CrossRef]
- Chaudron, Raymond, Leo de Haan, and Marco Hoeberichts. 2020. Banks’ Net Interest Margins and Interest Rate Risk: Communicating Vessels? De Nederlandsche Bank Working Paper No. 675. Amsterdam: De Nederlandsche Bank. [Google Scholar]
- Chen, Alvin. 2020. A Model of Stock Buybacks. Amsterdam: SSRN. [Google Scholar]
- Denis, David J., and Antonio J. Macias. 2011. Material Adverse Change Clauses and Acquisition Dynamics. Journal of Financial and Quantitative Analysis (JFQA) 48: 819–47. [Google Scholar] [CrossRef]
- Dinger, Valeriya, Francesco Vallascas, and Qi Zhang. 2020. SEOs by Systemically Risky Banks: Do They Produce Stabilization Effects? Amsterdam: SSRN. [Google Scholar]
- Duffie, Darrell. 2018. Prone to Fail: The Pre-Crisis Financial System. Stanford University Graduate School of Business Research Paper No. 3728. Stanford: Stanford University. [Google Scholar]
- Durbin, James, and Geoffrey S. Watson. 1951. Testing for Serial Correlation in Least Squares Regression, II. Biometrika 38: 159–79. [Google Scholar] [CrossRef] [PubMed]
- Durukan, M. Banu. 2002. The relationship between IPO returns and factors influencing IPO performance: Case of Istanbul Stock Exchange. Managerial Finance 28: 18–38. [Google Scholar] [CrossRef]
- Dutordoir, Marie, Frank Verbeeten, and Dominique De Beijer. 2012. The Market Value Impact of Brand Value Announcements. SSRN Working Paper. Amsterdam: SSRN. [Google Scholar]
- Erel, Isil. 2009. The Effect of Bank Mergers on Loan Prices: Evidence from the U.S. Fisher College of Business Working Paper No. 2006-03-002. Columbus: The Ohio State University. [Google Scholar]
- Francis, Jere R., and Xiumin Martin. 2010. Acquisition profitability and timely loss recognition. Journal of Accounting and Economics 49: 161–78. [Google Scholar] [CrossRef]
- Gatti, Matteo. 2018. Reconsidering the Merger Process: Approval Patterns, Timeline, and Shareholders’ Role. Hastings Law Journal 69: 835. [Google Scholar]
- Golubov, Andrey, and Nan Xiong. 2019. Post-Acquisition Performance of Private Acquirers. Journal of Corporate Finance 60: 101545. [Google Scholar] [CrossRef]
- Harford, Jarrad, Mark Humphery-Jenner, and Ronan Powell. 2012. The sources of value destruction in acquisition by entrenched managers. Journal of Financial Economics 106: 247–61. [Google Scholar] [CrossRef] [Green Version]
- Harrison, Jeffrey S., Matthew Hart, and Derek K. Oler. 2014. Leverage and acquisition performance. Review of Quantitative Finance and Accounting 43: 571–603. [Google Scholar] [CrossRef]
- Hofstede, Geert. 1980. Motivation, leadership, and organization: Do American theories apply abroad? Organizational Dynamics 9: 42–63. [Google Scholar] [CrossRef]
- Jankowitsch, Rainer, and Florian Pauer. 2021. The Effect of Credit, Liquidity and Rollover Risk on Bondholder Wealth in Mergers and Acquisitions. Amsterdam: SSRN. [Google Scholar]
- Kadiyala, Padmaja, and P. Raghavendra Rau. 2004. Investor Reaction to Corporate Event Announcements: Under-Reaction or Over-Reaction? Journal of Business 77: 357–86. [Google Scholar] [CrossRef]
- Kalemli-Ozcan, Sebnem, Bent Sorensen, and Sevcan Yesiltas. 2011. Leverage Across Firms, Banks, and Countries. NBER Working Paper No. w17354. Amsterdam: Elsevier. [Google Scholar]
- Kennedy, Peter. 2003. A Guide to Econometrics, 5th ed. Cambridge: The MIT Press, vol. 1. [Google Scholar]
- Krishnan, C. N. V., and Jialun Wu. 2022. Market Misreaction: Evidence from Cross-border Acquisitions. Journal of Risk and Financial Management 15: 93. [Google Scholar] [CrossRef]
- Ma, Qingzhong, David A. Whidbee, and Athena Wei Zhang. 2011. Value, Valuation, and the Long-Run Performance of Merged Firms. Journal of Corporate Finance 17: 1–17. [Google Scholar] [CrossRef]
- Malmendier, Ulrike, Enrico Moretti, and Florian S. Peters. 2012. Winning by Losing: Evidence on the Long-Run Effects of Mergers. NBER Working Paper. Cambridge: National Bureau of Economic Research. [Google Scholar]
- Masulis, Ronald W., Cong Wang, and Fei Xie. 2007. Corporate governance and acquirer returns. Journal of Finance 60: 1951–82. [Google Scholar] [CrossRef]
- McNichols, Maureen F., and Stephen R. Stubben. 2015. The effect of target-firm accounting quality on valuation in acquisitions. Review of Accounting Studies 20: 110–40. [Google Scholar] [CrossRef]
- Medovikov, Ivan. 2016. When Does the Stock Market Listen to Economic News? New Evidence from Copulas and News Wires. Journal of Banking and Finance 65: 27–40. [Google Scholar] [CrossRef] [Green Version]
- Moeller, Sara B., Frederik P. Schlingemann, and Rene M. Stulz. 2003. Do Shareholders of Acquiring Firms Gain from Acquisitions? Dice Center Working Paper No. 2003−4. Cambridge: National Bureau of Economic Research. [Google Scholar]
- Mohanram, Partha S. 2003. Separating Winners from Losers Among Low Book-to-Market Stocks Using Financial Statement Analysis. Review of Accounting Studies 10: 133–70. [Google Scholar] [CrossRef]
- Ou, Jane A., and Stephen H. Penman. 1989. Financial Statement Analysis and the Prediction of Stock Returns. Journal of Accounting and Economics 11: 295–329. [Google Scholar] [CrossRef]
- Qian, Jun, and Julie Lei Zhu. 2014. Return to Invested Capital and the Performance of Mergers and Acquisitions. Management Science 64: 4818–34. [Google Scholar] [CrossRef] [Green Version]
- Servaes, Henri, and Marc Zenner. 1996. The Role of Investment Banks in Acquisitions. The Review of Financial Studies 9: 787–815. [Google Scholar] [CrossRef]
- Shroff, Nemit, Amy X. Sun, Hal D. White, and Weining Zhang. 2013. Voluntary Disclosure and Information Asymmetry: Evidence from the 2005 Securities Offering Reform. MIT Sloan Research Paper No. 4980-12. Cambridge: The MIT Press, vol. 51. [Google Scholar]
- Uygur, Ozge, Gulser Meric, and Ilhan Meric. 2014. The Financial Characteristics of U.S. Companies Acquired by Foreign Companies. Global Journal of Business Research 7: 1–8. [Google Scholar]
- Vij, Siddharth. 2019. Acquiring Failed Banks. University of Georgia Working Paper. Athens: University of Georgia. [Google Scholar]
- Walkling, Ralph A., and Robert O. Edmister. 1985. Determinants of Tender Offer Premiums. Financial Analysts Journal 41: 27–37. [Google Scholar] [CrossRef]
- White, Halbert. 1980. A Heteroskedasticity-Consistent Covariance Matrix Estimator and a Direct Test for Heteroskedasticity. Econometrica 48: 817–38. [Google Scholar] [CrossRef]


| Panel A: Characteristics | ||||||
| Year | N | Average Capital Ratio | Average Transaction Value | Average Premium 1week | Average Time to Completion (Days) | |
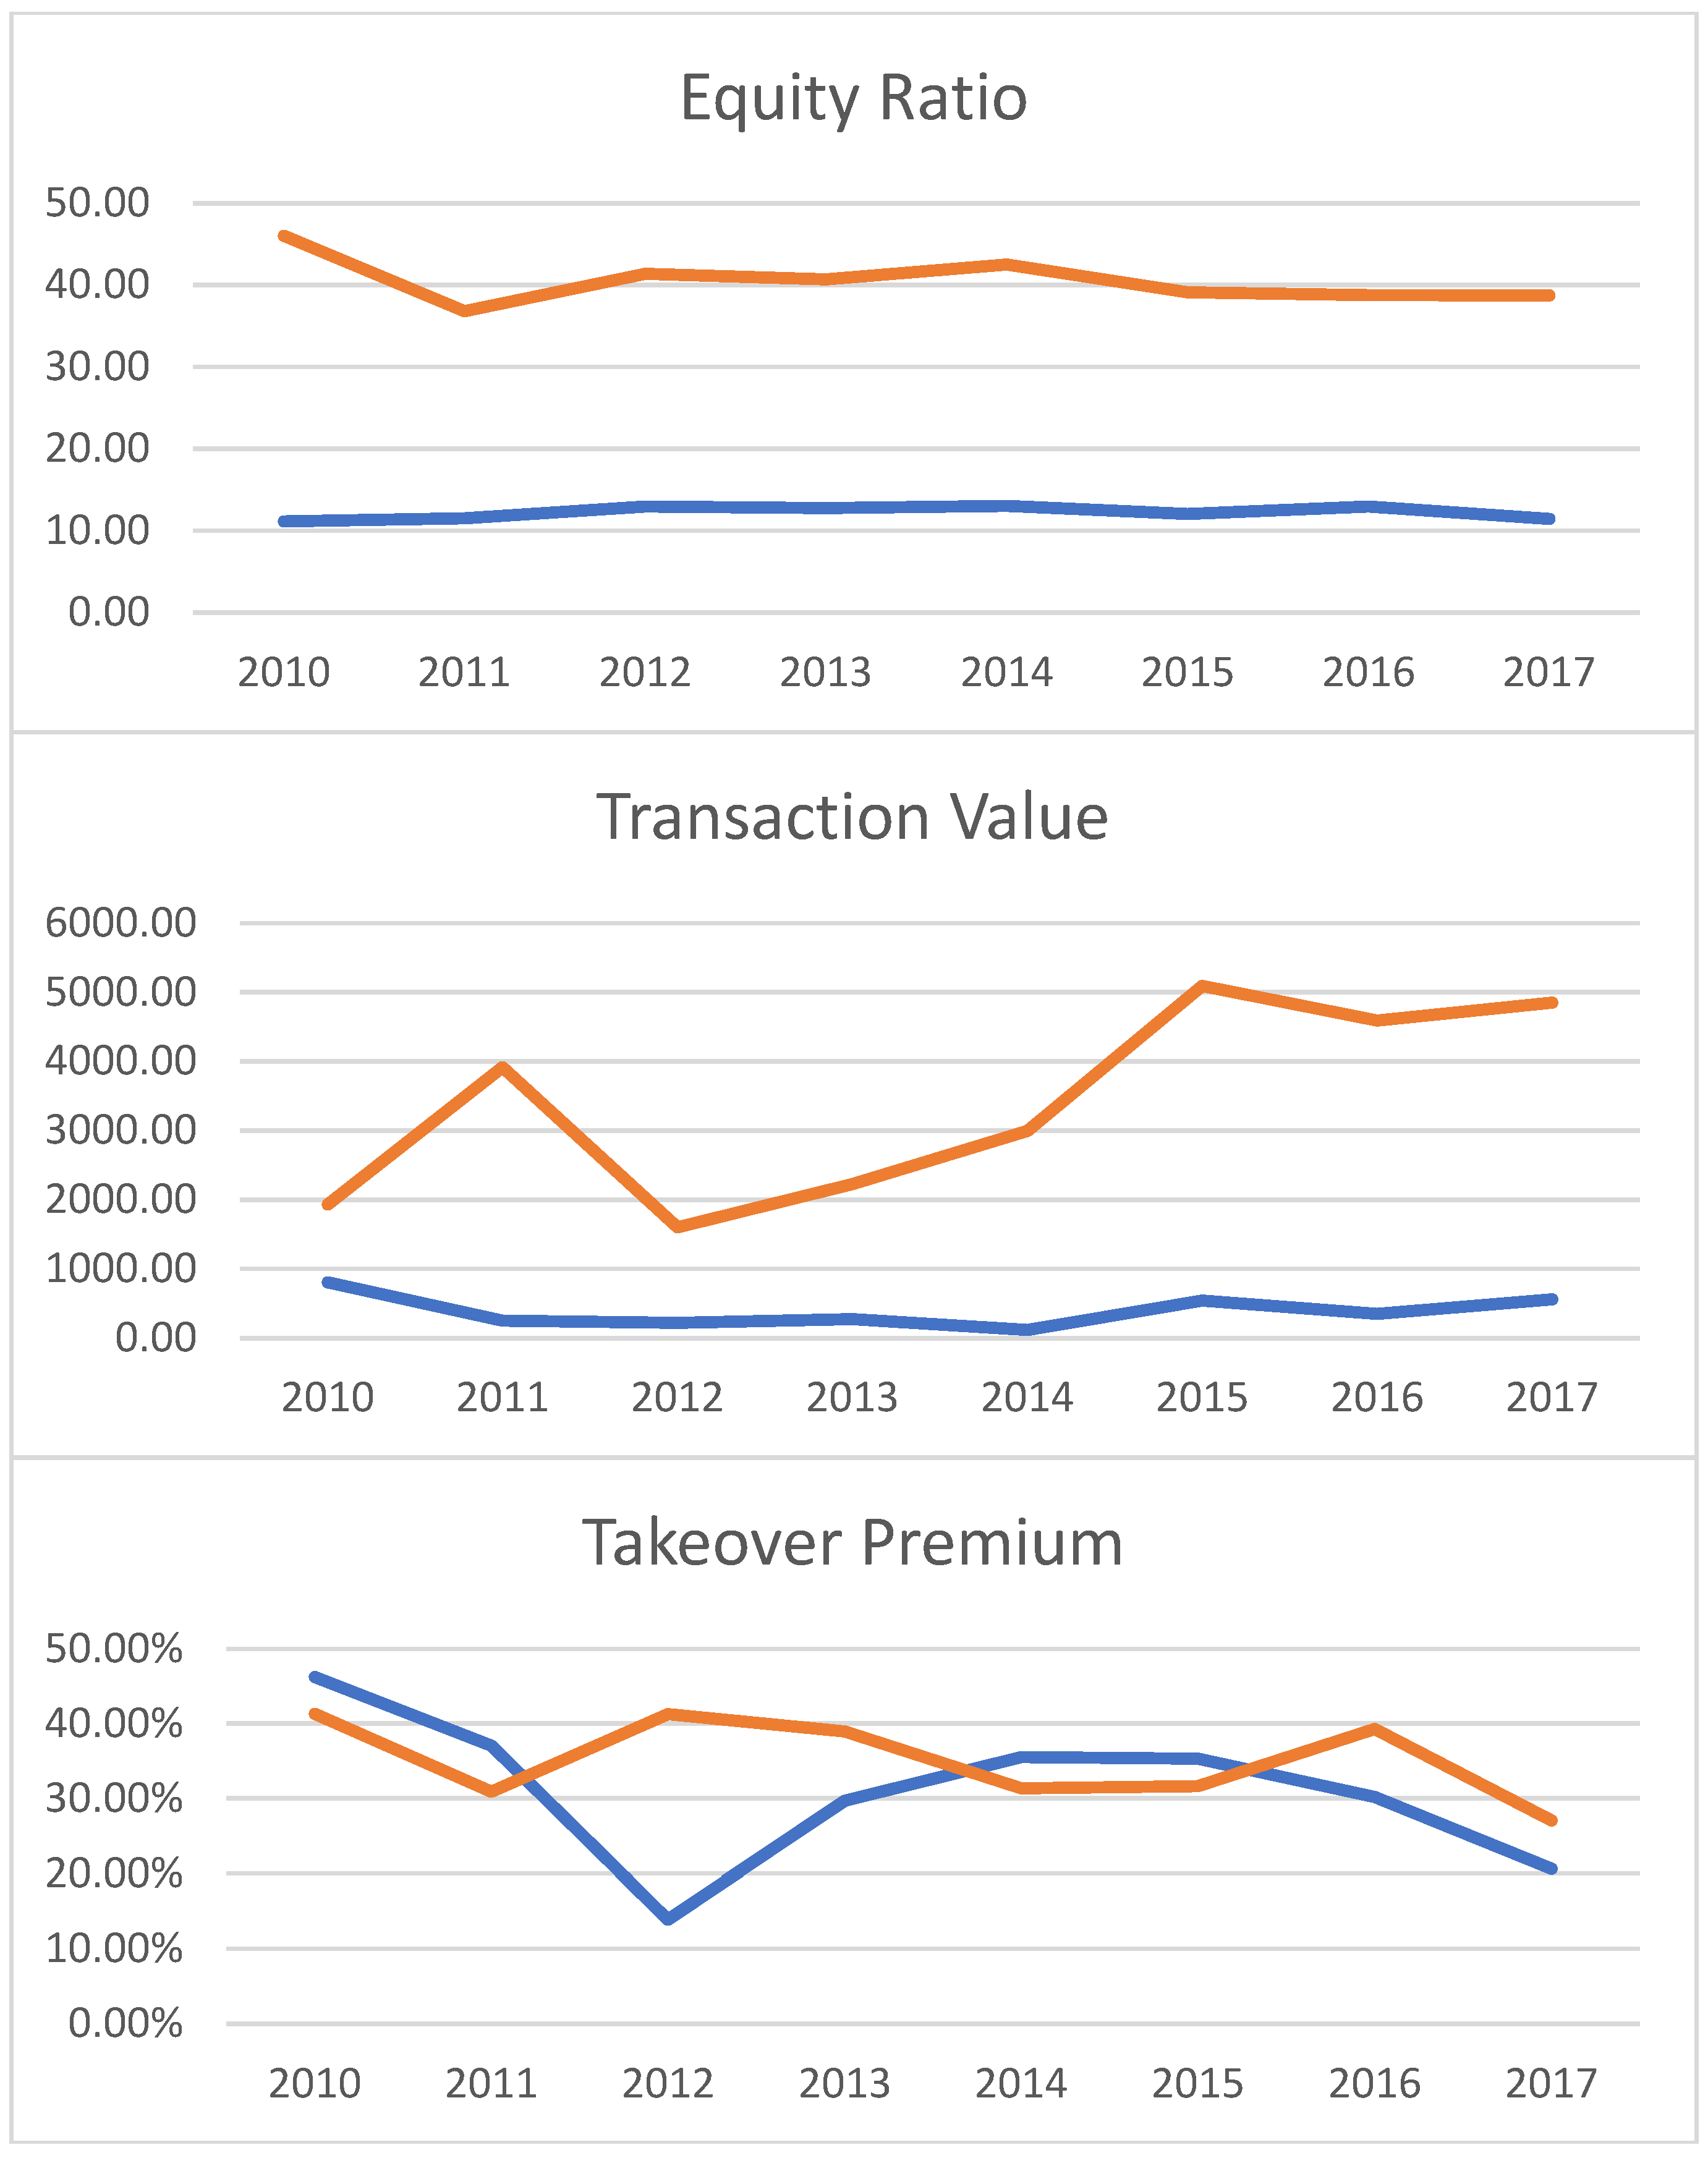
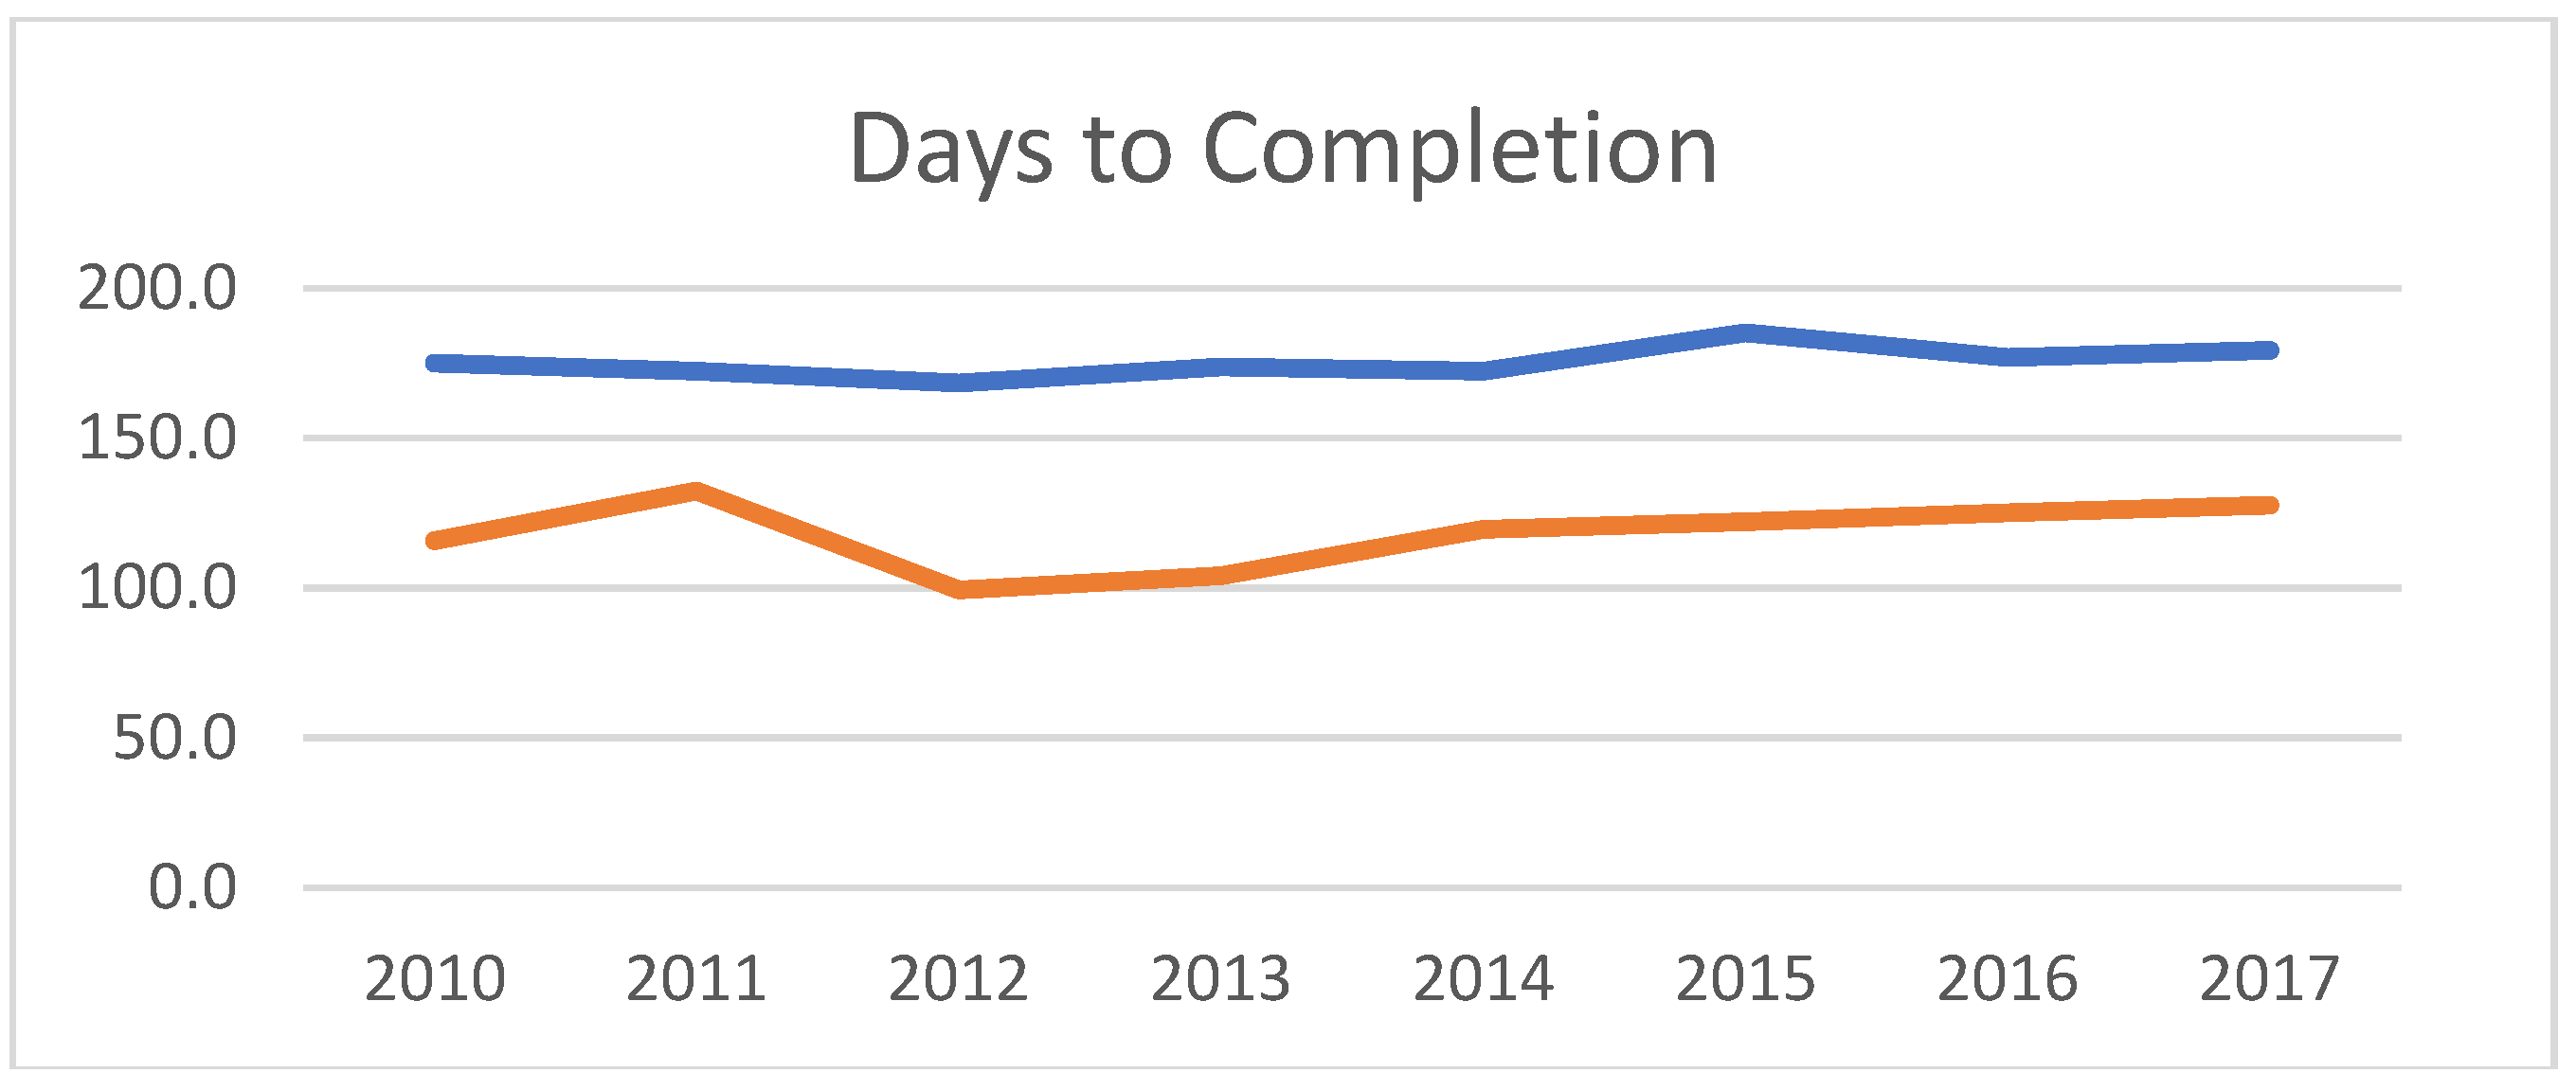
| 2010 | 8 | 11.15 | 807.28 | 46.20% | 175.0 | |
| 2011 | 3 | 11.52 | 253.49 | 37.04% | 172.3 | |
| 2012 | 10 | 12.93 | 219.05 | 13.88% | 168.4 | |
| 2013 | 21 | 12.77 | 274.72 | 29.67% | 173.8 | |
| 2014 | 31 | 13.04 | 121.58 | 35.51% | 172.3 | |
| 2015 | 24 | 12.05 | 542.10 | 35.31% | 185.2 | |
| 2016 | 26 | 12.92 | 351.82 | 30.19% | 176.9 | |
| 2017 | 24 | 11.44 | 560.14 | 20.60% | 179.3 | |
| Overall | 147 | 12.42 | 371.08 | 30.61% | 176.4 | |
| Median | 12.02 | 102.51 | 29.66% | 164.0 | ||
| Standard Deviation | 2.38 | 784.07 | 35.69% | 58.1 | ||
| Skewness | 0.80 | 4.04 | −1.36 | 0.8 | ||
| Panel B: Announcement Period Abnormal Returns | ||||||
| Year | Average CAR_VW3 | Average CAR_EW3 | Average CAR_SP3 | Average CAR_VW7 | Average CAR_EW7 | Average CAR_SP7 |
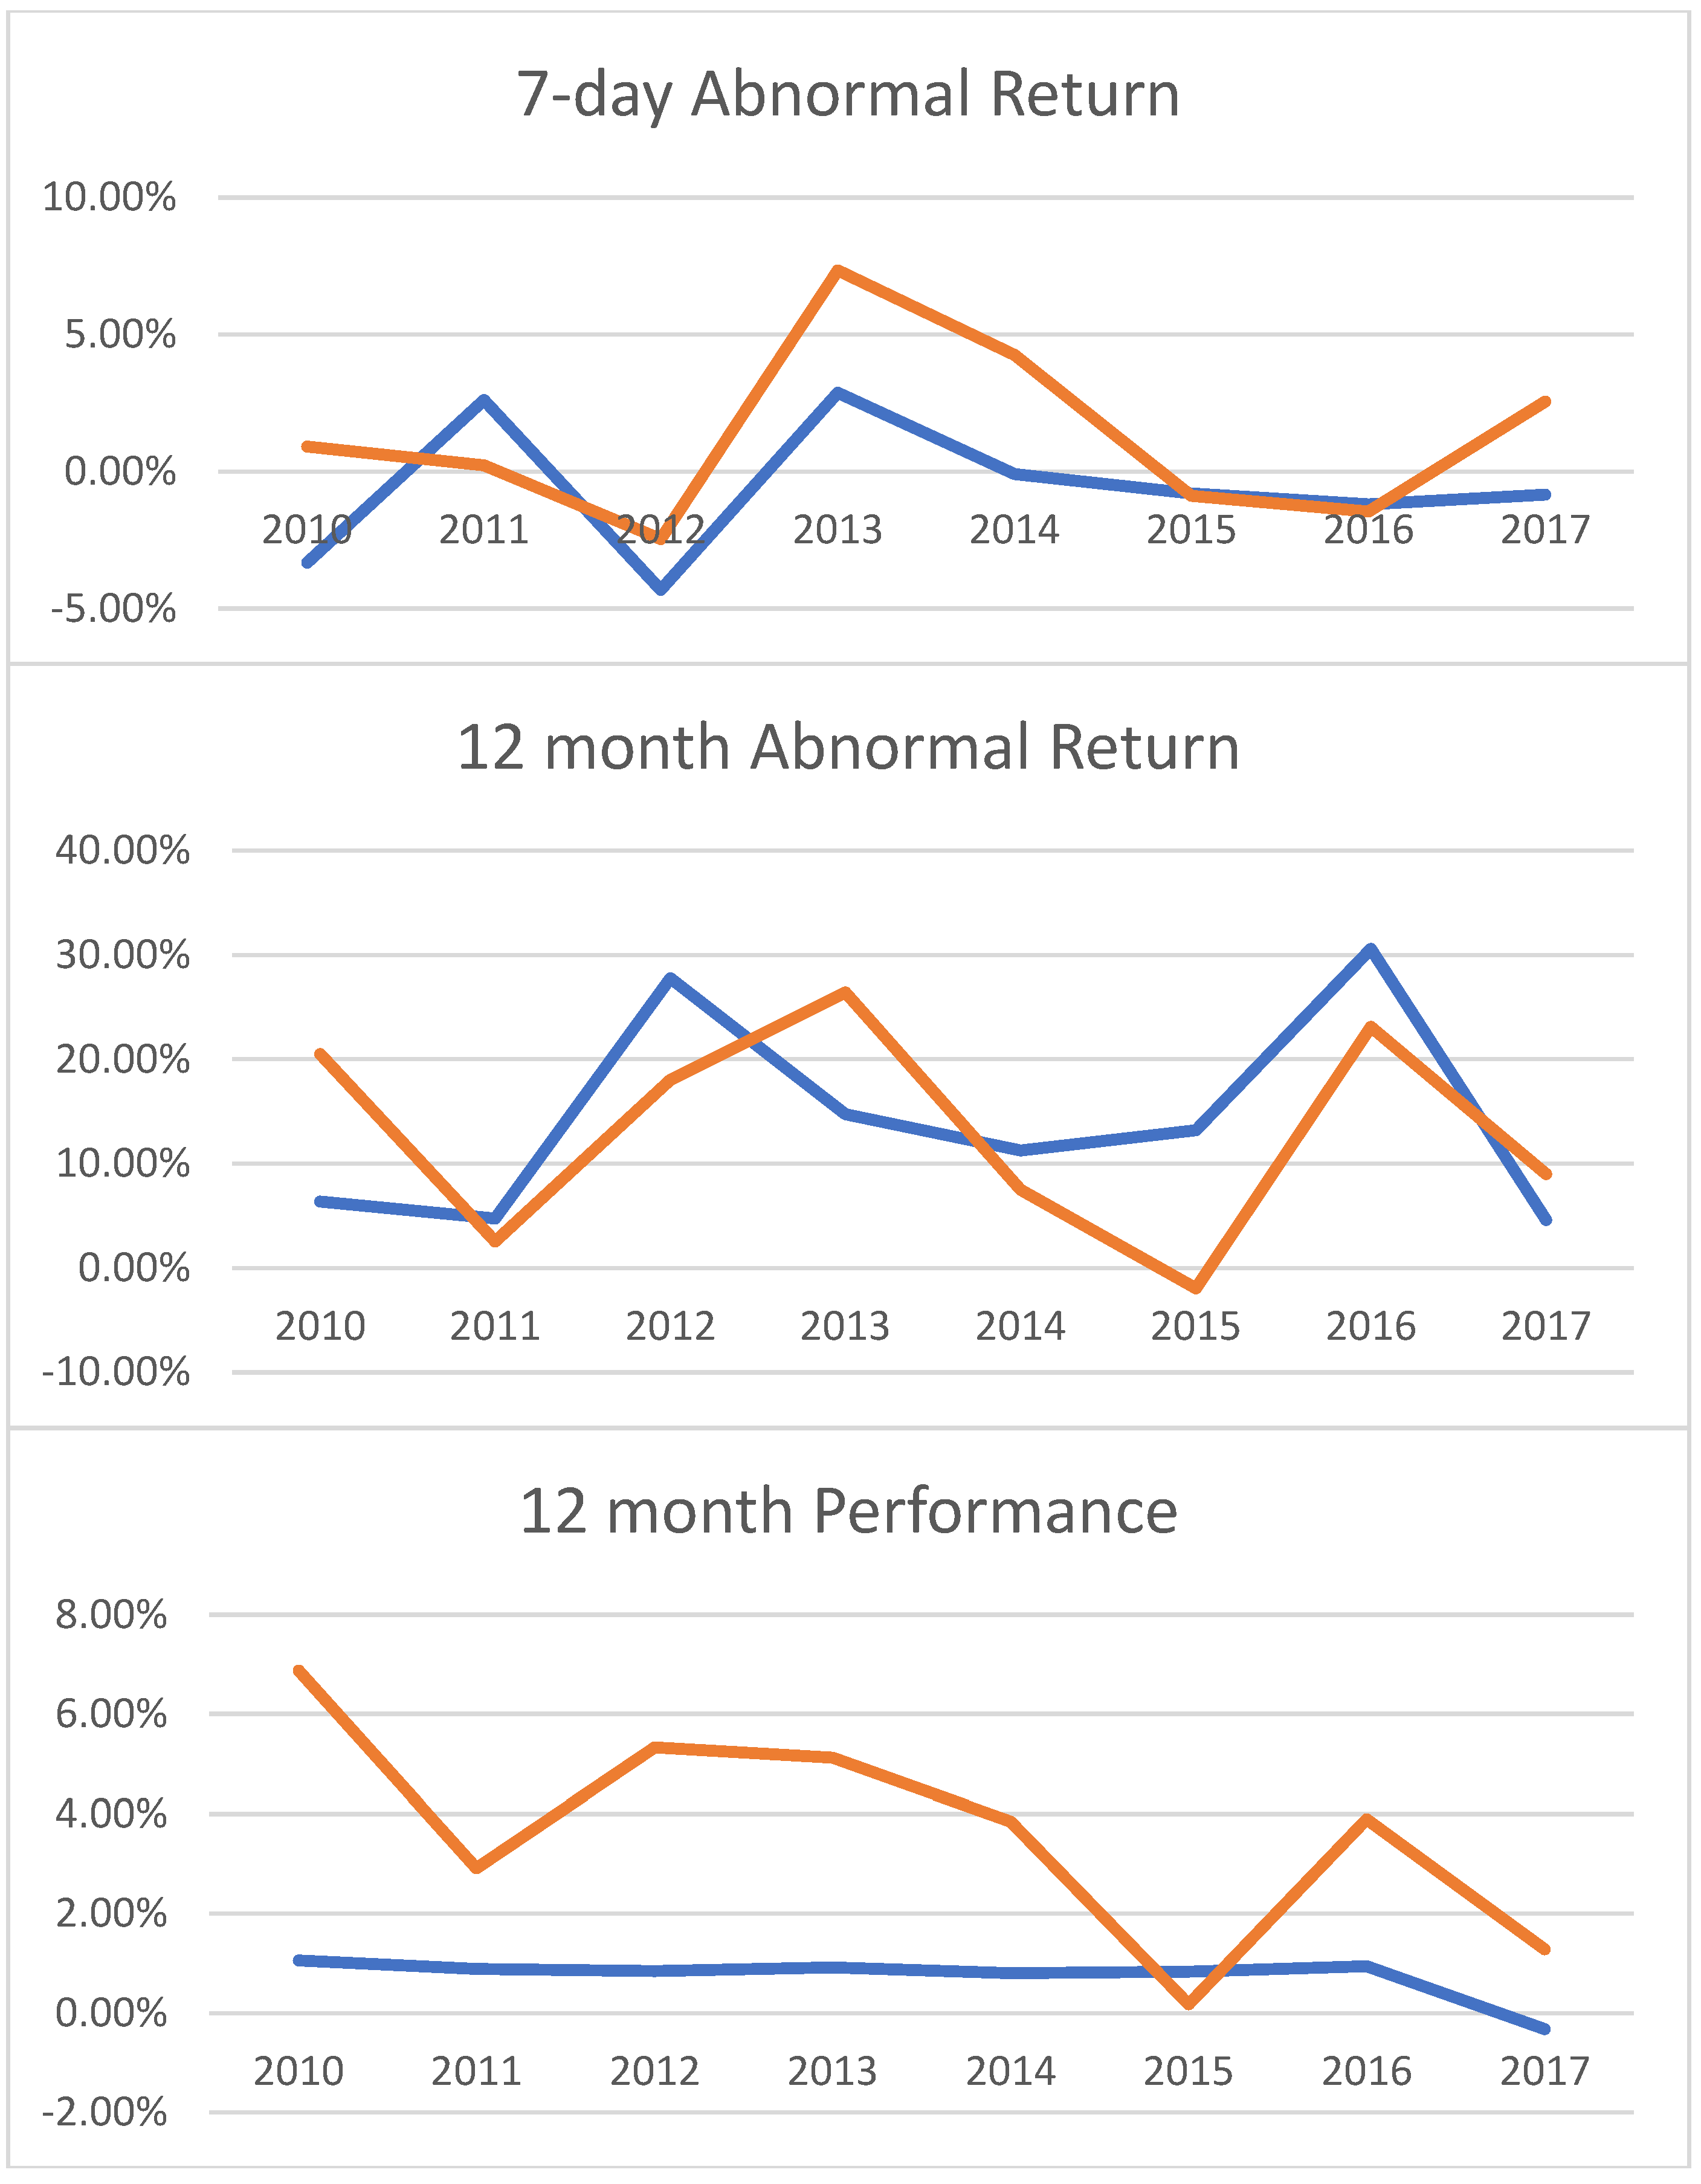
| 2010 | −4.45% | −4.85% | −4.36% | −3.33% | −3.64% | −3.24% |
| 2011 | −0.14% | −0.07% | −0.12% | 2.61% | 2.96% | 2.43% |
| 2012 | −5.36% | −5.33% | −5.36% | −4.31% | −4.24% | −4.31% |
| 2013 | 0.64% | 0.64% | 0.63% | 2.87% | 3.01% | 2.84% |
| 2014 | −0.28% | −0.27% | −0.28% | −0.10% | 0.20% | −0.18% |
| 2015 | −2.12% | −1.84% | −2.14% | −0.80% | −0.60% | −0.82% |
| 2016 | −1.67% | −1.78% | −1.63% | −1.20% | −1.43% | −1.11% |
| 2017 | −0.88% | −0.77% | −0.89% | −0.85% | −0.73% | −0.86% |
| Overall | −1.36% | −1.34% | −1.36% | −0.51% | −0.42% | −0.52% |
| Median | −1.00% | −0.84% | −1.03% | −0.30% | 0.16% | −0.30% |
| St. Dev. | 4.46% | 4.47% | 4.45% | 5.49% | 5.55% | 5.45% |
| Skewness | −0.90 | −0.95 | −0.89 | −0.30 | −0.34 | −0.28 |
| Panel C: Post M&A Abnormal Returns and Performance | ||||||
| Year | Average CAR_VW 6 Month | Average BHAR_VW 6 Month | Average CAR_VW 12 Month | Average BHAR_VW 12 Month | Average ROA_ 6 Month | Average ROA_ 12 Month |
| 2010 | 13.28% | 13.95% | 6.35% | 5.16% | 1.06% | 1.06% |
| 2011 | −2.97% | −3.87% | 4.74% | 3.18% | 0.73% | 0.89% |
| 2012 | 11.47% | 11.60% | 27.79% | 30.82% | 0.71% | 0.84% |
| 2013 | 10.22% | 10.08% | 14.75% | 14.05% | 0.82% | 0.91% |
| 2014 | 3.26% | 2.56% | 11.25% | 10.92% | 0.78% | 0.80% |
| 2015 | 2.18% | 1.12% | 13.21% | 11.53% | 0.77% | 0.83% |
| 2016 | 12.67% | 12.71% | 25.39% | 27.21% | 0.87% | 0.94% |
| 2017 | 3.25% | 2.66% | 4.60% | 3.59% | 0.47% | 0.51% |
| Overall | 6.72% | 6.31% | 14.21% | 14.03% | 0.76% | 0.82% |
| Median | 5.49% | 4.54% | 13.49% | 11.78% | 0.74% | 0.73% |
| St. Dev. | 11.38% | 12.29% | 17.24% | 19.78% | 0.26% | 0.25% |
| Skewness | 0.62 | 0.86 | 0.34 | 0.91 | −0.09 | −0.30 |
| Panel A: Characteristics | ||||||
| Year | N | Average Capital Ratio | Average Transaction Value | Average Premium 1 Week | Average Time to Completion (Days) | |
| 2010 | 36 | 46.05 | 1931.86 | 41.31% | 115.8 | |
| 2011 | 26 | 36.83 | 3915.93 | 30.90% | 132.4 | |
| 2012 | 47 | 41.39 | 1604.41 | 41.24% | 99.5 | |
| 2013 | 40 | 40.68 | 2225.21 | 38.95% | 104.1 | |
| 2014 | 49 | 42.51 | 2997.15 | 31.33% | 119.6 | |
| 2015 | 51 | 39.12 | 5093.55 | 31.64% | 122.1 | |
| 2016 | 50 | 38.75 | 4592.00 | 39.28% | 125.1 | |
| 2017 | 36 | 38.73 | 4848.53 | 27.06% | 127.7 | |
| Overall | 335 | 40.59 | 3418.28 | 35.39% | 117.6 | |
| Median | 41.02 | 1335.42 | 30.37% | 99.0 | ||
| Standard Deviation | 17.22 | 6541.14 | 35.40% | 75.1 | ||
| Skewness | 0.08 | 5.28 | 2.15 | 1.14 | ||
| Panel B: Announcement Period Abnormal Returns | ||||||
| Year | Average CAR_VW3 | Average CAR_EW3 | Average CAR_SP3 | Average CAR_VW7 | Average CAR_EW7 | Average CAR_SP7 |
| 2010 | 0.92% | 0.95% | 0.97% | 0.90% | 1.11% | 0.91% |
| 2011 | −0.37% | −0.28% | −0.33% | 0.22% | 0.24% | 0.25% |
| 2012 | −0.34% | −0.49% | −0.27% | −2.47% | −2.92% | −2.24% |
| 2013 | 6.47% | 6.56% | 6.47% | 7.34% | 7.37% | 7.28% |
| 2014 | 3.21% | 3.23% | 3.18% | 4.24% | 4.48% | 4.17% |
| 2015 | −2.61% | −2.29% | −2.64% | −0.89% | −0.18% | −1.08% |
| 2016 | −1.13% | −1.55% | −1.01% | −1.46% | −2.35% | −1.22% |
| 2017 | 0.39% | 0.22% | 0.40% | 2.55% | 2.40% | 2.53% |
| Overall | 0.74% | 0.71% | 0.77% | 1.18% | 1.14% | 1.21% |
| Median | 0.15% | 0.21% | 0.29% | 0.77% | 0.86% | 0.57% |
| St. Dev. | 11.64% | 11.67% | 11.64% | 15.07% | 15.25% | 15.06% |
| Skewness | 0.99 | 1.01 | 0.99 | −0.39 | −0.36 | −0.41 |
| Panel C: Post M&A Abnormal Returns and Performance | ||||||
| Year | Average CAR_VW 6 Month | Average BHAR_VW 6 Month | Average CAR_VW 12 Month | Average BHAR_VW 12 Month | Average ROA_6 Month | Average ROA_12 Month |
| 2010 | 16.20% | 17.03% | 20.50% | 19.10% | 6.84% | 6.87% |
| 2011 | −5.46% | −4.60% | 2.55% | 3.38% | 2.96% | 2.91% |
| 2012 | 6.56% | 6.95% | 18.03% | 20.21% | 5.59% | 5.33% |
| 2013 | 15.83% | 16.47% | 26.43% | 28.05% | 5.63% | 5.12% |
| 2014 | 8.71% | 8.85% | 7.51% | 6.83% | 4.33% | 3.85% |
| 2015 | −4.98% | −5.59% | 0.20% | −2.91% | 0.53% | 0.54% |
| 2016 | 11.84% | 12.42% | 23.12% | 27.09% | 3.57% | 3.89% |
| 2017 | 6.03% | 5.79% | 8.99% | 7.81% | 1.28% | 1.28% |
| Overall | 7.06% | 7.33% | 13.63% | 13.94% | 3.81% | 3.69% |
| Median | 9.36% | 8.15% | 14.77% | 12.02% | 3.00% | 3.32% |
| St. Dev. | 20.59% | 12.24% | 25.84% | 29.14% | 5.02% | 8.84% |
| Skewness | −0.52 | −0.07 | −0.41 | 0.41 | −2.38 | −5.62 |
| Banks | Non-Banks | |||
|---|---|---|---|---|
| Low Capital Ratio | High Capital Ratio | Low Capital (Equity) Ratio | High Capital (Equity) Ratio | |
| CAR_VW3 | −2.24% | −0.49% ** | 3.19% | −1.69% *** |
| CAR_EW3 | −2.19% | −0.49% ** | 3.13% | −1.69% *** |
| CAR_SP3 | −2.23% | −0.50% ** | 3.21% | −1.67% *** |
| CAR_VW7 | −1.80% | 0.76% *** | 4.41% | −2.03% *** |
| CAR_EW7 | −1.74% | 0.88% *** | 4.35% | −2.05% *** |
| CAR_SP7 | −1.79% | 0.73% *** | 4.43% | −2.00% *** |
| CAR_VW_ 6 month | 7.28% | 6.14% | 6.73% | 7.38% |
| BHAR_VW_ 6 month | 6.74% | 5.87% | 6.82% | 7.83% |
| CAR_VW_12 month | 14.88% | 13.53% | 14.39% | 12.86% |
| BHAR_VW_12 month | 14.66% | 13.39% | 14.66% | 13.20% |
| ROA_6 month | 0.72% | 0.79% | 2.11% | 5.53% ** |
| ROA_12 month | 0.78% | 0.84% | 2.48% | 4.91% ** |
| Panel A | ||||||
| CAR_VW7 | CAR_VW_ 6 Month | CAR_VW_ 12 Month | BHAR_VW 6 Month | BHAR_VW 12 Month | ||
| Ln Value | −0.01 ** | −0.01 | −0.01 | −0.01 | −0.01 | |
| Same Industry Deal | 0.01 | 0.01 | 0.01 | 0.01 | 0.01 | |
| Bank | −0.08 *** | −0.03 | −0.01 | −0.03 | −0.02 | |
| High Capital Ratio | −0.07 *** | −0.01 | −0.02 | −0.01 | −0.02 | |
| Bank x High Capital Ratio | 0.08 *** | −0.02 | −0.01 | −0.02 | −0.01 | |
| Year Dummy Variables | Yes | Yes | Yes | Yes | Yes | |
| Industry Dummy Variables | Yes | Yes | Yes | Yes | Yes | |
| Adjusted R2 | 10.84% | 11.39% | 11.02% | 11.99% | 12.88% | |
| White Test p-value | 0.68 | 0.35 | 0.80 | 0.19 | 0.69 | |
| Durbin-Watson Test Stat. | 2.02 | 1.66 | 1.75 | 1.68 | 1.73 | |
| Error Term t-statistic | −0.35 | 0.00 | 0.00 | 0.00 | 0.00 | |
| Panel B | ||||||
| CAR_VW7 | CAR_VW_ 6 Month | CAR_VW_ 12 Month | BHAR_VW 6 Month | BHAR_VW 12 Month | ||
| Ln Value | −0.01 ** | −0.01 | −0.01 | −0.01 | −0.01 | |
| Same Industry Deal | 0.01 | 0.01 | 0.01 | −0.01 | 0.01 | |
| Bank | −0.07 *** | −0.03 | −0.01 | −0.03 | −0.01 | |
| High Capital Ratio | −0.07 *** | −0.02 | −0.02 | −0.01 | −0.02 | |
| Bank x High Capital Ratio | 0.08 *** | −0.02 | −0.02 | −0.02 | −0.02 | |
| Time to Completion | −0.01 | −0.01 | −0.01 | −0.01 | −0.01 | |
| Takeover Premium | −0.01 | −0.04 * | −0.01 | −0.04 * | −0.02 | |
| Year Dummy Variables | Yes | Yes | Yes | Yes | Yes | |
| Industry Dummy Variables | Yes | Yes | Yes | Yes | Yes | |
| Adjusted R2 | 10.91% | 10.92% | 9.60% | 11.49% | 11.55% | |
| White Test p-value | 0.97 | 0.55 | 0.93 | 0.56 | 0.82 | |
| Durbin-Watson Test Stat. | 2.05 | 1.74 | 1.81 | 1.75 | 1.78 | |
| Error Term t-statistic | −0.37 | 0.00 | 0.00 | 0.00 | 0.00 | |
| Panel C | ||||||
| ROA_ 6 Month | ROA_ 12 Month | Book to Market_ 6 Month | Book to Market_ 12 Month | Beta_ 6 Month | Beta_ 12 Month | |
| ROA_Quarter before | 0.49 *** | 0.33 *** | ||||
| Book to Market_Quarter before | 0.41 *** | 0.42 *** | ||||
| Beta_Quarter before | 0.72 *** | 0.51 *** | ||||
| Ln Value | 0.01 *** | 0.01 | 1.98 * | 2.19 *** | 0.01 | 0.01 |
| Same Industry Deal | −0.01 | −0.01 | −4.26 * | −4.53 * | −0.05 | −0.15 |
| Bank | 0.01 | 0.01 | 6.31 | 7.17 * | −0.17 | −0.12 |
| High Capital Ratio | 0.02 ** | 0.01 * | 6.01 *** | 6.00 *** | −0.01 | −0.17 |
| Bank x High Capital Ratio | −0.02 | −0.01 | −5.21 | −5.13 | 0.51 ** | 0.49 * |
| Year Dummy Variables | Yes | Yes | Yes | Yes | Yes | Yes |
| Industry Dummy Variables | Yes | Yes | Yes | Yes | Yes | Yes |
| Adjusted R2 | 38.33% | 11.71% | 70.95% | 73.21% | 47.03% | 40.68% |
| White Test p-value | 0.76 | 0.99 | 0.96 | 0.94 | 0.49 | 0.38 |
| Durbin-Watson Test Stat. | 2.08 | 2.05 | 1.95 | 1.98 | 1.61 | 1.60 |
| Error Term t-statistic | 0.00 | 0.00 | 0.00 | 0.00 | 0.00 | 0.00 |
| Panel D | ||||||
| ROA_ 6 Month | ROA_ 12 Month | Book to Market_ 6 Month | Book to Market_ 12 Month | Beta_ 6 Month | Beta_ 12 Month | |
| ROA_Quarter before | 0.46 *** | 0.30 *** | ||||
| Book to Market_Quarter before | 0.42 *** | 0.43 *** | ||||
| Beta_Quarter before | 0.77 *** | 0.52 *** | ||||
| Ln Value | 0.01 *** | 0.01 | 0.01 | 0.01 | 0.01 | 0.01 |
| Same Industry Deal | −0.01 | −0.01 | −3.58 | −3.76 | −0.05 | −0.17 |
| Bank | 0.01 | 0.01 | 0.01 | 0.01 | −0.17 | −0.05 |
| High Capital Ratio | 0.02 ** | 0.02 * | 6.85 *** | 6.61 *** | −0.05 | −0.11 |
| Bank x High Capital Ratio | −0.02 | −0.02 | −7.36* | −7.17 * | 0.57 ** | 0.51 * |
| Time to Completion | −0.01 *** | −0.01 | 0.01 *** | 0.01 *** | 0.01 | 0.01 |
| Takeover Premium | 0.01 | 0.01 | −5.09 * | −5.16 * | −0.10 | −0.17 |
| Year Dummy Variables | Yes | Yes | Yes | Yes | Yes | Yes |
| Industry Dummy Variables | Yes | Yes | Yes | Yes | Yes | Yes |
| Adjusted R2 | 37.34% | 11.23% | 73.93% | 74.56% | 46.77% | 38.19% |
| White Test p-value | 0.77 | 0.99 | 0.56 | 0.58 | 0.90 | 0.88 |
| Durbin-Watson Test Stat. | 2.08 | 2.05 | 1.92 | 1.95 | 1.62 | 1.61 |
| Error Term t-statistic | 0.00 | 0.00 | 0.00 | 0.00 | 0.00 | 0.00 |
| Net Interest Margin_ 6 Month | Net Interest Margin_ 12 Month | Nonperform ng Assets Ratio_ 6 Month | Nonperform ng Asset Ratio_ 12 Month | Net Profit Margin_ 6 Month | Net Profit Margin_ 12 Month | |
|---|---|---|---|---|---|---|
| Net Interest Margin_ quarter before | 0.70 *** | 0.63 *** | ||||
| Nonperforming assets ratio_quarter before | 0.05 *** | 0.04 *** | ||||
| Net Profit Margin_ quarter before | 0.27 *** | 0.11 ** | ||||
| Ln Value | 0.01 | 0.01 | −0.02 ** | −0.02 ** | 0.01 | 0.01 |
| Same Industry Deal | 0.01 | 0.01 | ||||
| High Capital Ratio | −0.01 | 0.01 | −0.01 | −0.00 | 0.02 * | 0.07 * |
| Time to Completion | 0.00 | −0.00 | 0.02 ** | 0.02 ** | −0.01 | −0.01 |
| Takeover Premium | −0.01 | −0.01 | 0.01 | 0.01 | 0.02 | 0.06 |
| Year Dummy Variables | Yes | Yes | Yes | Yes | Yes | Yes |
| Industry Dummy Variables | Yes | Yes | ||||
| Adjusted R2 | 55.23% | 65.30% | 26.09% | 23.42% | 13.54% | 6.62% |
| White Test p-value | 0.44 | 0.71 | 0.79 | 0.73 | 1.00 | 0.97 |
| Durbin-Watson Test Stat. | 1.89 | 1.85 | 2.20 | 2.23 | 2.04 | 1.94 |
| Error Term t-statistic | 0.00 | 0.00 | 0.00 | 0.00 | 0.00 | 0.00 |
Publisher’s Note: MDPI stays neutral with regard to jurisdictional claims in published maps and institutional affiliations. |
© 2022 by the authors. Licensee MDPI, Basel, Switzerland. This article is an open access article distributed under the terms and conditions of the Creative Commons Attribution (CC BY) license (https://creativecommons.org/licenses/by/4.0/).
Share and Cite
Krishnan, C.N.V.; Yakimenko, V. Market Misreaction? Leverage and Mergers and Acquisitions. J. Risk Financial Manag. 2022, 15, 144. https://doi.org/10.3390/jrfm15030144
Krishnan CNV, Yakimenko V. Market Misreaction? Leverage and Mergers and Acquisitions. Journal of Risk and Financial Management. 2022; 15(3):144. https://doi.org/10.3390/jrfm15030144
Chicago/Turabian StyleKrishnan, C. N. V., and Vasiliy Yakimenko. 2022. "Market Misreaction? Leverage and Mergers and Acquisitions" Journal of Risk and Financial Management 15, no. 3: 144. https://doi.org/10.3390/jrfm15030144