
A 3-Dimensional Frame of Reference for Prevention of Risk in Supply Chain

Faculty of Economics, Thu Dau Mot University, Thu Dau Mot 590000, Vietnam
J. Risk Financial Manag. 2022, 15(3), 142; https://doi.org/10.3390/jrfm15030142
Submission received: 23 December 2021
/
Revised: 10 March 2022
/
Accepted: 14 March 2022
/
Published: 16 March 2022
(This article belongs to the Special Issue Enterprise Risk Management)
Abstract
:Businesses have to deal with many potential risks in the supply chain, especially during the COVID-19 pandemic. The retail market in Vietnam has great potential for long-term development with the birth and rapid development of domestic supermarkets. However, market opening policies have resulted in fierce competition from a large number of foreign supermarkets. At the same time, customers have become more professional in their approach to shopping and carefully consider any decisions about shopping and the use of services at supermarkets. In this study, the authors use three models (i.e., the SERVQUAL model, the binary logistic model, and the Grey model) corresponding to a three-dimensional frame of reference (i.e., past, present, and future) to provide supermarket managers with a multi-dimensional view of the supermarket business situation. The results identify four factors−namely, quality of goods, personnel, safety, and facilities and equipment−that significantly impact customer satisfaction. The second frame of reference shows that factors such as age, academic level, and income affect the decision to reuse any service at the supermarket. The third frame of reference provides supermarket managers with forecast data about the supermarket business situation for 2021 to 2024. These results provide a solid foundation for supermarket managers seeking to develop strategies and take measures to adjust business activities to achieve the best business efficiency and avoid potential risks in the company’s supply chain. In addition, the results of this study are valuable references for researchers in the fields of customer service, supply chain management, and customer behavior. In particular, the factors obtained in this study will greatly strengthen the scientific value of the service sector and the model of retail supermarkets in Vietnam and other countries around the world. In fact, the business strategy of supermarkets still depends on the spread of COVID-19. Therefore, in the future, it is necessary to combine the results of this study with the experience of managers to develop the right business strategies and achieve further results and sustainable development.
1. Introduction
The supermarket business in Vietnam developed very strongly between 2008 and 2020. Thus far, the retail market in Vietnam has attracted many large retailers, such as BigC, Co.opmart, Lotte mart, Ocean mart, and Hiway, that quickly invested in the construction of a distribution network in the form of a hypermarket. A typical example is Co.opmart supermarket, which is considered a successful business enterprise in Vietnam with a distribution system covering most provinces across the country.
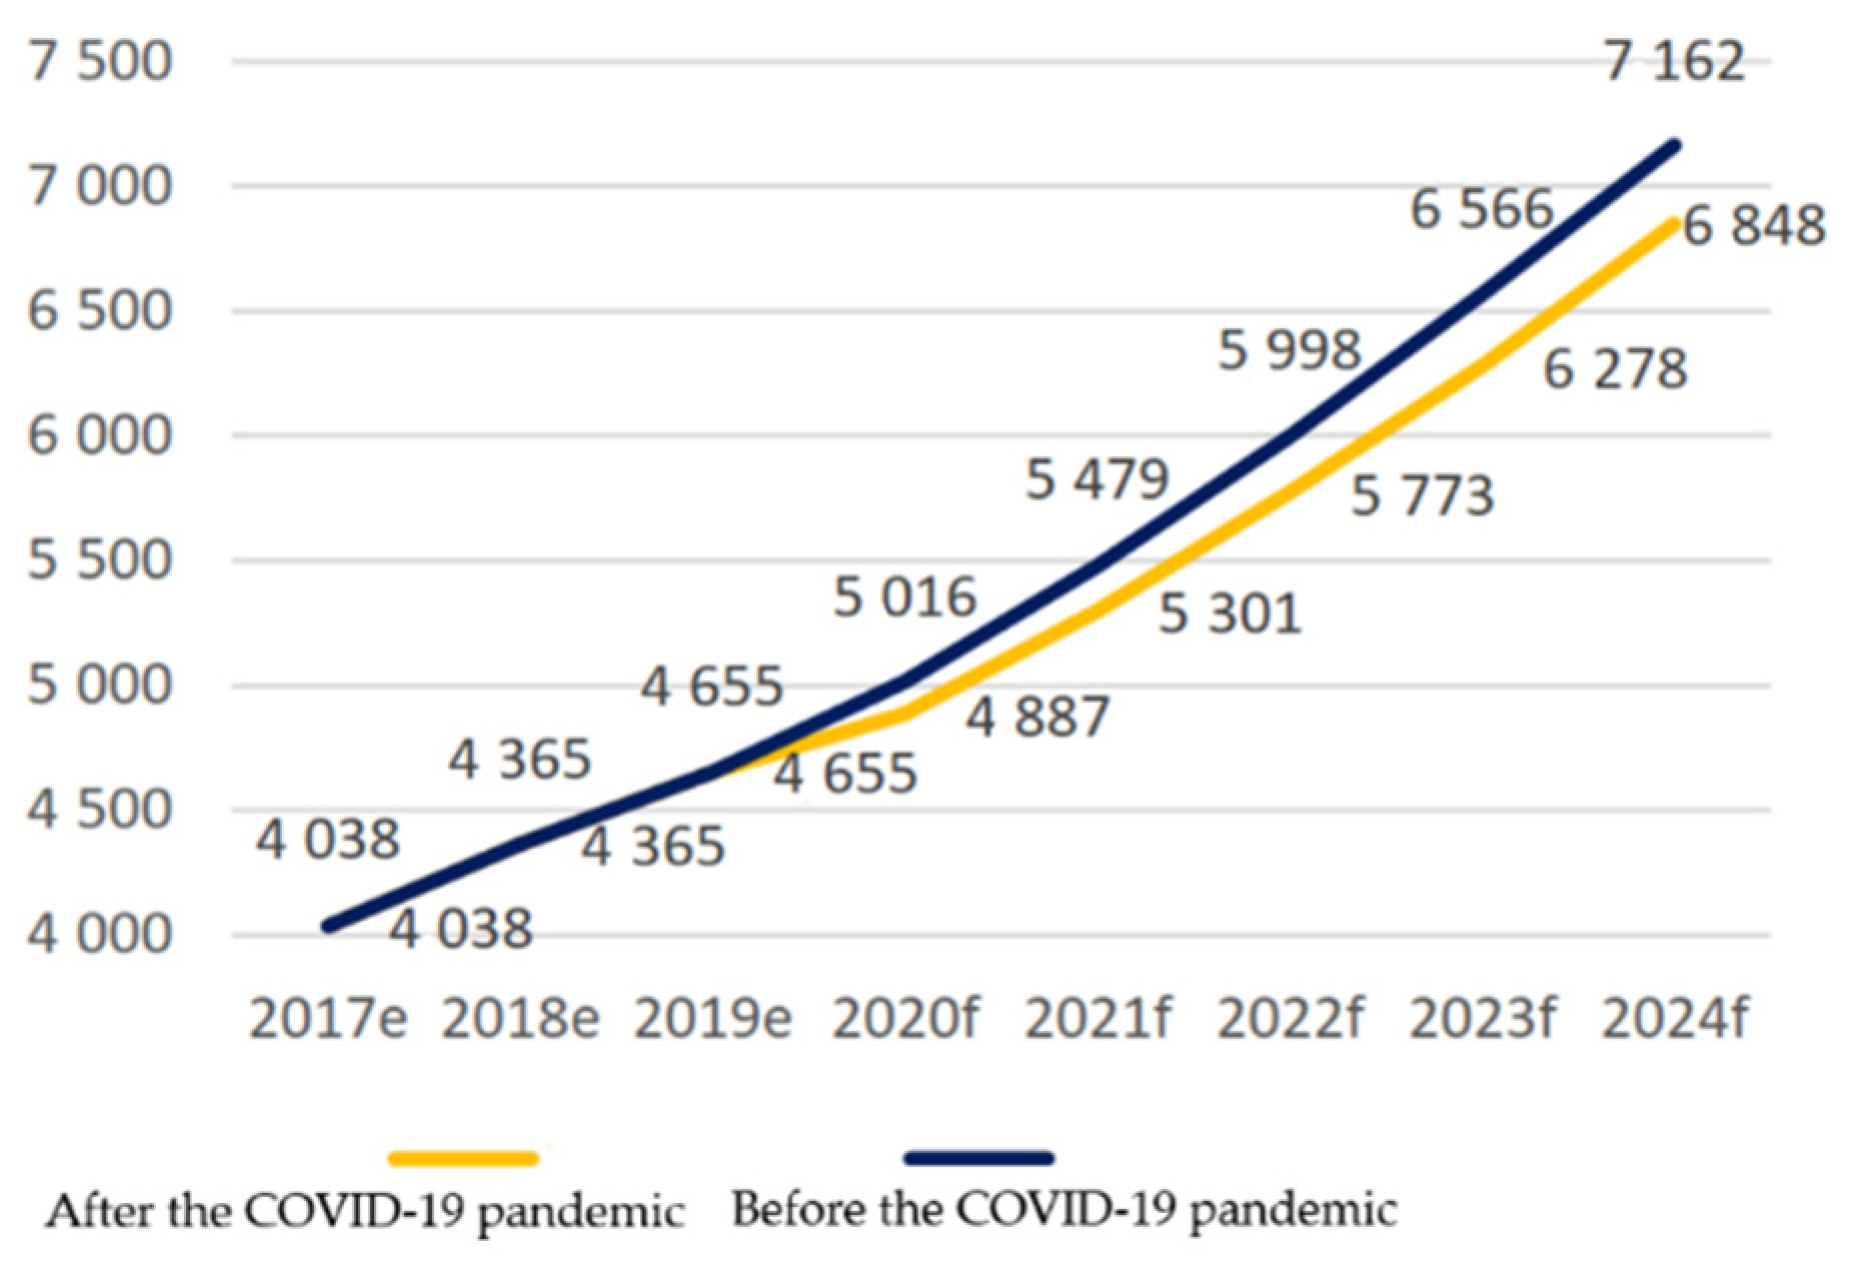
The statistics indicate that, in 2015, per capita income in Vietnam was 45.7 million VND, which increased to 50.76 million VND in 2020, thereby improving people’s standard of living (Figure 1) (Lam 2021). Such growth affected customers’ needs and shopping behavior, bringing about changes in their consumption behavior. Vietnam is also recognized as having great advantages with a fast-growing economy in Southeast Asia. Despite the COVID-19 pandemic, which has affected all countries around the world, Vietnam’s economy still has achieved positive growth. The stable increase in population and rapid increase in annual spending and consumption also make the retail market in Vietnam extremely attractive to both domestic and foreign investors.
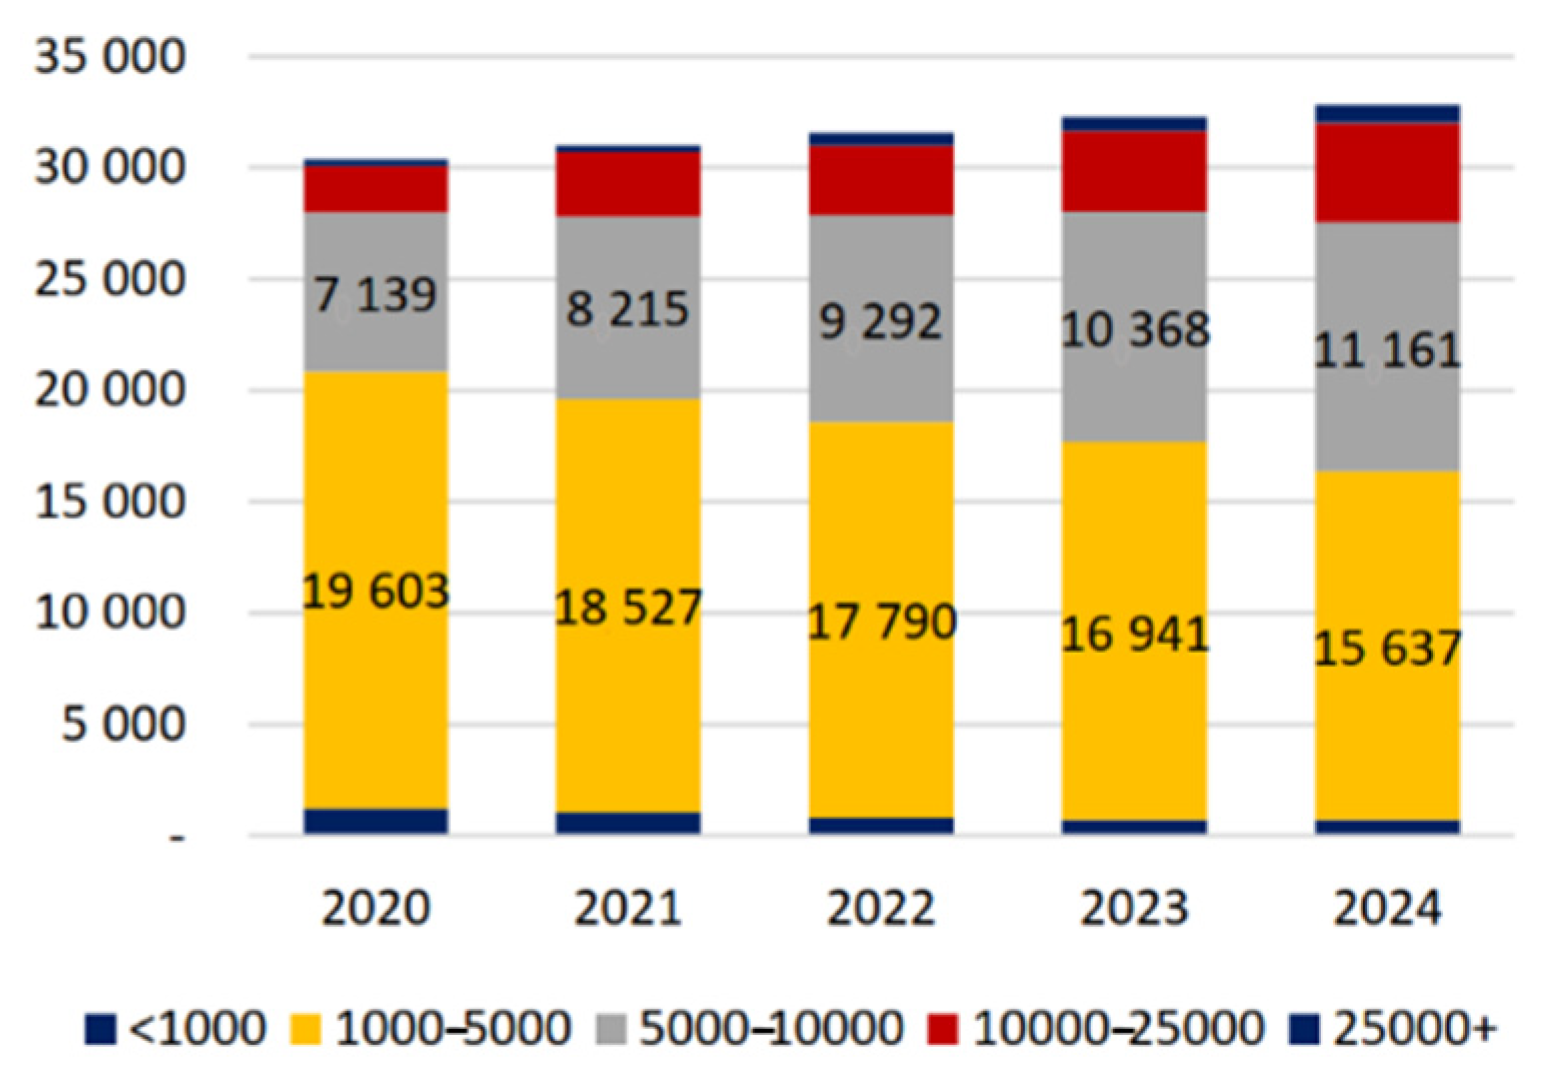
The increased per capita income has also grown the size of the middle class (Figure 2) (An 2021). According to the World Bank, Vietnam, Thailand, Malaysia, Indonesia, and the Philippines have the fastest-growing middle-class populations in the region due to great advances in socio-economic development. From 2011 to 2019, the number of middle-class people in Vietnam significantly increased from 7.8% (more than 6.8 million people) to 20.2% (19.5 million people) of the population (Lam 2021).
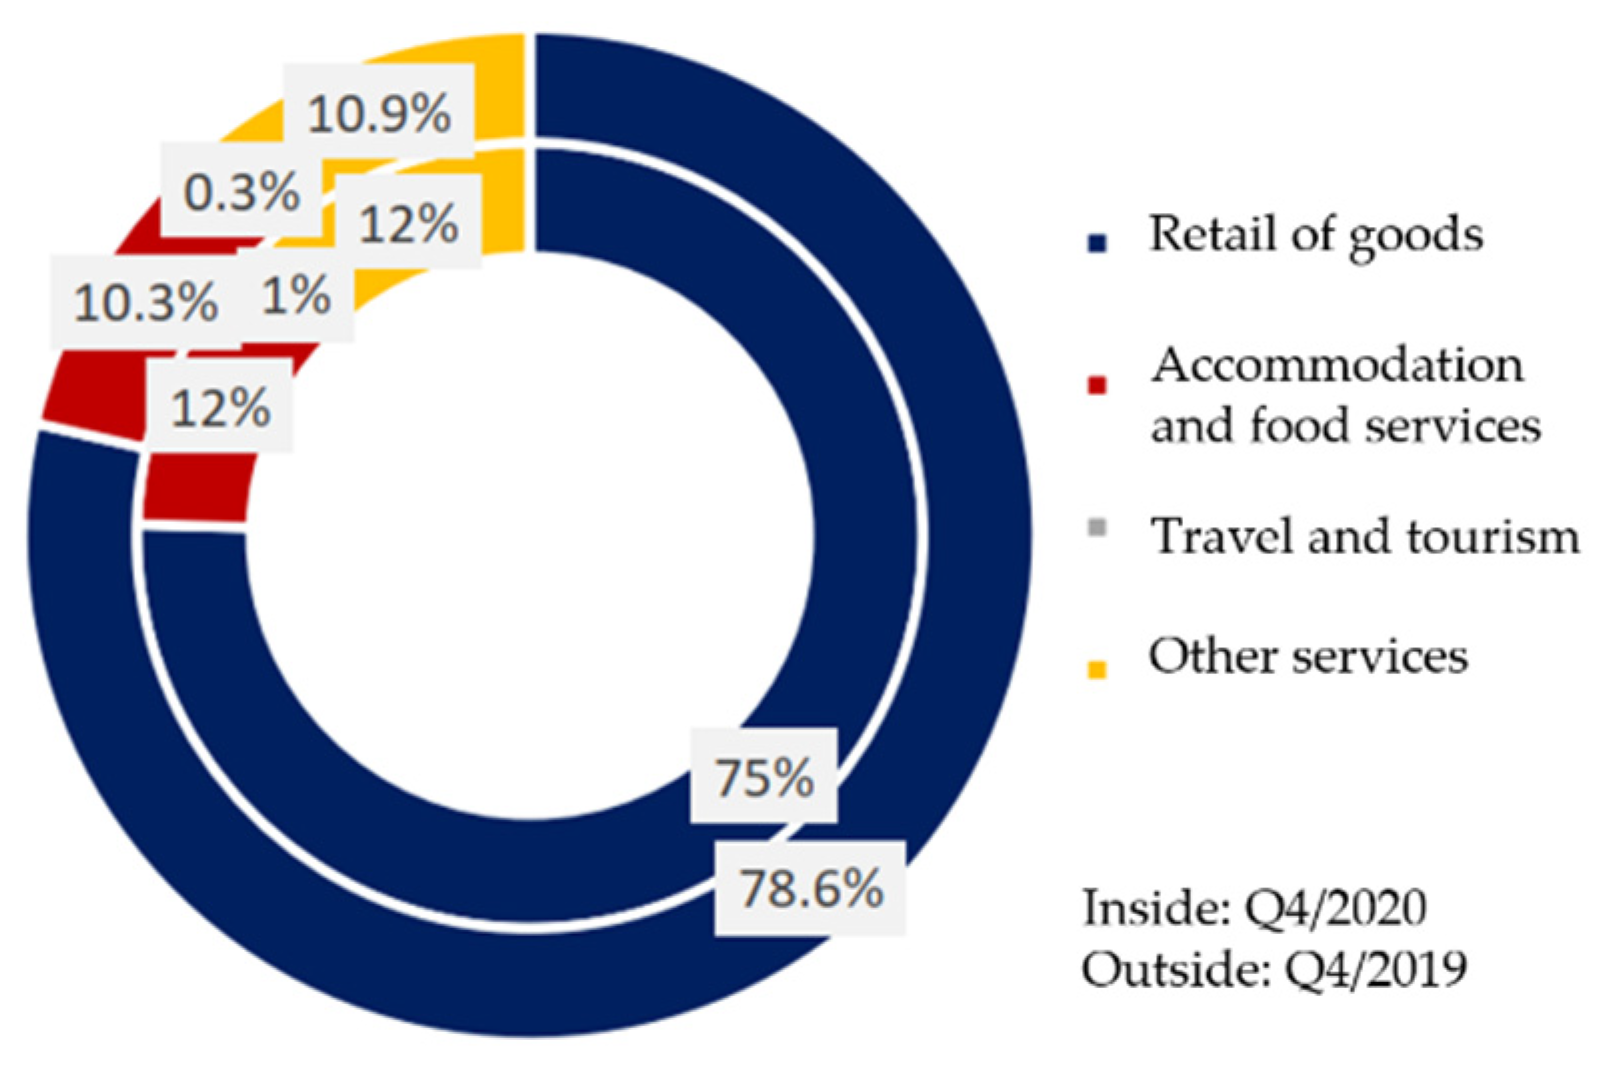
Serving a population of approximately 100 million people and a growth rate in the double digits, Vietnam’s retail market is considered one of the more lucrative opportunities for investors (Figure 3) (Fitch Solutions 2021).
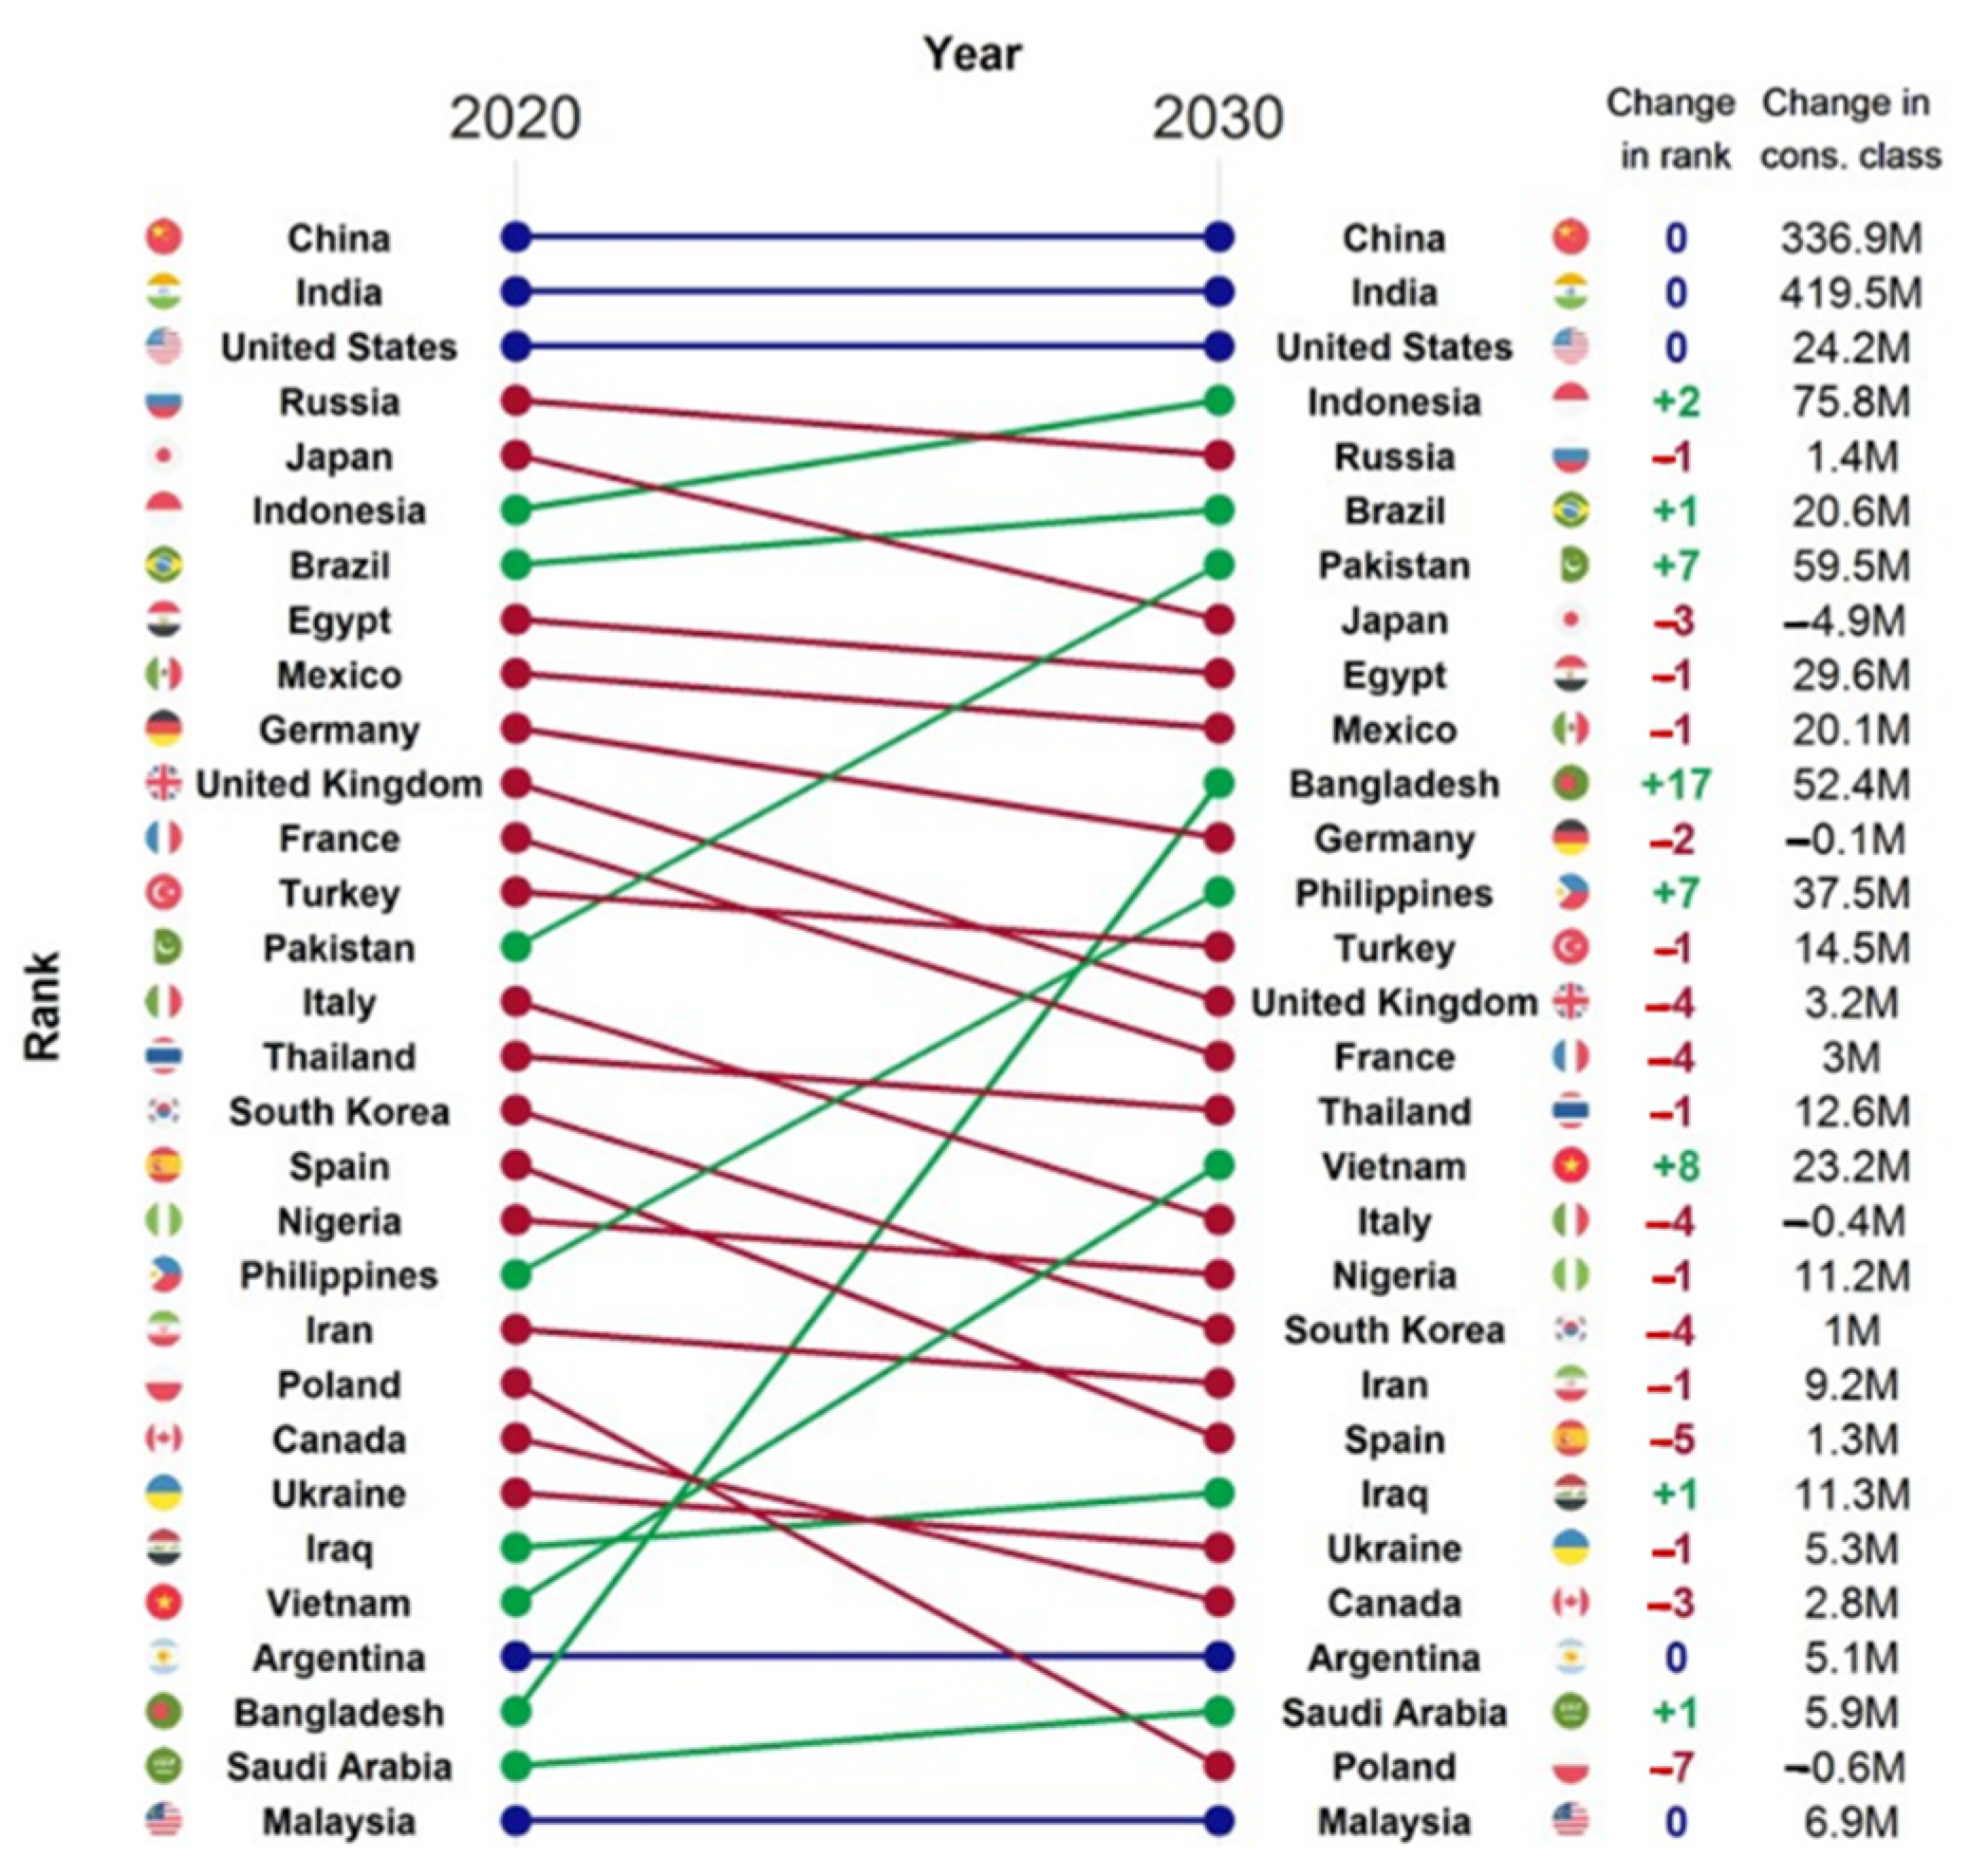
Consumers in Vietnam tend to change their behavior from shopping at traditional markets to shopping at stores and supermarkets, making Vietnam’s retail market the fastest-growing and most vibrant market in the world (Figure 4) (An 2021). Moreover, the wave of sales and mergers and the strong penetration of large foreign corporations into the Vietnam retail market have made the competition among enterprises in this sector fiercer than ever. Thus, managers must quickly learn about consumer behavior, improve service quality, and simultaneously take advantage of opportunities to develop Vietnam’s retail market.
If Vietnamese retail enterprises fail to identify solutions for improving service quality, their market share will be seriously affected and they may be acquired, dominated, and ultimately eliminated by foreign groups. Therefore, managers of Vietnam retail groups need to research and take measures to provide better service that addresses consumers’ needs and improves service quality in the supply chain, thereby achieving competitive advantages over foreign corporations.
In addition, the spread of COVID-19 has been affecting and interrupting the operation of the global supply chain, resulting in enterprise modeling and risk assessment. Supply chains of enterprises around the world, including in Vietnam, continue to be affected by the COVID-19 pandemic. Compared with other countries in the region, Vietnam has successfully prevented and controlled the pandemic and moved toward re-opening the economy. Indeed, its economy is in the process of progressively transitioning from crisis response to economic recovery. An important objective for both Vietnamese enterprises in general and the retail industry in particular is to better prepare supply chains for future crises, covering not only efficiency and cost management but also safety and adaptability.
To address these problems, the questions are: What is the status of service quality in supermarkets? What factors affect customer satisfaction when using supermarket services? What is the impact of these factors? How do those factors impact a customer’s decision to re-use the service of the supermarket? What are solutions to improve the service quality of supermarkets in the future?
For the reasons mentioned thus far, in order to prevent risks and take effective advantage of opportunities while acquiring competitive advantages during the post-pandemic recovery and development, the improvement of service quality in the domestic supermarket system is a critical and urgent need that the supermarket’s management board should consider a top priority.
2. Literature Review
Parasuraman (1985) defined service quality as “the difference between consumers’ perception of a service provided by a particular company and their expectations of the provider of such service”. Based on this theory, if the value the customers perceive is less than what they expect, they will rate it as a poor-quality brand. However, if the value they perceive meets or exceeds their expectations, they will rate it as a high-quality product. Both Parasuraman (1985) and Carman (1990) agree that quality is an abstract concept that is hard to measure and define. However, they also agree that the quality of products and services is the key to an enterprise’s competitive advantage in the market.
Service quality is a prerequisite for customer satisfaction, directly affecting customers’ purchase decisions (Cronin and Taylor 1992). Cronin and Taylor also suggest that managers need to pay more attention to customer satisfaction than just focus on the improvement of service quality through each specific step. In particular, the researchers demonstrated that service quality plays a primary role in enhancing enterprises’ competitiveness, apart from quantifiable and verifiable values such as cost of goods sold, administrative costs, total assets, equity, net revenues, and profits after tax. Therefore, in the current study, the authors chose the Grey model to forecast the essential financial indicators that managers of the Co.opmart supermarket system need to have the best preparation and be ready to meet customers’ needs. These quantitative factors, along with service quality factors, are a solid basis for managers to develop strategies to improve service quality in the Co.opmart supermarket system.
Reichheld and Sasser (1990) concluded that service quality is an important factor that all enterprises must take notice of for the purpose of customer retention rather than merely focusing on other indicators in their business activities. Enterprises in the retail sector have come to realize that competition in the present day no longer depends on whose goods are cheaper, but rather on who serves customers better. Supermarkets should assess the impact of factors such as age, education level, income, and geographical location on the decision to engage in the repeat use of the supermarket’s services in order to develop better customer service policies based on specific criteria and improve customers’ perceptions of the services received, thereby closing the gap between customer expectations and perceived value in the service quality model.
Scholars have demonstrated that an increase in switching costs for a type of good or service directly affects customers’ intention to continue to use the service or purchase the good, yet it also weakens satisfied customers’ attachment and makes it more difficult to retain them (Blut et al. 2015). Therefore, focusing exclusively on retaining customers by increasing switching costs can only provide a temporary solution. Especially in the retail sector, the competition among enterprises is very fierce, and they are under pressure from customers to constantly improve and upgrade their service quality. Accordingly, enterprises must develop plans to retain customers (Ngo et al. 2019).
Managers become interested in the supply chain or managing it when they realize that an efficient supply chain network is critical for any enterprise to compete and develop in the current business environment (Lambert 2008; Bui et al. 2020; Bratt et al. 2021). Effective and comprehensive supply chain management helps enterprises not only obtain competitive advantages, but also survive over stages of a crisis (Fu et al. 2022; Segura et al. 2019). According to Stock and Boyer (2009), supply chain management involves “the management of a network of relationships between an enterprise and independent organizations, and business units including suppliers of materials and supplies, facilities of production, transportation, marketing, and relevant systems to facilitate the forward and reverse logistics flow of material, service, finance and information from manufacturers to end-users with value-adding and profit maximization through efficiency and customer satisfaction”. This comprehensive statement about supply chains provides information for identifying the components in the supply chain as well as development and management options for building an effective supply chain. A supply chain can be managed in various ways, but the ultimate goal for all of them is quality improvement of the entire chain rather than only a few links in the chain. The facilitation of the links and search for systematic solutions to unforeseen problems in the chain, in combination with the storage of information for the entire chain, are positive signs for improving the quality of the supply chain (Mahdiraji et al. 2012).
Many studies throughout the world have applied the SERVQUAL model. For example, a study of patient satisfaction among people treated at Sunyani Hospital in Ghana identified four factors beyond the doctor–patient relationship in need of improvement: reliability, assurance, responsiveness, and communication. Hospital managers used the study’s results to develop policies and strategies in order to improve service quality that met patients’ expectations (Peprah and Atarah 2014). Another study using the SERVQUAL model examined the relationship between service quality and customer satisfaction at 3-star hotels in Vietnam and identified four important factors that have a significant impact on customer satisfaction: empathy, reliability, responsiveness, and assurance (Minh and Matsui 2015). The SERVQUAL model has been applied in many different fields with various results related to service quality factors that affect customer satisfaction (Hsu and Chen 2021; Sumi and Kabir 2021; Peštović et al. 2021; Menezes et al. 2020; Mitropoulou and Tsoulfas 2021; Goula et al. 2021; Wetzel and Hofmann 2020). Therefore, it is necessary to measure and assess supermarkets’ service quality to suggest solutions for their sustainable development.
3. Research Development and Methods
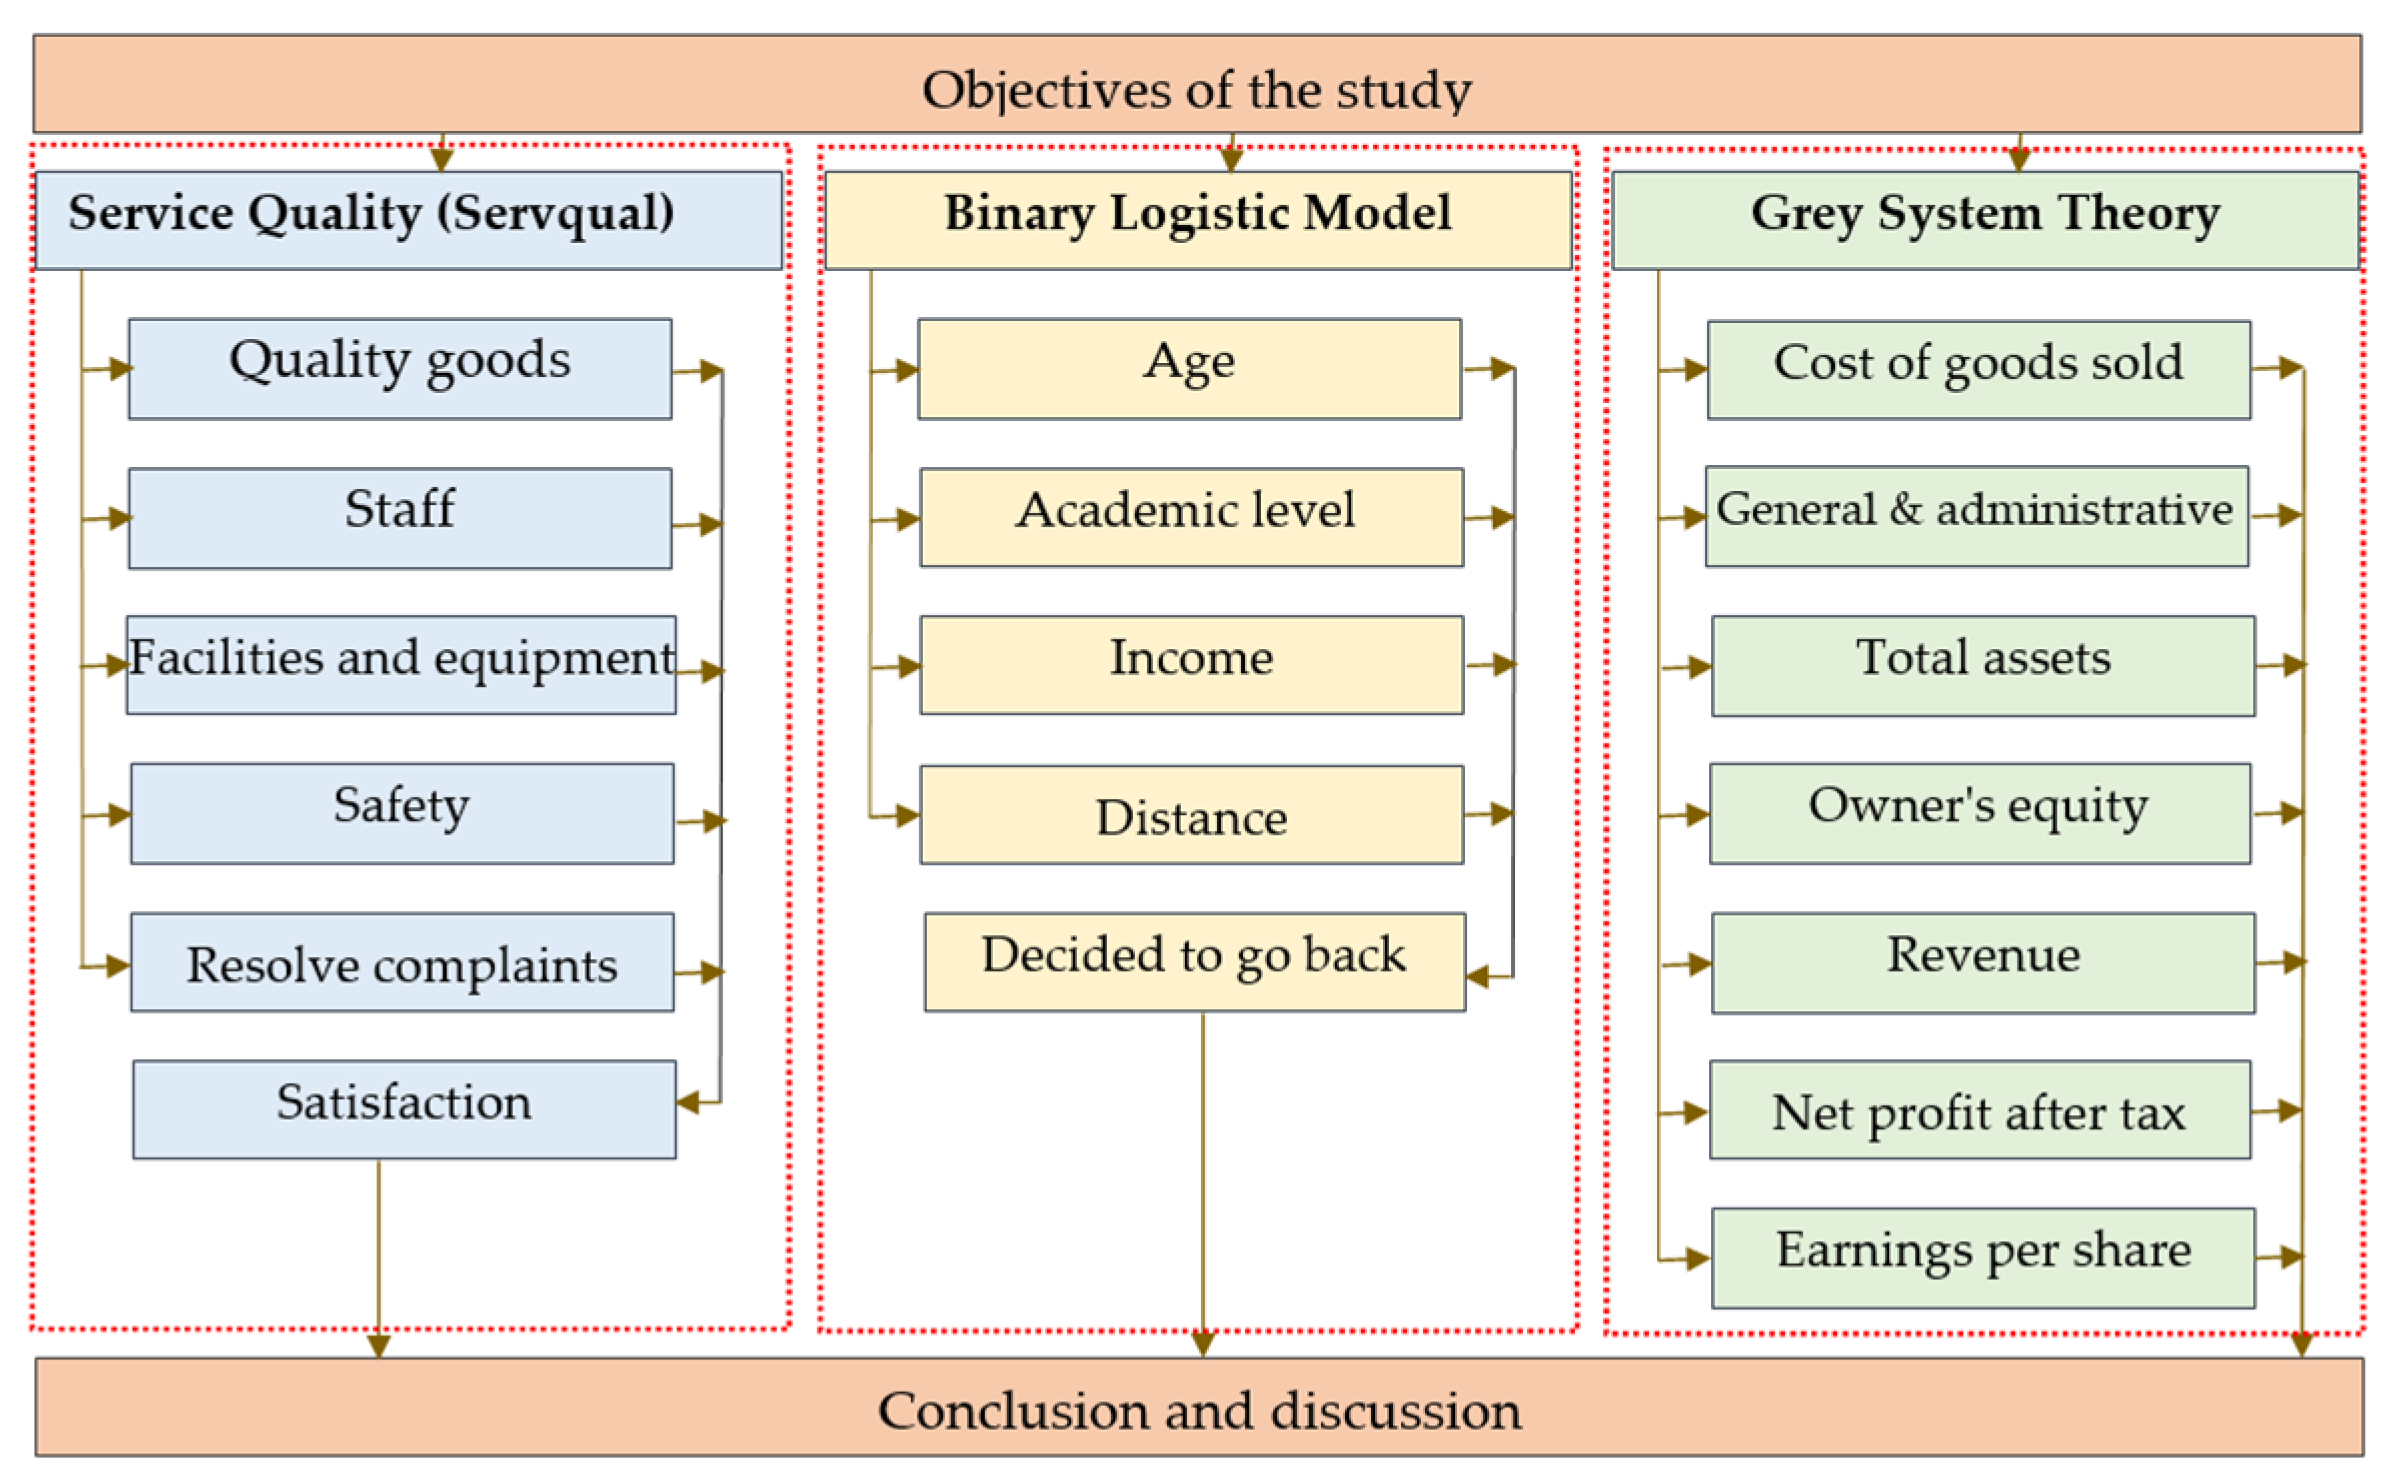
In this study, the authors use a three-dimensional frame of reference (past, present, and future) to improve service quality in the supply chain of domestic supermarkets, providing managers of domestic retail supermarkets with a comprehensive and multi-dimensional view of customers’ behavior, factors affecting the decision to reuse the supermarket’s services, and forecasted future demand. The research process is shown in detail in Figure 5.
3.1. Servqual Model
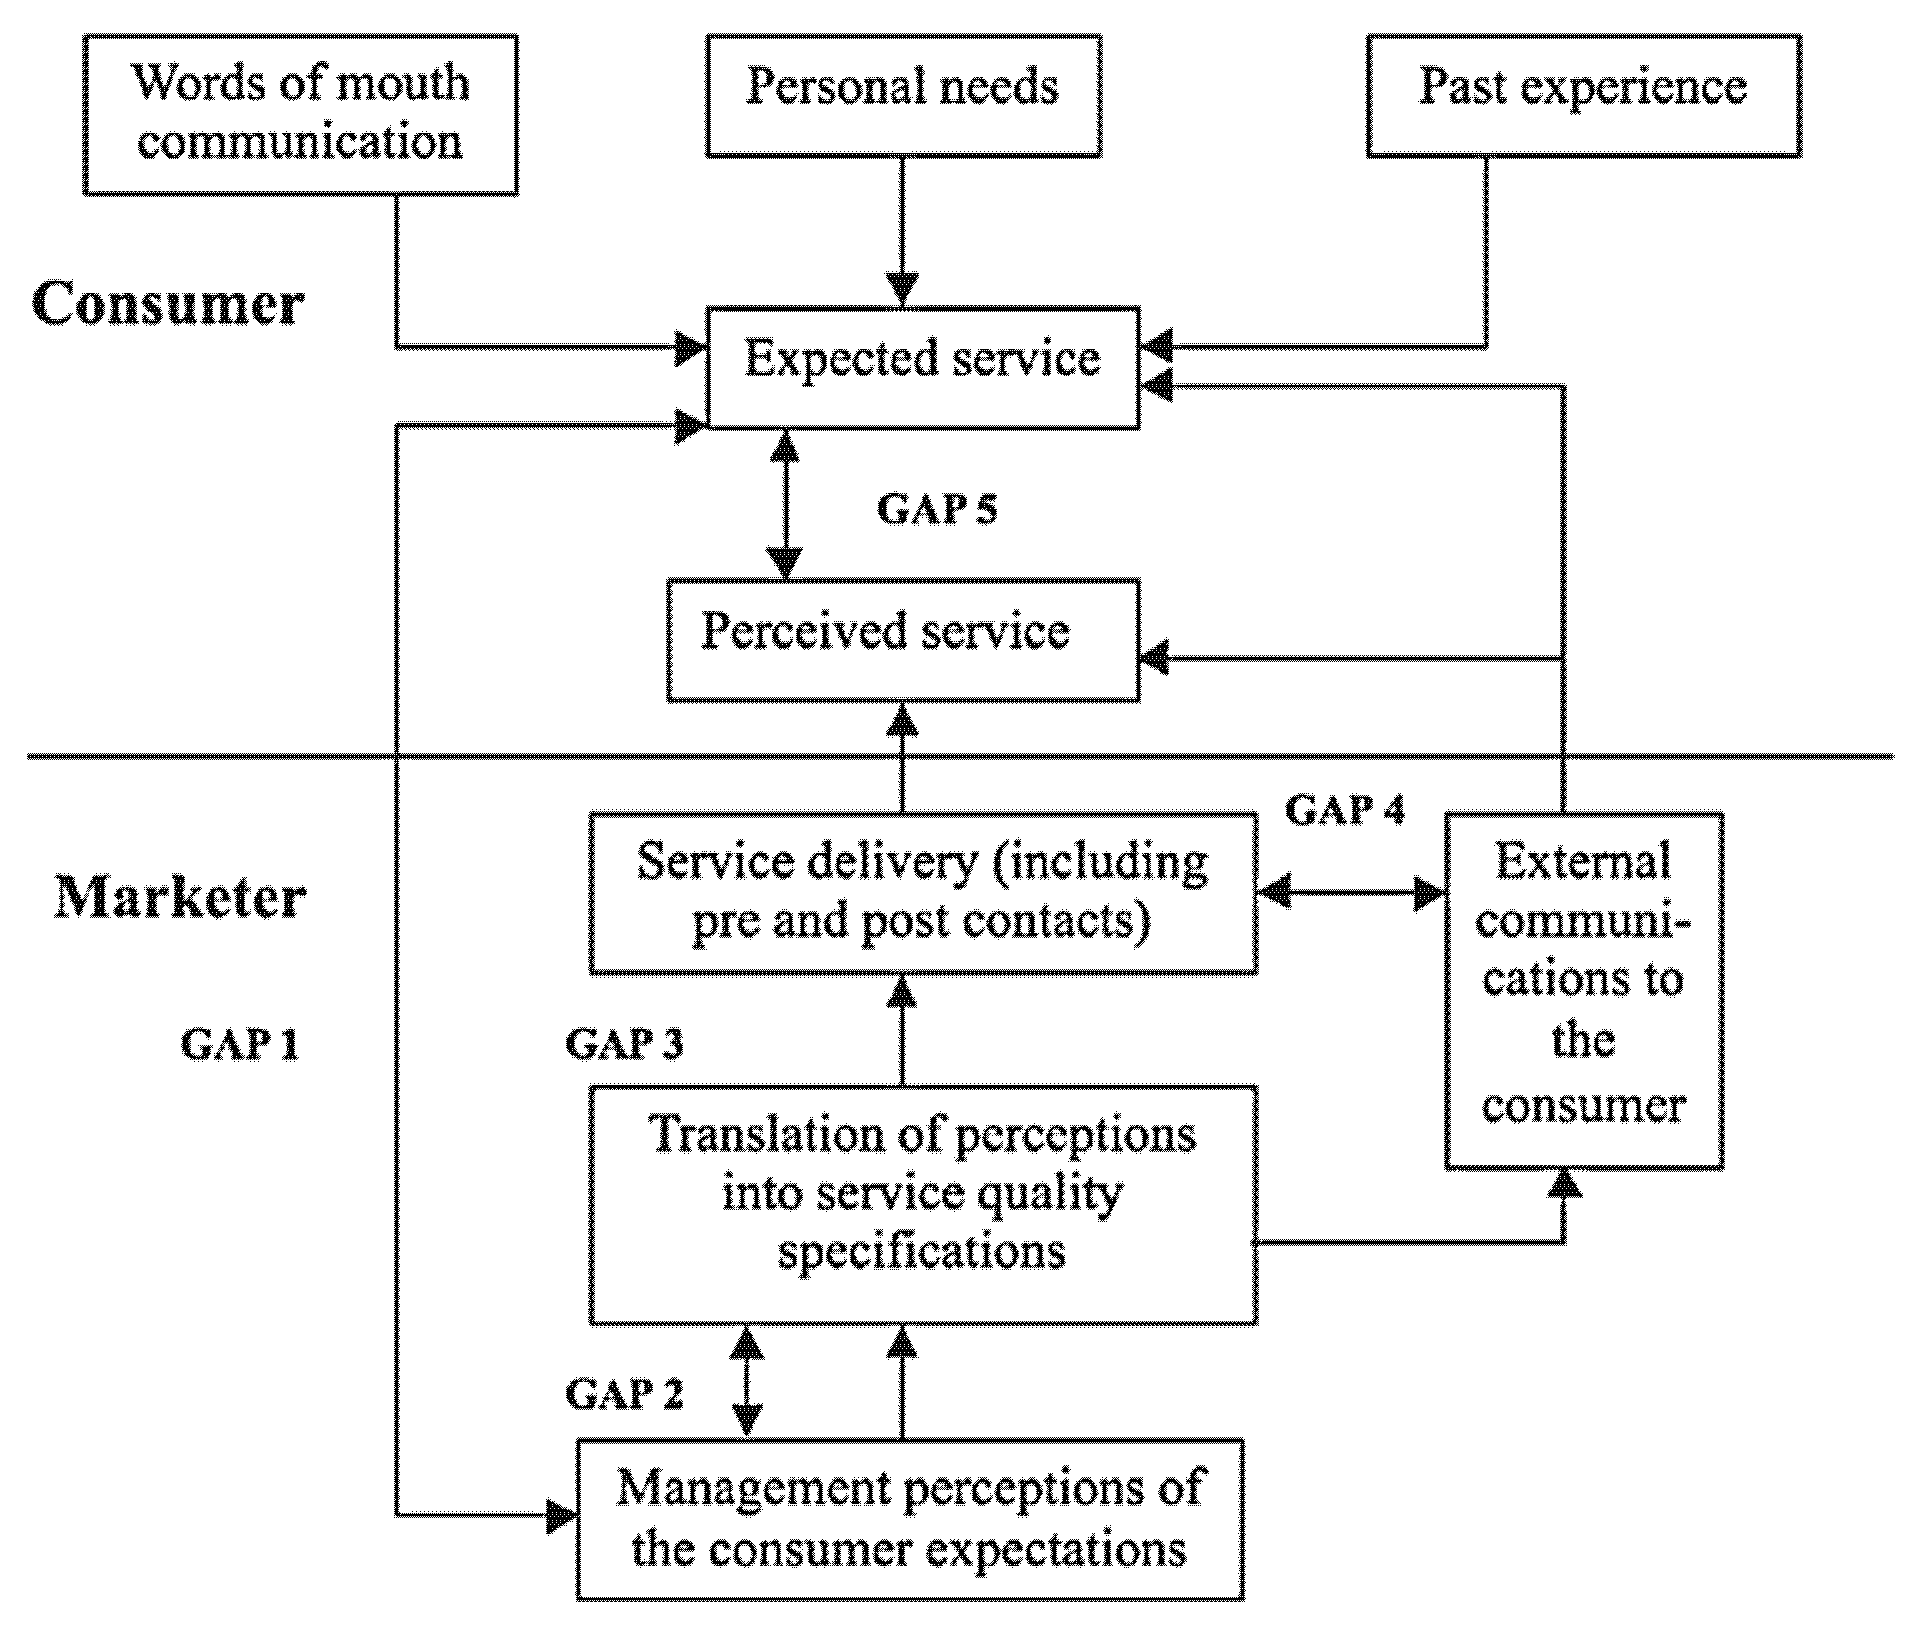
The measurement of service quality is an important factor in creating a competitive advantage and requires an effective model. Many models aim to serve this purpose, with the most popular one being SERVQUAL, introduced by Parasuraman in 1985 (Figure 6). This model aims to analyze gaps between suppliers’ expectations about customers’ perceptions and what the customers perceive in reality. These gaps are measured using variables to evaluate five main components: reliability, responsiveness, assurance, tangibles, and empathy.
Qualitative research: The authors mainly used this method to collect relevant documents on service quality of supermarkets, evaluation models of supermarket service quality, and scales previously used by researchers. This method was also used through group discussions and in-depth interviews with experienced experts in the management of supermarkets to build a preliminary scale and an official scale for this study. The 5-point Likert scale is used to assess customer satisfaction when shopping and using services at supermarkets according to convention: (1) very dissatisfied, (2) dissatisfied, (3) normal, (4) satisfied, and (5) very satisfied.
Construction of scale: Based on the research question, theoretical studies, and successful studies in the field of retail supermarket management, the authors defined the research objective to propose a model for this study. By researching scales used in previous studies, they proceeded to build a preliminary scale. The authors carried out group discussions and interviews with experts with many years of experience in the management of supermarkets for preliminary scales and conducted a preliminary survey of 30 customers to build the official scale. After the official scale was completed, the authors collected data by surveying customers purchasing and using services at Co.opmart supermarkets in Ho Chi Minh City.
Sampling method and sample size: Living near supermarkets was a geographical advantage for the authors; thus, sampling and surveying were carried out relatively conveniently. In order to conduct this study, the authors adopted random sampling with a convenience method and distributed 350 questionnaires. The survey subjects were individual customers who had used the services of supermarkets in Ho Chi Minh City from 18 September 2021; when enough samples had been collected, the authors synthesized the data and applied further analysis.
Method of data analysis and processing: in this study, the authors distributed a total of 350 questionnaires, of which four were invalid due to a lack of information. The authors eliminated these four questionnaires and retained the 346 valid ones. They coded, numbered, and processed the data using SPSS 22.0 software according to the following steps:
- Step 1:
- Test of Cronbach’s alpha reliability coefficient: Corrected item: Total correlation > 0.3; Cronbach’s alpha ≥ 0.6 (Nunnally and Bernstein 1994).
- Step 2:
- To test the scale using an exploratory factor analysis (EFA), a principal component analysis and Varimax rotation were employed to identify the factors representing variables that affect customer satisfaction when purchasing and using services at supermarkets based on the following conditions: Kaiser–Meyer–Olkin (KMO) ≥ 0.5; significance level (Sig.) < 0.05; initial eigenvalues > 1 (Gerbing and Anderson 1988); factor loading ≥ 0.5 (Hair et al. 1998).
- Step 3:
- Regression analysis: The authors used regression analysis to evaluate the correlation between factors affecting customer satisfaction when purchasing and using services at supermarkets, thereby assessing the impact of each independent factor on the dependent factor. The factors were tested according to the following conditions: significance level (Sig.) < 0.05; VIF ≤ 10.
Independent factors are as follows:
- Facilities and equipment (FE): all infrastructure and equipment such as cashier desks, counters, cooling devices, storage devices, parking lots, etc. Due to the specificity of the supermarket sector, the customers no only come for shopping but also pay attention to checking products, entertainment services and eating. For that reason, the improvement in facilities satisfies the customer’s needs and improves service quality.
- Quality of goods (QG): the customer’s perception of goods that were purchased at a supermarket based on their physical and chemical properties, characteristics, and value. If these attributes meet the customers’ expectation, they will be satisfied. Therefore, supermarkets need to meet needs based on customers’ expectations to improve the service quality of the supermarkets.
- Safety (SY): the desire to be safe and protected from dangers and mental or physical threats. When purchasing and using services at supermarkets, customers always expect higher needs for security and safety for themselves to feel as comfortable and relaxed as possible in decision-making for choosing goods and using the services of supermarkets.
- Resolve complaints (RC): it is challenging to avoid customers’ complaints in the environment of the supermarket business. Therefore, the staff needs to be trained and equipped with necessary skills to handle and flexibly apply what they are taught about customers’ complaints to improve the service quality of supermarkets.
- Staff (ST): those who directly advise, introduce goods, and answer questions of customers. A supermarket with excellent staff who can perform customer service well will improve the business efficiency of the supermarket and achieve high revenue and profits. Especially since the competition between supermarkets is increasingly fierce, the emphasis is on the staff’s important role in improving the quality of customer service.
Dependent factors used in this study:
- Satisfaction (SA): This is the most important factor that determines a supermarket’s success or failure. Solutions for customer satisfaction are the top priority of all supermarkets. Moreover, in a developed market economy with increasingly fierce competition between supermarkets, to survive and expand market share, supermarkets should develop a professional customer service in the stages of pre-sales, during the sale, and post-sales instead of only focusing on the quality of products.
3.2. Binary Logistic Model
A regression analysis is a statistical analysis method used to determine the impact of independent variables on the dependent variables. Regression analysis methods include linear regression, binary regression, and Poisson regression, each of which is used for different types of variables. In a binary regression, a popular method used to calculate the probability of an event, the dependent variable has only two possible values (i.e., 0 or 1), reflecting two probabilities—namely, possibly happening and impossibly happening (Nguyen 2021). The binary logistic regression has the form:
where:
- Pi: The probability that customers repeat using services of the supermarket system.
- β0, β1, β2, β3, β4: The regression coefficient reflects the degree of impact of independent factors.
- X1: Age of customers
- X2: Education level
- X3: Income
- X4: Distance
In this study, the authors used the binary logistic regression to determine the impact of the independent factors: age of customer (AG); academic level of customer (AC); income (IN); distance from the customer’s residence to the supermarket (DI) on the decision to repeat use of supermarket’s services. The survey subjects are 475 individual customers who have used the services of supermarkets in Ho Chi Minh City from 18 September 2021; when enough samples were collected, the author synthesized the data and applied further analysis.
3.3. Grey Forecasting Model
All enterprises aim to minimize costs and maximize profits in the market economy, leading to extremely fierce competition. Among enterprises in the same industry with the same business product, those with good-quality products at low cost will obtain a better competitive advantage compared to the others. The reduction of costs will bring about the minimization of waste in production. Therefore, the forecasting of essential resources for enterprises is extremely decisive for success or failure because it provides the information and data necessary for managers’ best preparation of business and production plans. The forecasted data will be the foundation for enterprises’ managers to build policies, prepare materials, and make decisions related to production and business as well as financial and personnel policy-making.
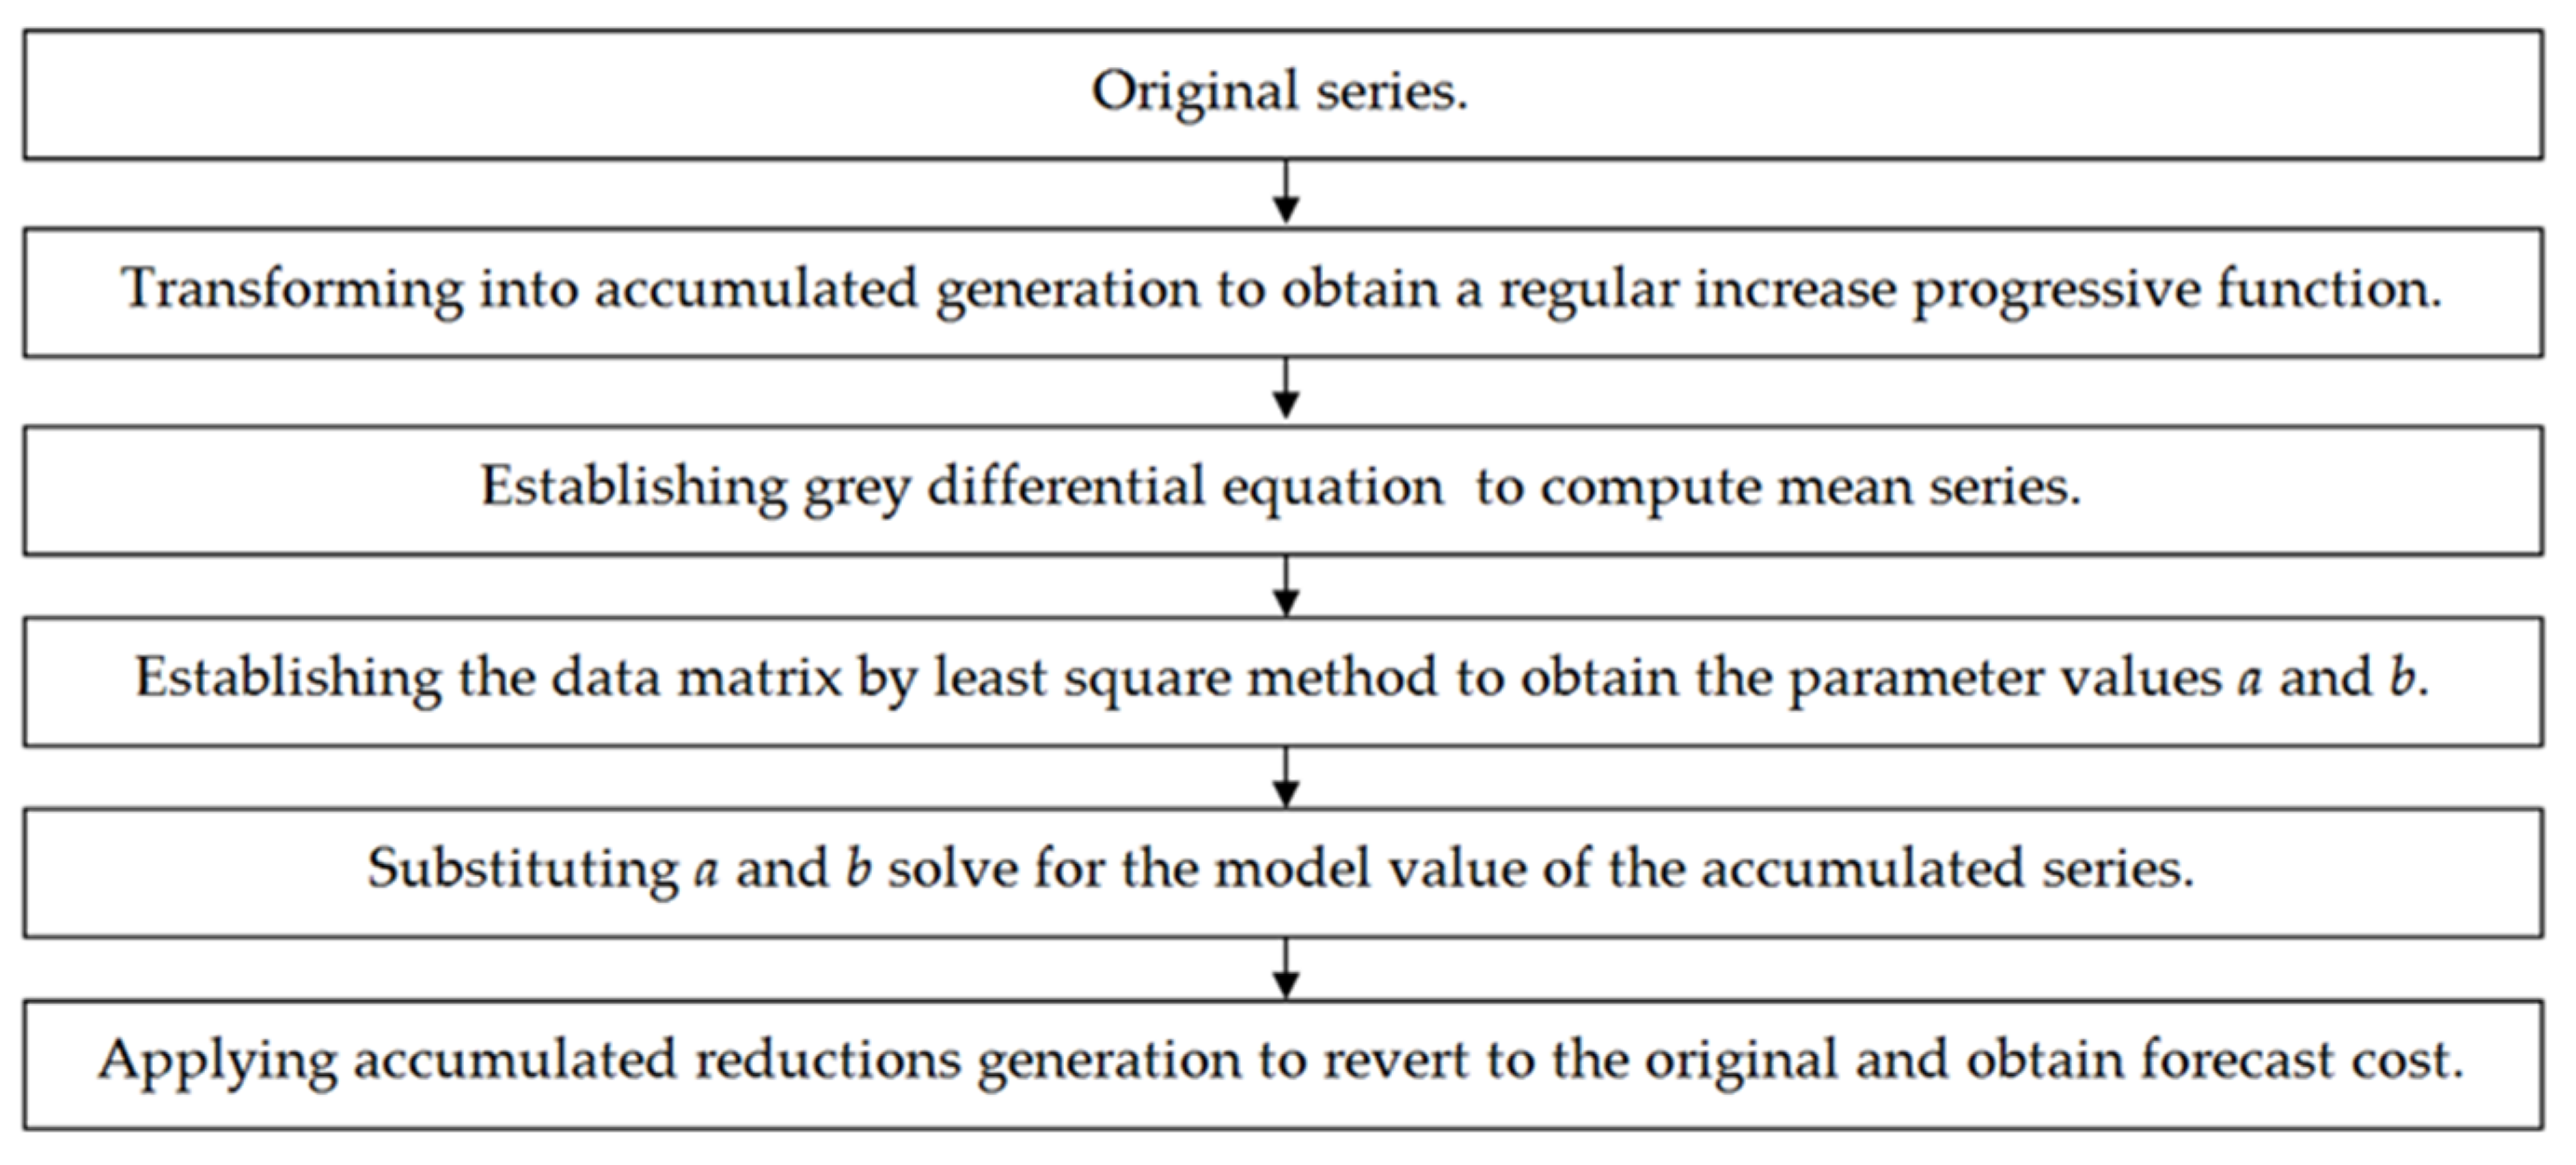
Researchers have proposed various forecasting methods with different advantages and limitations. In (Deng 1982), Professor Deng Julong introduced the Grey system theory, which uses a small sample size and an incomplete information system. Since its introduction, the Grey system theory method has become increasingly popular and has been widely applied in many fields worldwide, such as economic sciences, society, production, and engineering. The GM (1, 1) forecasting model is one of the most commonly applied models in the Grey system theory. The GM (1, 1) model carries out forecasting using the following method as Figure 7 (Nguyen 2021):
In this study, the authors use actual data from the Supermarket Management Corporation for the period 2017 to 2020 and the GM (1, 1) model to forecast the business situation of the corporation for 2021 to 2024, supporting decision-making that directly affects supermarkets’ policy-making. In particular, the authors analyzed several key indicators, as follows:
- FAC1: Cost of goods sold (million VND).
- FAC2: Business administration cost (million VND).
- FAC3: Total assets (million VND).
- FAC4: Equity (million VND).
- FAC5: Net Revenue (million VND).
- FAC6: Profit after tax (million VND).
- FAC7: Basic earnings per share (VND).
According to the data in the balance sheet, the above indicators reflect an overview of the business situation of the enterprise. The cost of goods sold, management costs, net sales and profit after tax, and basic earnings per share are indicators that provide investors and managers with business insights in order to make strategic and financial decisions on corporate investment. The forecasting model combines with the SERVQUAL model and binary logistic model to form a 3-dimensional reference system that provides managers and investors with a multi-dimensional view of the supermarket’s business situation, thereby bringing high efficiency to management and investment decisions.
3.4. Evaluation of Volatility Forecasts
In general, forecasting aims to predict the future based on experience or original data using computational models. Therefore, the results are only relatively accurate for reference. In this study, the authors used MAPE (ε) to evaluate the forecasting quality, ensuring that any errors are within allowable tolerance levels and conform to the rules (ε ≤ 10%: Excellent; 10% < ε ≤ 20%: Good; 20% < ε ≤ 50%: Qualified; ε > 50%: Unqualified) (Nguyen 2021). The error is calculated as follows:
4. Results
4.1. Statistical Results on Customer Reviews about Service Quality in Supermarkets
The results in Table 1 reflect the customer’s assessment of the service quality of the supermarket according to each criterion (according to convention: (1) very dissatisfied, (2) dissatisfied, (3) normal, (4) satisfied, and (5) very satisfied. This result reflects that factor SA4 has the highest customer rating (3.98/5) and factor SY1 has the lowest customer rating (3.14/5); average rating of the factors is 3.6/5. This result reflects that the service quality of supermarkets is relatively good at present. However, in the current period, businesses are competing with each other to gain customer’s trust and loyalty, especially in the service industry and retail supermarkets. Therefore, supermarket managers need to develop solutions to preserve and improve service quality to attract new customers and expand business while still being able to keep the loyalty of previous customers.
4.2. EFA Results
4.2.1. Cronbach’s Alpha Results
Cronbach’s alpha is the method used by the authors to determine the appropriateness of the observed variables for a certain factor in the study. The evaluation condition is that Cronbach’s alpha is >0.6. The obtained results for the reliability coefficients obtained through Cronbach’s alpha method for the six factors in this study are shown in Table 2.
4.2.2. EFA of Independent Variables
The results of Cronbach’s alpha test demonstrated the reliability of factors used in this study. The authors also used principal component analysis and Varimax rotation to identify factors representing variables that affect customer satisfaction when purchasing and using services at supermarkets.
According to the results shown in Table 3, the coefficient for KMO is 0.872 (0.5 < 0.872 < 1); Sig. = 0.000 < 0.05. These results indicate that the data set in this study used for the exploratory factor analysis is completely appropriate and the observed variables are correlated with each other and significant for the representative factor.
The results in Table 4 show that six factors explain 63.002% of the variation in factors affecting customer satisfaction when purchasing and using services at the supermarkets. In particular, observed variables with a load coefficient <0.5 were excluded. The remaining observed variables that met conditions were classified into groups representing the factors, as shown in Table 5.
4.2.3. EFA of Dependent Variables
Next, the authors analyzed the KMO and Bartlett’s test for the customer satisfaction factor on goods and service quality at the supermarket used in this study. The results are shown in Table 6.
According to the results shown in Table 6, the coefficient of KMO is 0.694 (0.5 < 0.694 < 1); Sig. = 0.000 < 0.05. These results indicate that the survey data used for exploratory factor analysis were completely appropriate and the observed variables were correlated with each other and significant for the customer satisfaction factor.
The results in Table 7 indicate that the factor of customer satisfaction with the supermarket’s goods and services explained 50.412% of the data variation. This customer satisfaction factor consists of four observed variables, all with load coefficient >0.5, conforming to the required conditions.
4.2.4. Linear Regression Analysis
After completing the test steps for independent and dependent factors to ensure that the data collected in this study were completely consistent with the research and analysis method, the authors used six independent factors and one dependent factor for the regression analysis. The results are shown in Table 8.
According to the results from Table 8, the adjusted R squared is 0.504 (R squared = 0.512), which shows that the six independent factors in the model explained 50.4% of the variation of dependent factors; the remaining 49.6% were the consequence of factors outside the model and random errors. These results demonstrate the appropriateness of the model used in this study. The Durbin-Watson coefficient is 1.607, showing that the model has no first-order autocorrelation between adjacent factors.
The result Sig. = 0.000 (Sig. < 0.05) in Table 9 affirms that the multiple linear regression model and the data set in this study are completely consistent.
The results in Table 10 show that the factors quality of goods (X2), staff (X3), safety (X4), and facilities and equipment (X5) all have Sig. = 0.000 (Sig. < 0.05), thereby confirming that the independent factors X2, X3, X4, and X5 have an impact on the dependent factor (customer satisfaction when purchasing and using services at supermarkets). In addition, return policy (X1) and resolve complaint (X6) factors have Sig. = 0.193 and Sig. = 0.622 (Sig. > 0.05), respectively, indicating that these independent factors have no impact on the dependent factor (Y). After removing X1 and X6, the authors obtained the following regression equation:
The components in the regression model mean that if other factors remain unchanged, then:
When the quality of goods factor changes by 1 unit, the customer satisfaction changes by 0.236 units.
When the staff factor changes by 1 unit, then customer satisfaction changes by 0.164 units.
When the safety factor changes by 1 unit, then customer satisfaction changes by 0.181 units.
When the facilities and equipment factor changes by 1 unit, then customer satisfaction changes by 0.220 units.
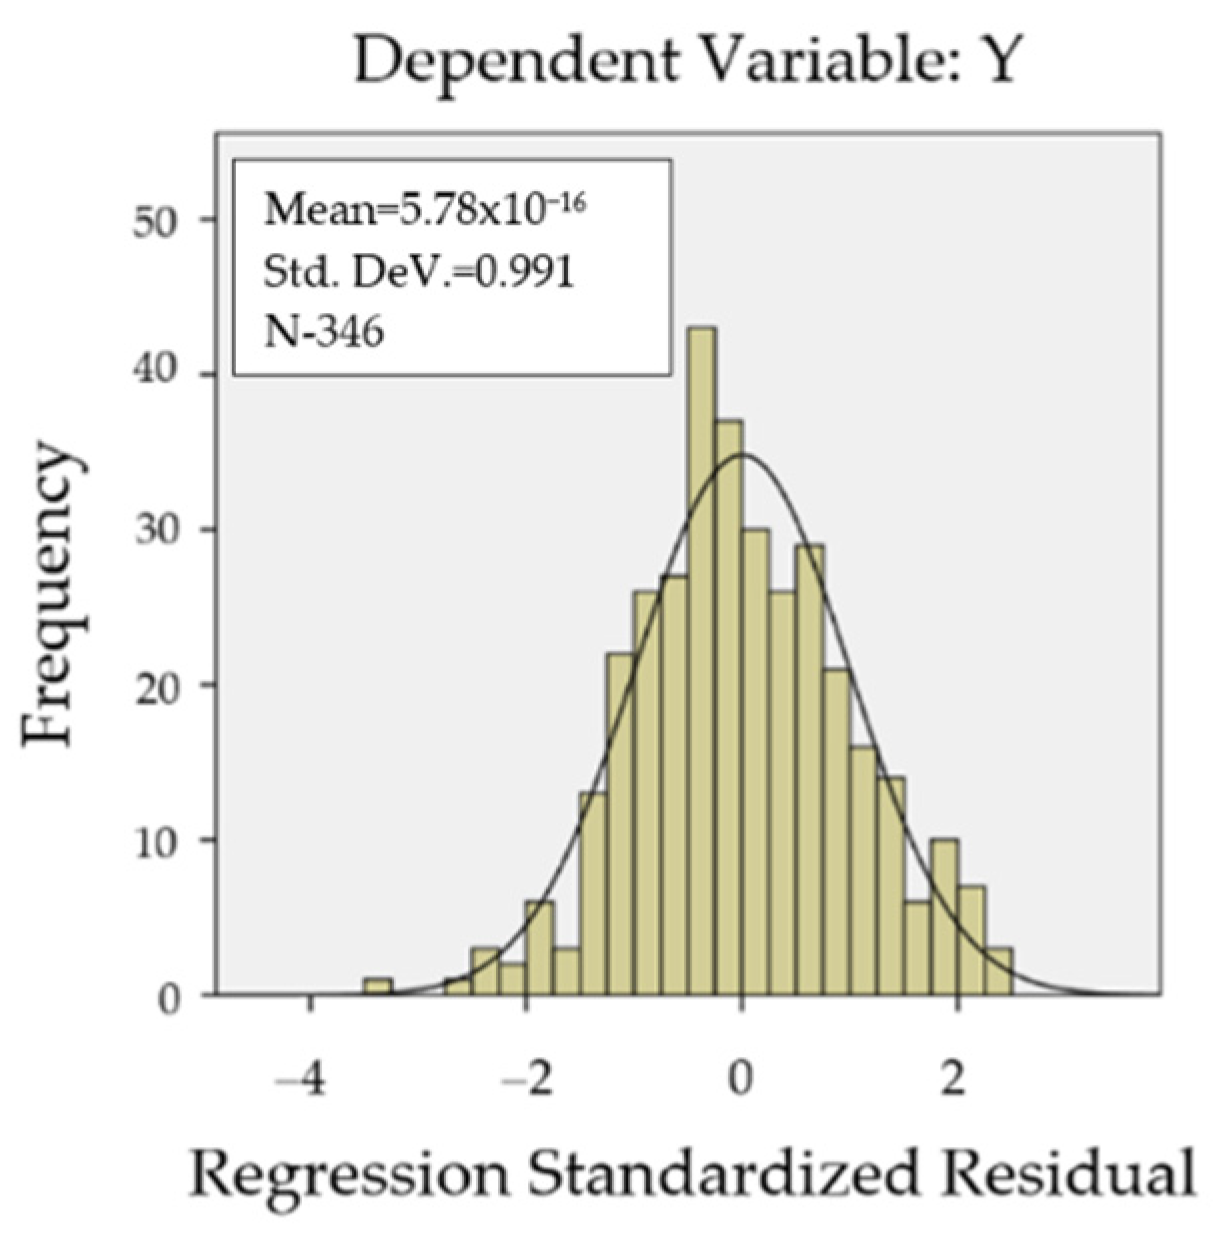
The results shown in Figure 8 indicate that mean = 5.78 × 10⁻¹⁶ ≈ 0.000 and standard deviation = 0.991 ≈ 1. Thus, the distribution of residuals in this study is approximately normal, and the assumption of the normal distribution of residuals in this study is acceptable.
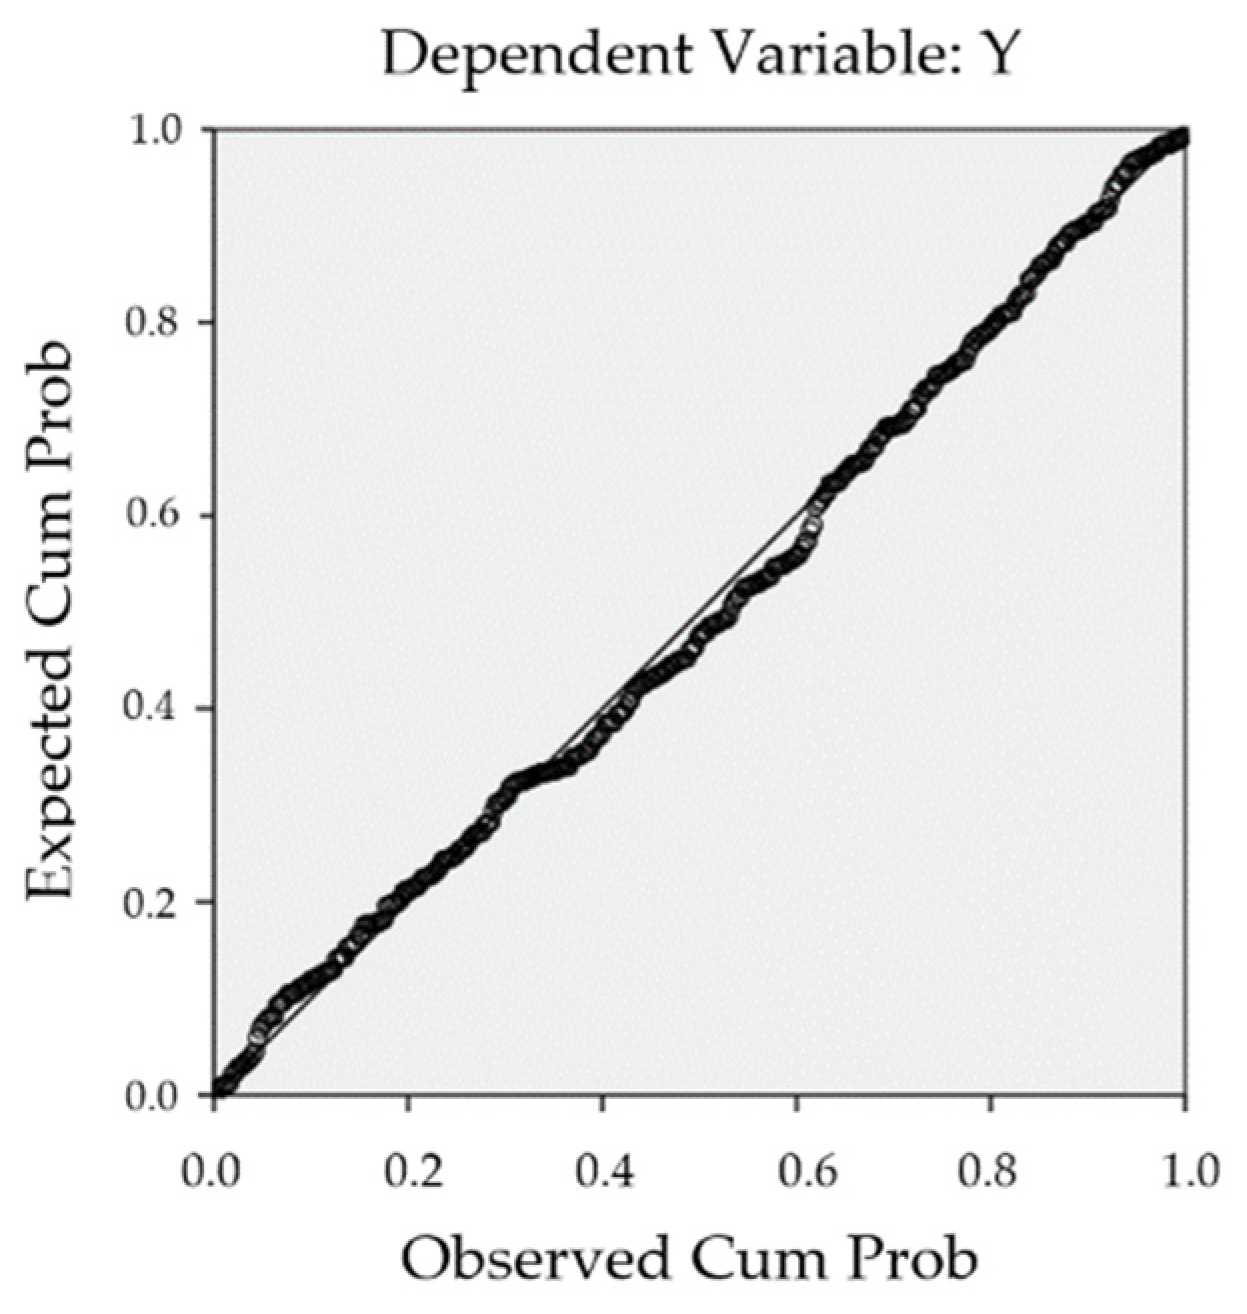
According to Figure 9, the residual data points are mainly distributed along the diagonal line, which means that the residuals in this study have an approximately normal distribution; thus, the assumption of the normal distribution of the residuals in this study is acceptable. These results are completely consistent with those in the histogram.
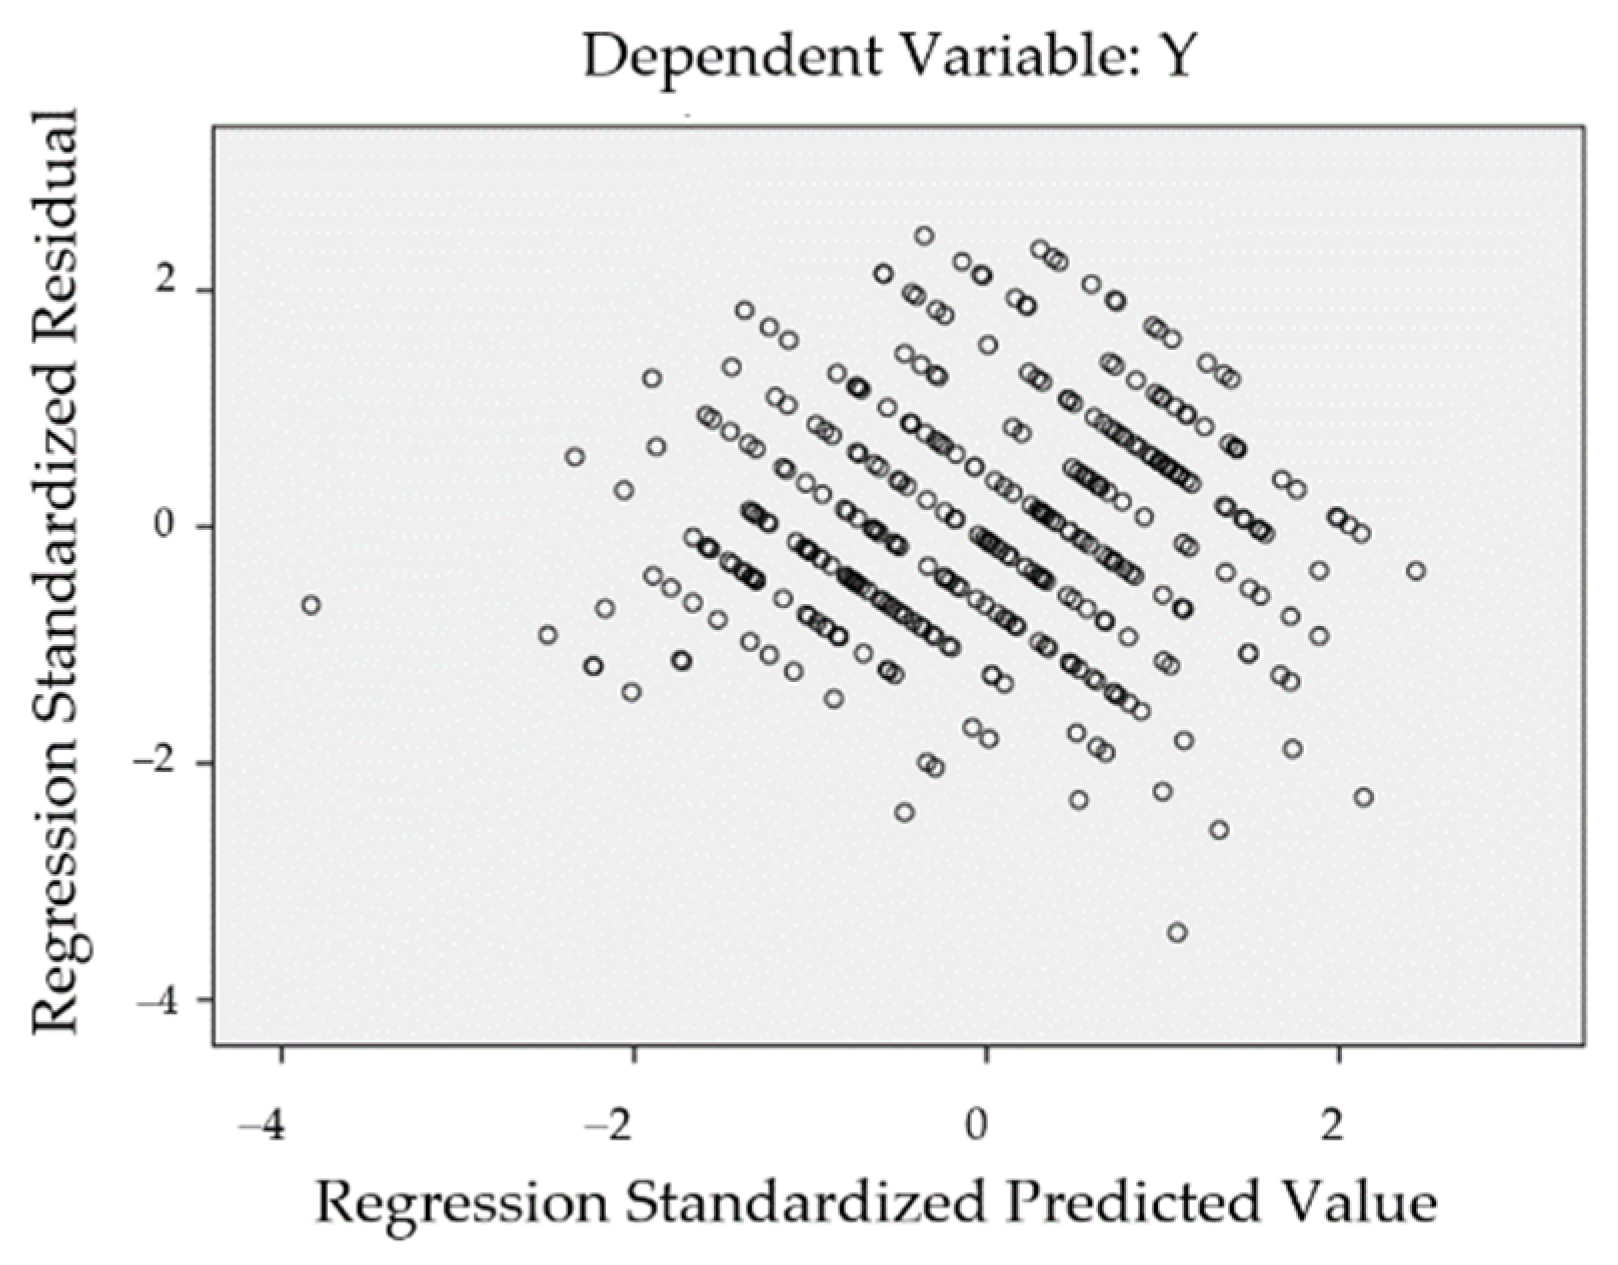
In the test for the assumption of a linear relationship, the results shown in Figure 10 specify that the normalized residuals are distributed around the zero-coordinated axis, reflecting that the assumption of the linear relationship is not violated.
In the retail market, there are many competitors who use ordinary methods such as discounts and promotions to attract customers, potentially creating many risks of customers changing their shopping destination. The results of this research will provide the basis data for supermarkets to develop strategies to acquire more loyal customers, prevent the risk of losing potential customers, and ensure business revenue and profits.
4.3. Results of Binary Logistic Model
Supermarkets spend a lot of time and money investing in advertising and marketing to attract new customers, but solving the problem of retaining customers does not require as much time and cost. Therefore, the authors used the binary logistic model to determine the factors affecting repeated purchase and use of services at supermarkets. In the binary logistic model, the repeated purchase and use of services at supermarkets factor was assigned two values: 0, representing customers who do not repeatedly purchase and use services at supermarkets, and 1, representing customers who repeatedly purchase and use services at supermarkets. In order to determine the factors affecting the customers’ decision to repeat the purchase and use of services at supermarkets, the authors conducted a survey and collected data on four independent variables, specifically: age of customer (AG); academic level of customer (AC); income (IN); and distance from the customer’s residence to the supermarket (DI). The authors researched the impact of these independent factors on individuals’ decisions to repeatedly purchase and use services at supermarkets, obtaining the following results:
According to the results summarized in Table 11, the authors surveyed 475 customers who had purchased and used services at supermarkets. All surveyed customers provided complete data without any invalid questionnaires. The authors analyzed the data as follows:
The results are shown in Table 12: Sigtep = 0.002; SigBlock = 0.002; and SigModel = 0.002 (0.002 < 0.050). With 95% reliability, these significant coefficients reflect the statistical significance of the regression model used in this study.
The results in Table 13 show the classification of decisions of two groups of customers according to the two criteria as actual observations and predictions. According to the results, among 152 customers in the group who failed to repeat the use of services, eight customers predicted that they would not repeat the use of services, which means that the correct prediction rate is 5.3%. Among the 323 customers in the group who decided to repeat the purchase and use of services at the supermarket, 319 customers repeated the use of the service, corresponding to the correct prediction rate of 98.8%.
With 95% confidence, the results of the binary logistic model in Table 14 show that three of the four factors used are statistically significant—namely, SigAG = 0.015; SigAC = 0.031; and SigIN = 0.032 (<0.05). This result reflects that the factors, including age, academic level, and income, have an impact on the decision to repeat the purchase and use of services at the supermarket. The DI factor has Sig. = 0.643 (0.643 > 0.05), failing to meet the required confidence level in this study, which means that current customers mainly reside near the supermarket, so the geographical distance does not affect the decision to repeat the use of the services at the supermarket. Therefore, the authors built the binary logistic model as follows:
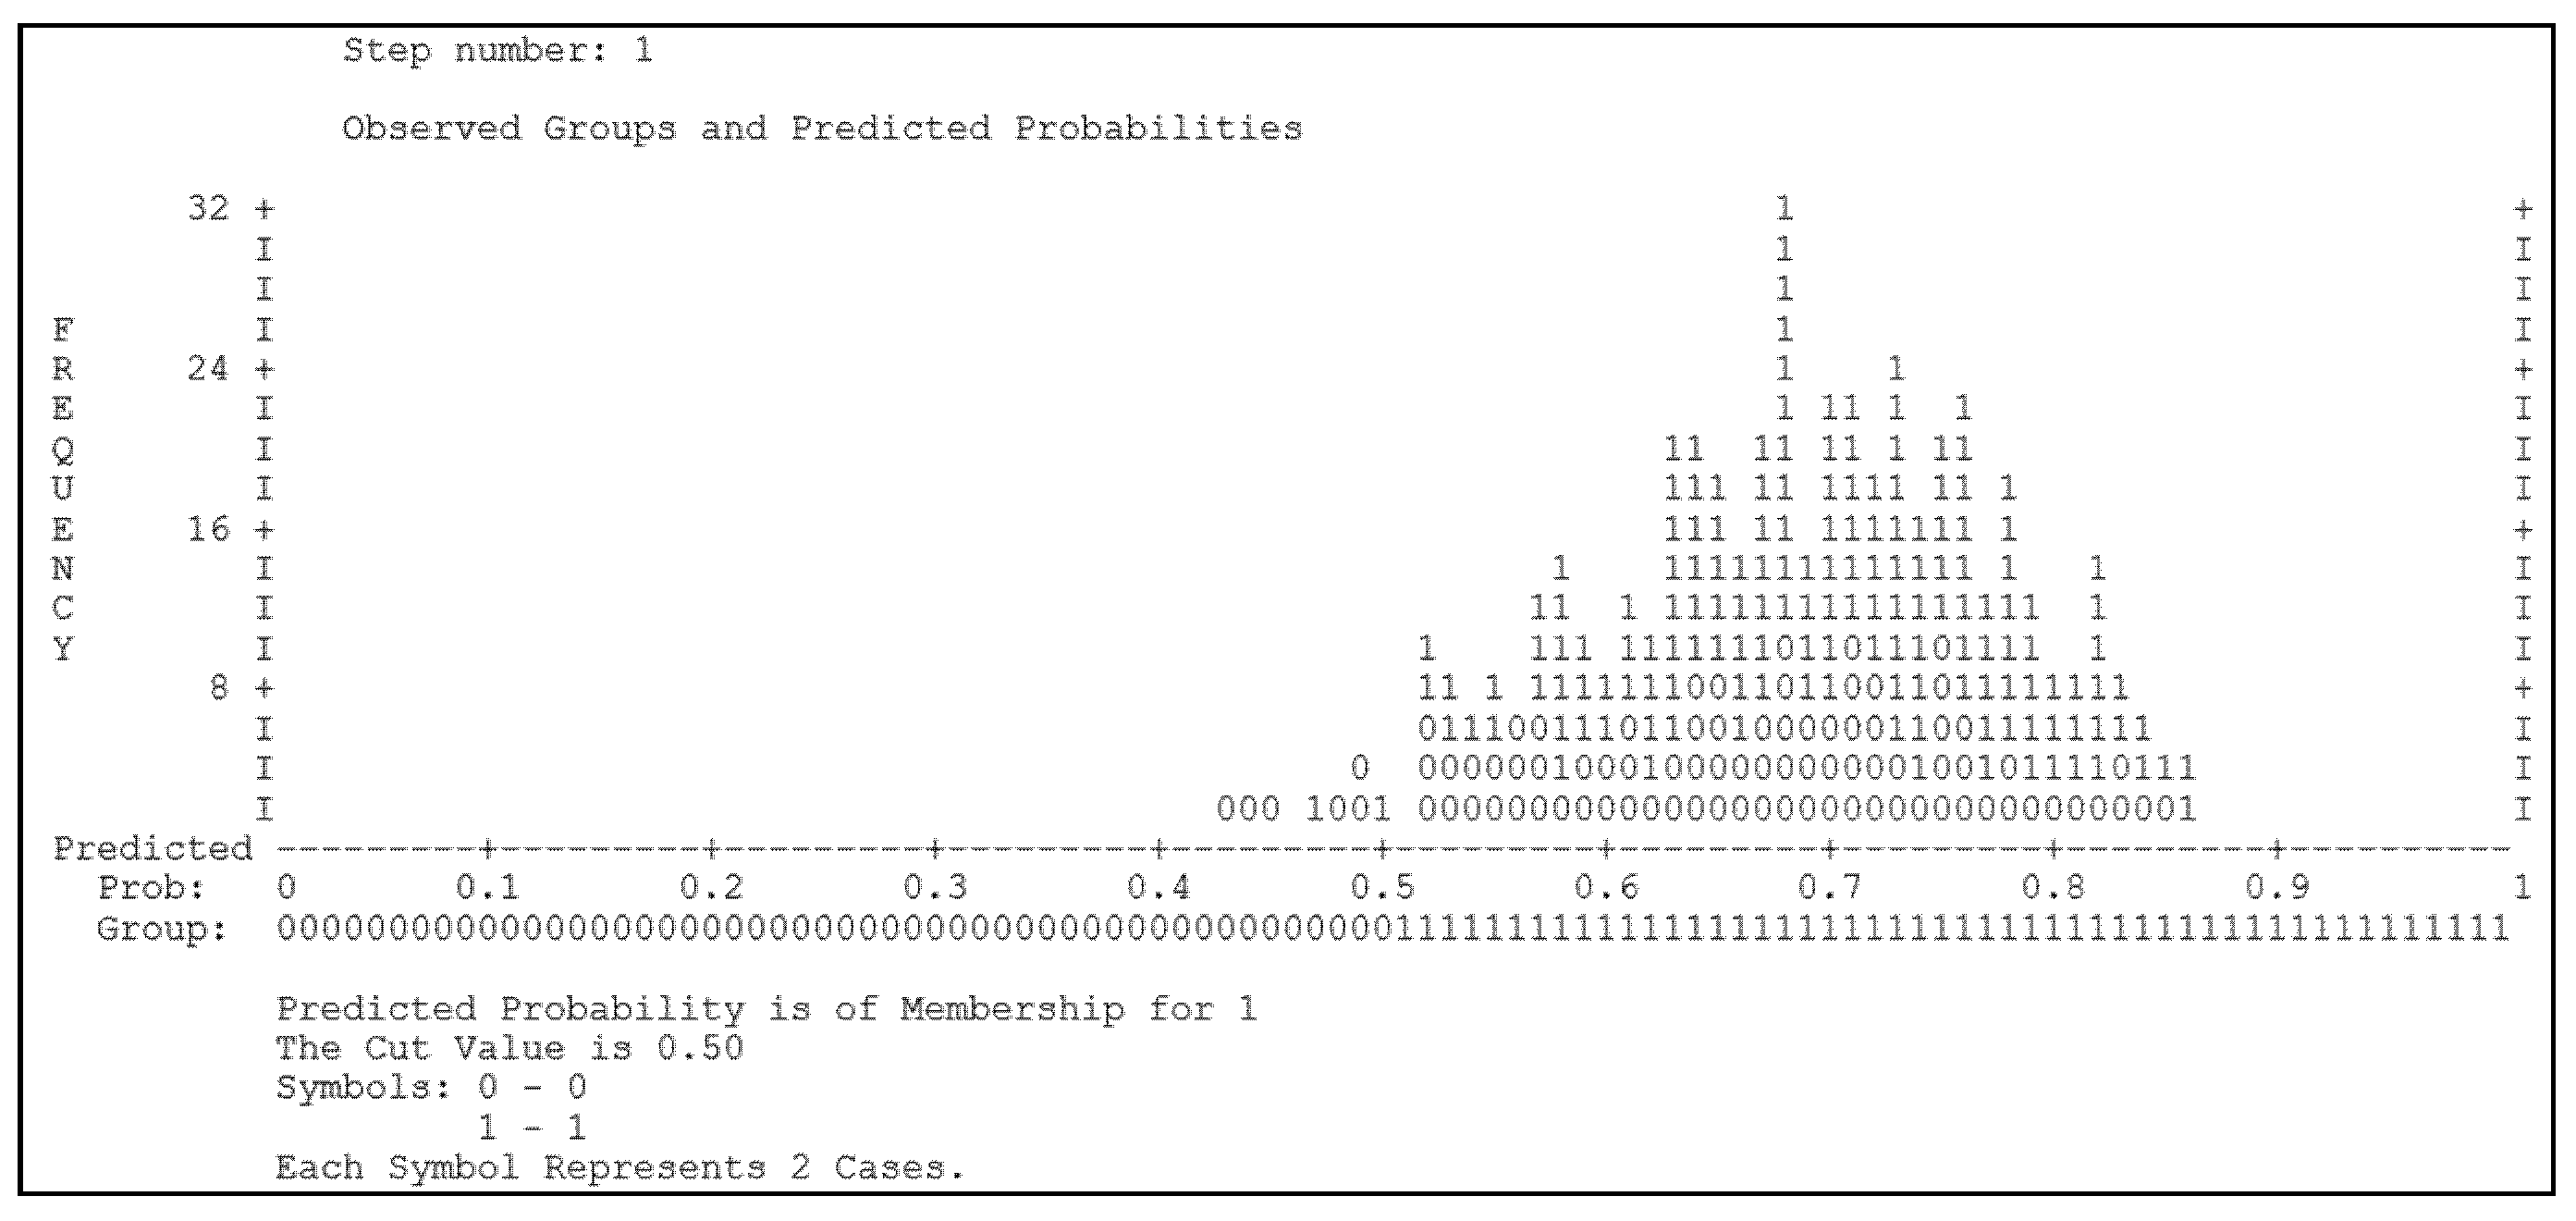
According to the model’s results, the older customers are, the more loyal they are to purchasing and using services at the supermarket. In addition, the higher the customer’s academic level is, the more they consider their decisions to change to another shopping place and often tend to repeat the use of services at the supermarket. However, the income factor has the opposite effect on the repeated use of services at the supermarket, which means that the higher one’s income is, the more a customer tends to change shopping places to access better products and customer service policies (observed group predicted probabilities in Figure 11). Recently, the COVID-19 pandemic has significantly changed customers’ needs for purchasing and using services at supermarkets. However, supermarkets are currently confused about adapting to this change. This result indicates that supermarkets need to keep a close eye on each customer in order to innovate their approach and customer service methods to protect their image and reputation.
In supermarket management affairs, the identification of factors affecting the customers’ decision-making processes related to the repeated use of the supermarket’s services will support the customer service department in easily selecting the correct target customer group. In a large market with an abundant number of customers, it is important to identify the target customer group to apply timely and effective solutions in customer retention and turn this customer group into loyal customers. Focusing on one target and one customer group will improve the quality of marketing and make customer management of the supermarket for this customer group more flexible, thereby achieving the highest efficiency and reducing costs for the supermarket.
4.4. GM (1, 1) Results
The COVID-19 pandemic has significantly affected the global economy in general and Vietnam in particular, presenting unprecedented challenges. The stagnation of production and business, the unemployment of thousands of workers and reduced income have caused numerous difficulties for retailers. Saigon Co.op has been proactive in adjusting business activities to adapt to the current situation and gradually returning to stability. According to supermarket’s 2020 financial statement, the revenue from business activities reached 39.5 billion VND, an increase of 7.1% compared to the set-out plan and higher than that of the previous year (2019). Profit after tax was recorded at 24.1 billion VND (2020), which is a slight decrease compared to 2019 and is partly due to the decrease in revenue from financial activities: 33.4 billion VND in 2020 versus 43.7 billion VND in 2019. Table 15 summarizes the business situation of supermarkets as follows:
In general, the supermarket business still shows positive signs compared to the overall national economy under the influence of the pandemic. In order to provide supermarket managers with a solid foundation to develop strategies and suggest measures to adjust the business activities for the greatest business efficiency, the authors used the Grey model in this study to forecast the key indicators for the business situation of supermarkets for 2021 to 2024. They used data on total assets of supermarkets (FAC3) from 2017 to 2020 to explain the forecasting procedures for the business situation of supermarkets from 2021 to 2024 as follows:
Using data on business results from 2017 to 2020, the authors established the original value chain:
The authors used the cumulative sum to calculate the values X(1):
Then, the average values Ζ(1) were calculated as follows:
Based on these values, the authors completed a system of equations with two unknowns, a and b, as follows:
Matrices were developed to identify the values of a and b as follows:
Then, a differential equation was built according to the values of a and b obtained, as follows:
This resulted in the following forecasting equation:
Substituting the values of k (k = 0; 1; 2; 3; 4; 5; 6; 7), in turn, into the equation above to forecast the key indicators:
The calculations from the preceding steps enabled the authors to obtain the forecasting results for the key indicators for the business situation of supermarkets from 2021 to 2024 in the Table 16 as follows:
To evaluate the accuracy of the forecast results, the authors used Formula (2) to calculate the forecast error in the GM (1, 1) model and obtained average (ε) = 2.46%. This error shows the high reliability of the forecast values in this study (2.46 < 10%). The managers of supermarkets can use this result as the basis for strategic planning from 2021 to 2024. The forecast data from the GM (1, 1) model provides the foundation for supermarkets to achieve the most effective strategic planning, which plays an important role in promoting their development and creating a competitive advantage over competitors through initiative and flexibility in quickly serving and responding to customers’ needs. Furthermore, it supports the flexible and synchronous performance of the supermarket’s logistics management activities, import of goods, transportation, warehousing, customer consulting and customer service so that the supply chain can operate at the highest efficiency, avoiding the risk of supply chain disruptions and failing to promptly respond to customers’ needs.
5. Conclusions and Discussion
5.1. Conclusions
The research results show that the quality of goods is the factor with the strongest impact on customer satisfaction when purchasing and using services at supermarkets. Therefore, supermarkets need to coordinate with reputable trademarks, brands, and suppliers to provide high-quality products and goods to customers when poor-quality products are still accessible in the market. The negative effect of poor-quality products on consumers is very severe, directly affecting their health and finances. In particular, poor-quality products reduce customers’ trust in the transparency of the goods market and result in a bad effect on the reputation of famous trademarks, brands, and suppliers. Therefore, managers of supermarkets need to research and develop a variety of suitable and flexible sales and payment methods to meet customers’ needs. Specifically, they should establish online sales channels, implement demand-stimulus activities to encourage consumers’ shopping activities, develop promotional and discount programs to facilitate consumers’ purchase and use of services at supermarkets when their income is heavily affected due to the COVID-19 pandemic, and research and carefully evaluate supermarkets’ expenses in order to cut unnecessary costs and increase profits. In addition, the facilities and equipment factor showed a significant impact on customer satisfaction; thus, managers need to invest, develop, and promote the digitalization and application of information technology in management to ensure the better operation of sales and customer service. The customer service department also needs to build a database of customers including their age, academic level, income, and geographical distance, as such information is important for building strategies to enhance customer service, thereby retaining customers and encouraging them to make repeat purchases and repeatedly use services at supermarkets. The results of this study help supermarkets to manage daily risks in better meeting customer needs and potential risks along the supply chain in stockpiling goods to avoid shortages of goods during the COVID-19 pandemic. Based on these results, we recommend actions to reduce risk and ensure supply chain continuity for supermarkets.
5.2. Discussion
In this study, the authors simultaneously used three models—the SERVQUAL model, the binary logistic model, and the Grey forecasting model—to provide supermarket managers with a multi-dimensional view of supermarket service quality (i.e., past, present, and future). The authors carefully carried out this study with a large number of survey samples, thoroughly evaluating the factors affecting customer satisfaction with service quality when purchasing and using services at the supermarket. The authors combined qualitative and quantitative research methods in the SERVQUAL model to identify the factors affecting customer satisfaction with the supermarket’s service quality. The results of the binary logistic model identified the factors affecting customers’ decision-making related to repeating purchases and use of services at supermarkets. The results from the Grey forecasting model provided the most important indicators for the business situation of a supermarket management company from 2021 to 2024. Thus, the results of this study can play a vital and essential role for supermarket managers as they plan and develop business strategies and improve competitiveness and sustainable development. In addition, the results of this study are valuable references for researchers in the fields of customer service, supply chain management, and customer behavior. In particular, the factors obtained in this study will greatly strengthen the scientific basis of the service sector and the model of retail supermarkets in Vietnam and other countries around the world. In fact, the business strategy of supermarkets still depends on the spread of COVID-19. Therefore, in the future, it is necessary to combine the factors in the results of this study with the experience of managers to develop the right business strategies and achieve further results and sustainable development.
Limitations of the study: despite the results obtained from the study, there are still certain limitations, such as the limited number of samples compared to the large number of customers. One factor not mentioned in this study is the fact that supermarkets’ business situations depend on seasonal factors. In addition, this study did not provide comparisons between supermarkets for the best evaluation.
Further research orientations: the authors will conduct future studies with a larger sample size to obtain more accurate results reflecting customer satisfaction when purchasing and using services at supermarkets in combination with seasonal factors, especially during holidays and the Lunar New Year, thereby providing supermarket managers with a solid foundation for planning and developing the best business strategy.
Funding
This research is funded by Thu Dau Mot University, Binh Duong Province, Vietnam under grant number DT.21.2-097.
Conflicts of Interest
The authors declare no conflict of interest.
References
- An, Phien. 2021. More than 23.2 Million Vietnamese Will Join the Middle Class by 2030. Available online: https://vnexpress.net/ (accessed on 25 November 2021).
- Blut, Markus, Carly M. Frennea, Vikas Mittal, and David L. Mothersbaugh. 2015. How procedural, financial and relational switching costs affect customer satisfaction, repurchase intentions, and repurchase behavior: A meta-analysis. International Journal of Research in Marketing 32: 226–29. [Google Scholar] [CrossRef] [Green Version]
- Bratt, Cecilia, Robert Sroufe, and Göran Broman. 2021. Implementing Strategic Sustainable Supply Chain Management. Sustainability 13: 8132. [Google Scholar] [CrossRef]
- Bui, Tat Dat, Feng Ming Tsai, Ming-Lang Tseng, Raymond R. Tan, Krista Danielle S. Yu, and Ming K. Lim. 2020. Sustainable supply chain management towards disruption and organizational ambidexterity: A data driven analysis. Sustainable Production and Consumption 26: 373–410. [Google Scholar] [CrossRef] [PubMed]
- Carman, James M. 1990. Consumers’ perception of service quality: Assessment of T. Journal of Retailing 66: 33. [Google Scholar]
- Cronin, J. Joseph, Jr., and Steven A. Taylor. 1992. Measuring service quality: A reexamination and extension. Journal of Marketing 56: 55–68. [Google Scholar] [CrossRef]
- Deng, Ju-Long. 1982. Grey System Theory. Wuhan: Huazhong University of Science and Technology Press, pp. 288–94. [Google Scholar] [CrossRef]
- Fitch Solutions. 2021. Outlook for the Retail Consumer Industry in 2021. Available online: https://www.bsc.com.vn/ (accessed on 25 November 2021).
- Fu, Qinghua, Abdul Aziz Abdul Rahman, Hui Jiang, Jawad Abbas, and Ubaldo Comite. 2022. Sustainable Supply Chain and Business Performance: The Impact of Strategy, Network Design, Information Systems, and Organizational Structure. Sustainability 14: 1080. [Google Scholar] [CrossRef]
- Gerbing, David W., and James C. Anderson. 1988. Scaling combines unidirectionality and evaluation using an updated model. Journal of Marketing Research 25: 186–92. [Google Scholar] [CrossRef]
- Goula, Aspasia, Maria-Aggeliki Stamouli, Maria Alexandridou, Lemonia Vorreakou, Aristeidis Galanakis, Georgios Theodorou, Emmanouil Stauropoulos, Martha Kelesi, and Evridiki Kaba. 2021. Evaluation of the quality of public hospitals. Proof from the greeks state setting using the servqual model. International Journal of Environmental Research and Public Health 18: 3418. [Google Scholar] [CrossRef]
- Hair, F. Joseph, Rolph E. Anderson, Ronald L. Tatham, and William Cormack Black. 1998. Multivariate Data Analysis, 5th ed. Upper Saddle River: Prentice Hall. [Google Scholar]
- Hsu, Wei, and Pei-Wen Chen. 2021. The influence of service quality and personal characteristics on the effectiveness of vocational training. Sustainability 13: 13207. [Google Scholar] [CrossRef]
- Lambert, Douglas M. 2008. Processes, Partnerships, Performance in Supply Chain Management. Sarasota: Lambert. [Google Scholar]
- Lam, Thanh. 2021. The Middle Class and Its Positive Impact on Vietnam’s Economy and Society. Available online: https://1thegioi.vn/ (accessed on 25 November 2021).
- Mahdiraji, H., Meysam Arabzadeh, and Reza Ghaffari. 2012. Quality management in supply chain. Management Science Letters 2: 2463–72. [Google Scholar] [CrossRef]
- Menezes, Andromeda, Rui M. Lima, André Luiz Aquere, and Marlene Amorim. 2020. Servqual adaptation for event assessment: A complementary to environmental sustainability. Sustainability 12: 7408. [Google Scholar] [CrossRef]
- Minh, Nguyen Hue, and Yoshiki Matsui. 2015. Service quality issues and customer satisfaction in the hotel industry in Vietnam. Asian Social Science 11: 73. [Google Scholar] [CrossRef] [Green Version]
- Mitropoulou, Anastasia D., and Giannis T. Tsoulfas. 2021. Evaluation of service quality in the internal supply chain of online supermarkets in Greece. Logistics 5: 69. [Google Scholar] [CrossRef]
- Ngo, Minh Vu, Phan Quyen Phu Thi, Nguyen Ninh Van, and Vu Hieu Minh. 2019. The mediating effects of switching costs on the relationship between service quality, customer satisfaction and customer loyalty: A study in retail banking industry in Vietnam. International Journal of Supply Chain Management 8: 389–93. [Google Scholar]
- Nguyen, Han-Khanh. 2021. Applications Optimal Math Model to Solve Difficult Problems for Businesses Producing and Processing Agricultural Products in Vietnam. Axioms 10: 90. [Google Scholar] [CrossRef]
- Nunnally, Jum C., and Ira H. Bernstein. 1994. Psychometric Theory, 3rd ed. New York: McGraw-Hill. [Google Scholar]
- Parasuraman, A. 1985. Service quality: Concept and significance in research. Journal of Marketing 49: 41–50. [Google Scholar] [CrossRef]
- Peprah, Augustine Awuah, and Bede Akorige Atarah. 2014. Using a service model to assess patient satisfaction in hospitals in Ghana. International Journal of Business and Social Research 4: 133–43. [Google Scholar]
- Peštović, Kristina, Nikola Milicevic, Nenad Djokic, and Ines Djokic. 2021. Audit Service Quality Perceived by Customers: Formative Modelling Measurement Approach. Sustainability 13: 11724. [Google Scholar] [CrossRef]
- Reichheld, Frederick F., and W. Earl Sasser. 1990. Zero defeofions: Quoliiy comes to services. Harvard Business Review 68: 105–11. [Google Scholar]
- Segura, Marina, Concepción Maroto, and Baldomero Segura. 2019. Quantifying the Sustainability of Products and Suppliers in Food Distribution Companies. Sustainability 11: 5875. [Google Scholar] [CrossRef] [Green Version]
- Stock, James R., and Stefanie L. Boyer. 2009. Qualitative research in supply chain management. International Journal of Physical Distribution and Logistics Manager 39: 690–711. [Google Scholar] [CrossRef]
- Sumi, Razia Sultana, and Golam Kabir. 2021. Student satisfaction with quality online education. Journal of Open Innovation: Technology, Market, and Complexity 7: 227. [Google Scholar] [CrossRef]
- Wetzel, Philipp, and Erik Hofmann. 2020. Towards a multifaceted service quality model for logistics service providers. Administrative Sciences 10: 79. [Google Scholar] [CrossRef]
Figure 1.
Household disposable income in Vietnam (Unit: USD).

Figure 2.
Increasing trend of households with income above 5000 USD.

Figure 3.
Revenue structure of the consumer industry.

Figure 4.
Top 30 largest consumer markets in the world (Unit: 1000 billion VND).

Figure 5.
Research process.

Figure 6.
Servqual model.

Figure 7.
Forecasting process.

Figure 8.
Histogram.

Figure 9.
Standard residuals.

Figure 10.
Scatterplot.

Figure 11.
Observed groups and predicted probabilities.


Table 1.
Descriptive statistics.
| N | Minimum | Maximum | Sum | Mean | Std. Deviation | |
|---|---|---|---|---|---|---|
| FE1 | 346 | 2 | 5 | 1299 | 3.75 | 1.010 |
| FE2 | 346 | 2 | 5 | 1295 | 3.74 | 0.960 |
| FE3 | 346 | 1 | 5 | 1257 | 3.63 | 1.036 |
| FE4 | 346 | 1 | 5 | 1228 | 3.55 | 0.992 |
| FE5 | 346 | 1 | 5 | 1205 | 3.48 | 1.016 |
| QG1 | 346 | 1 | 5 | 1167 | 3.37 | 0.988 |
| QG2 | 346 | 1 | 5 | 1189 | 3.44 | 1.026 |
| QG3 | 346 | 1 | 5 | 1224 | 3.54 | 0.948 |
| QG4 | 346 | 1 | 5 | 1259 | 3.64 | 0.938 |
| QG5 | 346 | 1 | 5 | 1196 | 3.46 | 1.049 |
| SY1 | 346 | 1 | 5 | 1085 | 3.14 | 1.140 |
| SY2 | 346 | 1 | 5 | 1177 | 3.40 | 1.015 |
| SY3 | 346 | 1 | 5 | 1167 | 3.37 | 1.056 |
| SY4 | 346 | 1 | 5 | 1241 | 3.59 | 0.923 |
| SY5 | 346 | 1 | 5 | 1165 | 3.37 | 1.247 |
| RC1 | 346 | 1 | 5 | 1165 | 3.37 | 0.908 |
| RC2 | 346 | 1 | 5 | 1184 | 3.42 | 0.930 |
| RC3 | 346 | 1 | 5 | 1228 | 3.55 | 0.874 |
| RC4 | 346 | 1 | 5 | 1220 | 3.53 | 1.033 |
| RC5 | 346 | 1 | 5 | 1260 | 3.64 | 0.986 |
| ST1 | 346 | 1 | 5 | 1267 | 3.66 | 0.913 |
| ST2 | 346 | 1 | 5 | 1254 | 3.62 | 0.977 |
| ST3 | 346 | 1 | 5 | 1295 | 3.74 | 0.957 |
| ST4 | 346 | 1 | 5 | 1273 | 3.68 | 0.925 |
| ST5 | 346 | 1 | 5 | 1284 | 3.71 | 1.000 |
| SA1 | 346 | 1 | 5 | 1254 | 3.62 | 1.009 |
| SA2 | 346 | 1 | 5 | 1293 | 3.74 | 0.934 |
| SA3 | 346 | 1 | 5 | 1338 | 3.87 | 0.920 |
| SA4 | 346 | 2 | 5 | 1377 | 3.98 | 0.724 |
| Valid N | 346 |
Table 2.
Cronbach’s alpha results.
| Factors | Results |
|---|---|
| Facilities and equipment | 0.612 |
| Quality goods | 0.839 |
| Safety | 0.799 |
| Resolving of complaints | 0.619 |
| Staff | 0.750 |
| Satisfaction | 0.669 |
Table 3.
KMO and Bartlett’s test (Independent variable).
| KMO | 0.872 | |
|---|---|---|
| Bartlett’s Test of Sphericity | Approx. Chi-Square | 3817.101 |
| df | 300 | |
| Sig. | 0.000 | |
Table 4.
Total variance explained (Independent variable).
| Component | Initial Eigenvalues | Extraction Sums of Squared Loadings | Rotation Sums of Squared Loadings | ||||||
|---|---|---|---|---|---|---|---|---|---|
| Total | % of Variance | Cumulative % | Total | % of Variance | Cumulative % | Total | % of Variance | Cumulative % | |
| 1 | 7.826 | 31.306 | 31.306 | 7.826 | 31.306 | 31.306 | 3.622 | 14.487 | 14.487 |
| 2 | 1.982 | 7.930 | 39.236 | 1.982 | 7.930 | 39.236 | 3.587 | 14.349 | 28.836 |
| 3 | 1.857 | 7.430 | 46.665 | 1.857 | 7.430 | 46.665 | 2.241 | 8.965 | 37.802 |
| 4 | 1.687 | 6.747 | 53.412 | 1.687 | 6.747 | 53.412 | 2.233 | 8.932 | 46.734 |
| 5 | 1.351 | 5.403 | 58.815 | 1.351 | 5.403 | 58.815 | 2.179 | 8.717 | 55.451 |
| 6 | 1.047 | 4.187 | 63.002 | 1.047 | 4.187 | 63.002 | 1.888 | 7.551 | 63.002 |
| 7 | 0.969 | 3.875 | 66.876 | ||||||
| 8 | 0.881 | 3.525 | 70.401 | ||||||
| 9 | 0.785 | 3.140 | 73.540 | ||||||
| 10 | 0.739 | 2.955 | 76.495 | ||||||
| 11 | 0.632 | 2.530 | 79.025 | ||||||
| 12 | 0.602 | 2.408 | 81.433 | ||||||
| 13 | 0.539 | 2.157 | 83.589 | ||||||
| 14 | 0.490 | 1.958 | 85.548 | ||||||
| 15 | 0.475 | 1.900 | 87.447 | ||||||
| 16 | 0.432 | 1.728 | 89.175 | ||||||
| 17 | 0.404 | 1.618 | 90.793 | ||||||
| 18 | 0.367 | 1.469 | 92.262 | ||||||
| 19 | 0.341 | 1.364 | 93.626 | ||||||
| 20 | 0.321 | 1.286 | 94.911 | ||||||
| 21 | 0.298 | 1.191 | 96.102 | ||||||
| 22 | 0.291 | 1.164 | 97.266 | ||||||
| 23 | 0.244 | 0.977 | 98.244 | ||||||
| 24 | 0.235 | 0.942 | 99.186 | ||||||
| 25 | 0.204 | 0.814 | 100.000 | ||||||
Table 5.
Rotated Component Matrix.
| Component | ||||||
|---|---|---|---|---|---|---|
| 1 | 2 | 3 | 4 | 5 | 6 | |
| RC4 | 0.727 | |||||
| RC5 | 0.717 | |||||
| ST5 | 0.695 | |||||
| ST4 | 0.676 | |||||
| FE5 | 0.676 | |||||
| SY5 | 0.545 | |||||
| QG2 | 0.782 | |||||
| QG1 | 0.721 | |||||
| QG5 | 0.670 | |||||
| QG4 | 0.646 | |||||
| QG3 | 0.629 | |||||
| SY4 | 0.591 | |||||
| ST1 | 0.850 | |||||
| ST2 | 0.828 | |||||
| ST3 | 0.730 | |||||
| SY3 | 0.818 | |||||
| SY2 | 0.767 | |||||
| SY1 | 0.748 | |||||
| FE2 | 0.726 | |||||
| FE3 | 0.698 | |||||
| FE1 | 0.669 | |||||
| FE4 | 0.524 | |||||
| RC1 | 0.831 | |||||
| RC2 | 0.710 | |||||
| RC3 | 0.521 | |||||
Table 6.
KMO and Bartlett’s test (Dependent variable).
| KMO | 0.694 | |
|---|---|---|
| Bartlett’s Test of Sphericity | Approx. Chi-Square | 214.610 |
| df | 6 | |
| Sig. | 0.000 | |
Table 7.
Total variance explained (Dependent variable).
| Component | Initial Eigenvalues | Extraction Sums of Squared Loadings | ||||
|---|---|---|---|---|---|---|
| Total | % of Variance | Cumulative % | Total | % of Variance | Cumulative % | |
| 1 | 2.016 | 50.412 | 50.412 | 2.016 | 50.412 | 50.412 |
| 2 | 0.846 | 21.138 | 71.550 | |||
| 3 | 0.670 | 16.741 | 88.291 | |||
| 4 | 0.468 | 11.709 | 100.000 | |||
Table 8.
Model Summary b.
| Model | R | R Squared | Adjusted R Squared | Std. Error of the Estimate | Durbin-Watson |
|---|---|---|---|---|---|
| 1 | 0.716 a | 0.512 | 0.504 | 0.45076 | 1.607 |
a. Predictors: (Constant), X6, X5, X3, X4, X1, X2. b. Dependent Variable: Y.
Table 9.
ANOVA.
| Model | Sum of Squares | df | Mean Square | F | Sig. | |
|---|---|---|---|---|---|---|
| Regression | 72.310 | 6 | 12.052 | 59.314 | 0.000 | |
| Residual | 68.879 | 339 | 0.203 | |||
| Total | 141.189 | 345 | ||||
Table 10.
Coefficients.
| Model | Unstandardized Coefficients | Standardized Coefficients | t | Sig. | Collinearity Statistics | |||
|---|---|---|---|---|---|---|---|---|
| B | Std. Error | Beta | Tolerance | VIF | ||||
| 1 | (Constant) | 0.820 | 0.184 | 4.456 | 0.000 | |||
| X1 | 0.060 | 0.046 | 0.075 | 1.305 | 0.193 | 0.438 | 2.281 | |
| X2 | 0.236 | 0.049 | 0.278 | 4.829 | 0.000 | 0.436 | 2.295 | |
| X3 | 0.164 | 0.033 | 0.204 | 4.895 | 0.000 | 0.828 | 1.208 | |
| X4 | 0.181 | 0.032 | 0.257 | 5.610 | 0.000 | 0.687 | 1.456 | |
| X5 | 0.220 | 0.038 | 0.236 | 5.862 | 0.000 | 0.887 | 1.127 | |
| X6 | −0.020 | 0.040 | −0.021 | −0.493 | 0.622 | 0.798 | 1.254 | |
Table 11.
Case processing summary.
| Selected Cases | Included in Analysis | 475 | 100.0 |
| Missing Cases | 0 | 0.0 | |
| Total | 475 | 100.0 | |
| Unselected Cases | 0 | 0.0 | |
| Total | 475 | 100.0 | |
Table 12.
Omnibus tests of model coefficients.
| Chi-Square | df | Sig. | ||
|---|---|---|---|---|
| Step 1 | Step | 17.254 | 4 | 0.002 |
| Block | 17.254 | 4 | 0.002 | |
| Model | 17.254 | 4 | 0.002 | |
Table 13.
Classification Table a.
| Observed | Predicted | ||||
|---|---|---|---|---|---|
| DE | Percentage Correct | ||||
| 0 | 1 | ||||
| Step 1 | DE | 0 | 8 | 144 | 5.3 |
| 1 | 4 | 319 | 98.8 | ||
| Overall Percentage | 68.8 | ||||
a. The cut value is 0.500.
Table 14.
Variables in the equation.
| B | S.E. | Wald | df | Sig. | Exp (B) | ||
|---|---|---|---|---|---|---|---|
| Step 1 | AG | 0.035 | 0.014 | 5.972 | 1 | 0.015 | 1.035 |
| AC | 0.094 | 0.044 | 4.677 | 1 | 0.031 | 1.099 | |
| IN | −0.027 | 0.013 | 4.618 | 1 | 0.032 | 0.973 | |
| DI | 0.058 | 0.126 | 0.215 | 1 | 0.643 | 1.060 | |
| Constant | −0.983 | 0.779 | 1.593 | 1 | 0.207 | 0.374 | |
Table 15.
Data on business results (2017−2020).
| YEAR | FAC1 | FAC2 | FAC3 | FAC4 | FAC5 | FAC6 | FAC7 |
|---|---|---|---|---|---|---|---|
| 2017 | 140,271 | 61,244 | 2,333,809 | 2,095,825 | 231,114 | 59,780 | 562 |
| 2018 | 110,068 | 68,903 | 2,372,964 | 2,176,811 | 202,785 | 75,270 | 712 |
| 2019 | 49,467 | 50,801 | 2,313,288 | 2,174,168 | 108,992 | 66,258 | 655 |
| 2020 | 27,517 | 38,068 | 2,374,943 | 2,238,679 | 86,670 | 66,279 | 658 |
Table 16.
Forecasting results 2021–2024.
| YEAR | FAC1 | FAC2 | FAC3 | FAC4 | FAC5 | FAC6 | FAC7 |
|---|---|---|---|---|---|---|---|
| 2021 | 12,705.64 | 28,127.65 | 2,355,728.45 | 2,259,433.65 | 47,546.05 | 60,553.48 | 621.93 |
| 2022 | 6263.22 | 20,919.82 | 2,356,727.56 | 2,291,642.84 | 29,689.12 | 56,668.46 | 597.19 |
| 2023 | 3087.45 | 15,559.03 | 2,357,727.10 | 2,324,311.19 | 18,538.74 | 53,032.69 | 573.43 |
| 2024 | 1521.95 | 11,571.96 | 2,358,727.06 | 2,357,445.24 | 11,576.13 | 49,630.19 | 550.62 |
Publisher’s Note: MDPI stays neutral with regard to jurisdictional claims in published maps and institutional affiliations. |
© 2022 by the author. Licensee MDPI, Basel, Switzerland. This article is an open access article distributed under the terms and conditions of the Creative Commons Attribution (CC BY) license (https://creativecommons.org/licenses/by/4.0/).
Share and Cite
MDPI and ACS Style
Nguyen, H.-K. A 3-Dimensional Frame of Reference for Prevention of Risk in Supply Chain. J. Risk Financial Manag. 2022, 15, 142. https://doi.org/10.3390/jrfm15030142
AMA Style
Nguyen H-K. A 3-Dimensional Frame of Reference for Prevention of Risk in Supply Chain. Journal of Risk and Financial Management. 2022; 15(3):142. https://doi.org/10.3390/jrfm15030142
Chicago/Turabian StyleNguyen, Han-Khanh. 2022. "A 3-Dimensional Frame of Reference for Prevention of Risk in Supply Chain" Journal of Risk and Financial Management 15, no. 3: 142. https://doi.org/10.3390/jrfm15030142