Article

Do the Inward and Outward Foreign Direct Investments Spur Domestic Investment in Bangladesh? A Counterfactual Analysis

1
Graduate School of Economics and Management, Ural Federal University (UrFU), 620078 Yekaterinburg, Russia
2
Bangladesh Institute of Governance and Management (BIGM), University of Dhaka (Affiliated), Dhaka 1207, Bangladesh
3
College of Business, Tennessee State University, Nashville, TN 37203, USA
4
Economic and Financial Policy Institute, School of Economics, Finance & Banking, University Utara Malaysia, Sintok 06010, Kedah, Malaysia
5
Accounting Research Institutes, Universiti Teknologi MARA, Shah Alam 40450, Selangor, Malaysia
*
Authors to whom correspondence should be addressed.
J. Risk Financial Manag. 2022, 15(12), 603; https://doi.org/10.3390/jrfm15120603
Submission received: 22 August 2022 / Revised: 5 December 2022 / Accepted: 7 December 2022 / Published: 13 December 2022
(This article belongs to the Special Issue International Trade, Finance, and Development)

Abstract

:
The net contribution of the decomposed measures of foreign direct investment (FDIs), e.g., the inward and outward flows of FDIs, to domestic investment is still inconclusive in the case of underdeveloped and developing countries. The current literature bears testimony to this fact. Hence, this research examines the impact of inward and outward foreign direct investments (FDIs) on the domestic investment in Bangladesh. This study considers annual time series data from 1976 to 2019 and estimates this data property under the augmented ARDL approach to cointegration. In addition, this research employs the dynamic ARDL simulation technique in order to forecast the counterfactual shock of the regressors and their effects on the dependent variable. The results from the augmented ARDL method suggest that the inward FDI has a positive impact on domestic investment, while the outward FDI is inconsequential in both the long run and the short run. Besides, our estimated findings also show the economic growth’s long-run and short-run favorable effects on domestic investment. At the same time, there is no significant impact of real interest rates and institutional quality on domestic investment in the long run or the short run in Bangladesh. In addition, the counterfactual shocks (10% positive and negative) to inward FDI positively impact domestic investment, indicating the crowding-in effect of the inward FDI on the domestic investment in Bangladesh. As the inward FDI flow is a significant determinant for sustained domestic investment in Bangladesh, the policy strategy must fuel the local firms by utilizing cross-border investment.

1. Introduction

As a significant indicator of globalization, foreign direct investment (FDI) has become a pivotal stimulant to boost domestic investment and growth (Ndikumana and Verick 2008). The inward and outward FDI flows help to enhance people’s income, investments/assets, and overall development (Sylwester 2005). Theoretically, the inward FDI substitutes domestic investment if the external firms finance similar enterprises and the local firms discontinue their businesses. This occurs because foreign firms are more contesting and are equipped with up-to-date technology (Chen et al. 2017). In addition, if foreign companies finance their enterprises from the host economy’s capital markets, it decreases the financial liquidity of the native investors. As a result, capital borrowing becomes more costly for the domestic investors to finance their firms (Serrasqueiro 2017). Therefore, if foreign firms utilize local input factors in order to manufacture their complementary goods, it brings positive spillover effects and increases the domestic investment (Ali et al. 2018).
The FDI outflow allows firms/companies to penetrate new markets, to import intermediary goods from foreign countries at lower costs, and to access overseas technology. Thus, the outward FDI benefits the domestic economy. In addition, the growing competition among investing companies carries production spillovers to the local firms (Herzer 2010). However, considering the consequences of the outward FDI on domestic investment, the outward FDI decreases the likelihood of domestic investment as foreign investors transfer the scarce domestic financial resources to foreign investment (Al-sadiq 2013). As a result, fewer funds remain for the local firms to invest.
On the other hand, by employing their investments, multinational enterprises (MNEs) benefit the host country by guaranteeing access to sophisticated overseas technologies and valuable input factors in manufacturing finished goods at lower costs (Herzer 2010). Moreover, in some cases, the outward FDI substitutes foreign or regional productivity when firms move parts of their production mechanisms and industries to foreign countries. Therefore, external investment inexorably diminishes the domestic investment, the employment opportunities, the production, and, thus, the economic output. Moreover, the host economy’s development portfolio depends on rearward and forward connections with the MNEs (Ali and Wang 2018).
Bangladesh has become one of the major forces in the world economy by effectively pursuing its trade liberalization policy since the 1980s (Bashar and Khan 2007). This policy has brought massive opportunities for both inner and outer investors. More importantly, the government of Bangladesh has created various economic zones across the country to implement its policies, such as export processing zones (EPZs), special economic zones (SEZs), etc. In addition, the government has seen a substantial increase in FDI inflow due to several investments in power production and labor-intensive industries, such as readymade garments. As a result, Bangladesh witnessed a significant rise in FDI influx in 2018 and maintained its top place in South Asia by receiving a total of USD 3.61 billion (UNCTAD 2018).
In 2019, Bangladesh’s FDI inflow fell by 56 percent (USD 1.6 billion), compared to USD 3.6 billion in 2018. In Bangladesh, the export-based apparel sector is still a significant FDI recipient, and the principal investor countries in this sector include China, Hong Kong, and South Korea. The total FDI stocks of the country were USD 16.4 billion in 2019. However, Bangladesh mainly receives FDI from China, South Korea, India, Egypt, the United Kingdom, the United Arab Emirates, and Malaysia (UNCTAD 2019). Moreover, major developed Asian economies outsource the production from their factories, especially that of apparel products, to Bangladesh. As a result, Bangladesh ranks 168th out of 190 countries (World Bank 2020). Apart from FDI inflows, Bangladeshi corporations and multinational corporations have invested worldwide. The FDI of Bangladesh to other nations increased more than thrice based on this country’s outbound FDI accounted for USD 170 million in 2017 (UNCTAD 2018). More importantly, Bangladesh has been importing more raw materials and capital goods by utilizing the outbound FDI for the last two decades. Overall, the inward FDI flows witnessed an upward trend after the democratic era started in 1996, and it continued up until 2018, with noticeable fluctuations. However, the FDI outflows show an increasing trend from 2006 to 2018, with substantial changes that were similar to the FDI inflows. Figure 1 documents the FDI inflow and outflow as a percentage of GDP ranging from 1990 to 2019 in Bangladesh.
The FDI inflows of Bangladesh mainly suffer from an abysmal and underdeveloped state affair, natural disasters, and socio-economic and political volatilities. Besides, the country faces some other barriers to attracting FDI, including a weak infrastructure, corruption, a lack of transparency, bureaucratic inefficiency and corruption, a vulnerable financial sector, a lack of export diversification and market orientation, and a hefty reliance on the garment sector (UNCTAD 2019). Despite this, a strategically important location has been a considerable advantage for external investors to invest in Bangladesh. Potential domestic consumption and natural resources have also been important factors in attracting foreign investors. Moreover, the country’s government strengthens the private sector-based growth, which helps to preserve the foreign currency that is earned mainly from the remittance flows. Therefore, the central bank’s attempt is appropriate, as it ensures foreign currency transferability. It is also true that an open and diversified economic nature, a low-waged labor force, a strategic and competitive position in the global value chain, and a favorable economic and legislative environment for business are instrumental to enhancing the FDI inflows in Bangladesh (Business France 2019).
The measures of different governments are favorable to increasing the FDI in Bangladesh. The country’s policymakers eagerly seek to attract FDI in the energy and infrastructure sectors. Many incentive programs, such as a trade policy framework, a growth strategy via exports, and a public–private partnership (PPP) scheme, have already been in place since 2009 (Mengistu and Adhikary 2011). They also attempt to develop agro-based industrial products, leather-based footwear and related goods, software and ICT commodities, light engineering, pharmaceuticals, and shipbuilding by using internal processes and external potentials of diverse companies in order to reduce the heavy dependence on the textile-based industrial production. In addition, the economy has taken on several mega projects in order to provide infrastructure for foreign companies, such as a rail bridge and road over the Padma River and the Dhaka metro rail project (Islam et al. 2022). Moreover, Bangladesh has signed 30 bilateral investment accords with different countries in order to create a favorable business climate for both internal and external investors (UNCTAD 2019). However, such initiatives of the policymakers call for an empirical investigation in order to justify the efficiency of the FDI flows on the domestic investment and economic growth in Bangladesh.
Studies on the association between FDI and domestic investment have drawn much attention from policymakers concerning the growth in different economies (Agosin and Machado 2005; Prasanna 2010; Wang 2010; Tan et al. 2016; Onaran et al. 2013; Hanousek et al. 2021; and Ndikumana and Verick 2008). However, the existing literature mainly highlights the effects of FDI on the domestic investment in the host economy, but there are very few studies on the nexus between the outward FDI and the domestic investment for the source economy (Herzer and Schrooten 2008; Goedegebuure 2006; Tan et al. 2016). Similarly, most of the economic literature on Bangladesh depicts the positive, or somewhat ineffective, contribution of the inward FDI to the economic growth and the negative role of the outward FDI in the economic growth. Besides, no study has previously examined the effects of the decomposed measures of FDI, including the inward and outward FDI, on the domestic investment in Bangladesh.
This study contributes to the existing argument on the association between the FDI inflows (IDI) and the FDI outflows (ODI), and the domestic investment (DI), by utilizing annual time series data for Bangladesh over the period of 1976–2019. In addition, this study incorporates some control variables, such as per capita GDP growth, real interest rate, and institutional quality, which is measured by the level of the violation of political rights (VPR). More specifically, Bangladesh’s spectacular growth rate (of more than 6%) over the last two decades deserves the inclusion of the per capita GDP growth variable in this study’s model. Besides, in the case of Bangladesh, investors are somewhat reluctant to take out loans from the banks, despite the lower rate of real interest, as the volatile political circumstance impedes the investment process. Therefore, this situation requires examining the contribution of the real interest rates to the capital formation, i.e., the domestic investment flows. Finally, the bad governance emanates from the incumbents and some separate groups, making the state-circumstance antagonistic for business and investment. Therefore, this study considers the political terror scale as the proxy of the institutional quality in the estimation procedure. However, in the past, these variables have hardly been used by any other researcher on this topic in Bangladesh. Finally, this study improves the models of Feldstein and Horioka (1980) and Feldstein (1995) by adding the policy-relevant variable, namely the political terror scale that is proxied by the institutional quality.
For the empirical investigation, this study employs an augmented ARDL model, which was coined by McNown et al. (2018) and Sam et al. (2019), in order to explore the co-integrating nexus between the FDI flows and the domestic investment in Bangladesh. In addition, the dynamic ARDL simulations graph approach, which was developed by Jordan and Philips (2018), is also used to detect the counterfactual shocks to the independent variables (the inward and outward FDIs, the economic growth, the real interest rate, and the violation of political rights) and their impacts on the dependent variable (domestic investment) in both the long run and the short run. This study may be the first to use an augmented ARDL model to analyze the dynamic association among the variables and the dynamic ARDL simulations approach to measuring the counterfactual shocks (10% positive and negative) to the FDI flows and the other macroeconomic determinants and their impacts on the domestic investment in Bangladesh. Besides, for the ARDL bounds testing-based co-integration analysis, this study distinctively performs a t-test for the lagged dependent variable and an F-test for the lagged independent variables (McNown et al. 2018; Sam et al. 2019), along with the traditional F-test for the overall model (Pesaran et al. 2001). In addition, dummy variables have been used for the years in which structural breaks were detected. Furthermore, the ZA unit root test is utilized before implementing the augmented ARDL approach for co-integration. In the case of variable specification and methodology employment, this study represents more robust results on the nexus between the FDI flows and the domestic investment in Bangladesh. This study’s findings will provide helpful insights for policymakers and other stakeholders who are affiliated with the field of domestic and foreign investments. However, this study fills the research gaps by providing a solid understanding of the recurring debate on the efficiency of the FDI flows in Bangladesh under a new econometric framework.

2. Literature Review

The literature on foreign direct investment (FDI) mostly appears in investigating this indicator’s relationship with economic development from the standpoints of the endogenous and the neoclassical growth theories. According to the endogenous growth model, FDI stimulates economic growth by diffusing technology from the developed countries to the FDI recipient countries. Besides, the neoclassical growth framework reveals that inward FDI enhances the economic growth by raising both the quantity and the efficiency of investment (Li and Liu 2005). However, the impact of the inward FDI on domestic investment (DI) is highly debatable in empirical investigations, but not in the theoretical literature (Ali et al. 2019). Some argue that the IDI increases the DI, but other researchers opine to the contrary, demonstrating that the IDI decreases the DI (Elheddad 2019). The existing literature also supports that the outward FDI (ODI) enhances the DI both positively and negatively. In addition, the inward FDI’s positive role in increasing the local firms’ ability to boost production by contesting with external companies and using up-to-date technologies crowds in the domestic investment (Xu and Yuan 2012).
Utilizing macro data for OECD countries during the 1970s and 1980s, Feldstein (1995) found that more FDI outflows decrease the DI, while the inward FDI impacts the local investments positively while controlling some of the macroeconomic indicators of DI. Andersen and Hainaut (1998), utilizing data over the 1960s and 1990s, found that the outward FDI decreases the DI in the US, Germany, Japan, and the UK. When estimating the short- and long-term effects, Herzer and Schrooten (2008) found that outward FDI impacts German DI positively in the short runand negatively in the long run. Finally, the study of Xu and Yuan (2012) presents helpful insights by investigating the IDI–DI relationship in the Chinese economy. This study underlines that the government of China accepts a particular policy in order to allure foreign investors, which is helpful to increase the use of modern technology in creating competitive pressure on local firms. This positive mechanism of the inward FDI crowds in domestic investment. On the other hand, Agosin and Machado (2005), Wang (2010), and Salim et al. (2017) oppose that multinational enterprise (MNE) crowds-out domestic investment due to the lack of sophisticated technology usage and their mismanagement in a host economy.
The empirical literature on ODI–DI association is comparatively limited in the case of developing economies but abundant from the perspective of developed economies (Li et al. 2016; You and Solomon 2015; and Al-sadiq 2013). Among others, Desai et al. (2005) found that ODI decreases the production cost of commodities as the production-related activities are conducted in association with both local and foreign companies. This mood of production-related activities promotes competition between the local and the external firms, stimulating domestic investment. The study results from Desai et al. (2005) are more or less supported by Herzer and Schrooten (2008), who opine that the ODI crowds in the DI in the US due to the utilization of technology importation via ODI. However, ODI crowds out because of the lack of technology spillover effects in Germany, utilizing time-series data within a bivariate model. Al-sadiq (2013) employed a panel data analysis technique for 121 developing economies from 1990 to 2010 and found that the outward FDI impacts the DI negatively. Utilizing Vietnamese firm-level data for 2001–2011, Ni et al. (2017) examined the differential impacts of external investors on the domestic investment in Vietnam. Overall, the findings revealed that foreign investors from Asian countries play a significantly positive role in the local firms, but North American investors have no significant effects on the DI. Finally, this study argues that investments from China and Taiwan affect the local firms significantly in Vietnam.
Ali et al. (2019) found that both the IDI and the ODI have complementary effects on the domestic investment in the context of China. Ali et al. (2019) analyzed the impacts of the inward and outward FDI on the DI in China using annual time series data from 1982 to 2016. The study outcomes depict that inbound FDI substitutes the DI. At the same time, outbound FDI complements it, and the complementary effects of FDI outflows on domestic investment are higher than that of the FDI inflows in China. Shah et al. (2020) investigated the role of sectoral FDI on the DI in Pakistan during 1980–2012 by using the ARDL model. This study found that sectoral FDI crowds in the DI in Pakistan, and the study also concluded that the impact of aggregate FDI on domestic investment cannot be generalized.
The literature above highlights the positive and negative effects of the inward and outward FDI on domestic investment from the perspectives of different countries. In addition, some studies explore FDI’s complementary crowding-in and crowding-out effects on the domestic investment in diverse economies. A summary of the most significant and recent studies is shown in Table 1. More importantly, no existing literature examines the relationship between the FDI and the domestic investment in Bangladesh. The effects of the decomposed measures of FDI (inward and outward FDI) on the domestic investment are also nonexistent in Bangladesh. Therefore, the current study is expected to contribute to the existing literature in a significant way by estimating the dynamic ARDL simulations model in order to investigate the actual changes in the inward and outward FDI on the domestic investment in Bangladesh.

3. Theoretical Framework

The effects of FDI in the host country have drawn significant attention from both academics and policymakers. Theoretically, FDI transfers both the physical capital and the intangible assets, including proper skills in technology and management (Feldstein 1995). Some researchers have investigated the effects of inbound FDI on the recipient economy’s economic growth and domestic productivity. In addition, some economists have explored the influence of FDI inflow on the domestic investment (Wang 2010). The current study extends the theoretical model that was coined by Feldstein (1995) in order to investigate the effect of the inward and outward FDIs on the domestic investment in the context of Bangladesh. The initial regression model that was measured by Feldstein (1995) can be expressed as follows:
L n D I t = α 0 + β 1 L n I D I t + β 2 L n O D I t + ε t
where, Ln denotes the natural logarithm, DI represents the domestic investment, IDI represents the inward FDI, ODI illustrates the outward FDI, α 0 is an intercept term, and ε t corresponds to the error term. We transform all variables into logarithm form to avoid likely heteroscedasticity and linearize the model. Linearization of the model helps measure the elasticity coefficients of the variables efficiently, as the calculated coefficients contain the change in the percentage of the variables concerned (Gujarati and Porter 2010).
Feldstein (1995) developed this framework following Feldstein and Horioka’s (1980) model. As the FDI flow has been a significant predictor of domestic investment, Feldstein (1995) expanded this model to include IDI and ODI. Following Ali et al. (2019), the current study uses the gross domestic product (GDP) and the real interest rates (RIR) as control variables. Now, we can write the equation as follows:
L n D I t = α 0 + β 1 L n I D I t + β 2 L n O D I t + β 3 L n G D P t + β 4 R I R t + ε t
The human rights issues of a country affect the institutional quality and become a significant factor in the movement of domestic investment. Hence, the present study also includes this variable, e.g., the violation of human rights proxied by the political terror scale (PTS), in order to measure the institutional quality. Therefore, the model can be specified in the following equation:
L n D I t = α 0 + β 1 L n I D I t + β 2 L n O D I t + β 3 L n G D P t + β 4 R I R t + β 5 L n V P R t + ε t
In our empirical model, Equation (2) includes the gross domestic product as GDP and the real interest rate as RIR with the initial specification appearing in Equation (1). Equation (3) is the final model that includes the institutional quality, which is determined by the violation of political rights (VPR).
This research also follows the earlier studies of Adams (2009), Ullah et al. (2014), Wang (2010), Ivanović (2015), Szkorupová (2015), Tan et al. (2016), Ali and Mna (2019), Ali et al. (2019), and Shah et al. (2020). First, these researchers examined the influence of the inward FDI on the domestic investment. Next, Herzer and Schrooten (2008), Al-sadiq (2013), Tan et al. (2016), Ameer et al. (2017), and Ali et al. (2019) analyzed the effect of the outward FDI on the domestic investment. Then, Adams (2009), Wang (2010), Ivanović (2015), Szkorupová (2015), Ullah et al. (2014), Ameer et al. (2017), and Ali et al. (2019) investigated the impact of the economic growth on the domestic investment. Wang (2010), and Ali et al. (2019) examined the role of the real interest rates on the domestic investment. Finally, Adams (2009) and Ali et al. (2019) inquired into the impact of the institutional quality, which was measured by the political terror scale (PTS), on the domestic investment.

4. Methodology

4.1. Data Specifications

This study uses annual time series data of Bangladesh from 1976 to 2019. First, based on data availability, this study sets the time range for investigation. Then, it transforms the data into natural logarithms for measuring the elasticity of the coefficient values of the considered variables. The details of the variables and their sources are provided in Table 2. In addition, the summary statistics of the data property are exhibited in Table A1 (Appendix A).
The dependent variable, which is the domestic investment, consists of the construction costs of roads, railways, and similar structures, such as schools, offices, hospitals, private residences, and commercial and industrial buildings. This is called gross fixed capital formation (GFCF), which was formerly known as gross fixed domestic investment. In addition, land improvements (fences, ditches, drains, and so on) are also included in this investment portfolio. According to the UN-based system of national accounts (SNA), the net acquisitions of valuables are also regarded as capital formation. Besides, GFCF refers to the resident producers’ investments made in fixed assets over a specific period after subtracting the disposals. In addition, it contains particular increases in the value of non-produced holdings that producers or institutional entities have realized. Fixed assets are tangible or intangible products that are used repeatedly or continuously for longer than one year. Moreover, GFCF comprises both the public and private investments exploited in a country’s production mechanisms (World Bank 2022).
This study’s main independent variables are the decomposed measure of the foreign direct investment (FDI), indicating the inward and outward FDI flows. The net direct investment at a specific period, which is typically the end of a quarter or a year, is measured by FDI stocks. However, the value of the resident investors’ equity in and net loans to businesses in other countries comprise the outward FDI stock. On the other hand, the value of the foreign investors’ shares in and net loans to domestically based businesses constitute the inward FDI stock. These two measures of the FDI help augment the scale of an economy’s domestic investment employment (Türkcan 2008). In addition, economic development is, in general, economic growth. However, it is not just about increasing the total output; it is also about the fundamental transformations of an economy, including its sectoral organization, demographics, and geographic makeup, but perhaps more significantly, its entire social, economic, and institutional structure. Therefore, it is crucial to consider the political, social, investment, and demographic aspects of an economy (Acemoglu 2012).
The real interest rates are instrumental in promoting two available savings vehicles: physical capital and government bonds. This is because perfectly competitive firms produce a single good (the numeraire) that ultimately boosts personal consumption and capital investment. On the other hand, the government takes spending as delivered and chooses a combination of one-time levies and debt in order to achieve its budgetary requirements. Besides, in the case of individual business, an increase in real interest rates discourages firm-level investment and vice versa (Carvalho et al. 2016). Apart from the macroeconomic dynamic-driven domestic investment, the policy-relevant indicators, such as governance quality or the government’s capacity to control volatility such as political terrorization, play a crucial role in a country’s investment portfolio. However, more importantly, terror practices in the state by the governmental coercive power application against people or by the different open and clandestine groups’ unauthorized activities hinder the entire investment mechanisms of an economy (Islam and Islam 2021a, 2021b).

4.2. Econometric Estimation

This section of econometric estimation describes the unit root test, the autoregressive distributed lag (ARDL) bounds testing approach to co-integration, and the dynamic ARDL simulation technique.

4.2.1. Unit Root Tests

To check for the stationary of the time series data, it is necessary to confirm whether the variables of interest contain a unit root. To avoid factitious results, this study utilizes two significant unit root tests: the augmented Dickey–Fuller (ADF) and Zivot–Andrews (ZA) stationarity tests to make the results robust. The ADF test is employed to augment the equation where the form of lagged difference in the dependent variable (domestic investment) is included for capturing any serial autocorrelation (Dickey and Fuller 1981). In addition, despite significant progressive characteristics in macroeconomic dynamics, Bangladesh’s economy is characterized by several critical factors, such as global shocks, income inequality, corruption, and poverty, which potentially cause volatility. Hence, it is not implausible that structural breaks could describe Bangladesh’s macroeconomic data on these variables during the study period. Therefore, this study utilizes the Zivot and Andrews (2002) unit root test to check the structural breaks. For the dependent variable of this study, which is DI, the functional forms of the unit root tests can be depicted as follows:
Δ D I t = φ + φ D I t 1 + b T + c D T t + j = 1 k d j Δ D I t j + ε t
Δ D I t = δ + δ D I t 1 + c T + b D T t + j = 1 k d j Δ D I t j + ε t
Δ D I t = ϑ + ϑ D I t 1 + c T + d D T t + j = 1 k d j Δ D I t j + ε t
Δ D I t = ω + ω D I t 1 + c T + d D t + d D T t + j = 1 k d j Δ D I t j + ε t
where D denotes the dummy variable showing the shift of mean at each point and D T t is the trend in data. The test depicts that “the null hypothesis is in support of the presence of a unit root with a single structural break while the alternative hypothesis rules out any such possibility”.

4.2.2. ARDL Bounds Testing Approach to Co-Integration

Based on the theoretical background, this study develops Equation (3) for investigating the co-integration associations between foreign direct investment (FDI) flows and domestic investment. To this end, this study applies an autoregressive distributed lag (ARDL) approach to co-integration for shorter and longer periods. McNown et al. (2018) and Sam et al. (2019) modified the ARDL bounds testing approach to co-integration by renaming it to ‘an augmented ARDL bounds test’. Notably, Pesaran et al. (2001) first proposed this model and confined it (ARDL) with two specific investigations. The first one includes the overall F-test for the lagged variables’ coefficient measurement, and the second one accentuates a t-test for the estimation of the coefficients of the lagged dependent variable. However, to avoid degenerate cases and to arrive at a rational conclusion, these two tests mandate the assumption of I(1) integrating order for the dependent variable. In this case, there appears to be no co-integration among the variables due to the problem of degenerate cases. In this regard, McNown et al. (2018) developed a supplemental F-test to assess the significance level of the coefficients of the lagged independent variables to mitigate the substantial dependence on the dependent variable’s I(1) order of integration. This additional test helps to eradicate the degenerate cases and reduces the chance of relying on just the weaker conventional unit root tests. Therefore, we may formulate the augmented ARDL equation using an unrestricted error correction mechanism, as follows:
Δ y t = ^ + ^ y t 1 + γ ^ x k , t 1 + i = 1 p 1 λ ^ ´ i Δ y t i + j = 1 q 1 δ ^ ´ j Δ X k , t j + ω ´ n D t + ε ^ t
where i and j denote the lags; t is time; y t describes the dependent variable; X k is a vector of the independent variables; D t are the dummy variables used to manage the potential structural break in the equation; and n is the number of the dummy parameters. Notably, the dummies illustrate a value of 1 (one) for a particular year and 0 (zero) for all other years. Such dummy variables in the ARDL equation allow the constant change in the relationship between the variables (Islam et al. 2022).
The three tests’ null hypotheses conducted using the augmented ARDL framework are listed below:
(1)
Lag level of the coefficients of all variables using F-test: H0: ^ = γ ^ = 0 against H1: ^ = γ ^ 0 ;
(2)
Lag level of the coefficients of dependent variable using t-test: H0: ^ = 0 , against H1:   ^ < 0 ;
(3)
Lag level of the coefficients of independent variable using F-test: H0: γ ^ = 0 , against H1: γ ^ 0 .
McNown et al. (2018) recommended the F-test for the lag level of the independent variables’ coefficients, Pesaran et al.’s (2001) F-test for the lag level of the coefficients of all variables, and the t-test for the lag level of the coefficients of the dependent variable. These three tests establish the co-integrating relationship among the variables while nullifying their (three tests) null hypotheses in the model. Therefore, this research implements the critical bound testing approach followed by Pesaran et al. (2001) for tests (1) and (2). For test (3), this analysis utilizes the same technique developed solely by Sam et al. (2019).
Co-integration exists between the variables if the unrestricted ECM shows the long-term effects of the regressors on the dependent variable. According to Equation (8), if Δ y t and Δ x k , t become 0, and the long-term coefficients of x k is equal to ( γ ^ / ^ ) , this scenario indicates an equilibrium relationship among the variables (Goh and McNown 2020; Islam et al. 2022). The renormalized long-run association’s standard errors in the unrestricted ECM are challenging to discern (Pesaran 2015, p. 526). Hence, the restricted ECM is measured as follows:
Δ Y t = ^ + ^ ( Y t 1 + σ ^ x k , t 1 + i = 1 p 1 λ ^ ´ i Δ Y t i + j = 0 q 1 δ ^ ´ j Δ X k , t j + ω ´ n D t + ε ^ t = ^ + ^ Z t 1 + i = 1 p 1 λ ^ ´ i Δ Y t i + j = 0 q 1 δ ^ ´ j Δ X k , t j + ω ´ n D t + ε ^ t
Moreover, the framework of the ARDL equations can be used for scenario analysis, conditional prediction, and in-sample simulation if the co-integration is confirmed in all of the computed equations.

4.2.3. Dynamic ARDL Simulations Model

Acknowledging the shortcomings of the current ARDL technique for co-integration analysis, Jordan and Philips (2018) devised the dynamic ARDL simulations model, which is a novel model for time series data. While keeping the residual variables constant in the equation, this approach can measure, simulate, and automatically construct graphs to check the counterfactual changes/shocks (positive and negative) to the independent variables and their effects on the dependent variable. When using the dynamic ARDL simulations model, there needs to be an order of integration among the variables at I(0) and I(1). According to Jordan and Philips (2018), this study specifies the following equation based on the ARDL bounds testing model within the error-correction form:
Δ Y t = φ 0 + β 1 Δ Y t 1 + i = 0 q 1 k Δ X t i + λ Y t 1 + i = 0 q ω n X t i + ρ D t + γ E C T t 1 + ε t
where i denotes 0, 1; X delineates the row vector of the independent variables; k illustrates the column vector of the short run parameters; and n is the column vector of the long run parameters. More importantly, to fit the ARDL-based error correction model, this study applies 5000 simulations for the vector of variables from the multivariate normal distribution.

5. Results and Discussions

5.1. Data Stationarity

In order to check for the stationary of the variables, this study applies the ADF and ZA unit root tests. Table 3 shows the stationary results, which show that the investigated series, such as LnDI, LnIDI, LnODI, LnGDP, RIR, and LnVPR, belong to a mixed order of integration, i.e., I(0) and I(1). The examined results confirm the rationality of applying the ARDL model for the short-run and long-run co-integration among the variables.

5.2. Model Estimation

Table 4 portrays the AIC, the SC, and the HQ’s outcomes and the other tests for selecting the optimal lag under the VAR model. According to the SC and HQ results, one lag is appropriately selected and is suitable for the model.

5.3. ARDL Bounds Testing Approach to Co-Integration

The ARDL bounds testing method is used in this study in order to examine the co-integrating connection between the variables. From the analysis, we find that the estimated values of the F-statistic for the overall model, the t-statistic for the lagged dependent variable, and the F-statistic for the lagged independent variables are higher than the upper bounds values at the 1% level of significance. This result of the ARDL bounds test indicates a long-run relationship among the variables. Besides, the ZA unit root test demonstrates that the variables have structural breaks. Therefore, this analysis uses the augmented ARDL bounds testing approach (McNown et al. 2018) considering the dummy years, including 1990, 2013, 1984, and 1986 (Table 5). More importantly, the ARDL technique allows case # III, i.e., “unrestricted intercepts and no trend,” because this case is more appropriate for a diagnostic check.
After establishing co-integration among the variables by utilizing F-tests for both the overall model and the lagged independent variables and the t-test for the lagged dependent variable within an augmented ARDL approach, this study finds the short-run and the long-run effects of the inward and outward FDI flows, the economic growth, the real interest rates, and the violation of political rights on the domestic investment in Bangladesh (Table 5). The investigated results from the augmented ARDL model show that the inward FDI has a positive and significant effect on the domestic investment of Bangladesh in both the long run and the short run. The results indicate that a 1% increase in the inward FDI contributes to the rise of the domestic investment by 0.01% in the long run. However, the positive effect of the inward FDI depends on whether it complements the domestic investment of an economy (Ali et al. 2019; Li and Liu 2005). Bangladesh has liberalized its industrial policy as a developing country, emphasizing export and private sector-based growth. It has also offered a wide range of flexible fiscal incentives and opportunities for external investors. Simultaneously, the recent growth approach of Bangladesh has also revolved around making a good number of special economic zones (SEZs). These components have become conducive to the inbound flow of the FDI in Bangladesh.
In recent years, Bangladesh has maintained its advancing position, according to the existing global business climate indices. As a result, the inbound FDI flows and other external macroeconomic indicators, such as the remittance exports, have become favorable for the country to exploit the potential of technology, which has stimulated the higher growth rate of the country. Furthermore, the government has cumulative human capital that primarily determines the absolute competitiveness. Therefore, Bangladesh attracts and reaps the full-length potential of growing FDI by investing in its people. Amid the increasingly contesting and volatile business climate, a long-term strategy is instrumental in scaling up the sustained flow of the inward FDI for domestic investment and economic growth. These results are consistent with the findings of the researchers Feldstein (1995), Ullah et al. (2014), and Shah et al. (2020), who underline the positive relationship between the inward FDI and the domestic investment. The authors mainly state that the complementary effect of the inbound FDI and the favorable role of local investment infrastructure is of maximum significance for the FDI to stimulate domestic investment in most developing countries, such as Bangladesh. Besides, these results differ from the studies of Szkorupová (2015), Ivanović (2015), Adams (2009), Wang (2010), and Ali et al. (2019), who explored an inverse association between the inbound FDI and the domestic investment. This group of authors highlights that the substitution effect of the FDI inflows contributes to reducing the domestic investment in the host economy.
The examined result of the augmented ARDL model indicates that the outward FDI has a positive and statistically insignificant effect on the domestic investment in Bangladesh in both the long run and the short run (Table 5). This insignificantly positive impact of the outbound investment shows that it does not substitute the domestic investment by transferring finances abroad. Bangladesh has been keeping substantial foreign reserves due to trade performance and the flow of remittances for many years. This has led to the Bangladesh-based MNCs not depending mainly on their domestic savings and, thus, it might significantly help to stimulate domestic investment. Besides, the outbound FDI’s complementary effect on the domestic investment may not crop up via product market channels. Overseas investors benefit Bangladesh by securing its access to lower-priced input factors and external technologies. The findings relating to the positively insignificant influence of outward FDI on domestic investment in Bangladesh are inconsistent with Hejazi and Pauly (2003), Goedegebuure (2006), Herzer and Schrooten (2008), Herzer (2010), Imbriani et al. (2011), Chen and Yang (2013), Li et al. (2016), and Ali et al. (2019). These researchers mainly emphasize the complementary association between the outbound FDI and the domestic investment. The investigated results are somewhat consistent with those of Andersen and Hainaut (1998) and Al-sadiq (2013). They highlight the crowding-out effect of the outward FDI on the domestic investment.
In terms of the control variables, the investigated results of the economic growth indicate a positive and insignificant effect on the domestic investment in both the long run and the short run in Bangladesh (Table 5). Generally, GDP positively impacts the domestic investment. In this case, Al-sadiq (2013) opined that GDP growth, as the proxy of the economic activities, is a significant driver of domestic investment. However, more importantly, the economic growth and the capital formation are positively associated due to effective sales, cash flows, and profitability (Chen et al. 2017). Thus, the economic growth and the domestic investment are positively correlated, which is akin to a priori expectation. This examined result is supported by the earlier studies of Wang (2010), Mahmood and Chaudhary (2012), Ivanović (2015), and Ali et al. (2019), who emphasized that the trade performance, the domestic savings, and the overall management of the market mechanisms are conducive to the economic growth and the domestic investment in an economy.
The estimated results of the real interest rate indicate a positive and insignificant impact on the domestic investment in the long run and the short run in Bangladesh (Table 5). This result is supported by Min et al. (2022), who utilized the rejection method that was devised by Rubio-Ramirez et al. (2010) and found that the interest rate shocks have no significant influence on cumulative investment in China. Another study by You and Solomon (2015) also proved that the domestic investment in China does not respond to the real interest rate as the cost of capital. Similarly, He et al. (2013) established that the innovation to interest rates has no statistically significant effect on the fixed-asset investments in China. On the other hand, this finding is incoherent with the previous studies that were conducted by Wang (2010), Al-sadiq (2013), Ali et al. (2018), and Ali et al. (2019). The researchers concluded that a higher real interest rate includes a higher investment cost that negatively affects the domestic investment of an economy.
The investigated results of the violation of political rights (VPR) indicate a positive and insignificant effect on Bangladesh’s domestic investment in both the long run and the short run (Table 5). It implies that the political risk or the violation of political rights as an indicator of institutional quality does not adversely affect the domestic investment growth. The institutional quality of a developing country such as Bangladesh is measured by the scale of the violation of political rights (VPR). Ali et al. (2019) stated that “VPR is measured on a scale of 1 to 5, where 1 indicates the lowest violation of political rights or the highest civil freedom and 5 indicates the highest violation of political rights or the lowest civil freedom”. Theoretically, institutional quality keeps the government from intervening in the domestic financial system. This helps to develop the effectiveness of the allocation of bank credit that finally yields a friendly environment for both business and investment (Su et al. 2015). It implies that the higher the institutional quality is (based on protecting political rights), the higher the efficacy and the incentive to invest in an economy (Ali and Wang 2018). The investigated ineffective influence of VPR on domestic investment is consistent with the results of the studies by Adams (2009), Makki and Somwaru (2004), and Rodrik (2006), yet is contradicted by the results of Al-sadiq (2013), Ali and Wang (2018), and Ali et al. (2019). The authors highlight that the institutional quality that is induced by political risk factors is essential in bringing a favorable or unfavorable business environment to stimulate domestic investment and economic growth. More importantly, FDI attraction largely depends on the political risk phenomenon in a host country.
The scrutinized result reveals that the error correction term (ECT) value is negative and significant at a 5% level, which was expected (Table 5). The ECT result suggests that the speed of the adjustment of short-run disequilibrium to long-run stability is 22% in one year. As the coefficient of the ECT is lower, the complete convergence process is anticipated to take a long time to reach equilibrium in Bangladesh. The results of different diagnostic tests are also depicted in Table 5. First, the Jarque–Bera test is performed for the normality of the residuals that were used in the model, and the result reveals that the model’s residuals are normally distributed. Second, the Ramsey reset test is estimated in order to check the proper specification of the ARDL model. The examined result of the Ramsey reset test shows that the ARDL model is rightly identified. Third, the Lagrange multiplier (LM) test is employed in order to investigate the serial correlation problem in the model. The LM test result demonstrates that there is no serial correlation problem in the estimated model. The Breaush–Pegan–Godfrey (ARCH) test is applied to examine the heteroscedasticity issue. The estimated result from the ARCH test divulges that the model is free from a heteroscedasticity problem.
This study utilizes the CUSUM and CUSUM square tests in order to check the stability of the model (Figure 2). The values of the residuals are marked with blue lines, while the red lines indicate the confidence levels. The estimated graphs confirm that the ARDL model is stable, as the residuals’ investigated values remain within the confidence lines at a 5% significance level.

5.4. Dynamic ARDL Simulations-Based Counterfactual Shock Analysis

The dynamic ARDL simulation graphs used in this study depict the counterfactual changes (10% positive and negative shocks) in the independent variables and their impacts on the dependent variable. More specifically, this study examines the effects of the positive and the negative changes in the inward and outward FDI, the economic growth, the real interest rate, and the violation of political rights on the domestic investment in Bangladesh. In the findings of this study, the dynamic ARDL simulation graphs are produced using the lag length, i.e., lag 1, which is also taken into consideration while executing the augmented ARDL model to explore the co-integrating relationship among the variables of interest.
Figure 3 depicts 10% positive and negative changes in the inward FDI flow and their impact on the domestic investment in Bangladesh. The first graph shows that a 10% increase in the inward FDI flow positively impacts the domestic investment in Bangladesh in both the short run and the long run. The second graph shows a 10% decrease in the inward FDI flow and its impact on the domestic investment. This graph shows that a 10% decrease in the inward FDI inflows has a positive effect in the short run and in the long run; however, the impact of the inward FDI flow increases with positive change. The short-run and the long-run positive influence of FDI on the domestic investment in both the positive and the negative shocks imply that the inward FDI crowds in the domestic investment in Bangladesh.
Figure 4 illustrates a 10% positive and negative impact of the outward FDI flow on the domestic investment in Bangladesh. Both of these graphs indicate that positive and negative shocks demonstrate positive effects in the short run and in the long run. Still, the negative shock shows that the impact of the outward FDI flow decreases with adverse changes in the long run.
Figure 5 represents a 10% positive and negative change in the economic growth and its impact on domestic investment in Bangladesh. The first graph relating to the economic growth shows that a 10% change has a positive effect in the short run and a negative impact in the long run. The second graph divulges that a 10% decrease indicates that the economic growth has a positive effect both in the short run and in the long run. Still, in the long run, the negative shock demonstrates that the economic growth decreases with positive changes.
Figure 6 shows a 10% positive and negative association of the real interest rates with the domestic investment in Bangladesh. A 10% increase in the real interest rates indicates a positive effect both in the short run and in the long run. In comparison, a 10% adverse change in the real interest rates positively impacts the domestic investment both in the short run and in the long run. Still, in the long run, the impact decreases with negative changes.
Figure 7 depicts the impact of positive and negative changes in the violation of political rights on the domestic investment in Bangladesh. The first graph shows that a 10% positive increase in the violation of political rights has a positive effect both in the short run and in the long run. In comparison, a 10% adverse change indicates a positive impact in the short run and a negative effect in the long run. This effect on the domestic investment increases with adverse changes in the long run.

6. Conclusions and Policy Recommendations

The underlying view of this research is that the FDI flows help to accelerate the movement of the domestic investment in developing economies, such as Bangladesh. In establishing this statement, this study aimed to investigate the effect of FDI flows (inward and outward FDI) on the domestic investment in Bangladesh over the period of 1976–2019. Using an augmented ARDL model approach, this study has scrutinized co-integrating associations among the variables. The shocks arising in the independent variables and their effects on the dependent variable have also been investigated and represented through simulation graphs utilizing the dynamic ARDL simulations approach in this study. The stationarity problem of the data was checked using ADF and ZA unit root tests. The test results indicate that the time series are stationary at I(0) and I(1), and none of the series are stationary at I(2). This stationarity status of the time series variables allows us to implement the augmented ARDL approach to co-integration and the dynamic ARDL simulations approach to measuring counterfactual shocks.
Within an augmented ARDL model framework, this study has additionally used a t-test for the lagged dependent variable and an F-test for the lagged independent variables, along with the traditional F-test for the overall model, in order to check for co-integration among the variables. Besides, the dummy for the ‘structural-break’ years using the ZA unit root test has also been utilized in the augmented ARDL approach to co-integration. For checking the normality, the heteroscedasticity, the autocorrelation, and the stability, different diagnostic tests (e.g., Jarque–Bera, Breusch–Pagan–Godfrey, ARCH, LM, and the CUSUM and CUSUM squares) are applied.
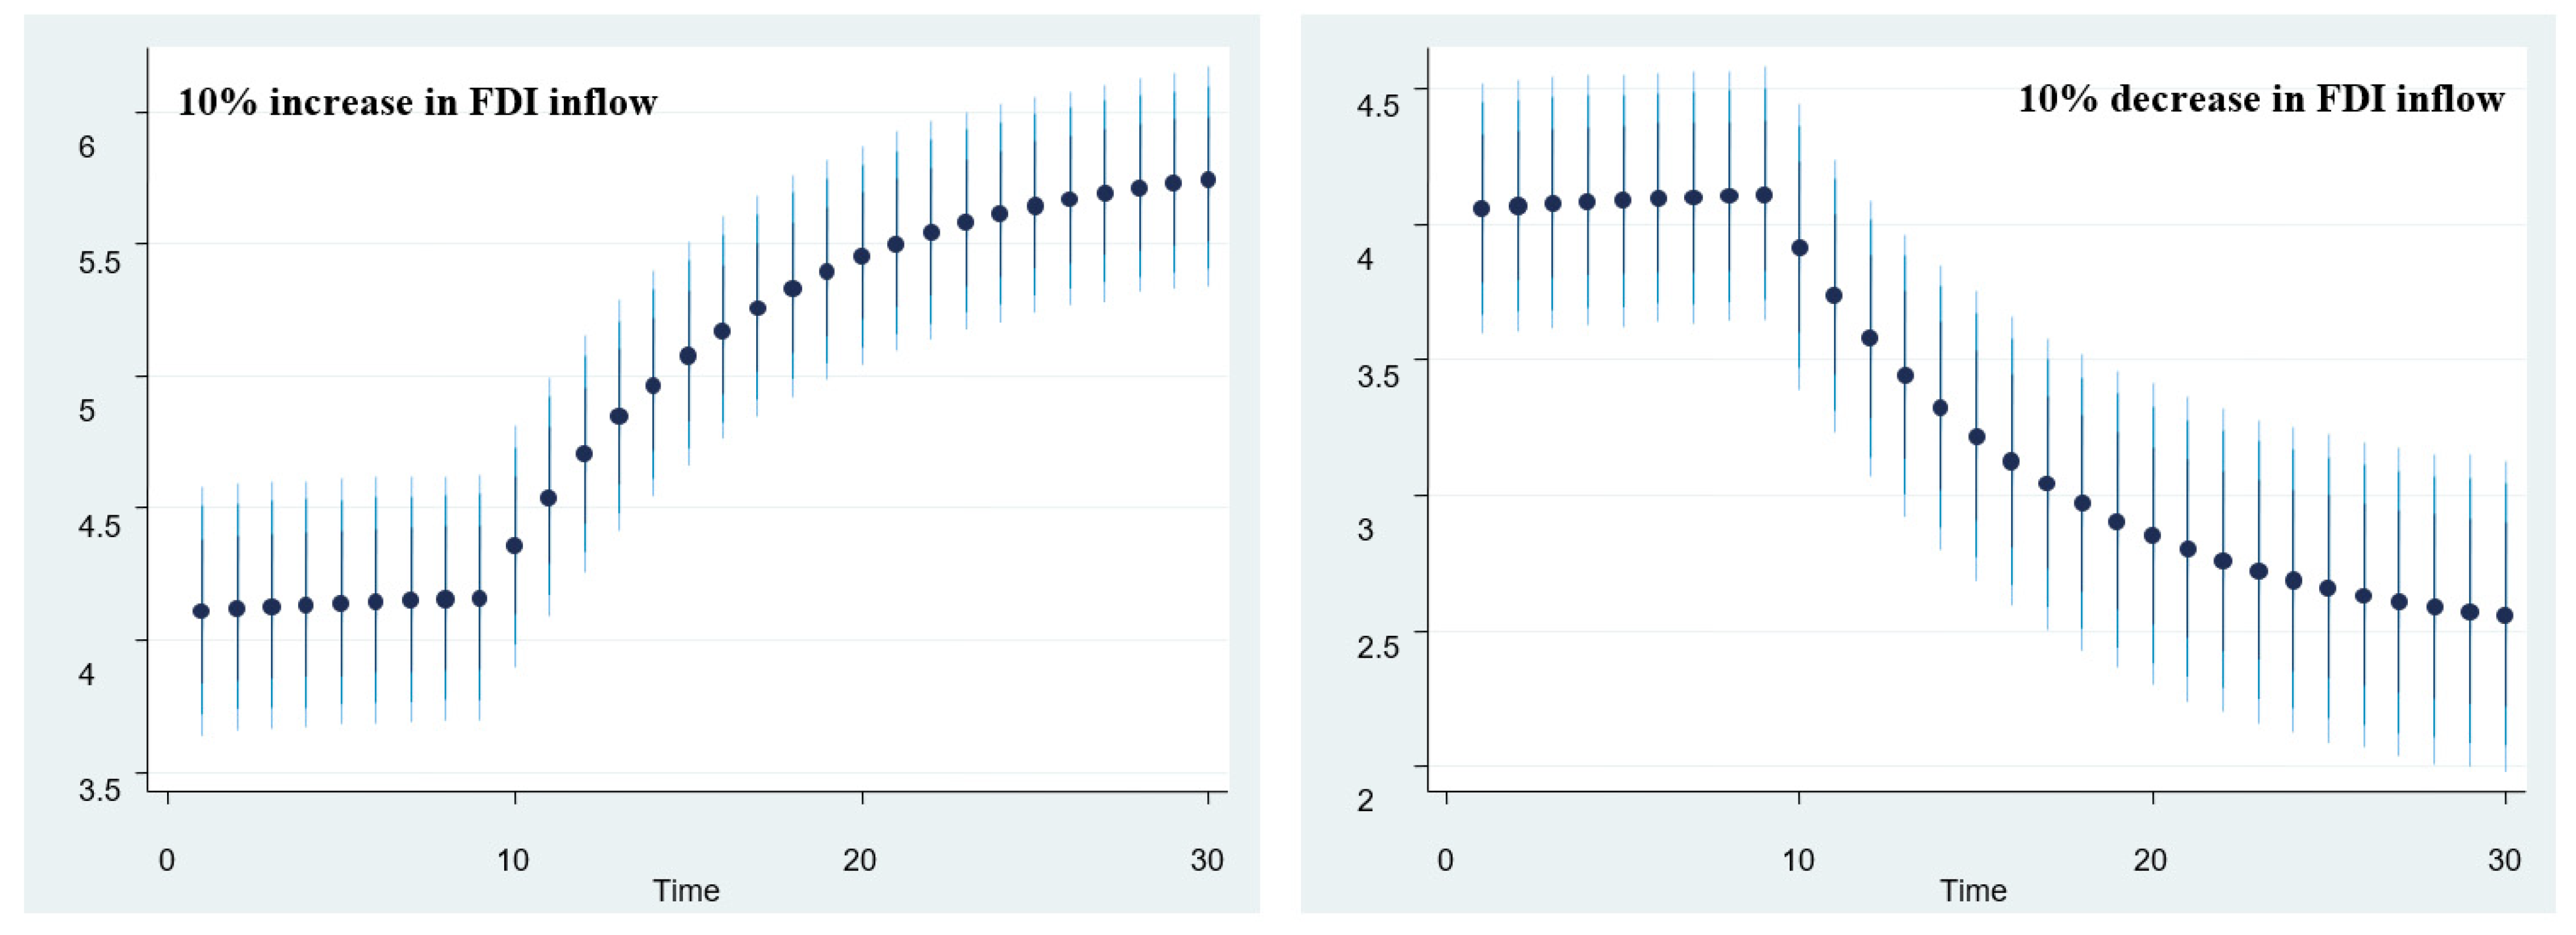
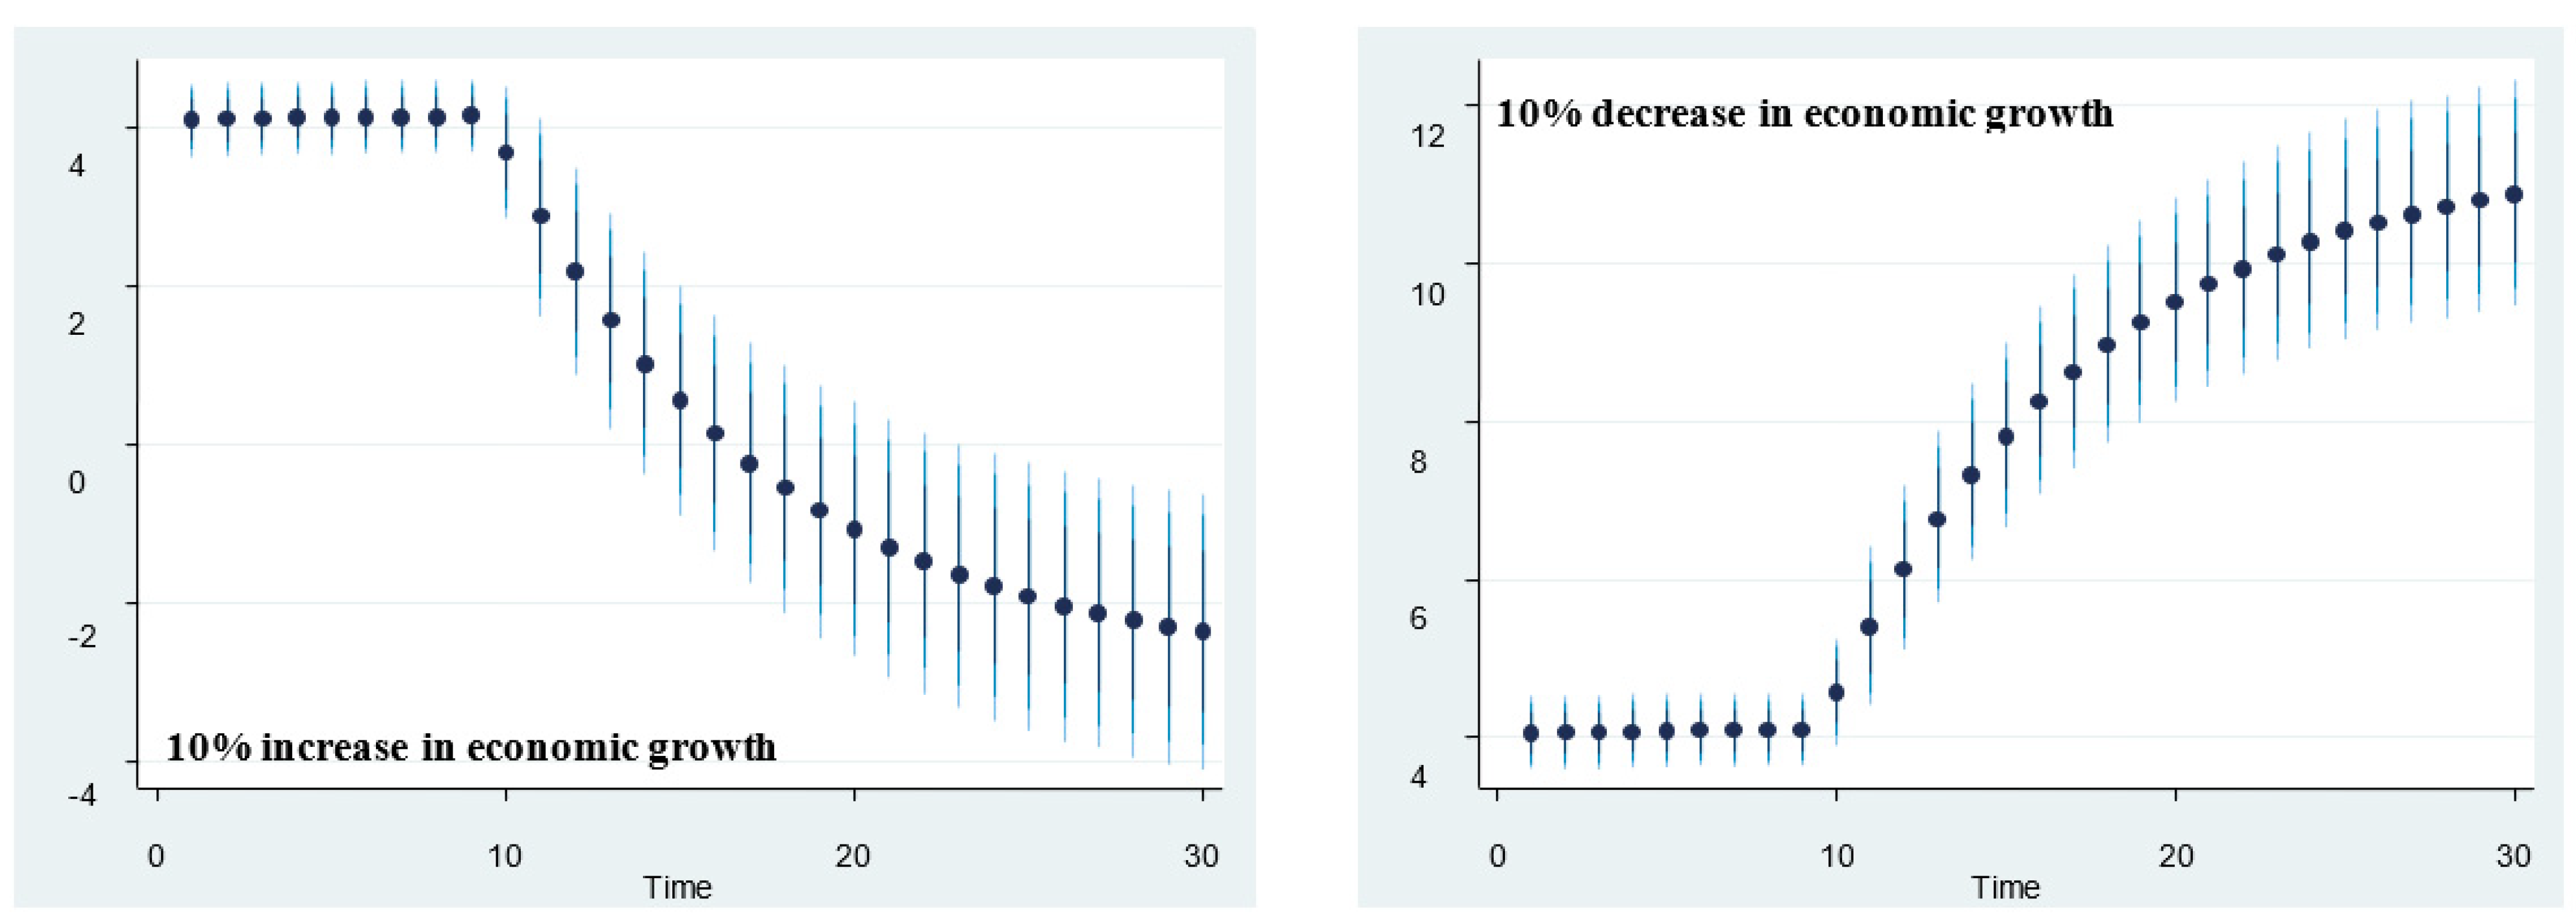
The investigated results that were obtained from the augmented ARDL model suggest that the inward FDI has a significantly positive effect on the domestic investment in both the short run and in the long run. At the same time, the outward FDI has no significant role in spurring domestic investment in both the long run and the short run. Besides, the long-run positive impacts of the inward FDI in both the 10% positive and the 10% adverse shocks that emerged from the dynamic ARDL simulations graph suggest that the inward FDI crowds in the domestic investment in Bangladesh. In addition, economic growth affects the domestic investment positively in the long run and in the short run in Bangladesh, whereas the real interest rate and the institutional quality, as measured by the scale of the violation of political rights (VPR), have no significant influence.
Since the 1980s, the trade liberalization policy of Bangladesh has opened the gateway for foreign firms to invest in the country. Therefore, Bangladesh-based enterprises/MNEs took this opportunity to penetrate the global arena in order to utilize their investments. As a result, this policy measure has somewhat led to a spectacular growth in Bangladesh’s FDI flows. However, as Bangladesh’s growth process is highly dependent on its formation of domestic capital, such capital inflows via FDI, which has a complementary effect on local investments. However, the capital outflow via outward FDI has been a concern of policymakers regarding its consequences on domestic investment. Against this backdrop, this paper has striven to respond to how Bangladesh’s domestic investment corresponds to its rising FDI inflow and outflow trend.
According to the results, this study argues that the Bangladesh government’s policy to attract foreign direct investment is pertinent, as the FDI inflow has contributed to the crowding-in effect on the domestic investment. The IDI has brought the local firms to the competition and has allowed them to utilize sophisticated technology in their production. The inward FDI has, thus, increased the local firms’ ability to spur domestic investment. The positive, but insignificant, effect of the ODI has become an issue for the policymakers of Bangladesh concerning the utilization of the ODI for domestic investment growth. It is also realistic to state that the negative impact of the ODI on the domestic investment in the short run is caused by the inadequate utilization of the ODI to import intermediary goods and purchase advanced technology from foreign countries. More importantly, the local firms’ inability to meet the demand for desired products has given room for foreign enterprises to invest in the host countries. However, this employment flow of external investments creates a barrier to exploiting the potential of internal investment channels/sources. Thus, the ODI has not contributed to stimulating the domestic investment in Bangladesh. The positive effect of economic growth on the domestic investment in Bangladesh shows the efficiency of the overall growth process to materialize the country’s vision to be a developed economy by 2041. Finally, the interest rates remain ineffective in impacting the domestic investment, whereas the violation of political rights takes part on an equal footing in Bangladesh.
Overall, the findings of this study imply that the IDI can energize local finance channels by investing in different government mega projects, such as Metrorail, bridge constructions, road constructions, and power plants for energy production. In this regard, the policymakers should formulate pragmatic policies to attract foreign investors in order to boost Bangladesh’s domestic investment. In addition, a national open-door policy would also be more conducive to foreign investors. The potential of the outward FDI flow is critical to strengthening the value-added industry by utilizing technology diffusion. Moreover, the inward FDI may fuel the domestic investment activities by improving the positive spillovers of technology and new outputs. This ultimately fortifies the local firms’ ability to increase production and sustain domestic investment growth.
This study has some limitations. First, this study does not integrate ‘trade’ and ‘net savings’ variables into its (study) model. Secondly, this research covers data ranging from 1976 to 2019 and excludes some recent years, including 2020, 2021, and 2022, which is another shortcoming of this investigation. Therefore, the extant drawbacks of this study require further research by adding ‘trade’ and ‘net savings’ variables to this study’s model with an up-to-date data span.

Author Contributions

Conceptualization, M.M.I. and M.T.; methodology, M.M.I.; software, M.M.I.; validation, A.N.M.W., M.M.A. and M.T.; formal analysis, M.M.I.; investigation, M.T.; resources, M.M.I.; data curation, M.M.I.; writing—original draft preparation, M.M.I.; writing—review and editing, M.M.I., M.M.A. and K.S.; visualization, K.S.; supervision, A.N.M.W. and M.T. All authors have read and agreed to the published version of the manuscript.

Funding

This research received no external funding.

Data Availability Statement

Data available in a publicly accessible repository.

Conflicts of Interest

The authors declare no conflict of interest.

Appendix A

Table A1. Summary statistics of the data property.
Domestic Investment (DI)FDI Inflow (IDI)FDI Outflow (ODI)Per Capita GDP (GDP)Real Interest Rates (RIR)Violation of Political Rights (VPR)
Mean24.560900.6428640.055538692.16356.7400263.800000
Median25.411130.5816930.006128602.93505.9365764.000000
Maximum31.570301.7354190.3646081287.82114.821434.000000
Minimum16.458680.0044910.000391411.1646−4.3168333.000000
Std. Dev.4.4029460.5290850.093574254.87913.5081040.406838
Skewness−0.3542230.3389651.8541680.825373−0.381102−1.500000
Kurtosis2.1377861.9400365.4926362.5569095.2294983.250000
Jarque–Bera1.5566351.97889024.956233.6516156.93952011.32812
Probability0.4591780.3717830.0000040.1610880.0311250.003468
Sum736.826919.285931.66614120764.91202.2008114.0000
Sum Sq. Dev.562.19208.1179910.2539271883937.356.89704.800000
Observations444444444444

References

  1. Acemoglu, Daron. 2012. Introduction to Economic Growth. Journal of Economic Theory 147: 545–50. [Google Scholar] [CrossRef]
  2. Adams, Samuel. 2009. Foreign Direct Investment, Domestic Investment, and Economic Growth in Sub-Saharan Africa. Journal of Policy Modeling 31: 939–49. [Google Scholar] [CrossRef]
  3. Agosin, Manuel R., and Roberto Machado. 2005. Foreign Investment in Developing Countries: Does It Crowd in Domestic Investment? Oxford Development Studies 33: 149–62. [Google Scholar] [CrossRef] [Green Version]
  4. Ali, Walid, and Ali Mna. 2019. The Effect of FDI on Domestic Investment and Economic Growth Case of Three Maghreb Countries: Tunisia, Algeria and Morocco. International Journal of Law and Management 61: 91–105. [Google Scholar] [CrossRef]
  5. Ali, Usman, and Jian-Jun Wang. 2018. Does Outbound Foreign Direct Investment Crowd Out Domestic Investment in China? Evidence from Time Series Analysis. Global Economic Review 47: 419–33. [Google Scholar] [CrossRef]
  6. Ali, Usman, Wei Shan, Jian-Jun Wang, and Azka Amin. 2018. Outward Foreing Direct Investment and Economic Growth in China: Evidence from Asymetric ARDL Approach. Journal of Business Economics and Management 19: 706–21. [Google Scholar] [CrossRef] [Green Version]
  7. Ali, Usman, Jian-Jun Wang, Veronica Patricia Yanez Morales, and Meng-Meng Wang. 2019. Foreign Direct Investment Flows and Domestic Investment in China: A Multivariate Time Series Analysis. Investment Analysts Journal 48: 42–57. [Google Scholar] [CrossRef]
  8. Al-sadiq, Ali J. 2013. Outward Foreign Direct Investment and Domestic Investment: The Case of Developing Countries. IMF Working Papers 13/52. Washington, DC: International Monetary Fund. [Google Scholar] [CrossRef]
  9. Ameer, Waqar, Helian Xu, and Mohammed Saud M Alotaish. 2017. Outward Foreign Direct Investment and Domestic Investment: Evidence from China. Economic Research-Ekonomska Istraživanja 30: 777–88. [Google Scholar] [CrossRef] [Green Version]
  10. Ameer, Waqar, Helian Xu, Kazi Sohag, and Syed Hasanat Shah. 2021. Outflow FDI and Domestic Investment: Aggregated and Disaggregated Analysis. Sustainability 13: 7240. [Google Scholar] [CrossRef]
  11. Andersen, Palle Schelde (deceased), and Philippe Hainaut. 1998. Foreign Direct Investment and Employment in the Industrial Countries. BIS Working Paper No. 61. Basle: Bank for International Settlements. [Google Scholar] [CrossRef] [Green Version]
  12. Arndt, Christian, Claudia M. Buch, and Monika E. Schnitzer. 2010. FDI and Domestic Investment: An Industry-Level View. The BE Journal of Economic Analysis & Policy 10: 1–45. [Google Scholar] [CrossRef] [Green Version]
  13. Bashar, Omar K. M. R., and Habibullah Khan. 2007. Liberalization and Growth: An Econometric Study of Bangladesh. U21Global Working Paper Series, No. 001/2007; Kuala Lumpur: U21Global. [Google Scholar] [CrossRef]
  14. Business France. 2019. Business France Annual Report 2018. La French Tec. Available online: https://www.businessfrance.fr/discover-france-news-business-france-publishes-2018-annual-report# (accessed on 25 September 2020).
  15. Carvalho, Carlos, Andrea Ferrero, and Fernanda Nechio. 2016. Demographics and Real Interest Rates: Inspecting the Mechanism. European Economic Review 88: 208–26. [Google Scholar] [CrossRef] [Green Version]
  16. Chen, Kun-Ming, and Shu-Fei Yang. 2013. Impact of Outward Foreign Direct Investment on Domestic R&D Activity: Evidence from T Aiwan’s Multinational Enterprises in Low-wage Countries. Asian Economic Journal 27: 17–38. [Google Scholar]
  17. Chen, George S., Yao Yao, and Julien Malizard. 2017. Does Foreign Direct Investment Crowd in or Crowd out Private Domestic Investment in China? The Effect of Entry Mode. Economic Modelling 61: 409–19. [Google Scholar] [CrossRef]
  18. Desai, Mihir A, C. Fritz Foley, and James R. Hines. 2005. Foreign Direct Investment and the Domestic Capital Stock. American Economic Review 95: 33–38. [Google Scholar] [CrossRef] [Green Version]
  19. Dickey, David A., and Wayne A. Fuller. 1981. Likelihood Ratio Statistics for Autoregressive Time Series with a Unit Root. Econometrica 49: 1057–72. [Google Scholar] [CrossRef]
  20. Elheddad, Mohamed. 2019. Foreign Direct Investment and Domestic Investment: Do Oil Sectors Matter? Evidence from Oil-Exporting Gulf Cooperation Council Economies. Journal of Economics and Business 103: 1–12. [Google Scholar] [CrossRef]
  21. Farla, Kristine, Denis De Crombrugghe, and Bart Verspagen. 2016. Institutions, Foreign Direct Investment, and Domestic Investment: Crowding out or Crowding in? World Development 88: 1–9. [Google Scholar] [CrossRef] [Green Version]
  22. Feldstein, Martin S. 1995. The Effects of Outbound Foreign Direct Investment on the Domestic Capital Stock. In The Effects of Taxation on Multinational Corporations. Chicago: University of Chicago Press, pp. 43–66. [Google Scholar]
  23. Feldstein, Martin S., and Charles Horioka. 1980. Domestic Saving and International Capital Flows. The Economic Journal 90: 314. [Google Scholar] [CrossRef]
  24. Gibney, M., L. Cornett, R. Wood, and A. Daniel. 2019. Political Terror Scale 1976–2018. Asheville: University of North Carolina. Available online: http://www.politicalterrorscale.org/ (accessed on 10 March 2020).
  25. Goedegebuure, R. V. 2006. The Effects of Outward Foreign Direct Investment on Domestic Investment. Investment Management and Financial Innovations 3: 9–22. [Google Scholar]
  26. Goh, Soo Khoon, and Robert McNown. 2020. Macroeconomic Implications of Population Aging: Evidence from Japan. Journal of Asian Economics 68: 101198. [Google Scholar] [CrossRef]
  27. Gujarati, Damodar N., and Dawn C. Porter. 2010. Essentials Ofeconometrics, 4th ed. New York: McGraw-Hill Irwin. [Google Scholar]
  28. Hanousek, Jan, Anastasiya Shamshur, Jan Svejnar, and Jiri Tresl. 2021. Corruption Level and Uncertainty, FDI and Domestic Investment. Journal of International Business Studies 52: 1750–74. [Google Scholar] [CrossRef]
  29. He, Qing, Pak-Ho Leung, and Terence Tai-Leung Chong. 2013. Factor-augmented VAR analysis of the monetary policy in China. China Economic Review 25: 88–104. [Google Scholar] [CrossRef]
  30. Hejazi, Walid, and Peter Pauly. 2003. Motivations for FDI and Domestic Capital Formation. Journal of International Business Studies 34: 282–89. [Google Scholar] [CrossRef]
  31. Herzer, Dierk. 2010. Outward FDI and Economic Growth. Journal of Economic Studies 37: 476–94. [Google Scholar] [CrossRef]
  32. Herzer, Dierk, and Mechthild Schrooten. 2008. Outward FDI and Domestic Investment in Two Industrialized Countries. Economics Letters 99: 139–43. [Google Scholar] [CrossRef]
  33. Imbriani, Cesare, Rosanna Pittiglio, and Filippo Reganati. 2011. Outward Foreign Direct Investment and Domestic Performance: The Italian Manufacturing and Services Sectors. Atlantic Economic Journal 39: 369–81. [Google Scholar] [CrossRef]
  34. Islam, Md. Monirul, and Md. Saiful Islam. 2021a. Energy Consumption–Economic Growth Nexus within the Purview of Exogenous and Endogenous Dynamics: Evidence from Bangladesh. OPEC Energy Review. [Google Scholar] [CrossRef]
  35. Islam, Md. Monirul, and Md. Saiful Islam. 2021b. Globalization and Politico-administrative Factor-driven Energy-growth Nexus: A Case of South Asian Economies. Journal of Public Affairs, e2736. [Google Scholar] [CrossRef]
  36. Islam, Md. Monirul, Kazi Sohag, and Muhammad Shahbaz. 2022. Assessment of Nexus between Energy Consumption and Sustainable Development in Russian Federation: A Disaggregate Analysis. World Development Sustainability 1: 100027. [Google Scholar] [CrossRef]
  37. Ivanović, Igor. 2015. Impact of Foreign Direct Investment (FDI) on Domestic Investment in Republic of Croatia. Review of Innovation and Competitiveness: A Journal of Economic and Social Research 1: 137–60. [Google Scholar] [CrossRef] [Green Version]
  38. Jordan, Soren, and Andrew Q Philips. 2018. Cointegration Testing and Dynamic Simulations of Autoregressive Distributed Lag Models. The Stata Journal 18: 1–22. [Google Scholar] [CrossRef] [Green Version]
  39. Jude, Cristina. 2019. Does FDI Crowd out Domestic Investment in Transition Countries? Economics of Transition and Institutional Change 27: 163–200. [Google Scholar] [CrossRef]
  40. Li, Xiaoying, and Xiaming Liu. 2005. Foreign Direct Investment and Economic Growth: An Increasingly Endogenous Relationship. World Development 33: 393–407. [Google Scholar] [CrossRef]
  41. Li, Jian, Roger Strange, Lutao Ning, and Dylan Sutherland. 2016. Outward Foreign Direct Investment and Domestic Innovation Performance: Evidence from China. International Business Review 25: 1010–19. [Google Scholar] [CrossRef] [Green Version]
  42. Mahmood, Haider, and A. R. Chaudhary. 2012. Foreign Direct Investment-Domestic Investment Nexus in Pakistan. Middle-East Journal of Scientific Research 11: 1500–1507. [Google Scholar]
  43. Makki, Shiva S, and Agapi Somwaru. 2004. Impact of Foreign Direct Investment and Trade on Economic Growth: Evidence from Developing Countries. American Journal of Agricultural Economics 86: 795–801. [Google Scholar] [CrossRef]
  44. McNown, Robert, Chung Yan Sam, and Soo Khoon Goh. 2018. Bootstrapping the Autoregressive Distributed Lag Test for Cointegration. Applied Economics 50: 1509–21. [Google Scholar] [CrossRef]
  45. Mengistu, Alemu Aye, and Bishnu Kumar Adhikary. 2011. Does Good Governance Matter for FDI Inflows? Evidence from Asian Economies. Asia Pacific Business Review 17: 281–99. [Google Scholar] [CrossRef]
  46. Miao, Miao, Dinkneh Gebre Borojo, Jiang Yushi, and Tigist Abebe Desalegn. 2021. The Impacts of Chinese FDI on Domestic Investment and Economic Growth for Africa. Cogent Business & Management 8: 1886472. [Google Scholar]
  47. Min, Feng, Fenghua Wen, and Xiong Wang. 2022. Measuring the effects of monetary and fiscal policy shocks on domestic investment in China. International Review of Economics & Finance 77: 395–412. [Google Scholar]
  48. Ndikumana, Leonce, and Sher Verick. 2008. The Linkages between FDI and Domestic Investment: Unravelling the Developmental Impact of Foreign Investment in Sub-Saharan Africa. Development Policy Review 26: 713–26. [Google Scholar] [CrossRef] [Green Version]
  49. Ni, Bin, Mariana Spatareanu, Vlad Manole, Tsunehiro Otsuki, and Hiroyuki Yamada. 2017. The Origin of FDI and Domestic Firms’ Productivity—Evidence from Vietnam. Journal of Asian Economics 52: 56–76. [Google Scholar] [CrossRef]
  50. Onaran, Özlem, Engelbert Stockhammer, and Klara Zwickl. 2013. FDI and Domestic Investment in Germany: Crowding in or Out?”. International Review of Applied Economics 27: 429–48. [Google Scholar] [CrossRef]
  51. Pesaran, M. Hashem. 2015. Time Series and Panel Data Econometrics. Oxford: Oxford University Press. [Google Scholar]
  52. Pesaran, M. Hashem, Yongcheol Shin, and Richard J. Smith. 2001. Bounds Testing Approaches to the Analysis of Level Relationships. Journal of Applied Econometrics 16: 289–326. [Google Scholar] [CrossRef]
  53. Prasanna, N. 2010. Direct and Indirect Impact of Foreign Direct Investment (FDI) on Domestic Investment (DI) in India. Journal of Economics 1: 77–83. [Google Scholar] [CrossRef]
  54. Rodrik, Dani. 2006. Goodbye Washington Consensus, Hello Washington Confusion? A Review of the World Bank’s Economic Growth in the 1990s: Learning from a Decade of Reform. Journal of Economic Literature 44: 973–87. [Google Scholar] [CrossRef] [Green Version]
  55. Rubio-Ramirez, Juan F., Daniel F. Waggoner, and Tao Zha. 2010. Structural vector autoregressions: Theory of identification and algorithms for inference. The Review of Economic Studies 77: 665–96. [Google Scholar] [CrossRef] [Green Version]
  56. Salim, Ruhul, Yao Yao, George Chen, and Lin Zhang. 2017. Can Foreign Direct Investment Harness Energy Consumption in China? A Time Series Investigation. Energy Economics 66: 43–53. [Google Scholar] [CrossRef]
  57. Sam, Chung Yan, Robert McNown, and Soo Khoon Goh. 2019. An Augmented Autoregressive Distributed Lag Bounds Test for Cointegration. Economic Modelling 80: 130–41. [Google Scholar] [CrossRef]
  58. Serrasqueiro, Zélia. 2017. Investment Determinants: High-Investment versus Low-Investment Portuguese SMEs. Investment Analysts Journal 46: 1–16. [Google Scholar] [CrossRef]
  59. Shah, Syed Hasanat, Hafsa Hasnat, Simon Cottrell, and Mohsin Hasnain Ahmad. 2020. Sectoral FDI Inflows and Domestic Investments in Pakistan. Journal of Policy Modeling 42: 96–111. [Google Scholar] [CrossRef]
  60. Su, Kun, Rui Wan, and Taiwen Feng. 2015. Government Control Structure and Allocation of Credit: Evidence from Government-Owned Companies in China. Investment Analysts Journal 44: 151–70. [Google Scholar] [CrossRef]
  61. Sylwester, Kevin. 2005. Foreign Direct Investment, Growth and Income Inequality in Less Developed Countries. International Review of Applied Economics 19: 289–300. [Google Scholar] [CrossRef]
  62. Szkorupová, Zuzana. 2015. Relationship between Foreign Direct Investment and Domestic Investment in Selected Countries of Central and Eastern Europe. Procedia Economics and Finance 23: 1017–22. [Google Scholar] [CrossRef]
  63. Tan, Bee Wah, Soo Khoon Goh, and Koi Nyen Wong. 2016. The Effects of Inward and Outward FDI on Domestic Investment: Evidence Using Panel Data of ASEAN–8 Countries. Journal of Business Economics and Management 17: 717–33. [Google Scholar] [CrossRef] [Green Version]
  64. Türkcan, Burcu. 2008. How Does FDI and Economic Growth Affect Each Other? The OECD Case. In Proceedings of the International Conference on Emerging Economic Issues in a Globalizing World. İzmir: Izmir University of Economics, pp. 21–40. [Google Scholar]
  65. Ullah, Irfan, Mahmood Shah, and Farid Ullah Khan. 2014. Domestic Investment, Foreign Direct Investment, and Economic Growth Nexus: A Case of Pakistan. Economics Research International 2014: 592719. [Google Scholar] [CrossRef] [Green Version]
  66. UNCTAD (United Nations Conference on Trade and Development). 2018. Available online: https://unctad.org/en/PublicationsLibrary/wir2018_en.pdf (accessed on 10 October 2020).
  67. UNCTAD (United Nations Conference on Trade and Development). 2019. World Investment Report 2019. Available online: https://unctad.org/en/PublicationsLibrary/wir2019_en.pdf (accessed on 12 December 2020).
  68. Wang, Miao. 2010. Foreign Direct Investment and Domestic Investment in the Host Country: Evidence from Panel Study. Applied Economics 42: 3711–21. [Google Scholar] [CrossRef] [Green Version]
  69. World Bank. 2020. Doing Business 2020: Comparing Business Regulation in 190 Economies. Washington, DC: World Bank. [Google Scholar] [CrossRef] [Green Version]
  70. World Bank. 2022. World Development Indicators. Available online: https://data.worldbank.org/products/wdi (accessed on 10 January 2022).
  71. Xu, Yang, and Xiaoling Yuan. 2012. Research on China’s Regional Differences of Crowding-In or Crowding-Out Effect of FDI on Domestic Investment. Modern Economy 3: 884–90. [Google Scholar] [CrossRef] [Green Version]
  72. You, Kefei, and Offiong Helen Solomon. 2015. China’s Outward Foreign Direct Investment and Domestic Investment: An Industrial Level Analysis. China Economic Review 34: 249–60. [Google Scholar] [CrossRef]
  73. Zivot, Eric, and Donald Andrews. 2002. Further Evidence on the Great Crash, the Oil-Price Shock, and the Unit-Root Hypothesis. Journal of Business & Economic Statistics 20: 25–44. [Google Scholar]
Figure 1. The movement of FDI inflows and outflows in Bangladesh.
Jrfm 15 00603 g001
Figure 2. Stability test of the model.
Jrfm 15 00603 g002
Figure 3. Inward FDI flows and domestic investment. The above graphs portray ±10% in the inward FDI flow and its impact on domestic investment. The dots depict the average prediction value, while the dark blue to light blue lines indicate 75%, 90%, and 95% confidence interval, respectively.
Jrfm 15 00603 g003
Figure 4. Outward FDI flows and domestic investment. The above graphs portray ±10% in the outward FDI flow and its impact on domestic investment. The dots depict the average prediction value, while the dark blue to light blue lines indicate 75%, 90%, and 95% confidence interval, respectively.
Jrfm 15 00603 g004
Figure 5. Economic growth and domestic investment. The above graphs portray ±10% in the economic growth and its impact on domestic investment. The dots depict the average prediction value, while the dark blue to light blue lines indicate 75%, 90%, and 95% confidence interval, respectively.
Jrfm 15 00603 g005
Figure 6. Real interest rate and domestic investment. The above graphs portray ±10% in the real interest rate and its impact on domestic investment. The dots depict the average prediction value, while the dark blue to light blue lines indicate 75%, 90%, and 95% confidence interval, respectively.
Jrfm 15 00603 g006
Figure 7. Violation of political rights and domestic investment. The above graphs portray ±10% in the violation of political rights and its impact on domestic investment. The dots depict the average prediction value, while the dark blue to light blue lines show 75%, 90%, and 95% confidence interval, respectively.
Jrfm 15 00603 g007
Table 1. Summary of the existing literature.
AuthorsTitlesMethods and CountryFindings
Agosin and Machado (2005)Foreign Investment in Developing Countries: Does it Crowd in Domestic Investment?GMM and Latin America, Asia, and AfricaCrowding-out effect for Latin America and crowding-in effect for Asia and Africa.
Ndikumana and Verick (2008)The Linkages Between FDI and Domestic Investment: Unravelling the Developmental Impact of Foreign Investment in Sub-Saharan AfricaFixed effects model and Sub-Saharan AfricaCrowding-in effect
Arndt et al. (2010)FDI and Domestic Investment: An Industry-Level ViewOLS, DOLS, and FMOLS and GermanyFDI DI
Prasanna (2010)Direct and Indirect Impact of Foreign Direct Investment (FDI) on Domestic Investment (DI) in IndiaMultiple linear regression (MLR) and IndiaFDI DI
Herzer and Schrooten (2008)Outward FDI and domestic investment in two industrialized countriesAutoregressive distributed lag (ARDL) and the USA and GermanyODI DI in the USA and complementary and substitution effects in the long run and short run, respectively, in Germany.
Onaran et al. (2013)FDI and domestic investment in Germany: crowding in or out?Generalized method of moments (GMM) and developing and developed countriesCrowding-out in low-wage countries; crowding-in high-wage countries.
Tan et al. (2016)The Effects of Inward and Outward FDI on Domestic Investment: Evidence using Panel Data of ASEAN-8 CountriesMean group (MG) and pooled mean group (PMG) and ASEAN-8 economiesIDI DI
Farla et al. (2016)Institutions, Foreign Direct Investment, and Domestic Investment: Crowding Out or Crowding In?Alternative GMM estimation and 46 FDI-receiving countries Crowding-out effect
Ali and Mna (2019)The effect of FDI on domestic investment and economic growth case of three Maghreb countries: Tunisia, Algeria, and MoroccoGMM and Tunisia, Algeria, and MoroccoFDI DI
Shah et al. (2020)Sectoral FDI inflows and domestic investments in PakistanAutoregressive distributed lag (ARDL) and PakistanCrowding-in effect
Jude (2019)Does FDI crowd out domestic investment in transition countries?GMM estimation and 10 Central and Eastern European countriesCrowding-in effect in the long run
Ameer et al. (2021)Outflow FDI and Domestic Investment: Aggregated and Disaggregated Analysis Cross-sectional autoregressive distributed lag (CS-ARDL) and GCC countriesCrowding-out effect
Hanousek et al. (2021)Corruption level and uncertainty, FDI, and domestic investmentMatched sample regression (MSR) and 13 European countriesNo effect of FDI on DI
Miao et al. (2021)The impacts of Chinese FDI on domestic investment and economic growth for AfricaThe two-step system GMM estimation and 44 African countriesPositive effect of FDI on DI
Note: DI: Domestic investment, IDI: Inward FDI, ODI: Outward FDI, and FDI DI: Positive effect of foreign direct investment on domestic investment.
Table 2. Variable definitions and sources.
Variable TypeNameLabelDescriptionSource
Dependent variableDomestic investmentLnDIGross capital formation to GDP ratio(World Bank 2020)
Independent VariablesInward FDILnIDINet inward FDI to GDP ratio(World Bank 2020)
Outward FDILnODINet outward FDI to GDP ratio(World Bank 2020)
Economic growthLnGDPPer capita GDP growth(World Bank 2020)
Real interest rateRIRReal interest rate in %(World Bank 2020)
Violation of political rightsLnVPRPolitical terror scale (PTS)(Gibney et al. 2019)
Note: Ln denotes the natural logarithms.
Table 3. Results of unit root tests.
SeriesLevelFirst Difference
ADFZABreakADFZABreak
LnDI−2.386−4.664 ***1996−5.349 *−3.7411985
LnIDI−1.534−4.5581997−8.176 *−9.130 *1990
LnODI−2.393−4.2022007−7.558 *−6.183 *2013
LnGDP−5.745 *−6.236 *2005−13.741 *−11.407 *1990
RIR−3.963 *−8.017 *1985−7.718 *−4.715 ***1984
LnVPR−3.136 **−6.134 *1987−8.572 *−7.573 *1986
Note: *, **, and *** depict 1%, 5%, and 10% statistical significance levels, respectively. All of these estimates integrate the constant and the trend.
Table 4. Lag selection for the ARDL model.
LagLogLLRFPEAICSCHQ
0−180.4659NA0.0002898.8793299.1275678.970318
1−39.56758234.83052.00 × 10−63.8841715.621840 *4.521095 *
23.05883658.86505 *1.62 × 10−6 *3.568627 *6.7957284.751487
Note: * divulges diverse criteria-yielded lag orders.
Table 5. Results of the Augmented ARDL Model.
VariablesCoefficientst-StatisticProb.
Long run
Constant0.5003 * (0.1407)3.550.001
L n I D I t 1 0.0196 ** (0.00782.520.017
L n O D I t 1 0.0045 (0.0055)0.820.420
L n G D P t 1 0.0472 ** (0.0297)1.590.022
R I R t 1 0.0102 (0.0142)0.720.478
L n V P R t 1 0.0407 (0.0482)0.840.405
Short run
Δ L n I D I 0.0203 * (0.0059)3.410.002
Δ L n O D I −0.0035 (0.0057)−0.610.544
Δ L n G D P 0.0869 *** (0.0497)1.750.091
R I R t 1 0.0102 (0.0142)0.720.478
Δ L n V P R 0.0668 (0.0564)1.180.246
Δ DUM_90−0.0478 (0.0503)−0.940.351
Δ DUM_13−0.0217 (0.0419)−0.510.608
Δ DUM_84−0.1724 ** (0.0657)−2.620.014
Δ DUM_86−0.0886 (0.0646)−1.370.182
ECT (−1)−0.2213 ** (0.0538)−2.260.031
Diagnostic checks for model fitting
F-test4.56 *
t-test (lagged DV)6.80 *
F-test (lagged IDV)4.50 *
N43
R20.983
J–B Normality1.016 (0.601)
χ2 LM3.405 (0.182)
χ2 ARCH0.792 (0.373)
χ2 RESET1.156 (0.255)
Notes: *, **, and *** depict the statistical significance at 1 %, 5%, and 10% levels, respectively. The standard errors are in (). The computed F-test’s value emanates the from H0: ^ = γ ^ = 0 against H1: ^ = γ ^ 0 for the lag level of the coefficient of the overall model; t-test’s value derives from the H0: ^ = 0 , against H1:   ^ < 0 for the lag level coefficient of the dependent variable (lagged DV); and F-test’s value stems from the H0: γ ^ = 0 , against H1: γ ^ 0 . DUM represents the dummy variables, in which 90, 13, 84, and 86 are 1990, 2013, 1984, and 1986, respectively. N points to the whole sample. The heteroscedasticity check measure is the χ2 ARCH test; the serial correlation check measure is the χ2 LM test; the normality check measure is the Jarque–Bera (J–B) normality test; and the model specification check for linearity is the χ2 RESET.
Publisher’s Note: MDPI stays neutral with regard to jurisdictional claims in published maps and institutional affiliations.

