Review

Causes and Effects of Sand and Dust Storms: What Has Past Research Taught Us? A Survey

by
Christian Opp
1,*,
Michael Groll
2,
Hamidreza Abbasi
3 and
Mansour Ahmadi Foroushani
1
1
Faculty of Geography, Philipps-Universität Marburg, D-35032 Marburg, Germany
2
Department of Foreign Affairs, Philipps-Universität Marburg, D-35032 Marburg, Germany
3
Research Institute Forests and Rangelands, Agricultural Research Education and Extension (AREEO) Iran, Tehran 13165-118, Iran
*
Author to whom correspondence should be addressed.
J. Risk Financial Manag. 2021, 14(7), 326; https://doi.org/10.3390/jrfm14070326
Submission received: 19 May 2021 / Revised: 24 June 2021 / Accepted: 25 June 2021 / Published: 15 July 2021
(This article belongs to the Special Issue Political Economy of Natural Disasters)

Abstract

:
Barren ground and sites with low coverage by vegetation (e.g., dunes, soil surfaces, dry lakes, and riverbeds) are the main source areas of sand and dust storms (SDS). The understanding of causes, processes (abrasion, deflation, transport, deposition), and influencing factors of sandy and dusty particles moving by wind both in the boundary layer and in the atmosphere are basic prerequisites to distinguish between SDS. Dust transport in the atmosphere modulates radiation, ocean surface temperature, climate, as well as snow and ice cover. The effects of airborne particles on land are varied and can cause advantages and disadvantages, both in source areas and in sink or deposition areas, with disturbances of natural environments and anthropogenic infrastructure. Particulate matter in general and SDS specifically can cause severe health problems in human respiratory and other organs, especially in children. Economic impacts can be equally devastating, but the costs related to SDS are not thoroughly studied. The available data show huge economic damages caused by SDS and by the mitigation of their effects. Management of SDS-related hazards utilizes remote sensing techniques, on-site observations, and protective measures. Integrated strategies are necessary during both the planning and monitoring of these measures. Such integrated strategies can be successful when they are developed and implemented in close cooperation with the local and regional population and stakeholders.

1. Introduction

Due to the existence of a very large number of case studies on SDS problems, including analyses both on-site and using remote sensing detection methods (Furman 2003; Miller 2003; Goudie and Middleton 2006; Walker et al. 2009; Engelbrecht and Derbyshire 2010; Akhlaq et al. 2012; Ginoux et al. 2012; Groll et al. 2013; Lancaster et al. 2013; Rashki et al. 2013; Sissakian et al. 2013; Nabavi et al. 2016; Opp et al. 2016; Middleton 2017; Abbasi et al. 2018; Groll et al. 2018; Groll et al. 2019; Foroushani et al. 2020), the objective of this study is not to repeat these published results. The majority of SDS publications do not focus on a comprehensive approach integrating the causes, the wide range of effects on different natural, economic, and social spheres, and the side-effects associated with SDS consequences. Meteorologists focus mainly on atmospheric dust effects, some of them include climate effects, and only a small number of publications reflect the dust effects on the oceans (Moulin et al. 1997; Tegen 2003, 2016; Schepanski 2018; Ansmann et al. 2019). Other researchers focus on dust and sand deposition amounts per event or per investigation period (Orlovsky et al. 2009; Groll et al. 2013; Foroushani et al. 2019). Many of the publications describe particular effects of dust on land use and infrastructure, while only a minority of SDS publications reflects the health effects (c.f. WMO 2021) and mitigation measures for reducing the damaging effects of SDS. The biggest lack of knowledge exists regarding the economic evaluation of damages, as indirect costs are especially difficult to quantify (c.f. Al-Hemoud et al. 2019). Sand and dust storms are natural disasters. They occur not only in traditional drylands, but also in humid climate regions during long-term droughts, with direct and indirect effects of enormous consequences. However, with regard to different publication focuses, the causes, processes, forms, and effects of SDS are not always well-known, especially in areas where they did not occur during the past generations.
Knowing that a single review article cannot possibly cover all relevant aspects of this highly complex topic in equal depth, the overall aim of this literature review is to discuss SDS for those who remain unfamiliar with this phenomenon and its hazards. One objective of this article is to present a fundamental understanding of the prerequisites, processes, and main effects of aeolian sand and dust on sources and sinks in terrestrial and marine areas. Another objective is to summarize the existing knowledge regarding dust and sand storm effects on the environment and human health and to provide some examples of economic evaluations from the literature. The last objective highlights the potential effects of SDS mitigation and hazard reduction measures.

2. Causes, Prerequisites, and Origins of Sand and Dust Storms

Sand and dust storms (SDS) are common hazards, especially in semiarid and arid regions, caused by thunderstorms or strong air pressure gradients, which increase wind speed over a wide area (WMO 2021). Due to climate change effects, like increasing air pressure differences between the polar and the tropic zones, or longer drought periods, SDS have been occurring more frequently in the temperate climate zone in the recent past (Tegen et al. 2004; Gao 2010; Shao et al. 2011; Schepanski 2018). The UNCCD characterized 151 countries or 77% of all countries as affected by SDS and 45 countries or 23% are classified as SDS source areas (UNCCD 2021).
The essential prerequisites for sand and dust transport are sandy and dusty particles under dry and loose conditions on land surfaces (Martini and Chesworth 1992; Mahmoodi et al. 2016), as well as a wind strong enough to mobilize these particles by abrasion and/or deflation from the surface and to transport them (Lancaster et al. 2013).
Loose sandy and dusty particles can occur both as a result of on-site autochthonous parent material weathering (Zepp 2004), and as a result of allochthonous particle transport and deposition or sedimentation processes (Dietze et al. 2016). Some small sandy and dusty particles may also be created as a result of the low-energy, short-distance splashing effect of grains, so-called reptation, caused by high-energy saltation (Baas 2019).
It is possible to separate the aeolian (wind-caused) particle movement into four process-related phases: abrasion, deflation, transport, and deposition (Figure 1).
Abrasion is the loosening of single particles from fine-grained rock surfaces by wind forces (Goudie 2008). The term abrasion is also widely used for describing the particle release at coasts caused by wave forces (Temmerman et al. 2013). Deflation describes the particle removal from land surfaces by wind forces (Knight 2019). Negative landforms, so-called deflation hollows, can occur as a result of deflation processes. Positive landforms, e.g, yardangs, can also be a result of intensive deflation processes when the surrounding weak resistant materials have been eroded (Knight 2019). Abrasion and deflation processes on exposed soil surfaces are surface-related prerequisites for wind erosion.
The aeolian transport can take place as creep, saltation, reptation, and suspension (Figure 1). Creeping particles (>500 µm grain diameter) remain in close contact to the surface and are moved rolling and sliding by the wind. These gravel or sandy particles are too heavy to go into saltation. Saltation moves particles (70–500 µm grain diameter) by wind effects, ejecting them from the surface and entraining them into the airflow, following a ballistic trajectory until returning to the surface (Baas 2019). After colliding with the surface, the particles can start a new near-surface saltation trajectory. At the same time, during the surface collision, the sandy particles can contribute to the near-surface reptation as a result of particle splashing or sandblasting (Bagnold 1971). Sandblasted or splashed particles of 70–100 µm grain diameter can become part of the so-called modified saltation with longer trajectories (Baas 2019). Smaller silty particles (20–70 µm grain diameter) created by weathering, saltation, or reputation, can become part of a longer airflow, called short-term suspension (Baas 2019), while finest silty and clayey particles (<20 µm grain diameter) go into long-term suspension (Tegen and Fung 1995). Particles > 70 mm grain diameter will be deposited after less than one day. Particles < 70 µm grain diameter can remain in the atmosphere for up to several days and particles < 20 mm grain diameter for up to several weeks (Klose and Shao 2013; Mahowald et al. 2014; Schepanski 2018). It is possible to characterize moving particles by creep and saltation as gravel and sand, and moving particles by short-term and long-term suspension as silt and clay. Silt and clay can be summarized as dust.
All these particle moving processes depend on the wind parameters, namely speed, turbulence, and coherent flow structures (Wiggs and Weafer 2012; Semenov 2020), as their driving forces, modified by the cohesion forces between particles and soil surface as well as by the gravitational pull. The mobilization of sand and dust particles depends on the shear stress and the roughness of the surface (Tegen 2003) and is positively correlated to the near-surface wind speed (Bagnold 1971). Particles on the soil surface are moved and raised by wind through non-laminar flow and high wind speeds, which result in higher shear stress. The higher the surface roughness, the lower is the shear stress speed as friction and turbulences reduce the near-surface wind speed (Zepp 2004). Most wind speed and corresponding particle transportation data are based on wind tunnel experiments (Gilette 1967; Tegen 2003; Thieleman 2003; Semenov 2020). Tegen (2003) registered that particles with a diameter between 60 and 100 µm have the lowest critical shear stress speed (0.20 m/s or 0.72 km/h) to be moved by wind. Larger particles have a higher critical shear stress speed due to their increased weight, while smaller particles with a diameter of <10 µm (PM10 and PM2.5) also have a higher critical shear stress speed due to their increased particle cohesion caused by a larger specific surface area of smaller particles in relation to their volume (Tegen 2003). The critical shear stress speed is 0.35 m/s for a particle size of 10 µm and circa 1.10 m/s for a particle size of 2.0 µm. Furthermore, soil moisture greatly reduces soil erodibility, as moist particles are heavier and are interconnected by capillary forces, which increase the cohesion among particles (Willett et al. 2000) and between the particles and the soil surface. That is why the highest amounts of dust are emitted from deserts, semi-deserts, and desiccated lake beds. However, not only does the soil moisture influence the critical shear stress speed, but the wind velocity also modifies the soil moisture as higher wind speeds (and low relative air humidity) accelerate evaporation, and thereby reduce the near-surface moisture, enabling a more intense particle mobilization (Ishizuka et al. 2005; Meng et al. 2018; Matsushima et al. 2020).
The density of the vegetation cover is another parameter influencing the shear stress speed. Following the vegetation gradient from deserts to semi-deserts, short grass steppes (prairies), tundra, long grass steppes (prairies), not irrigated agricultural areas, irrigated agricultural areas, periwinkle and summer green coniferous trees, periwinkle and summer green deciduous trees, and periwinkle and summer green shrubs, the critical shear stress speed gradually increases from low to high values (Wu et al. 2006; Liu et al. 2020).
Soils surfaces can function both as source areas for wind erosion and deflation and as sink areas for deposition or sedimentation of airborne particles (Reiche et al. 2009). The source areas do have a key position in the chain of particle transport (Washington et al. 2003). The following surface features support the deflation process:
  • (large) wind-exposed areas (e.g., coasts, lakes, treeless areas, open pit mines);
  • drought/dryness (very low soil moisture) of the upper soil or sediment layer;
  • low degree of coverage by vegetation;
  • low degree of coverage by biological crusts;
  • loose surface-near soil structure of agriculturally used land by tillage or trampling.
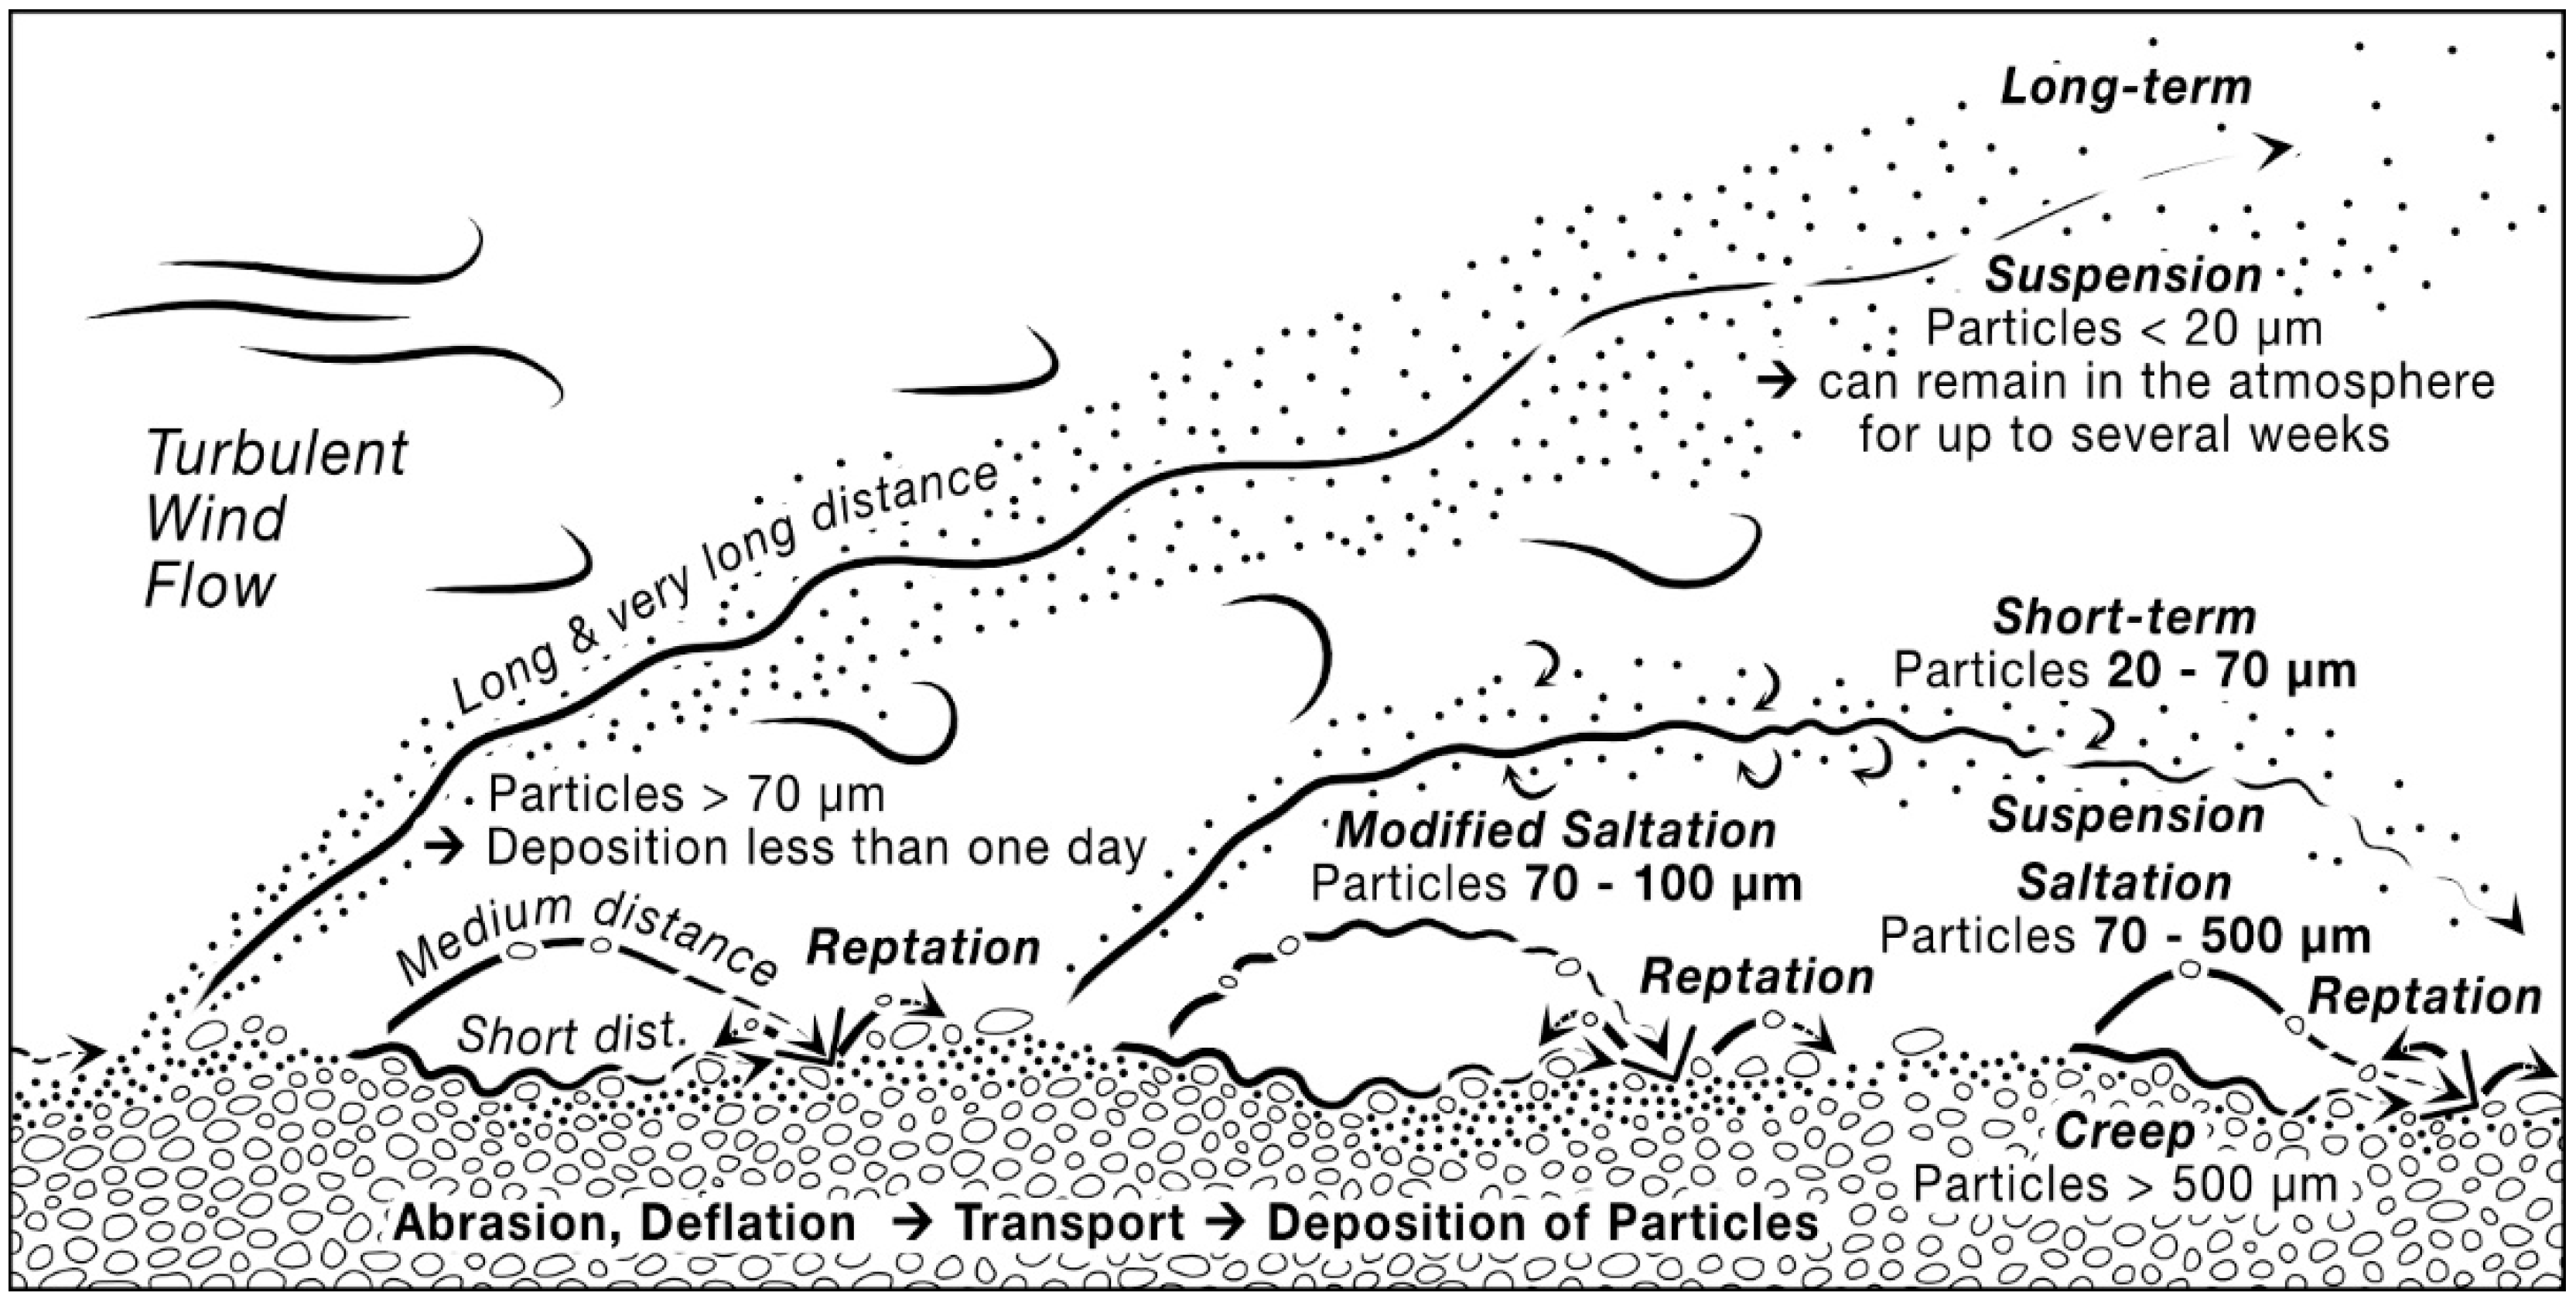
According to Shao et al. (2011) 90% of the dust in the atmosphere is of natural origin. Besides volcanic eruptions, marine terraces, and coastal dunes, the main sources of suspended dust are low precipitation areas like different kinds of deserts, semi-deserts, and arid grasslands. Dry lake and river beds with limnic and fluvial sediments, glacial and periglacial deposits, and ocean spray are other important natural source areas for the aeolian particle transport. The anthropogenic component of the aeolian particle load (10%) is caused especially by the alteration of soil surface covers, like overgrazed grasslands (Hoffmann et al. 2008), slashed and burned agricultural areas, and open-pit mines (Warren 2019). The land-use-related mobilization of dust and sand can reach quite substantial extents, as can be seen in the well-known dust bowl phenomenon in the central states of the USA (from North Dakota to Texas). Farmers had started transforming the indigenous grassland of the western plains into seasonally vegetation-free arable land during the late 19th and the beginning of the 20th century. This disturbance of the natural vegetation cover led to huge soil moisture deficits, which accelerated wind erosion and led to enormous economic losses for the farmers from the 1930s onward (Worster 1982; Cook et al. 2014). Other anthropogenic emissions of aerosols originate from power plants, traffic, industrial exhaust gases, domestic fuel, and other sources.
Particulate matter (PM) is part of aerosols. These PM particles are of such a small size, that they remain suspended in the air for a while. PMs are classified into different fractions depending on their grain size: PM10 are dusty particles of less than 10 µm; PM2.5, the so-called fine fraction of dust, has a grain size of less than 2.5 µm and is part of PM10. Particles between 2.5 µm and 10 µm represent the coarse fraction of the dust. Particles with a grain size less than 0.1 µm belong to the superfine dust fraction (UBA 2018).
Middleton and Kang (2017) have analyzed the countries affected directly by SDS and have shown that 151 countries worldwide are affected. Moreover, 45 countries were classified as source areas, among them 38 in Africa and Asia (84.4%). In accordance with Shao et al. (2011) and Schepanski (2018) the major dust source areas on Earth are particularly located along the northern (Tropic of Cancer) and the southern (Tropic of Capricorn) tropics. The highest amounts of emitted dust were detected along the Sahara Desert, the Arabian Peninsula, Iraq, Iran, Central Asia, northern China, and Mongolia in the so-called Afro-Asian Dust Belt. The Rub’al-Kali desert on the Arabian Peninsula and the Taklimakan Desert in Northwest China are known as the biggest Sand Seas on Earth. Particles from this dust belt are even transported transcontinental, and the transatlantic dust transport from the Sahara Desert to the Amazon Basin in South America is especially well documented (Goudie and Middleton 2001; Kaskaoutis et al. 2010).
There is also a considerable amount of Sahara dust (80–120 mln tons per year) deposited in Europe (Goudie and Middleton 2001), with the highest seasonal dust concentrations over South Europe being observed during spring and partly during summer (Moulin et al. 1997; Pederzoli et al. 2010). Moreover, the transpacific dust transport from Inner Asia and Northern China to North America up to Greenland (Shao et al. 2011; Middleton 2017) and the sediment transport from Central Australia to the Australian east coast and New Zealand are well known (Aragnou et al. 2021). Large amounts of dust are also transported within the dust belt from the Arabian Peninsula and Iraq to Iran (Foroushani et al. 2021), from the Central Asian deserts to Iran and Afghanistan (Abbasi et al. 2019; Rashki et al. 2021; Karami et al. 2021), from Mongolia and Inner Mongolia (Gobi Desert) to Northern China (Gao 2010). These large continental and transcontinental dust transports follow the global atmospheric circulation patterns. The Saharan and Sahel transatlantic dust transport is particularly active between December and April utilizing the northeasterly Passat winds. The deflation in the Sahel is strongly correlated with low rainfall. Based on dust optical thickness analysis from Meteosat retrievals, relationships between the North Atlantic Oscillation (NAO) and the dust transport to the North Atlantic and the Mediterranean were confirmed by Moulin et al. (1997) and by Tegen et al. (2013).
During fall and winter, the contribution of Saharan dust to the total dust load, especially in southern and parts of Central Europe reaches up to 30% (Pederzoli et al. 2010). However, even his high amount is only 12% of the total Saharan dust transported globally (Karanasiou et al. 2012). The Southwest Asia dust transport from the Arabian Peninsula, Kuwait, Iraq, and Iran, is closely connected to the Indian monsoon circulation. The Central Asian and the Northeast Asian dust transport, respectively, during spring from the Turan Lowland and Kazakhstan, and from Mongolia and Northern China, respectively, to Korea, Japan, the North Pacific, and North America follows the North Atlantic and Arctic Oscillation (Mao et al. 2011). The Australian dust transport is especially active during El-Nino events when Australia is under dry conditions with less vegetation cover. The dust transport paths can be reconstructed using the HYSPLIT approach (single-particle Lagrangian integrated trajectory) (Yamamoto et al. 2013).
Besides drylands, all areas characterized by wind erosion (Oldeman 1992) are typical source areas of sand and dust storms abrasion, deflation, transport, and deposition of sand and dust.
Summarizing the causes of SDS, it is useful to distinguish between the prerequisites of loose particles and wind. Loose particles occur as a result of:
  • Weathering.
  • Splash effects of the grains.
  • Saltation (Lancaster et al. 2013; Mahmoodi et al. 2016). The more loose the particles, the higher their erodibility for wind erosion and the higher the SDS potential.
Wind occurs as a consequence of air pressure differences. The higher the wind velocity, the higher the abrasion and deflation forces for wind erosion and the higher the SDS potential (Tegen et al. 2004; Gao 2010; Shao et al. 2011; Schepanski 2018).
The lower the soil moisture and the longer the drought period (c.f. Farzanegan et al. 2021) the higher the wind erosion and SDS potential (Abbasi et al. 2018; WMO 2021).
A key factor influencing the erodibility of surfaces is the coverage by vegetation and, or biological crusts. The shorter the duration of vegetation cover and the lower the degree of coverage by biological crusts the higher the deflation and the SDS potential (Wu et al. 2006; Liu et al. 2020).

3. Effects of Sand and Dust Storms

3.1. The Atmosphere-Ocean Interaction of SDS Effects

Among the eroded and airborne particles, sandy grains remain on or near the soil surface. Depending on the wind speed they can be subject to a short-time uplift, for instance by saltation, but they soon return to the surface again because of their larger grain diameter and their higher weight (cf. Figure 1). Smaller particles, like silt and clay, which can be summarized as dust, can stay in suspension for prolonged periods. That is why they have a wide range of effects in the higher atmosphere. Their greater spatial reach also means that they can interact with regions far away from their sources and with the oceans.
More than 2000 million tons of dust enter the atmosphere every year. Of that, 75% will be deposited on land and 25% on the ocean (Shao et al. 2011), predominantly as dry and to a much smaller degree as wet deposition. Most of the suspended dust in the atmosphere will be deposited on the same continent from where it originated. Under special air pressure and atmospheric circulation conditions, for instance, the trade wind or Passat circulation, dust can also be transported at elevations of several thousand kilometers across the oceans from one continent to another. Some very fine particulate matter (0.1–20 mm; PM20) can remain in suspension for very long periods and orbit the Earth several times, predominately within the troposphere (Power 2003).
Although most of the dust layers in the atmosphere are a temporal limited phenomenon, they still cause various effects, influencing the energy balance and the global climate. Aeolian dust is a mixture of various mineral species of different shapes, coatings, and mixing states with distinctive chemical, optical, as well as ice- and cloud-nucleating properties (Gassó et al. 2010). The reactions with vapor and trace gases in the atmosphere are depending on these properties. Dark carbonaceous particles from eroded humic soil surfaces, particles emitted from coal or biomass burning (e.g., in rainforests; (Levine 1999), or exhaust particles from vehicles (Monna et al. 1997) and urban areas (Vester et al. 2007) heat the atmosphere because 50% of the incoming solar energy will be absorbed by dust (Shao et al. 2011). This energy absorption negatively affects the energy balance at ground surface level, causing a cooling effect approximately three times stronger than the heating effect of the greenhouse gases (Shao et al. 2011). The aeolian transport of humic aerosols also has effects on the global carbon cycle and the regional carbon balance. They are involved in the formation of atmospheric brown clouds (ABC), influencing both global and regional climate systems (Ramanathan et al. 2005; Engling and Gelencsér 2010). The interaction of dust with anthropogenic substances modifies not only their optical properties but also their atmospheric lifetimes (Zhang 2008). Non-dark particles, like sulfates and light-colored organic carbon, reflect incoming solar radiation, and thus counteract warming (Giere and Querol 2010). This was observed after large volcanic eruptions like the 1991 Mount Pinatubo eruption (Prata 2009), causing substantial cooling in the Northern Hemisphere during the summer of 1992 (Durant et al. 2010). Dust in the atmosphere affects cloud formation and thickness because dust particles can function as condensation nuclei or as ice forming nuclei, depending on size, chemical composition, mixing state, and particle concentration (Giere and Querol 2010). Dust acting as ice nuclei in clouds increases cloud thickness and water drop size (Gassó et al. 2010). Therefore, dust also influences rainfall patterns. The direction of this influence depends on various parameter combinations within the cloud and its surrounding. Smaller droplets often do not fall to the ground and an increase in particle numbers may prevent a cloud from raining out (Gassó et al. 2010). Therefore, both more and/or less rain are possible outcomes of dust in the atmosphere, with consequences for the global water cycle and the regional water balance (Ramanathan et al. 2001). However, the interactions between dust and gases, acids, condensation of vapors, and alteration of optical properties during cloud formation are highly complex and our understanding of these dust–atmosphere interactions is still limited (Buseck and Pósfai 1999; Stevens and Feingold 2009).
Another well-known effect of dust and aerosols in the atmosphere is the reduced visibility. This is utilized in some regions, like in Central Asia, to categorize the severity of dust events by the use of optical markers at a specific distance (1000 m) from the meteorological station observing the event (UNEP et al. 2016). However, reduced visibility results not only from the above-mentioned processes of particle abrasion, deflation, and dust transport through the atmosphere. Particle shape, elemental and mineralogical compositions (e.g., the presence of light-absorbing substances such as iron-oxides), and the mixing state affect the optical characteristics of the dust. Reduced atmospherical visibility can be also a result of volcanic eruptions, e.g., the Eyjafjallajökul, in Iceland in 2010 (Gíslason and Alfredsson 2010), wildfires, e.g., forest fires in New South Wales, Australia 2019 (Ehsani et al. 2020), peat fires in Alaska 2005 (Poulter et al. 2006) or Russia 2010 (Konovalov et al. 2011), land use activities, e.g., the US Dust Bowl (McLeman et al. 2014), and other reasons. The reduced visibility and the high particle concentration may affect air transport in general. Continuous delivery of high particle concentration in diverse atmospheric layers as it occurs for example in combination with volcanic eruptions furthermore can be especially dangerous for jet planes and interrupt air traffic for several days, as in the case of the Eyjafjallajökul volcano eruption on Iceland in 2010. Reduced visibility through dust storms also occurs in the near-surface boundary layer and affect road traffic, as one of the authors witnessed on a highway south of Rostock, Germany, on 8 April 2011 (Figure 2), where eight people died, 41 were injured, and 150 cars were damaged because of sudden and dramatic reduction of visibility.
A common indicator of dust occurrence is the dust weather frequency (DWF), which expresses the number of days with dust weather events, including dust haze, blowing dust, and storms per year (Fan et al. 2010; Kazakhstan Academy of Sciences 2010). In the northern subzone of Central Asia, on average, 20–30 dust storms occur per year, with 28 such events along the Syr-Darya and Ili river valleys, and 30 dust storms in the Lake Balkhash area. In all these areas dust storms occur predominately between April and October, while the surfaces are mostly covered by snow between November and March. In the southern subzone, dust storms may occur around the year. Thus, in the central Karakum Desert on average 60 dust storms occur, while the averages for the eastern and western Karakum desert are 62 and 67 dust storms per year, respectively (data from the CALTER project, Orlovsky et al. 2009; Opp et al. 2016). However, the plain number of dust storms per year is only one facet of the temporal dust storm variability. Some of these registered storms might only last for less than one hour, while others last for more than 24 h. Moreover, while some dust storms can be categorized as comparatively mild (12.5% of all detected dust storms within the CALTER project deposited less than 1 kg of dust per hectare and hour), others can be severe (10% of the dust storms deposited more than 100 kg/ha/h, for a maximum of 1.87 tons of deposited dust per hectare in a single dust storm event).
The massive layers of aeolian dust with their above-mentioned heating effect in the atmosphere also cool the ocean’s surface temperature. This cooling can hinder or block the formation of tropical cyclones. Long-term studies of the hurricane seasons over the Atlantic Ocean, the Caribbean Sea, and the Southeastern USA show that less dusty seasons and years over the Atlantic promote hurricanes, as was the case in 2005, 2008, 2017, while in 2006 a higher amount of Sahara dust in the atmosphere over the Atlantic prevented the formation of major hurricanes (DMG 2008). Besides these ocean reactions to the atmosphere, the deposition of dust can have various effects on the ocean itself. On the one hand, deposited dust may inhibit phytoplankton development (Paytan et al. 2009). On the other hand, deposited dust can fertilize the ocean. The Saharan dust deposition in the Caribbean Sea was identified as one major reason for coral bleaching and mass mortality of coral reefs there (DMG 2008). Furthermore, dust layers in the ocean water can stop the water and gas exchange with lower deepwater layers, influencing the vertical temperature and nutrient gradients (Gassó et al. 2010).

3.2. Effects of Airborne Particle Input on Land

Due to long-term satellite observations, the Saharan dust transport was identified as a source of fertilizing the tropical rainforest in Latin America. The seven years average of dust deposition in the Amazon basin was estimated to be 28 (8–48) Tg/a or 29 (8–50) kg/ha*a (Yu et al. 2015). The North African dust is an important substitute, especially for the phosphorus (P) losses within the Amazon basin, because 90% of the soils in the Amazon basin are P deficient (Sanchez et al. 1982). Yu et al. (2015) conclude that African dust plays an important role in preventing phosphorus depletion on timescales of decades and centuries.
While the deposition areas benefit from such dust transport, a geo-chemical deficit at the source areas is the flip side of this process. The deflation of the upper soil surface layers exposes the often non-humic subsoil layers. In some cases, even in (semi)arid areas, the newly exposed soils are often salty. Salinized soils, surfaces, and in some cases salt pans often occur in arid and semiarid areas because of a negative water balance and/or because of wrong irrigation management. Drainless inland lakes are salt accumulation pans. Due to high evaporation amounts, the water of such lakes becomes brackish or salty (Aladin and Potts 1992). If the evaporation exceeds the water inflow, these water bodies desiccate and the exposed lake beds act as sources of salty sand and dust storms. Famous examples of such processes are the Aral Sea (Uzbekistan, Kazakhastan; (Groll et al. 2013) and Lake Urmia (Iran) (Opp 2007; Opp et al. 2017).
Typical phenomena of deflation processes in source areas are stony desert pavement surfaces (Figure 3) as residuals of wind erosion (Dietze et al. 2016) and aeolian landscapes with so-called yardangs (Halimov and Fezer 1989), in the shape of rocks and rocky ridges formed predominately by wind (Figure 4).
Better known, in general, are the SDS effects on deposition areas. Dunes are a result of the short-term and short-distance sand transport (Bagnold 1941; Livingstone et al. 2007; Semenov 2020; Wiggs 2019). They can form dune systems and whole sand seas (Hesse 2019; Abbasi et al. 2020). After Wiggs (2019) only 20% of desert surfaces are covered by wind-blown sand, and of this, only 60% is integrated into dunes. Regarding SDS, it is necessary to distinguish between active (free) and stabilized (anchored) dunes (Abbasi et al. 2020). Typical dune forms like Linear dunes, Star dunes, Transverse dunes (Barchans) are results of mobile or active sand transport. They act as both recent sink or deposition areas and as sources of SDS. Stabilized or anchored dunes were subject to active dune forming in the past, but since then have been covered by vegetation, biological crusts or became subject to man-made dune stabilization actions. Most dunes in the North European Sand Belt are inland residuals from the Pleistocene, and near the coasts of the North and Baltic Sea, they are residuals from the Holocene.
Typical phenomena of (coarser) sand deposition in sink or deposition areas are:
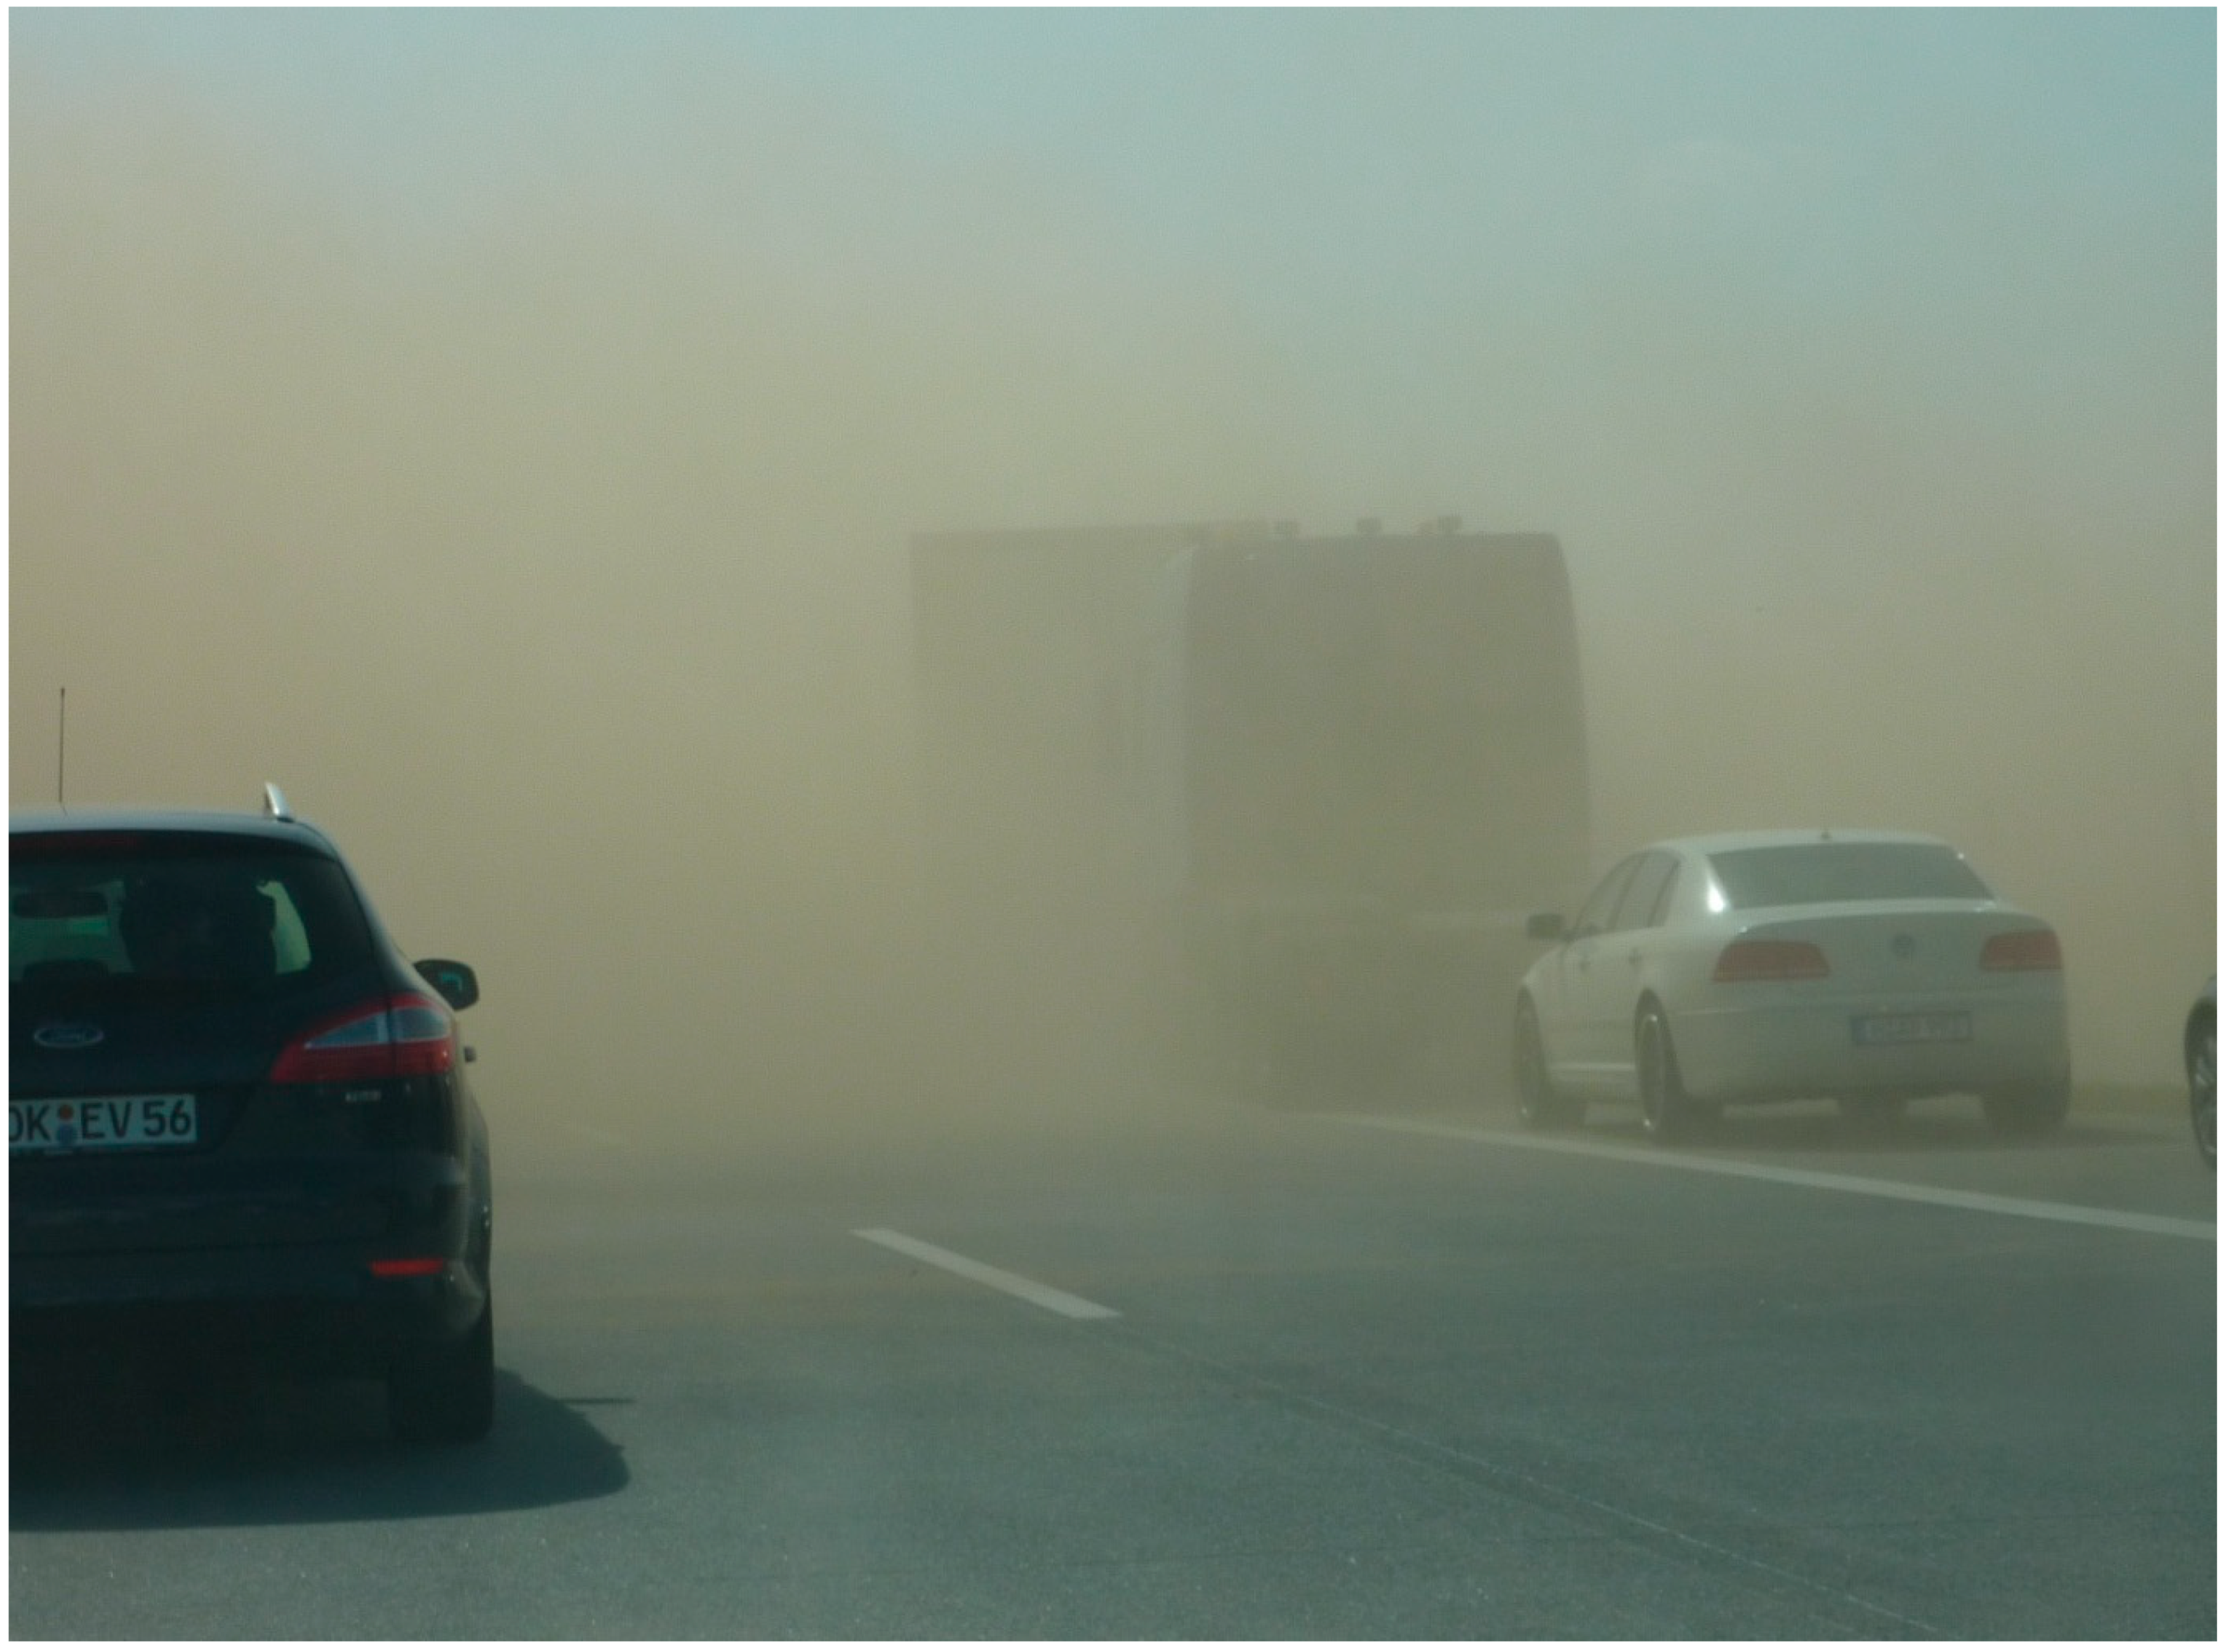
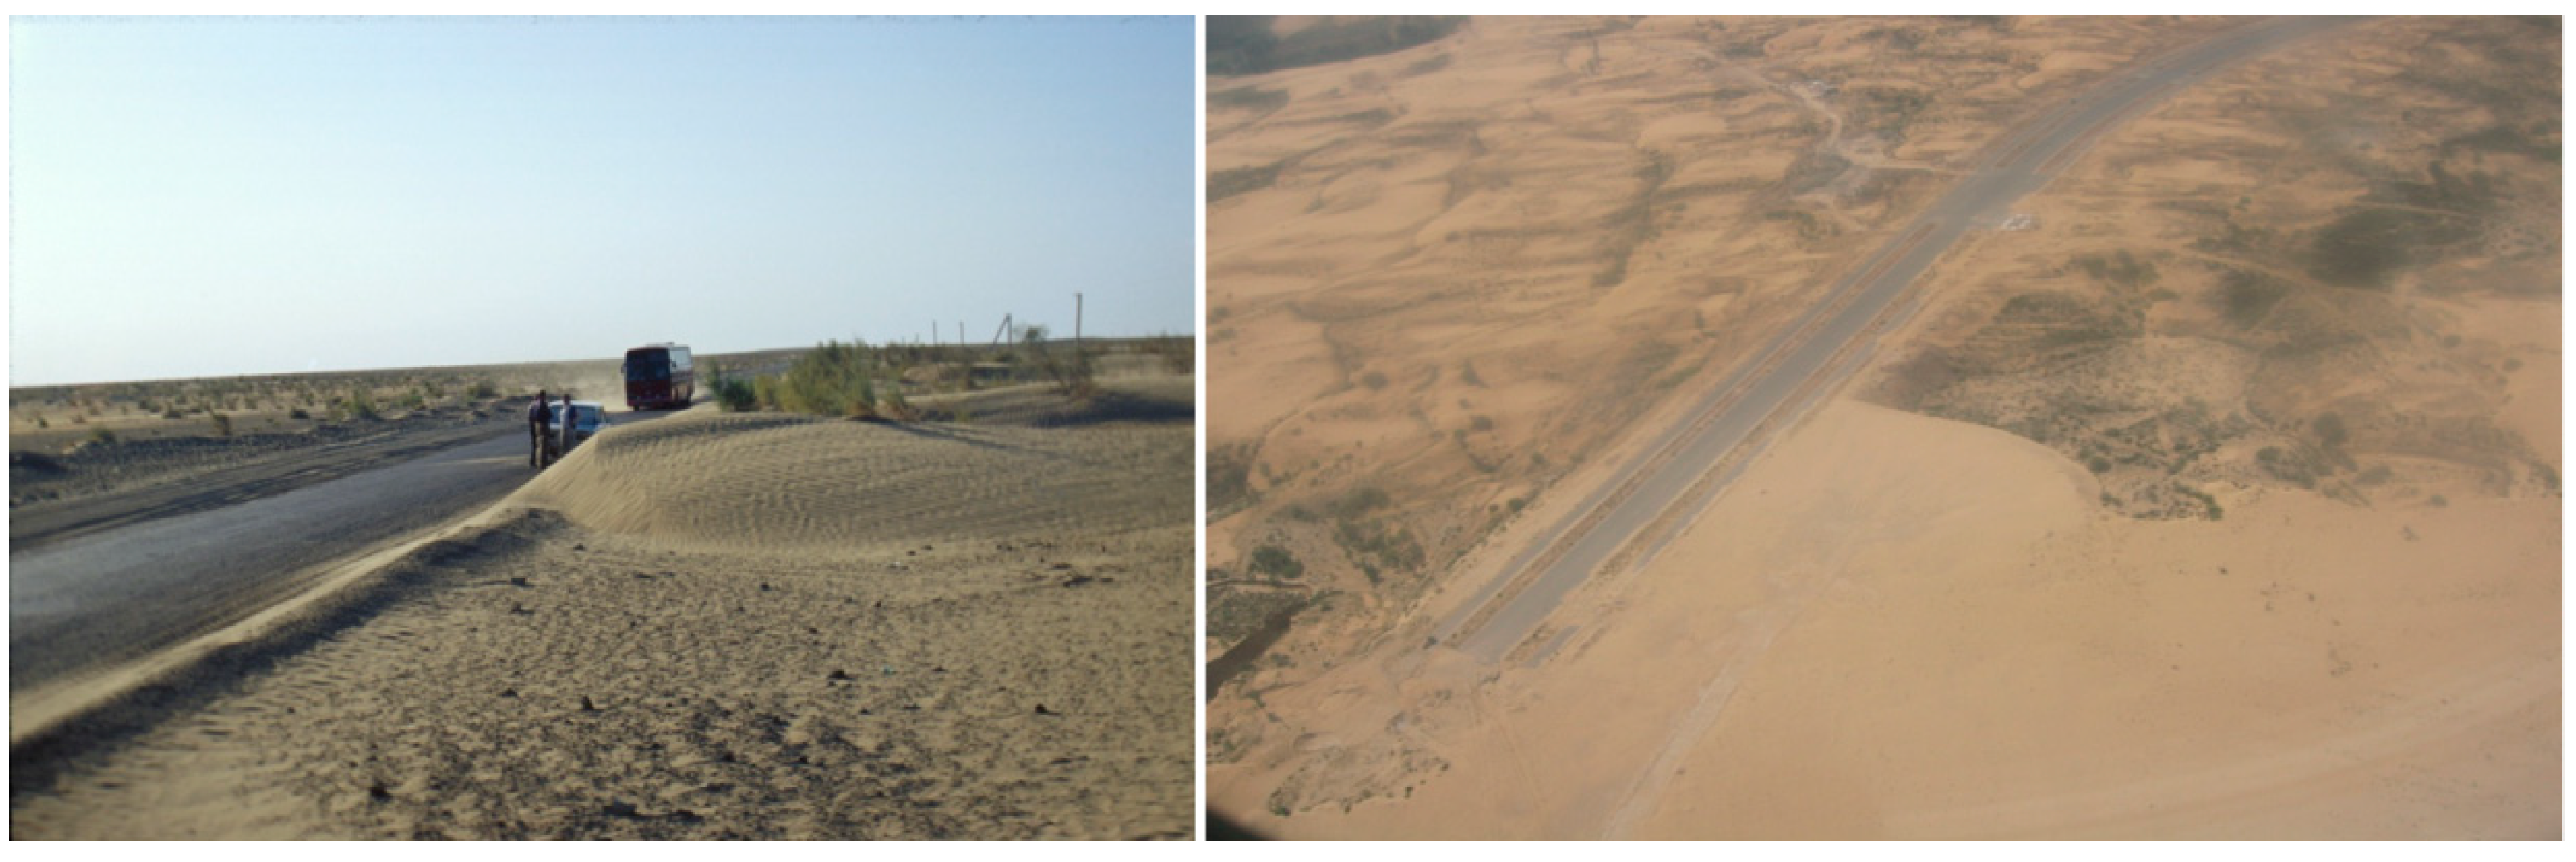
  • overlaying or sanding up of topsoils, including traffic lanes (Figure 5);
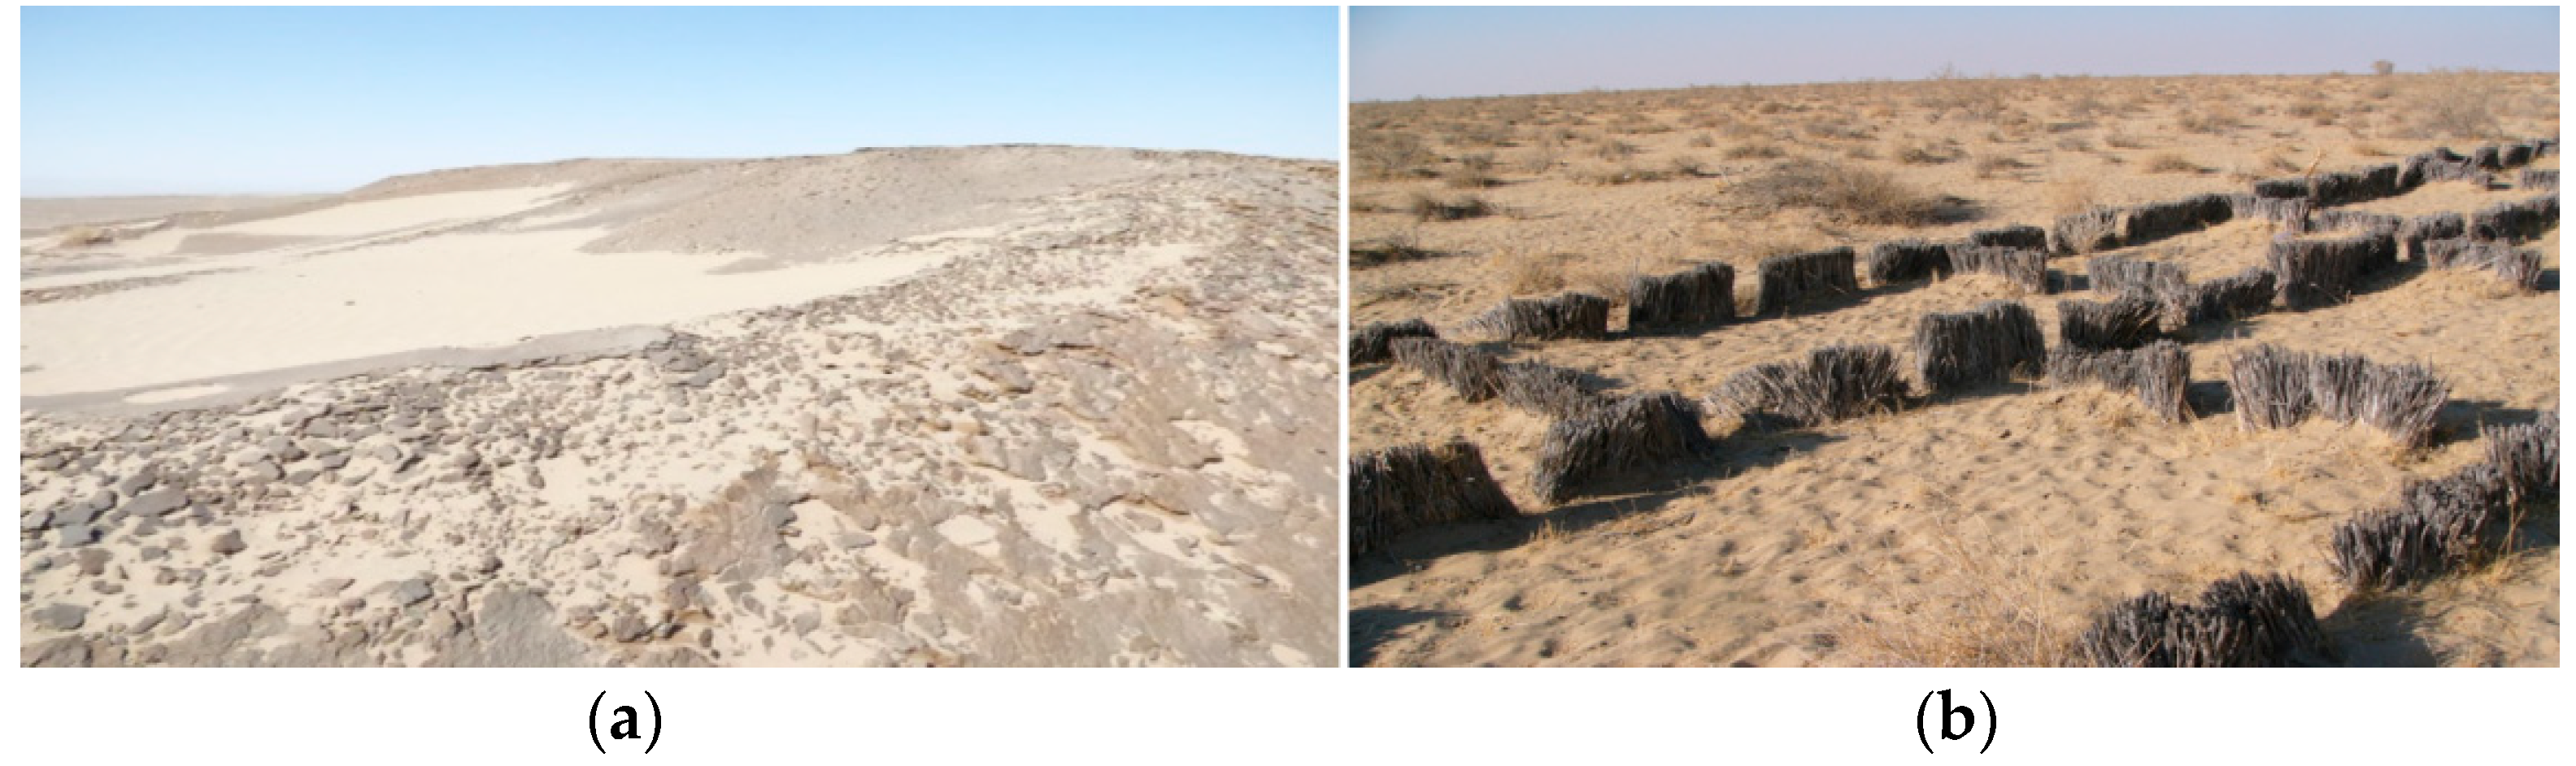
  • formation of dune hills as a result of long-term sedimentation;
  • deformation of vegetation, especially of their leaves and stomata, as a result of abrasion processes;
  • filling up of river and channel beds due to additional sediment input;
  • contamination of open drinking water pipes;
  • impairment of technical infrastructure (e.g., turbines) due to the high fine sediment load in the air;
  • blocking of transportation networks (roads, railroads) and thereto related higher maintenance costs.
The corresponding effects of wind-blown deposited (finer) dust are the same as for sand, with exception of the abrasion effects on the vegetation. Instead, the finer dust can congest the vegetation stomata and reduce functionality by covering leaves with a layer of fine sediment. Hirano et al. (1995) have shown for beans and pickles that dust deposition amounts of 1 g/month can already have significant negative effects on plant physiology. Dust on leaves may increase the leaves’ temperature because of the increased absorption of infrared radiation. Hirano et al. (1995) expressed that the absorption intensity depends on the color of the dust. However, they also described a shading effect, which increases with decreasing grain size. This shading also negatively affects the photosynthesis efficiency and the primary production of the vegetation. Leaves’ stomata can get blocked by fine dust particles as well, which prevents them from fully closing during the day increasing transpiration losses and lowering water use efficiency, amplifying the vegetation’s water stress. Contrary to these findings, Sharifi et al. (1997) detected reduced transpiration rates caused by dust-covered leaves. These opposite effects between dust cover and transpiration require more detailed comparative analyses.
Furthermore, dust also acts, in most cases, as additional fertilizer, influencing the nutrient balance in the sink area.
Dust deposited on snow and ice decreases the surface albedo, thus modifying the energy and mass balance, and accelerates melting processes.
Dust measured in human environments, even in highly industrialized ones, is often a mixed composition of different local, regional, and global dust sources, including man-made emissions from industry, traffic, and agricultural areas as well as various natural sources.

3.3. Effects of Sand and Dust Storms on Human Health

Environmental studies in industrial areas have shown that enormous amounts of pollutants, emitted by chimneys and domestic fuel, are entering the atmospheric circulation (Haase et al. 1990), impairing the air quality and causing a wide range of health effects. Dust can carry spores, bacteria, viruses, and persistent inorganic and organic pollutants (WHO 2006; Sprigg et al. 2014). Foroushani et al. (2019) detected high heavy metal concentrations in airborne dust samples from South and West Iran. Rezaei et al. (2019) showed that light density microplastic particles are transported by wind without but also together with dust. Airborne dust may penetrate the human body in different ways. Inhalation of dust-loaded air is the most common way of exposure. However, airborne dust can also enter the human body by drinking liquids containing dissolved dust, or by consuming food with dusty components (Cook et al. 2005). Dust particles in the food chain can cause different kinds of sicknesses, such as cardiovascular diseases, diseases of the respiratory organs, hypertension, and others (UBA 2017). In the bloodstream, they can even cause genetic changes (Sacks et al. 2011). Problems of the cardiovascular system, such as strokes, high blood pressure, and high blood plasma viscosity, might also be connected with high dust concentrations in the breathing air (Yang et al. 2005). If airborne dust enters the respiratory organs it can significantly reduce the lung capacity and functionality (Hong et al. 2010) and cause chronic sicknesses of the respiratory tract (Hsieh and Liao 2013) and pneumonia (Kang et al. 2012). Increased rates of airborne diseases, such as Meningitis or Valley Fever, were observed, e.g., in the Sahel (Sultan et al. 2005) and the southwestern United States (Tong et al. 2017).
The particle size is a key factor of the dust and its effects on human health. Particles of less than or equal to 10 microns (PM10) are respirable according to the US Environmental Agency. Particles of less than 2.5 microns (PM2.5) may enter the bloodstream with serious consequences. Particles of that size in the respiratory tract can cause asthma, tracheitis, pneumonia, aspergillosis, allergic rhinitis, and nonindustrial silicosis, known as “desert lung” syndrome (Derbyshire 2007). The grain size and the grain size distribution of the inhaled dust are crucial for the distribution and deposition of dusty particles in the respiratory system. The smaller the particle, the bigger the probability of deposition. However, bigger inhaled particles (PM10–2.5) are connected to a higher mortality rate (Mallone et al. 2011). During high Sahara dust concentrations in South Europe, significant casualty numbers were related to respiratory illnesses, cardiovascular and vessel diseases, as well as strokes (Perez et al. 2012; Mallone et al. 2011). Meanwhile, the severeness of the health impacts of SDS is even greater in the arid source regions. Drylands (hyper-arid, arid, semi-arid, dry subhumid) are not only the ecosystems, which are most affected by SDS but also do they show the highest percentage of infant mortality compared to other ecosystems (MEA 2005).
The duration of the exposition to dust and the mass or dose of dust are crucial factors determining the health risk. The dose of the inhaled dust is determined by the dust concentration in the air (in μg/m3), the duration of the exposition, and the breathing rate, which is on average 0.38 m3/h. The higher the dust concentration in the air and the exposition duration, and the smaller the inhaled particles, the higher the dose (Hsieh and Liao 2013).
The health effects of inhaled dust depend not only on quantitative parameters, but also on the chemical composition of the dust. Besides the dust composition determined by the source area, airborne dust particles often contain additional components from different sources, including anthropogenic emissions. Sulfates, nitrates, and ammonium are common components of dust coming from the land areas, while sea salts originate from oceans (Tsai and Chen 2006). Most dust samples are dominated by silica (SiO2), which can cause health problems in the respiratory tract. Different studies have shown that dust samples with high metal concentrations affect especially children (Chen et al. 2004; Hong et al. 2010; Lee et al. 2013). High arsenic and mercury concentrations in inhaled dust may be responsible for inflammation of the sinuses. Inflammations, bronchitis, asthma, pulmonary edema, and fibrosis can be a consequence of high metal concentrations in inhaled dust (Cook et al. 2005). Furthermore, dust particles can also absorb pollutants during transport, creating more complex and potentially more harmful aerosols (Onishi et al. 2012).
Areas without a dense vegetation cover, like desiccated floodplains and lakes, act as sources of sand and dust storms. The Aral Sea is the most famous example of this phenomenon, made public by the drastic changes of the former fourth biggest lake on Earth and labeled the “Aral Sea Syndrome”. This severe ecological disaster has equally severe side effects on human health.
The relations between sand and dust storms and the illnesses of the respiratory tract and the inflammation of the eyes are known for a long time. However, because of the sensitive nature of detailed public health information, most of these conducted studies on this topic have not been made public. However, some information about health effects in connection with the Aral Sea crisis during the late 1980s and early 1990s has been published (Table 1, Table 2, Table 3 and Table 4) (Elpiner 1999; Opp 2007). While the average infant mortality in Central Asia was 3.5% during that period, it was 4.7% in Turkmenistan, which lies south of the Aral Sea and receives an above-average amount of dust from the desiccated lake bed (Groll et al. 2013), while in Kharakalpakstan, an autonomous region in Uzbekistan surrounding parts of the Aral Sea, an infant mortality of 7.0% was determined. Along the lower sections of the Amu-Darya and the Syr-Darya Rivers, near the Aral Sea, the infant mortality was 11%, the highest value in the former Soviet Union. Many babies in the Aral Sea region were born with an open fontanelle and most of those remained handicapped later. Moreover, 90% of the pregnant women suffered from anemia in this region and oesophageal cancer was diagnosed seven times more often than in the Uzbekistan average. Each fifth inhabitant of Kharakalpakstan suffered from open tuberculosis and two-thirds of the population suffered from hepatitis, typhus, stomach, or thyroid cancer (Elpiner 1999; Opp 2007). Because children are more affected by near-surface SDS than adults, a case study of their health risks was carried out in the 1980s in two administrative units of Kazakhstan (Table 1, Table 3, and Table 4).
Rayon Kazalinsk is part of the Kyzylorda district in Central Kazakhstan, along the Syr-Darya River, east of the former Aral Sea. The Syr-Darya River valley is among the areas most affected by sand and dust storms in Kazakhstan. The surface water from the Syr-Darya River is used for irrigation agriculture in this semi-arid and semi-desert area and soil salinization is a widespread phenomenon. Wind deflation exposes the salinized soil layers and enables their mobilization as airborne salty dust.
Zhanakorgan is also part of the Kyzylorda district and is located in the Syr-Darya River valley southeast of Kyzylorda. Because the river water did not reach the Aral Sea for many years, most of the delta branches dried up. Former agricultural areas had to be abandoned because of the lack of water, accelerating the desertification processes and enlarging the source area of sand and dust storms.
Although the distance between the two Rayons is, at several hundred kilometers, considerable, the percentages of sick children are comparable. 65% of the 1,979 tested children in Rayon Zhanakorgan (c.f. Table 1) suffer from acute pneumonia although their homes are 400–500 km away from the desiccated Aral Sea. Salty dust is one of the main factors causing pneumonia in Central Asia and the sources of such salty dust can be both the Aral Sea via long-distance dust transport and local dust sources within the Rayon. So-called Takyrs, or “salty hollows”, and surface and subsurface salinizations are widespread phenomena and small-scale sources for salty dust transport.
The increasing number of carcinoses in Karakalpakstan (Table 2) goes along with the most rapid desiccation phase of the Aral Sea during the late 1980s and an increasing number of sand and dust storms in the Aral Sea region (Elpiner 1999). Kharakalpakstan is located in the largely desiccated delta of the Amu-Darya, between the Karakum Desert in the west and the Kyzylkum Desert in the east. Dust samples from this region, collected between 2003 and 2012, showed that the dust deposited in Kharakalpakstan mainly originated from both deserts and the desiccated Aral Sea (Groll et al. 2013; Opp et al. 2016). As long as there was enough water for irrigation in the Aral Sea tributaries, cotton cultivation was the main mode of irrigation farming in that area. Before harvesting the cotton in late summer and fall, huge amounts of pesticide were applied in order to devitalize the leaves of the cotton plants for easier mechanized harvesting. This was a common practice during the Soviet era, but it also greatly increased the pollution of the top-soils and tributaries.
Remarkably, more than 36% of the tested persons in the Rayon Kazalinsk suffered from different kinds of ENT (ear–nose–throat) diseases (Table 3). The high values of chronic throat-tonsil-inflammations also indicate high rates of impaired respiratory organs. Patients who became affected by different kinds of tonsil, angina, and ear inflammations often suffer from side effects of these diseases too and become more susceptible to other kinds of illnesses.
Table 4 illustrates that young children aged 6 to 10 are more affected by ENT inflammations than older children. This could be a result of their smaller size, as they are more severely affected by larger particles. Young children who are often and longer sick because of respiratory organ dysfunctions may be handicapped in their further development, resulting in hard to pin-down long-term impairments caused by aeolian dust (UNEP et al. 2016). More detailed information regarding medico-ecological problems of the Aral Sea crisis has been described by Elpiner (1999).
The percentage of sick probands in Table 1, Table 2, Table 3 and Table 4 cannot be described only by the effects of sand and dust storms. Many other subjective and objective environmental factors, such as the age, the size, the frequency of direct exposition to SDS, the quality of the drinking water, the protein-vitamin deficiency (Elpiner 1999), general health status, the status quo of the health care system, and the testing methods all influence the results.
Breathing air with high particulate matter (PM2.5) concentrations, including pollutants, weakens the human immune system. This is not a new research result, but it becomes more relevant in the light of the current Coronavirus pandemic. More deaths related to SARS-COV-2 are detected in areas with high particulate matter pollution. Indeed, 15% of the worldwide deaths caused by Corona are related to particulate matter, while in Asia, this percentage reaches 27% (Gardiner 2021). Worldwide, about seven million people die annually because of air pollution, which is twice as much as by alcohol, and five times more than by traffic accidents (WMO 2021; Gardiner 2021).
Air pollutions and related impacts on health caused by increasing SDS frequency or other reasons are often the cause of migration (WHO 2006; Gholipour et al. 2020; UNCCD 2021).

3.4. Economic Effects of Sand and Dust Storms

SDS have significant socio-economic impacts on human health, agriculture, industry, transportation, water, and air quality (UNCCD 2021).
In accordance with Al-Hemoud et al. (2019) our review of SDS publications has confirmed the huge lack of knowledge in the field of the economic evaluation of SDS effects. Al-Hemoud et al. (2019) discuss, in their introduction section and in Table 1, nine different literature sources about economic impact studies related to sand and dust storm events. They compiled data of SDS events of different durations with related economic damages in industry, agriculture, transportation, domestic households, and the health sector with costs ranging between 23 million Australian Dollars and 1.404 billion US Dollars. Based on the estimation of economic impacts on ten different sectors of the oil and gas industry in Kuwait, the authors also carried out a risk assessment associated with SDS events. They selected risk indices describing the relation between the probability of SDS hazards (very unlikely, unlikely, possible, likely, very likely) and the severity of economic consequences (very unlikely, unlikely, possible, likely, very likely). In a final step, Al-Hemoud et al. (2019) propose recommendations for sustainable prevention and control techniques to mitigate the damage effects of SDS and reduce the economic losses.
The following table (Table 5) summarizes a great variety of SDS impacts on humans, animals, plants, agriculture, and infrastructure. Some of these impacts occur immediately after strong SDS events. Other impacts might not be immediately noticeable but only become apparent in the long term. Furthermore, the economic damages also depend on the frequency and the duration of SDS. In case of regular SDS occurrences, inhabitants and organizations would be better prepared, having adapted their behavior and structures, which would lower the direct and indirect economic effects. The monetary effects of SDS damages also depend on the level of economic activities. Al-Hemoud et al. (2019) have mentioned that cities with major infrastructure or transport hubs will be more impacted by SDS than locations with less infrastructure or less population. Regardless of such singular studies (Al-Hemoud et al. 2019), economic impacts and costs related to SDS are not thoroughly researched, even though the available studies show the huge economic damages caused by SDS and the enormous challenges to prevent SDS effects (Table 6).
All these effects do have economic consequences, but even if these consequences are enormous in terms of their importance for our societies and their monetary value, it is almost impossible to properly price the consequences of SDS (O’Riordan 1996). Besides the general challenge to determine the economic values of environmental and human disasters, it is easier to determine short-term losses than long-term damages. However, Williams and Young (1999) list 11–56 million AUD per year (8.5–43.5 million USD) of so-called off-site costs for SDS health impacts in Australia. They characterized health costs as the most significant contributor to the overall costs, followed by household maintenance costs and losses caused by canceled flights. Huszar and Piper (1986) place the off-site costs associated with wind erosion in New Mexico, USA during the 1980s, at 466 million USD and the on-site costs at 10 million USD. Tozer and Leys (2013) conducted an exemplary study based on specific dust events in Australia. They detected that the off-site costs were higher than the on-site costs because of the level of economic activities affected by the dust. They also state that the economic and monetary values of SDS effects depend on the population size and the infrastructure density in large urban areas. On average, smaller rural communities are less affected than middle-sized rural centers, while larger cities suffer the most economic damage.
For determining the costs of SDS impacts, data on the dust event severity and frequency along with economic data on the costs of interruptions and damages are required (c.f. Al-Hemoud et al. 2019). For the so-called Red Dawn Dust storm in Australia, on 23 September 2009, Tozer and Leys (2013) have determined the total damage to the New South Wales economy to be 299 million AUD (361 million USD). Of that, the biggest costs by far (255 million AUD) were incurred by individual households for cleaning and associated activities. Commercial activities, including retail and service industries, were also significantly affected (10.1 million AUD) along with air transport (10.8 million AUD) and construction (2.4 million AUD). Because of a lack of data, Tozer and Leys did not consider health and traffic costs as well as follow-up costs, such as for the installation of dust monitoring and early warning systems. However, such costs are mostly another logical consequence to improve the protection against SDS.
In their Global Assessment of Sand and Dust Storms, the UNEP et al. (2016) list the annual costs for the removal of blown sand from infrastructure in the Middle East (Table 6) at sink or deposition areas. In Iran, these costs were 1 billion USD, in Iraq 1.4 billion USD, in the USA 9.6 billion USD, and in the Chinese capital Beijing 665 million USD.
The World Bank (2019) published data on the mean annual PM2.5 concentration, total deaths, and losses in million USD from 18 countries in the Middle East and North Africa. For most of the countries close relations between high PM2.5 concentrations, the number of deaths, and economic losses were detected. Pakistan was the country with the most deaths and the highest losses. Bahrain, Kuwait, and the UAE were countries with low death numbers and relatively low economic losses, although their PM2.5 values were among the highest concentrations. This indicates that other factors, like the public health care system or the GDP, also influence the preparedness for SDS and the impacts these events can have.
Furthermore, 56% of enterprises in South Korea are negatively affected by SDS (Choo et al. 2003). The Korean air transportation industry reported annual sale losses because of SDS-related flight cancellations of about 0.6 million USD. In addition, China reported huge economic losses caused by SDS (UNEP et al. 2016).
Besides these costs occurring in deposition or sink areas, SDS also cause economic losses in the source areas. A simple approach for the determination of the economic effects of SDS in the source areas comes from wind erosion research. Quantitative amounts of eroded soil are specified in tons per hectare per year (t/ha*y) or in mm/y soil loss of the soil profile thickness. Adding a monetary value to the eroded soil is not quite so easy. This value depends, for example, on the value of the soil type and the land use of the affected soil. Was the area used for growing specific crops, the economic value of SDS effects might be determined by the monetary loss of the harvest. Reduced soil fertility might result in an increased need for artificial fertilizers, which not only add to the costs but also have a long-term negative effect on soil productivity and salinity (Kulmatov et al. 2015). Diminished harvests might also result in the necessity to import additional food or other agricultural products for higher prices. These indirect expenses still need to be considered part of the SDS impact costs. Other indirect costs include measures to prevent wind erosion and dust mobilization in the source areas. Such preventive measures, like planting of trees for an increase in the surface roughness and thus increasing the threshold velocity for particle mobilization, the increase of vegetation cover by planting aridity and salinity tolerant shrubs in desertified areas, or soil cohesion retaining tillage techniques are often very costly, but like most prevention measures, it is economically more efficient to extend the prevention measures as the costs for repairing SDS impacts would be even higher. Most preventive measures also have additional ecological or societal benefits as well.
Finally, it is also necessary to take the positive effects of SDS into account, for example, the fertilization at the sink or deposition areas. For the Amazon rainforest Yu et al. (2015) expect that without the phosphorus input from African dust, the hydrological loss by leaching would greatly deplete the soil phosphorus reservoir over a timescale of decades or centuries and severely affect the health and productivity of the Amazon rainforest. The climatic cooling effects both on sea and land surfaces is another advantage in a world affected by climate change. These benefits can offset at least a small part of the costs, even though they are very difficult to quantify.

4. Consequences for SDS Mitigation and Hazard Reduction

Having access to detailed data on the spatial and temporal characteristics of sand and dust storms are essential prerequisites for designing measurements for hazard reduction and SDS impact mitigation. There are several methodical approaches for gathering the required data.

4.1. SDS Observation by Remote Sensing and LIDAR (Summary)

Information about SDS source areas can be frequently surveyed by remote sensing techniques, e.g., with the help of Aerosol Optical Depth data at 550 nm retrieved from the moderate resolution imaging spectrometer (MODIS) onboard NASA’s Terra and Aqua satellite, and if possible, in combination with on-site or in-situ field observations (Abbasi et al. 2018). Westphal et al. (1987) used numerical models to characterize the dust transport for areas without or with only a small number of meteorological stations. Foroushani et al. (2020) used the WRF-Chem model for predicting the dust deposition in Southwestern Iran. A very effective tool for information on SDS on a global scale is the WMO Global Atmosphere Watch (GAW) Programme (UNEP et al. 2016). The WMO also launched the Sand and Dust Storm Warning and Advisory Assessment System (SDS-WAS) as an international global network (WMO 2015). The SDS-WAS was extended by a global Dust Health Early Warning System (D-HEWS), dedicated to determining dust-related health risks. The Barcelona Forcast Centre was established in 2014 as an operational component of the SDS-WAS to generate and disseminate operational predictions for North Africa (north of the equator), the Middle East, and Europe (UNEP et al. 2016), while the Copernicus Atmosphere Monitoring Service (CAMS) provides operational information on dust, sand, smoke, and volcanic aerosols affecting the save operation of the transport system and the use of solar power (CAMS 2021).
Ground-based LIDAR measurements are used for the determination of aerosol optical and microphysical properties (Groß et al. 2015; Ansmann et al. 2019) in specific layers of the atmosphere to predict dust concentrations both in the atmosphere and the transport direction of the dust.

4.2. On-Site Observation (Summary)

An effective way of mitigating SDS is to reduce the wind erosion and deflation potentials at the SDS source areas. Because these sources often cover huge areas and the erosion activity is characterized by a high spatial and temporal variability, it is very important to pinpoint the most affected areas so that the right protection measures can be selected for the right place and for the right time.
If the meteorological stations in a country represent a close network, and the stations can detect wind erosion or deflation processes, the observations by these stations can provide overview information both regarding the source and deposition areas. Observations by meteorological stations are often available for many decades, providing consistent long-term records, that satellites cannot offer. Besides meteorological stations, specialized air quality measurement stations, often found in larger cities, play an important role in the observation of the particulate matter and aerosol mass concentration (PM10, PM2.5) in the deposition areas.

4.3. SDS Deflation Mitigation Measures (Summary)

When the exact location of affected areas has been determined, the best suitable protection measures against the deflation of sand and dust can be selected and applied. A permanent vegetation cover would be the best way to fix the surfaces and mitigate the deflation processes. However, especially in desert and semi-desert areas, permanent vegetation cover is not realistic because of the soil moisture deficit and the harsh growing conditions under such circumstances. Additional water supply for irrigation might be possible in some regions, but in most this would not be feasible. Survival and growth rates of planted Saxaul (Haloxylon aphyllum) shelterbelts near Muinyak, on the bottom of the desiccated Aral Sea, increased when they received additional water during the first year after planting (Matsui et al. 2018). Such planted shelterbelts are often used along both sides of desert roads, for example, the desert roads crossing the Taklimakan Desert in Xinjiang, China. This is made possible by utilizing the huge groundwater aquifers below the sand dunes of the Taklimakan Desert for drip irrigation of the shelterbelts. For improving the initial survival chances of newly planted but locally adapted plants, the application of additional water absorbers can be beneficial. A project in the Aralkum Desert (Kuzmina and Treshkin 2012) used such absorbers, comparable to the material found in baby diapers, in a sand dune area to help the planted vegetation overcome the soil moisture deficit during the dry season and to ensure survival during the first hard years. If planting is not a viable option, then fixating the soil surfaces with oil mulch products (Figure 6a) or water-soluble surfactants like PAMs might be (Genis et al. 2013; Kuldasheva et al. 2020). However, the application of chemical substances can lead to harmful side effects on the soil microorganisms and the desert fauna and needs to be carefully evaluated before implementation.
Another way to reduce the deflation processes is to establish sand catchers (Figure 6b), consisting of a network of barriers made of straw or dead branches. Sand catchers increase the surface roughness and thus increase the wind velocity required for mobilizing the surface particles.
Sand catchers are also used in deposition areas to fix the deposited sand. Different kinds of fences are used in deposition areas (c.f. Alghamdi and Al Kahdani 2005) to promote the deposition and to prevent infrastructure damage. Al-Hemoud et al. (2019) have estimated the functional lifespan of such fences between 4.5–5 years and 25–30 years, depending on the height of the fences and on the frequency and amounts of deposited sand.
Besides direct stabilization measures for areas with low vegetation cover, indirect measures can also help to minimize the creation of SDS events. Such indirect measures are:
  • Reduction of livestock density on pastureland for preserving the vegetation cover.
  • Optimization of crop rotation, for example by intercropping, for the reduction of barren surfaces.
  • Reduction or forgoing of tillage for reducing soil disturbances.
  • Establishment of stripe cropping and multistrata systems against the dominant wind direction for increased surface roughness.
  • Increase of the input of organic residues for surface protection and additional water storage.
  • Planting of hedgerows between agricultural plots for wind-breaking and moisture protection.

5. Conclusions

In most of the SDS affected countries, both dust storm frequency and deposition rates have increased during the last two decades (UNCCD 2021). Based on our own analyses, we could demonstrate such tendencies in Central Asian countries of Turkmenistan, Uzbekistan, and Kazakhstan, and in Iran (Opp et al. 2016; Abbasi et al. 2019; Foroushani et al. 2019).
Combating sand and dust storms and their impacts is a multifaceted process and there is a wide range of prevention and protection measures for source and sink areas available. This makes selecting the most suitable measures for each case a highly complex task, one that requires expert knowledge, access to comprehensive multi-parameter datasets, systematic documentation, and fully integrated control strategies, including different spatial scales, from local measurement sites to regional or transregional impact considerations. As SDS almost always are transboundary and impact land and ocean systems as well as the atmospheric circulation patterns, the processes of analyzing the problem, planning and implementing protective measures, and monitoring the success of such measures need to be multidisciplinary at least and fully holistic at best. Such integrated and sustainable strategies can be successful when they are developed in close cooperation and participation with the local and regional population and stakeholders. Only then will sustainable development for combating SDS, one of the major environmental and economic challenges in many parts of this world, be possible. UNCCD (United Nation Convention to Compact Desertification) together with other international members of the coalition is the international platform to coordinate the prevention and mitigation of SDS. Their key objectives include:
  • Preparing a global response to SDS, including a strategy and action plan, which could result in development of a United Nations system-wide approach to addressing SDS.
  • Identifying entry points to support countries and regions affected by SDS in the implementation of cross-sectoral and transboundary risk reduction and response measures for SDS.
  • Preparing a platform for engaging with partners and enhancing dialogue and collaboration among affected countries and the United Nations system agencies at global, regional, and subregional levels.
  • Providing a common platform for the exchange of knowledge, information, and technical expertise and resources for strengthening preparedness measures and strategies for risk reduction, consolidated policy, innovative solutions, advocacy and capacity-building efforts, and fund-raising initiatives.
  • Identifying, mobilizing, and facilitating access to financial resources for joint responses to SDS, including through new and innovative resources and mechanisms (UNCCD 2021).
The UNCCD supports countries in the mitigation of SDS impacts and anthropogenic dust sources by advocating the following three pillars approach:
-
Early warning systems
-
Preparedness and resilience
-
Anthropogenic source mitigation (UNCCD 2021).
Different science disciplines, technology, land users, and decision-makers must work together to prevent SDS and to reduce the vulnerability against SDS. To effectively resolve this huge problem, it is necessary to understand the basics, prerequisites, impacts, effects, and consequences of SDS. Our aim was to make a contribution towards a better understanding of SDS research from different perspectives.

Funding

This research received no external funding.

Institutional Review Board Statement

The study was conducted according to the guidelines of the Declaration of Helsinki, and approved by the Institutional Review Board (RB-CO_05.07.2021).

Informed Consent Statement

Informed consent was obtained from all subjects involved in the study.

Data Availability Statement

All used data are mentioned in the list of references.

Conflicts of Interest

The authors declare no conflict of interest.

References

  1. Abbasi, Hamid Reza, Christian Opp, Michael Groll, Hassan Rouhipour, Mohammad Khosroshahi, Farhad Khaksarian, and Azadeh Go-hardoust. 2018. Spatial and temporal variation of the aeolian sediment transport in the ephemeral Baringak Lake (Sistan Plain, Iran) using field measurements and geostatistical analyses. Zeitschrift für Geomorphologie 61: 315–26. [Google Scholar] [CrossRef]
  2. Abassi, Hamid Reza, Christian Opp, Michael Groll, and Azadeh Gohardoust. 2019. Wind regime and sand transport in the Sistan and Registan regions (Iran/Afghanistan). Zeitschrift für Geomorphologie 62: 41–57. [Google Scholar]
  3. Abbasi, Hamid Reza, Christian Opp, Michael Groll, Hassan Rouhipour, and Azadeh Gohardoust. 2020. Assessment of the distribution and activity of dunes in Iran based on mobility indices and ground data. Aeolian Research 41: 1–17. [Google Scholar] [CrossRef]
  4. Akhlaq, Muhammad, Tarek Rahil Sheltami, and Hussein T. Mouftah. 2012. A review of techniques and technologies for sand and dust storm detection. Reviews in Environmental Science and Bio/Technology 11: 305–22. [Google Scholar] [CrossRef]
  5. Aladin, Nikolai Vasilevich ’, and William Taylor Windle Potts. 1992. Changes in the Aral Sea ecosystem during the period 1960–1990. Hydrobiologia 237: 67–79. [Google Scholar] [CrossRef]
  6. Al-Dousari, Ali, Modi Ahmed, Noor Al-Dousari, and Safaa Awadhi. 2019. Environmental and economic importance of native plants and green belts in controlling mobile sand and dust hazards. International Journal of Environmental Science and Technology 16: 2415–26. [Google Scholar] [CrossRef]
  7. Alghamdi, Abdulmalik A., and Nasser S. Al Kahdani. 2005. Sand control measures and sand drift fences. Journal of Performance of Constructed Facilities 19: 295–99. [Google Scholar] [CrossRef]
  8. Al-Hemoud, Ali, Ali Al-Dousari, Raafat Misak, Mane Al-Sudairawi, Adil Naseeb, Hassan Al-Dashti, and Noor Al-Dousari. 2019. Economic impact and risk assessment of Sand and Dust Storms (SDS) on the oil and gas industry in Kuwait. Sustainability 11: 200. [Google Scholar] [CrossRef] [Green Version]
  9. Ansmann, Albert, Rodanthi Elisavet Mamouri, Johannes Bühl, Patric Seifert, Ronny Engelmann, Agyro Nisantzi, Julian Hofer, and Holger A. Baars. 2019. Lidar/radar approach to quantify the dust impact on ice nucleation in mid and high level clouds. E3S Web of Conferences 99. [Google Scholar] [CrossRef]
  10. Aragnou, Emilie, Sean Watt, Hiep Nguyen Duc, Cassandra Cheeseman, Matthew Riley, John Leys, Stephen White, David Salter, Azzi Merched, Lisa Tzu-Chi Chang, and et al. 2021. Dust transport from Inland Australia and ist impact on air quality and health on the eastern coast of Australia during the February 2019 dust storm. Atmosphere 12: 141. [Google Scholar] [CrossRef]
  11. Baas, Andreas C. W. 2019. Grains in motion. In Aeolian Geomorphology. A New Introduction. Edited by Ian Livingstone and Andrew Warren. Oxford: John Wiley & Sons, pp. 27–60. [Google Scholar]
  12. Bagnold, Ralph Alger. 1941. The Physics of Blown Sand and Desert Dunes. London: Methuen. [Google Scholar]
  13. Bagnold, Ralph Alger. 1971. The Physics of Blown Sand and Desert Dunes. London: Chapman & Hall. [Google Scholar]
  14. Buseck, Peter R., and Mihály Pósfai. 1999. Airborne minerals and related aerosol particles: Effects on climate and the environment. Proceedings of the National Academy of Science USA 96: 3372–79. [Google Scholar] [CrossRef] [PubMed] [Green Version]
  15. CAMS—Copernicus Atmoshere Monitoring Service. 2021. Global Forcast Plots. Available online: https://atmosphere.copernicus.eu/global-forecast-plots (accessed on 5 July 2021).
  16. Chen, Yong-Shing, Pai-Ching Sheen, Eng-Rin Chen, Yi-Kuen Liu, Trong-Neng Wu, and Chun-Yuh Yang. 2004. Effects of Asian dust storm events on dayli mortality in Taipei, Taiwan. Environmental Research 95: 151–55. [Google Scholar] [CrossRef]
  17. Chesworth, Ward. 1992. Weathering systems (Chapter 2). In Weathering, Soils and Paleosols. Developments in Earth Surface Processes. Edited by I. Peter Martini and Ward Chesworth. Amsterdam: Elsevier, vol. 2, pp. 19–40. [Google Scholar]
  18. Choo, Jang Min, Hoi-Seong Jeong, Gideon Gatluak Kang, N. M. Yoo, and Myeong Soo Kim. 2003. A Study Analyzing Northeast Asian Dust and Sand Storm Damage and the Regional Cooperation Strategies in Korea. Seoul: Korea Environment Institute. [Google Scholar]
  19. Cook, Agnus G., Philip Weinstein, and Jose A. Cenento. 2005. Health effects of natural dust-role of trace elements and compounds. Biological Trace Element Research 103: 1. [Google Scholar] [CrossRef]
  20. Cook, Benjamin I., Richard Seager, and Jason E. Smerdon. 2014. The worst North American drought year of the last millennium: 1934. Geophysical Research Letters 41: 7298–305. [Google Scholar] [CrossRef] [Green Version]
  21. Derbyshire, Edward. 2007. Natural minerogenic dust and human health. AMBIO: A Journal of the Human Environment 36: 73–77. [Google Scholar] [CrossRef]
  22. Dietze, Michael, Elisabeth Dietze, Johanna Lomax, Markus Fuchs, Arno Kleber, and Stephen G. Wells. 2016. Environmental history recorded in aeolian deposits under stone pavements, Mojave Desert, USA. Quaternary Research 85. [Google Scholar] [CrossRef] [Green Version]
  23. DMG—Deutsche Meteorologische Gesellschaft. 2008. European Meteorological Calendar. Berlin: Deutsche Meteorologische Gesellschaft. [Google Scholar]
  24. Durant, Adam J., Constanza Bonadonna, and Claire J. Horwell. 2010. Atmospheric and environmental impacts of volcanic particulates. Elements 6: 235–40. [Google Scholar] [CrossRef]
  25. Engelbrecht, Johann P., and Edward Derbyshire. 2010. Airborne Mineral dust. Elements 6: 241–46. [Google Scholar] [CrossRef]
  26. Ehsani, Mohammad Reza, Jorge Arevalo, Christoforus Bayu Risanto, Mostafa Javadian, Charles John Devine, Alireza Arabzadeh, Hector L. Venegas-Quiñones, Ambria Paige DellOro ’, and Ali Behrangi. 2020. 2019–2020 Australia fire and its relationship to hydroclimatological and vegetation variabilities. Water 12: 3067. [Google Scholar] [CrossRef]
  27. Elpiner, Leonid I. 1999. Public health in the Aral Sea coastal region and the dynamics of changes in the ecological situation. In Creeping Environmental Problems and Sustainable Development in the Aral Sea Basin. Edited by Michael H. Glantz. Cambridge: Cambridge University Press, pp. 128–56. [Google Scholar]
  28. Engling, Guenter, and András Gelencsér. 2010. Atmospheric brown clouds from local air pollution to climate change. Elements 6: 223–28. [Google Scholar] [CrossRef]
  29. Fan, Ke, Huijun Wang, Xianmei Lang, and Xu Yue. 2010. Dust and its prediction in North China. In Dust Storms. Elemental Composition, Causes and Environmental Impacts. Edited by S. Brstilo and Q. Madunic. New York: Nova Science Publishers, pp. 241–47. [Google Scholar]
  30. Farzanegan, Mohammad Reza, Mehdi Feizi, and Hassan F. Gholipour. 2021. Drought and property prices: Empirical evidence from provinces of Iran. Economics of Disasters and Climate Change 5: 203–21. Available online: https://doi.org/10.1007/s41885-020-00081-0 (accessed on 5 July 2021).
  31. Foroushani, Mansour Ahmadi, Christian Opp, and Michael Groll. 2019. Chemical Characterization of Aeolian Dust Deposition in Southern and Western Iran. Asian Journal of Geographical Research 2: 1–22. [Google Scholar] [CrossRef] [Green Version]
  32. Foroushani, Mansour Ahmadi, Christian Opp, Michael Groll, and Amirhossein Nikfal. 2020. Evaluation of WRF-Chem Prediction for Dust Deposition in Southwestern Iran. Atmosphere 11: 757. [Google Scholar] [CrossRef]
  33. Foroushani, Mansour Ahmadi, Christian Opp, and Michael Groll. 2021. Investigation of Aeolian dust deposition rates in different climate zones of Southwestern Iran. Atmosphere 12: 229. [Google Scholar] [CrossRef]
  34. Furman, Haim Kutiel Hadar. 2003. Dust Storms in the Middle East: Sources of Origin and Their Temporal Characteristics. Indoor and Built Environment 12: 419–26. [Google Scholar] [CrossRef]
  35. Gao, Tao. 2010. Dust storms in Northern China: Temporal-Spatial distributions and influences, climate contros, forecasts and impacts of the surface conditions. In Dust Storms. Elemental Composition, Causes and Environmental Impacts. Edited by S. Brstilo and Q. Madunic. New York: Nova Scince Publisher, pp. 61–111. [Google Scholar]
  36. Gardiner, Beth. 2021. Atemraubender Dunst. National Geographic, April. 40–59. [Google Scholar]
  37. Gassó, Santiago, Vicki H. Grassian, and Ron L. Miller. 2010. Interaction between mineral dust, climate, and ocean ecosystems. Elements 6: 247–52. [Google Scholar] [CrossRef]
  38. Genis, Arthur, Leonid Vulfson, and Jiftah Ben-Asher. 2013. Combating wind erosion of sandy soils and crop damage in the coastal deserts—Wind tunnel experiments. Aeolian Research 9: 69–73. [Google Scholar] [CrossRef]
  39. Gholipour, Hassan F., Mohammad Reza Farzanegan, and Mostafa Javadian. 2020. Air Polution and Internal Migration: Evidence from Iranian Household Survey. Cesifo Working Papers 8107. Available online: https://ideas.repec.org/p/ces/ceswps/_8107.html (accessed on 5 July 2021).
  40. Giere, R., and Xavier Querol. 2010. Solid particle matter in the atmosphere. Elements 6: 215–22. [Google Scholar] [CrossRef]
  41. Gilette, D. 1967. Wind tunnel simulation of the erosion of soil: Effect of soil texture, sandblasting, wind speed and soil consilidation on dust production. Atmospheric Environment 12: 1735–43. [Google Scholar] [CrossRef]
  42. Ginoux, Paul, Joseph M. Prospero, Thomas E. Gill, N. Christina Hsu, and Ming Zhao. 2012. Global‐scale attribution of anthropogenic and natural dust sources and their emission rates based on MODIS Deep Blue aerosol products. Reviews of Geophysics 50. [Google Scholar] [CrossRef]
  43. Gíslason, Sigurdur R., and Helgi A. Alfredsson. 2010. Sampling the volcanic ash from the Eyjafjallajökull volcano, Iceland—A personal account. Elements 6: 269–70. [Google Scholar]
  44. Goudie, Aandrew S. 2008. The history and nature of wind erosion in deserts. Annual Review of Earth and Planetary Sciences 36: 97–119. [Google Scholar] [CrossRef] [Green Version]
  45. Goudie, Andrew S., and Nick J. Middleton. 2001. Saharan dust storms: Nature and consequences. Earth-Science Reviews 56: 179–204. [Google Scholar] [CrossRef]
  46. Goudie, Andrew S., and Nick J. Middleton. 2006. Desert Dust in the Global System. Heidelberg: Springer. [Google Scholar]
  47. Groll, Michael, Christian Opp, and Ilhomjon Aslanov. 2013. Spatial and Temporal distribution of the dust deposition in Central Asia—Results from a long-term monitoring program. Aeolian Research 9: 49–62. [Google Scholar] [CrossRef]
  48. Groll, Michael, Christian Opp, Oleg E. Semenov, and Aleksander Shapov. 2018. Chapter II/57—Ground-based measurement of Aeolian dust deposition in the Aral Sea region. In Novel Methods and Results of Landscape Research in Europe, Central Asia and Siberia—Vol. II: Understanding and Monitoring Processes in Soils and Water Bodies. Edited by Victor G. Sychev and Lothar Mueller. Moscow: FGBNU "VNII agrochimii", pp. 265–69. [Google Scholar] [CrossRef]
  49. Groll, Michael, Christian Opp, Gulnura Issanova, Nataliya Vereshagina, and Oleg E. Semenov. 2019. Physical and chemical characterization of dust deposited in the Turan Lowland. E3S Web of Conferences 99: 03005. [Google Scholar] [CrossRef]
  50. Groß, Silke, Volker Freudenthaler, Kerstin Schepanski, Carlos Toledano, Andreas Schäfler, Albert Ansmann, and Bernadett Weinzierl. 2015. Optical properties of long-ranged Saharan dust over Barbados as measured by dual wavelength depolarization of Raman lidar measurements. Atmospheric Chemistry and Physics 15: 11067–80. [Google Scholar] [CrossRef] [Green Version]
  51. Haase, G., Leonore Händel, Christine Nagel, Christian Opp, and Reinhard Zierath. 1990. Environmental Impacts by input of substances in landscapes of the District (Bezirk) of Leipzig, Germany. GeoJournal 22: 153–65. [Google Scholar] [CrossRef]
  52. Halimov, Mustafa, and Fritz Fezer. 1989. Eight Yardang types in Central Asia. Zeitschrift für Geomorphologie 33: 205–17. [Google Scholar] [CrossRef]
  53. Hesse, Paul. 2019. Sand Seas. In Aeolian Geomorphology. A New Introduction. Edited by Ian Livingstone and Andrew Warren. Oxford: John Wiley Blackwell, pp. 179–208. [Google Scholar]
  54. Hirano, Takashi, Makoto Kiyota, and Ichiro Aiga. 1995. Physical effects of dust on leaf physiology of cucumber and kidney bean plants. Environmental Pollution 89: 255–61. [Google Scholar] [CrossRef]
  55. Hoffmann, Carsten, Roger Funk, Ralf Wieland, Yong Li, and Michael Sommer. 2008. Effects of grazing and topography on dust flux and deposition in the Xilingele grassland, Inner Mongolia. Journal of Arid Environments 72: 792–807. [Google Scholar] [CrossRef]
  56. Hong, Yun-Chul, Xian-Chuan Pan, Su-Young Kim, Kwangsik Park, Eun-Jung Park, Xiaobin Jin, Seung-Muk Yi, Yoon-Hee Kim, Choong-Hee Park, Sanghwan Song, and et al. 2010. Asian dust storm and pulmonary function of school children in Seoul. Science of the Total Environment 408: 754–59. [Google Scholar] [CrossRef] [PubMed]
  57. Hsieh, Nan-Hung, and Chung-Min Liao. 2013. Assessing Exposure Risk for Dust Storm Events-Associated Lung Function Decrement in Asthmat-ics and Implications for Control. Atmospheric Environment 68: 256–64. [Google Scholar] [CrossRef]
  58. Huszar, Paul C., and Steven L. Piper. 1986. Estimating the off-site costs of wind erosion in New Mexico. Journal of Soil and Water Conservation 41: 414–16. [Google Scholar]
  59. Ishizuka, Masahide, Masao Mikami, Yutaka Yamada, Fanjiang Zeng, and Weidong Gao. 2005. An observational study of soil moisture effects on wind erosion at a gobi site in the Taklimakan Desert. Journal of Geophysical Research—Atmospheres 110: D18–S03. [Google Scholar] [CrossRef] [Green Version]
  60. Kang, Jiun-Horng, Joseph J. Keller, Chin-Shyan Chen, and Herng-Ching Lin. 2012. Asian Dust Storm Events are Associated with an Acute Increase in Pneumonia Hospitalization. Annals of Epidemiology 22: 257–63. [Google Scholar] [CrossRef]
  61. Karami, Sara, Nasim Hossein Hamzeh, Dimitris Kaskaoutis, Alireza Rashki, Khan Alam, and Abbas Ranjbar. 2021. Numerical simulations of dust storms originated from dried lakes in central and southwest Asia: The case of Aral Sea and Sistan Basin. Aeolian Research. [Google Scholar] [CrossRef]
  62. Karanasiou, Angeliki, Natalia Moreno, Teresa Moreno, Mar Viana, Frank de Leeuw, and Xavier Querol. 2012. Health effects from Sahara dust episodes in Europe. Literature review and research gaps. Environment International 47: 107–14. [Google Scholar] [CrossRef]
  63. Kaskaoutis, Dimitris, Harry D. Kambezidis, KandalamVenkata Srinivasa Badarinath, and Shailesh Kumar Kharol. 2010. Dust storm identification via satellite remote sensing. In Dust Storms. Elemental Composition, Causes and Environmental Impacts. Edited by S. Brstilo and Q. Madunic. New York: Nova Science Publisher, pp. 1–59. [Google Scholar]
  64. Kazakhstan Academy of Sciences. 2010. National Atlas of Kazakhstan. Sheet: Number of days with duststorms per year. Almaty: Institute of Geography and Water Security, p. 70. [Google Scholar]
  65. Klose, Martina, and Yaping Shao. 2013. Large-Eddy simulations of turbulent dust emission. Aeolian Research 8: 49–58. [Google Scholar] [CrossRef]
  66. Knight, Jasper. 2019. Wind erosion. In Aeolian Geomorphology. A New Introduction. Edited by Ian Livingstone and Andrew Warren. Oxford: John Wiley & Sons, pp. 61–80. [Google Scholar]
  67. Konovalov, Igor, Matthias Beekmann, Irina N. Kuznetsova, Alla Yurova, and Anatoly Zvyagintsev. 2011. Atmospheric impacts of the 2010 Russian wildfires: Integrating modelling and measurements of the extreme air pollution episode in the Moscow megacity region. Atmospheric Chemistry and Physics 11: 10031–56. [Google Scholar] [CrossRef] [Green Version]
  68. Kuldasheva, Shaxnoza A., Rashid Kulmatov, Christian Opp, Michael Groll, I. L. Ахmadjonov, Nargiza Z. Adizova, I. D. Eshmetov, and Shuxrat A. Mutalov. 2020. River structurants based on water-soluble surfactants for fixing mobile sands and soil particles of the drained bottom of the Aral Sea. Geographica Augustana 31: 39–46. [Google Scholar]
  69. Kulmatov, Rashid, Anvar Rasulov, Dilafruz Kulmatova, B. Rozilhodjaev, and Michael Groll. 2015. The Modern Problems of Sustainable Use and Management of Irrigated Lands on Example of the Bukhara Region (Uzbekistan). Journal of Water Resource and Protection 07: 956–71. [Google Scholar] [CrossRef] [Green Version]
  70. Kuzmina, Zhanna V., and Sergey J. Treshkin. 2012. Phytoremediation of solonchaks in the Uzbekistan pre-Aral region under recent climate change. In Aralkum—A Man-Made Desert. Edited by Sigmar W. Breckle, Walter Wucherer, Liliya A. Dimeyeva and Nathalia P. Ogar. Berlin: Springer, pp. 407–29. [Google Scholar]
  71. Lancaster, Nicholas, Andrew. C. W. Baas, and Douglas J. Sherman. 2013. Aeolian Geomorphology: Introduction. In Treatise on Geomorphology. Edited by John F. Shroder. Oxford: John Wiley & Sons, vol. 11, pp. 1–6. [Google Scholar]
  72. Lee, Hyewon, Ho Kim, Yasushi Honda, Yon-Hee Lim, and Seungmuk Yi. 2013. Effects of Asian dust storms on dayli mortality in seven metropolitan cities of Korea. Atmospheric Environment 79: 510–17. [Google Scholar] [CrossRef]
  73. Levine, Joel S. 1999. The 1997 fires in Kalimantan and Sumutra, Indonesia: Gaseous and particulate emission. Geophysical Research Letters 26: 815–18. [Google Scholar] [CrossRef]
  74. Liu, Yong, Guangpeng Wang, Ziying Hu, Peijun Shi, Yanli Lyu, Zhang Guoming, Yu Gu, Yun Liu, Chang Hong, Lanlan Guo, and et al. 2020. Dust storm susceptibility on different land surface types in arid and semiarid regions of northern China. Atmospheric Research 243. [Google Scholar] [CrossRef]
  75. Livingstone, Ian, Giles F. S. Wiggs, and Corinne M. Weaver. 2007. Geomorphology of desert sand dunes: A review of recent progress. Earth Science Reviews 80: 239–57. [Google Scholar] [CrossRef]
  76. Mahmoodi, Maryam, Farhad Khormali, Arash Amini, and Shamsollah Ayoubi. 2016. Weathering and soils formation on different parent materials in Golestan Province, Northern Iran. Journal of Mountain Science 13: 870–81. [Google Scholar] [CrossRef]
  77. Mahowald, Natalie, Samuel Albani, Jasper F. Kok, Sebastian Engelstaeder, Rachel Scanza, Daniel S. Ward, and Mark G. Flanner. 2014. The size distribution of desert dust aerosols and its impact on the Earth system. Aeolian Research 15: 53–71. [Google Scholar] [CrossRef] [Green Version]
  78. Mallone, Sandra, Massimo Stafoggia, Annunziata Faustini, Gian Paolo Gobbi, Achille Marconi, and Francesco Forastiere. 2011. Saharan dust and associations between particulate matter and daily mortality in Rome, Italy. Environmental Health Perspectives 119: 1409–14. [Google Scholar] [CrossRef]
  79. Mao, Rui, ChangHoi Ho, YaPing Shao, DaoYi Gong, and Jhoon Kim. 2011. Influence of Arctic oscillation on dust activity over Northeast Asia. Atmospheric Environment 45: 326–37. [Google Scholar] [CrossRef]
  80. Matsui, Kayo, Tetsuhiro Watanabe, Maira Kussainova, and Shinya Funakawa. 2018. Soil properties that determine the mortality and growth of Haloxylon aphyllum in the Aralregion, Kazakhstan. Arid Land Research and Management 33: 37–54. [Google Scholar] [CrossRef]
  81. Matsushima, Dai, Reiji Kimura, Yasunori Kurosaki, Ulgiichimeg Ganzorig, and Masato Shinoda. 2020. A Method for Estimating the Threshold Wind Speed for Dust Emissions as a Function of Soil Moisture. Boundary-Layer Meteorology 175: 237–57. [Google Scholar] [CrossRef]
  82. McLeman, Robert A., Juliette Dupre, Lea Berang Ford, James Ford, Konrad Gajewski, and Gregory Marchildon. 2014. What we learned from the Dust Bowl: Lessons in science, policy, and adaption. Population & Environment 35: 417–40. [Google Scholar]
  83. MEA. 2005. Millenium Ecosystem Assessment. Ecosystems and Human Well-Being. Desertification Synthesis. Washington, DC: World Resources Institute. [Google Scholar]
  84. Meng, Zongju, Xiaohong Dang, Yong Gao, Xiaomeng Ren, Yanlong Ding, and Meng Wang. 2018. Interactive effects of wind speed, vegetation coverage and soil moisture in controlling wind erosion in a temperate desert steppe, Inner Mongolia of China. Journal of Arid Land 10: 534–47. [Google Scholar] [CrossRef] [Green Version]
  85. Middleton, Nick J. 2017. Desert dust hazards: A global review. Aeolian Research 24: 53–63. [Google Scholar] [CrossRef]
  86. Middleton, Nick J., and Utchang Kang. 2017. Sand and Dust Storms: Impact and mitigation. Sustainability 9: 1053. [Google Scholar] [CrossRef] [Green Version]
  87. Miller, Steven D. 2003. A consolidated technique for enhancing desert dust storms with MODIS. Geophysical Research Letters 30. [Google Scholar] [CrossRef]
  88. Monna, Fabrice, Joel Lancelot, Ian W. Croudace, Andrew B. Cundy, and James T. Lewis. 1997. Pb isotopic composition of airborne particulate material from France and the southern United Kingdom: Implications for Pb pollution sources in urban areas. Environmental Science & Technology 31: 2277–86. [Google Scholar]
  89. Moulin, Cyril, Claude E. Lambert, Francois Dulac, and Uri Dayan. 1997. Control of atmospheric export of dust from North Africa by the North Atlantic oscillation. Nature 387: 691–94. [Google Scholar] [CrossRef]
  90. Nabavi, Seyed Omid, Leopold Haimberger, and Cyrus Samimi. 2016. Climatology of dust distribution over West Asia from homogenized remote sensing data. Aeolian Research 21: 93–107. [Google Scholar] [CrossRef] [Green Version]
  91. O’Riordan, Timothy, ed. 1996. Umweltwissenschaften und Umweltmanagement. Berlin/Heidelberg: Springer. [Google Scholar]
  92. Oldeman, L. Roel. 1992. Global Extent of Soil Degrdation. ISRIC Bi-Annual Report 1991–1992. Wageningen: ISRIC. [Google Scholar]
  93. Onishi, Kazunari, Yasunori Kurosaki, Shinji Otani, Atsushi Yoshida, Nobuo Sugimoto, and Youichi Kurozawa. 2012. Atmospheric transport route determines components of Asian dust and health effects in Japan. Atmospheric Environment 49: 94–102. [Google Scholar] [CrossRef]
  94. Opp, Christian. 2007. Vom Aralsee zur Aralkum: Ursachen, Wirkungen und Folgen des Aralseesyndroms. In Asien (Reihe Planet Erde). Edited by R. Glaser and K. Kremb. Darmstadt: Wiss. Buchgesellschaft, pp. 90–100. [Google Scholar]
  95. Opp, Christian, Michael Groll, Ilhomjon Aslanov, Tom Lotz, and Nataliya Vereshagina. 2016. Aeolian dust deposition in the Southern Aral Sea region (Uzbekistan)—Ground-based monitoring results from the LUCA project. Quaternary International. [Google Scholar] [CrossRef]
  96. Opp, Christian, Julia Wagemann, Sharam Banedjshafi, and Hamid Reza Abbasi. 2017. Aral Sea Syndrome and Lake Urmia crisis. A Comparison of causes, effects and strategies for problem solutions. In Geoparks and Geotourism in Iran. Schriften zur Internationalen Entwicklungs- und Umweltforschung. Edited by A. Dittmann. Gießen: Zentrum für Internationale Entwicklungs- und Umweltforschung, Universität Gießen, vol. 34, pp. 169–83. [Google Scholar]
  97. Orlovsky, Leah, Christian Opp, and Nikolai Orlovsky. 2009. Dust storms and dust depositions—Dynamics, monitoring and case studies from Central Asia. In Dust and sand storms and desertification. Proceedings of the Marburg International Dust and Sand Storm Symposium, Marburg, Germany, 29 September–3 October 2009. Edited by C. Opp and M. Groll. Marburg: Philipps-Universiät Marburg, pp. 20–26. [Google Scholar]
  98. Pahlavanravi, Ahmad, Abdolhossein Miri, and Mohammad Reza Ekhtesasi. 2012. The impact of different kinds of dust storms in hot and dry climate, a case study in Sistan region. Desert 17: 15–25. [Google Scholar]
  99. Paytan, Adina, Katherine R. M. Mackey, Ying Chen, Ivan D. Lima, Scott C. Doney, Natalie Mahowald, Rochelle Labiosa, and Anton F. Post. 2009. Toxicity of atmospheric aerosols on marine phytoplankton. Proceedings of the National Academy of Science 106: 4601–5. [Google Scholar] [CrossRef] [PubMed] [Green Version]
  100. Pederzoli, Anna, Mihaela Mircea, Sandro Finardi, Alcide di Sarra, and Gabriele Zanini. 2010. Quantification of Saharan Dust Contribution to PM10 Concentrations over Italy during 2003–2005. Atmospheric Environment 44: 4181–90. [Google Scholar] [CrossRef]
  101. Perez, Laura, Aurelio Tobías, Xavier Querol, Jorge Pey, Andrés Alastuey, Julio Días, and Jordi Sunyer. 2012. Saharan dust, particulate matter and cause-specific mortality: A case–crossover study in Barcelona (Spain). Environmental International 48: 150–55. [Google Scholar] [CrossRef]
  102. Poulter, Benjamin, Norman L. Christensen, and Patrick N. Halpin. 2006. Carbon emissions from a temperate peat fire and its relevance to interannual variability of trace atmospheric greenhouse gases. Journal of Geophysical Research Atmosphere 111. [Google Scholar] [CrossRef]
  103. Power, Helen C. 2003. The Geography and Climatology of Aerosols.—Progress in Physical Geography. London: Sage Publications Web, vol. 27, pp. 502–47. [Google Scholar]
  104. Prata, Fred. 2009. Satellite detection of hazardous volcanic clouds and the risks to global air traffic. Natural Hazards 51: 303–24. [Google Scholar] [CrossRef]
  105. Ramanathan, Veerabhadran, Paul J. Crutzen, Jeffrey T. Kiel, and Daniel Rosenfield. 2001. Aerosols, climate and the hydrologic cycle. Science 294: 2119–24. [Google Scholar] [CrossRef] [Green Version]
  106. Ramanathan, Veerabhadran, Christine Chung, Dongchul Kim, Thomas W. Bettge, Lawrence E. Buja, Jeffrey T. Kiehl, Warren M. Washington, Qiang Fu, Devraj R. Sikka, and Martin Wild. 2005. Atmospheric brown clouds: Impacts on South Asian climate and hydrological cycle. Proceedings of the National Academy of Science USA 102: 5326–33. [Google Scholar] [CrossRef] [PubMed] [Green Version]
  107. Rashki, Alireza, Dimitris Kaskaoutis, Andrew S. Goudie, and Ralph Kahn. 2013. Dryness of ephemeral lakes and consequences for dust activity: The case of the Hamoun drainage basin, southeastern Iran. Science of the Total Environment 463: 552–64. [Google Scholar] [CrossRef]
  108. Rashki, Alireza, Nick J. Middleton, and Andrew S. Goudie. 2021. Dust storms in Iran—Distribution, causes, frequencies and impacts. Aeolian Research 48: 100655. [Google Scholar] [CrossRef]
  109. Reiche, MMatthias, Roger Funk, Carsten Hoffmann, Michael Sommer, and Yong Li. 2009. Measurements to identify source and sink areas of wind driven matter fluxes. In Dust and Sand Storms and Desertification. Proceedings of the Marburg International Dust and Sand Storm Symposium, Marburg, Germany, 29 September–3 October 2009. Edited by C. Opp and M. Groll. Marburg: Philipps-Universität Marburg, pp. 81–83. [Google Scholar]
  110. Rezaei, Mahrooz, Michel J. P. M. Riksen, Elham Sirjani, Abdolmajid Sameni, and Violette Geissen. 2019. Wind erosion as a driver for transport of light density microplastics. Science of the Total Environment 669: 273–81. [Google Scholar] [CrossRef]
  111. Sacks, Jason D., Lindsay Wichers Stanek, Thomas J. Luben, Douglas O. Johns, Barbara J. Buckley, James S. Brown, and Mary Ross. 2011. Particulate Matter–Induced Health Effects: Who Is Susceptible? Environmental Health Perspectives 119: 446–54. [Google Scholar] [CrossRef] [PubMed]
  112. Sanchez, Pedro A., Dale E. Bandy, J. Hugo Villachica, and John J. Nicholaides. 1982. Amazon Basin soils: Management for continuous crop production. Science 216: 821–27. [Google Scholar] [CrossRef] [PubMed]
  113. Schepanski, Kerstin. 2018. Transport of mineral dust and ist impact on climate. Geoscience 8: 151. [Google Scholar] [CrossRef] [Green Version]
  114. Semenov, Oleg.E. 2020. Introduction to Experimental Meteorology and Climatology of Sand Storms, 2nd ed. Moscow: Fizmatkniga, 448p. (In Russian) [Google Scholar]
  115. Shao, Yaping, Karl-Heinz Wyrwoll, Adrian Chappell, Jianping Huang, Zhaohui Lin, Grant H. McTainsh, Masao Mikami, Taichu Y. Tanaka, Xulong Wang, and Soonchang Yoon. 2011. Dust cyle: An emerging core theme in Earthsystem science. Aeolian Research 2: 181–204. [Google Scholar] [CrossRef]
  116. Sharifi, M. Rasoul, Arthur C. Gibson, and Philip W. Rundel. 1997. Surface dust impacts on gas exchange in Mojave Desert. Journal of Applied Ecology Shrubs 34: 837–46. [Google Scholar] [CrossRef]
  117. Sissakian, Varoujan K., Nadhir Al-Ansari, and Sven Knutsson. 2013. Sand and dust storm events in Iraq. Journal of Natural Science 5: 1084–94. [Google Scholar] [CrossRef] [Green Version]
  118. Spriggs, William A., Slobodan Nickovic, John N. Galgiani, Goran Pejanovic, Slavko Petkovic, Mirjam Vujadinovic, Ana Vukovic, Milan Dacic, Scott DiBiase, Anup Prasad, and et al. 2014. Regional dust storm modeling for health services: The case of valley fever. In Aeolian Research. [Google Scholar] [CrossRef] [Green Version]
  119. Stevens, Bjorn, and Graham Feingold. 2009. Untangling aerosol effects on clouds and precipitation in a buffered system. Nature 461: 607–13. [Google Scholar] [CrossRef] [PubMed]
  120. Sultan, Benjamin, Karima Labadi, Jean-Francois Guegan, and Serge Janicot. 2005. Climate drives the meningitis epidemics onset in West Africa. PLoS Medicine 2: e6. [Google Scholar] [CrossRef] [PubMed] [Green Version]
  121. Tegen, Ina. 2003. Modeling the mineral dust aerosol cycle in the climate system. Quaternary Science Reviews 22: 1821–34. [Google Scholar] [CrossRef]
  122. Tegen, Ina. 2016. Interannual Variability and Decadal Trends in Mineral Dust Aeosol. SDS-WAS-2016-001. Technical Report. Barcelona: WMO, 11p. [Google Scholar]
  123. Tegen, Ina, and Inez Fung. 1994. Contribution to the atmospheric mineral aerosol load from land surface modification. Journal of Geophysical Research: Atmospheres 100: 18707–726. [Google Scholar] [CrossRef]
  124. Tegen, Ina, Martin Werner, Sandy P. Harrisonm, and Karen E. Kohfeld. 2004. Relative importance of climate and land use in determining present and future global soil dust emission. Geophysical Research Letters 31: L05105. [Google Scholar] [CrossRef]
  125. Ina, Tegen, Kerstin Schepanski, and Bernd Heinold. 2013. Comparing two years of Saharan dust source activation obtained by regional modelling and satellite observations. Atmospheric Chemistry and Physics 13: 2381–90. [Google Scholar] [CrossRef] [Green Version]
  126. Temmerman, Stijn, Patrick Meire, Tjeerd J. Bouma, Peter M. J. Herman, Tom Ysebaert, and Huib J. De Vriend. 2013. Ecosystem-based coastel defense in the face of global change. Nature 504: 79. [Google Scholar] [CrossRef] [PubMed]
  127. Tieleman, Henry W. 2003. Wind tunnel simulation of wind loading on low-rise structures: A review. Journal of Wind Engineering and Industrial Aerodynamics 91: 1627–49. [Google Scholar] [CrossRef]
  128. Tong, Daniel Q., Julian X. L. Wang, Thomas E. Gill, Hang Lei, and Binyu Wang. 2017. Intensified dust storm activity and Valley fever infection in the southwestern United States. Geophysical Research Letters 44: 4304–12. [Google Scholar] [CrossRef] [Green Version]
  129. Tozer, P., and John Leys. 2013. Dust storms—What do they really cost? The Rangeland Journal 35: 131–42. [Google Scholar] [CrossRef] [Green Version]
  130. Tsai, Ying I., and Chien-Lung Chen. 2006. Characterization of Asian dust storm and non-Asian dust storm PM2.5 aerosol in Southern Taiwan. Atmospheric Environment 40: 4734–50. [Google Scholar] [CrossRef]
  131. UBA. 2017. Warum ist Feinstaub Schädlich für den Menschen? Available online: https://www.umweltbundesamt.de/service/uba-fragen/warum-ist-feinstaub-schaedlich-fuer-den-menschen (accessed on 5 May 2021).
  132. UBA Umweltbundesamt. 2018. Was ist Feinstaub? Available online: https://www.umweltbundesamt.de/service/uba-fragen/was-ist-feinstaub (accessed on 5 May 2021).
  133. UNCCD. 2021. Sand and Dust Storms. Available online: https://www.unccd.int/actions/sand-and-dust-storms (accessed on 16 June 2021).
  134. UNEP, WMO, and UNCCD. 2016. Global Assessment of Sand and Dust Storms. Nairobi: United Nations Environment Programme. [Google Scholar]
  135. Vester, Barbara P., Martin Ebert, Eric B. Barnert, Johannes Schneider, Konrad Kandler, Lothar Schütz, and St Weinbruch. 2007. Composition and mixing state of the urban background aerosol in the Rhein-Main area (Germany). Atmospheric Environment 41: 6102–15. [Google Scholar] [CrossRef]
  136. Walker, Anette L., Ming Liu, Steven D. Miller, Kim A. Richardson, and Douglas L. Westphal. 2009. Development of a dust source database for mesoscale forecasting in southwest Asia. Journal of Geophysical Research: Atmosphere 114. [Google Scholar] [CrossRef]
  137. Warren, Andrew. 2019. Application. In Aeolian Geomorphology. A New Introduction. Edited by I. Livingstone and A. Warren. Oxford: John Wiley & Sons, pp. 287–306. [Google Scholar]
  138. Washington, Richard, Martin Todd, Nick J. Middleton, and Andrew S. Goudie. 2003. Dust storm source areas determined by the Total Monitoring Spectrometer and surface observations. Annals of the Association of American Geographers 93: 297–313. [Google Scholar] [CrossRef]
  139. Westphal, Douglas L., Owen B. Toon, and Toby N. Carson. 1987. A two dimensional numerical investigation of the dynamics and microphysics of Saharan dust storms. Journal of Geophysical Research: Atmosphere 92: 3027–49. [Google Scholar] [CrossRef]
  140. WHO. 2006. World Health Organization: WHO Air Quality Guidelines Global Update 2005. Bonn: Germany World Health Organization. [Google Scholar]
  141. Wiggs, Giles. 2019. Desert dunes: Form and Process. In Aeolian Geomorphology. A New Introduction. Edited by I. Livingstone and A. Warren. Oxford: John Wiley & Sons, pp. 133–55. [Google Scholar]
  142. Wiggs, Giles F. S., and Corinne M. Weafer. 2012. Turbulent flow structures and aeolian sediment transport over a barchan sand dune. Geophysical Research Letters 39: L0504. [Google Scholar] [CrossRef]
  143. Willett, Christopher D., Michael J. Adams, Simon A. Johnson, and Jonathan P. K. Seville. 2000. Capillary bridges between two spherical bodies. Langmuir 16: 9396–405. [Google Scholar] [CrossRef]
  144. Williams, Peter, and Mike Young. 1999. Costing dust. How much does wind erosion cost people of South Australia? Final Report. Policy and Economic Research Unit CSIRO Land and Water. Available online: https://publications.csiro.au/rpr.download?pid=procite:3923af35-1d72-44f4-a655-5d4241528428&dsid=DS1 (accessed on 5 July 2021).
  145. WMO. 2015. World Meteorological Organization: Sand and Dust Storm Warning and Advisory Assessment System (SDS-WAS). Science and Implementation Plan 2015–2020. Geneva: WMO, p. 37. Available online: http://www.wmo.int/pages/prog/arep/wwrp/new/documents/Final_WWRP_2015_5_SDS_IP.pdf (accessed on 5 July 2021).
  146. WMO. 2021. World Meteorological Organization: Sand and Dust Storms. Available online: https://public.wmo.int/en/our-mandate/focus-areas/environment/SDS (accessed on 5 July 2021).
  147. World Bank. 2019. Sand and Dust Storms in the Middle East and North Africa (MENA) Region. Sources, Costs, and Solutions. Washington, DC: World Bank. [Google Scholar]
  148. Worster, Donald. 1982. Dust Bowl. The Southern Plains in the 1930s. New York: Oxford University Press. [Google Scholar]
  149. Wu, Jian, Yanyan Xu, Congbin Fu, Renjian Zhang, Min Dai, and Yong Zhu. 2006. Comparison of simulated mineral dust aerosols in East Asia by two emission schemes. China Particuology 4: 293–99. [Google Scholar] [CrossRef]
  150. Yamamoto, Shinya, Kimitaka Kawamura, Osamu Seki, Tadashi Kariya, and Meehye Lee. 2013. Influence of aerosol source regions and transport pathway on δD of terrestrial biomarkers in atmospheric aerosols from the East China Sea. Geochimica et Geocos-mochica Acta 106: 164–76. [Google Scholar] [CrossRef]
  151. Yang, Chun.-Yuh, Yong-Shing Chen, Hui-Fen Chiu, and William B. Goggins. 2005. Effects of Asian dust storm events on daily stroke admissions in Taipei, Taiwan. Environmental Research 99: 79–84. [Google Scholar] [CrossRef]
  152. Yu, Hongbin, Mian Chin, Tianle Yuan, Huisheng Bian, Loraine A. Remer, Joseph M. Prospero, Ali Omar, David Winker, Yuekui Yang, Yan Zhang, and et al. 2015. The fertilizing role of African dust in the Amazon rainforest: A first multiyear assessment based on data from Cloud-Aerosol Lidar and Infrared Pathfinder Satellite Observations. Geophysical Research Letters 42: 1984–91. [Google Scholar] [CrossRef]
  153. Zepp, Harald. 2004. Geomorphologie—Eine Einführung, 3rd ed. Paderborn: Schöning. [Google Scholar]
  154. Zhang, Daizhou. 2008. Effect of sea salt on dust settling to the ocean. Tellus 60: 641–46. [Google Scholar] [CrossRef]
Figure 1. Wind-related particle movement modes. (draft: C. Opp, design: H. Nödler).
Jrfm 14 00326 g001
Figure 2. Dust storm on the Highway (Autobahn) 19, south of Rostock, 8 April 2011 (photo: Ch. Opp).
Jrfm 14 00326 g002
Figure 3. Stony desert pavement as a result of deflation in Southwest Iran, south of Ahwaz (photo: Ch. Opp).
Jrfm 14 00326 g003
Figure 4. Yardangs in the so-called Devils City, west of Hami, Xinjiang, China (photo: Ch. Opp).
Jrfm 14 00326 g004
Figure 5. Sanding up of traffic lanes, here: Kyzyl Kum transit road, 120 km north of Bukhara, Uzbekistan (photo: Ch. Opp ).
Jrfm 14 00326 g005
Figure 6. (a) Oil mulch application for dune stabilization in Sistan Plain (Iran); (b) Sand catchers for sand surface stabilization in the eastern Karakum Desert, Turkmenistan (photos: Ch. Opp).
Jrfm 14 00326 g006
Table 1. Diseases of respiratory tracts in children in two Kazakh Rayons of the Aral Sea basin 1989.
Study Area Rayon KazalinskRayon Zhanakorgan
Quantity of tested children 2030100%1979100%
Quantity of diseases, including 22911.3%23911.9%
Acute pneumonia 14563.0%15365.1%
Chronic bronchitis 6327.5%6829.4%
Chronic pneumonia 219.5%135.5%
Source: State Medical Institute, Almaty, Kazakhstan.
Table 2. Number of carcinoses per 1000 inhabitants and year in Kharakalpakstan, Uzbekistan.
19801981198219831984198519861987198819891990
4.55.87.17.27.17.48.79.57.79.97.8
Source: Elpiner (1999).
Table 3. ENT (Ear-Nose-Throat) diseases of the inhabitants of the Rayon Kazalinsk, District Kyzylorda, Kazakhstan, 1989 *).
Diseased onNumber of Tested People *)% of Sick People% of Tested People
chronic throat-tonsil-inflammation18531.511.4
chronic angina-inflammation9215.65.7
chronic tonsil-inflammation7713.14.8
chronic ear-inflammation7512.74.6
chronic paranasal sinus disease478.02.9
Other acute ENT disease11219.16.9
ENTdiseases altogether58810036.4
* A total of 1,617 persons were tested (80% of the population), 588 of them suffered an ENT disease; Source: State Medical Institute, Almaty, Kazakhstan.
Table 4. ENT diseases of children from Sovkhoz School “Engels”, Rayon Kazalinsk, District Kyzylorda, Kazakhstan, 1989.
Children at the Age of6–10 Years11–15 Years16–18 YearsSum
number of tested children16734.3%16834.5%15231.2%487100%
sick children among them:
chronic nose-throat-inflammation5731.4%3420.2%3221.0%12325.2%
chronic ear-inflammation2615.5%3017.9%2214.5%7816.0%
chronic tonsil-inflammation3118.6%116.6%2013.2%6212.6%
other ENT-inflammation116.6%3219.0%1711.7%6012.5%
Total sick children12574.8%10763.7%9159.9%32366.3%
Source: State Medical Institute, Almaty, Kazakhstan.
Table 5. Immediate and long-term effects of Sand and Dust Storms.
Immediate SDS Effects
Immediate human health problems (e.g., respiratory problems) and mortality;
Annual and perennial crop damage;
Livestock mortality;
Infrastructural damage (e.g., to buildings, electricity and telecommunication structures, power facilities, solar farms, machinery, greenhouses);
Costs for removing sand and dust from infrastructure (e.g., roads, airports, dams, irrigation canals, flood control structures, ditches, power facilities);
Interruption of transport (air, road, rail) and communications (radio); air and road traffic accidents;
Long-Term SDS Effects
Cumulative human health problems (e.g., bronchitis, cardiovascular, and other chronic disorders);
Soil erosion and reduced soil quality and fertility;
Soil pollution through deposition of toxic biological substances (fungi, bacteria), heavy metals, salts, and microplastics;
Disruption of the global climate, CO2, and nutrient cycles through various feedbacks involving global warming, glacier melting, cloud dynamics, precipitation changes, vegetation cover, sea level, and ocean productivity.
Source: UNEP et al. (2016): Global Assessment of Sand and Dust Storms); summarized from Goudie and Middleton (2006).
Table 6. Costs of removal of blown sand from infrastructure in the Middle East in selected years.
AreaReferenceYearCosts (USD)
per Cubic Meter
Kuwait(Al-Dousari et al. 2019)19931.8
Kuwait(Al-Dousari et al. 2019)20135.33
Hafouf, Saudi Arabia(Alghamdi and Al Kahdani 2005)20040.5
Sistan, Iran(Pahlavanravi et al. 2012)20002.0
Sistan, Iran(Pahlavanravi et al. 2012)20040.5
Source: UNEP et al. (2016): Global Assessment of Sand and Dust Storms.
Publisher’s Note: MDPI stays neutral with regard to jurisdictional claims in published maps and institutional affiliations.

