
Investment Decisions with Endogeneity: A Dirichlet Tree Analysis


Abstract
:1. Introduction
2. Related Research
2.1. Digital Marketing for Financial Services
2.2. Fitting Dirichlet Process Mixture Models
3. Research Design and Data Contextualization
3.1. Data Description and Response Component
3.1.1. Sampling
3.1.2. Measurement Turnover
- Turnover
- 2.
- Newsletter
- 3.
- Investor lifetime value
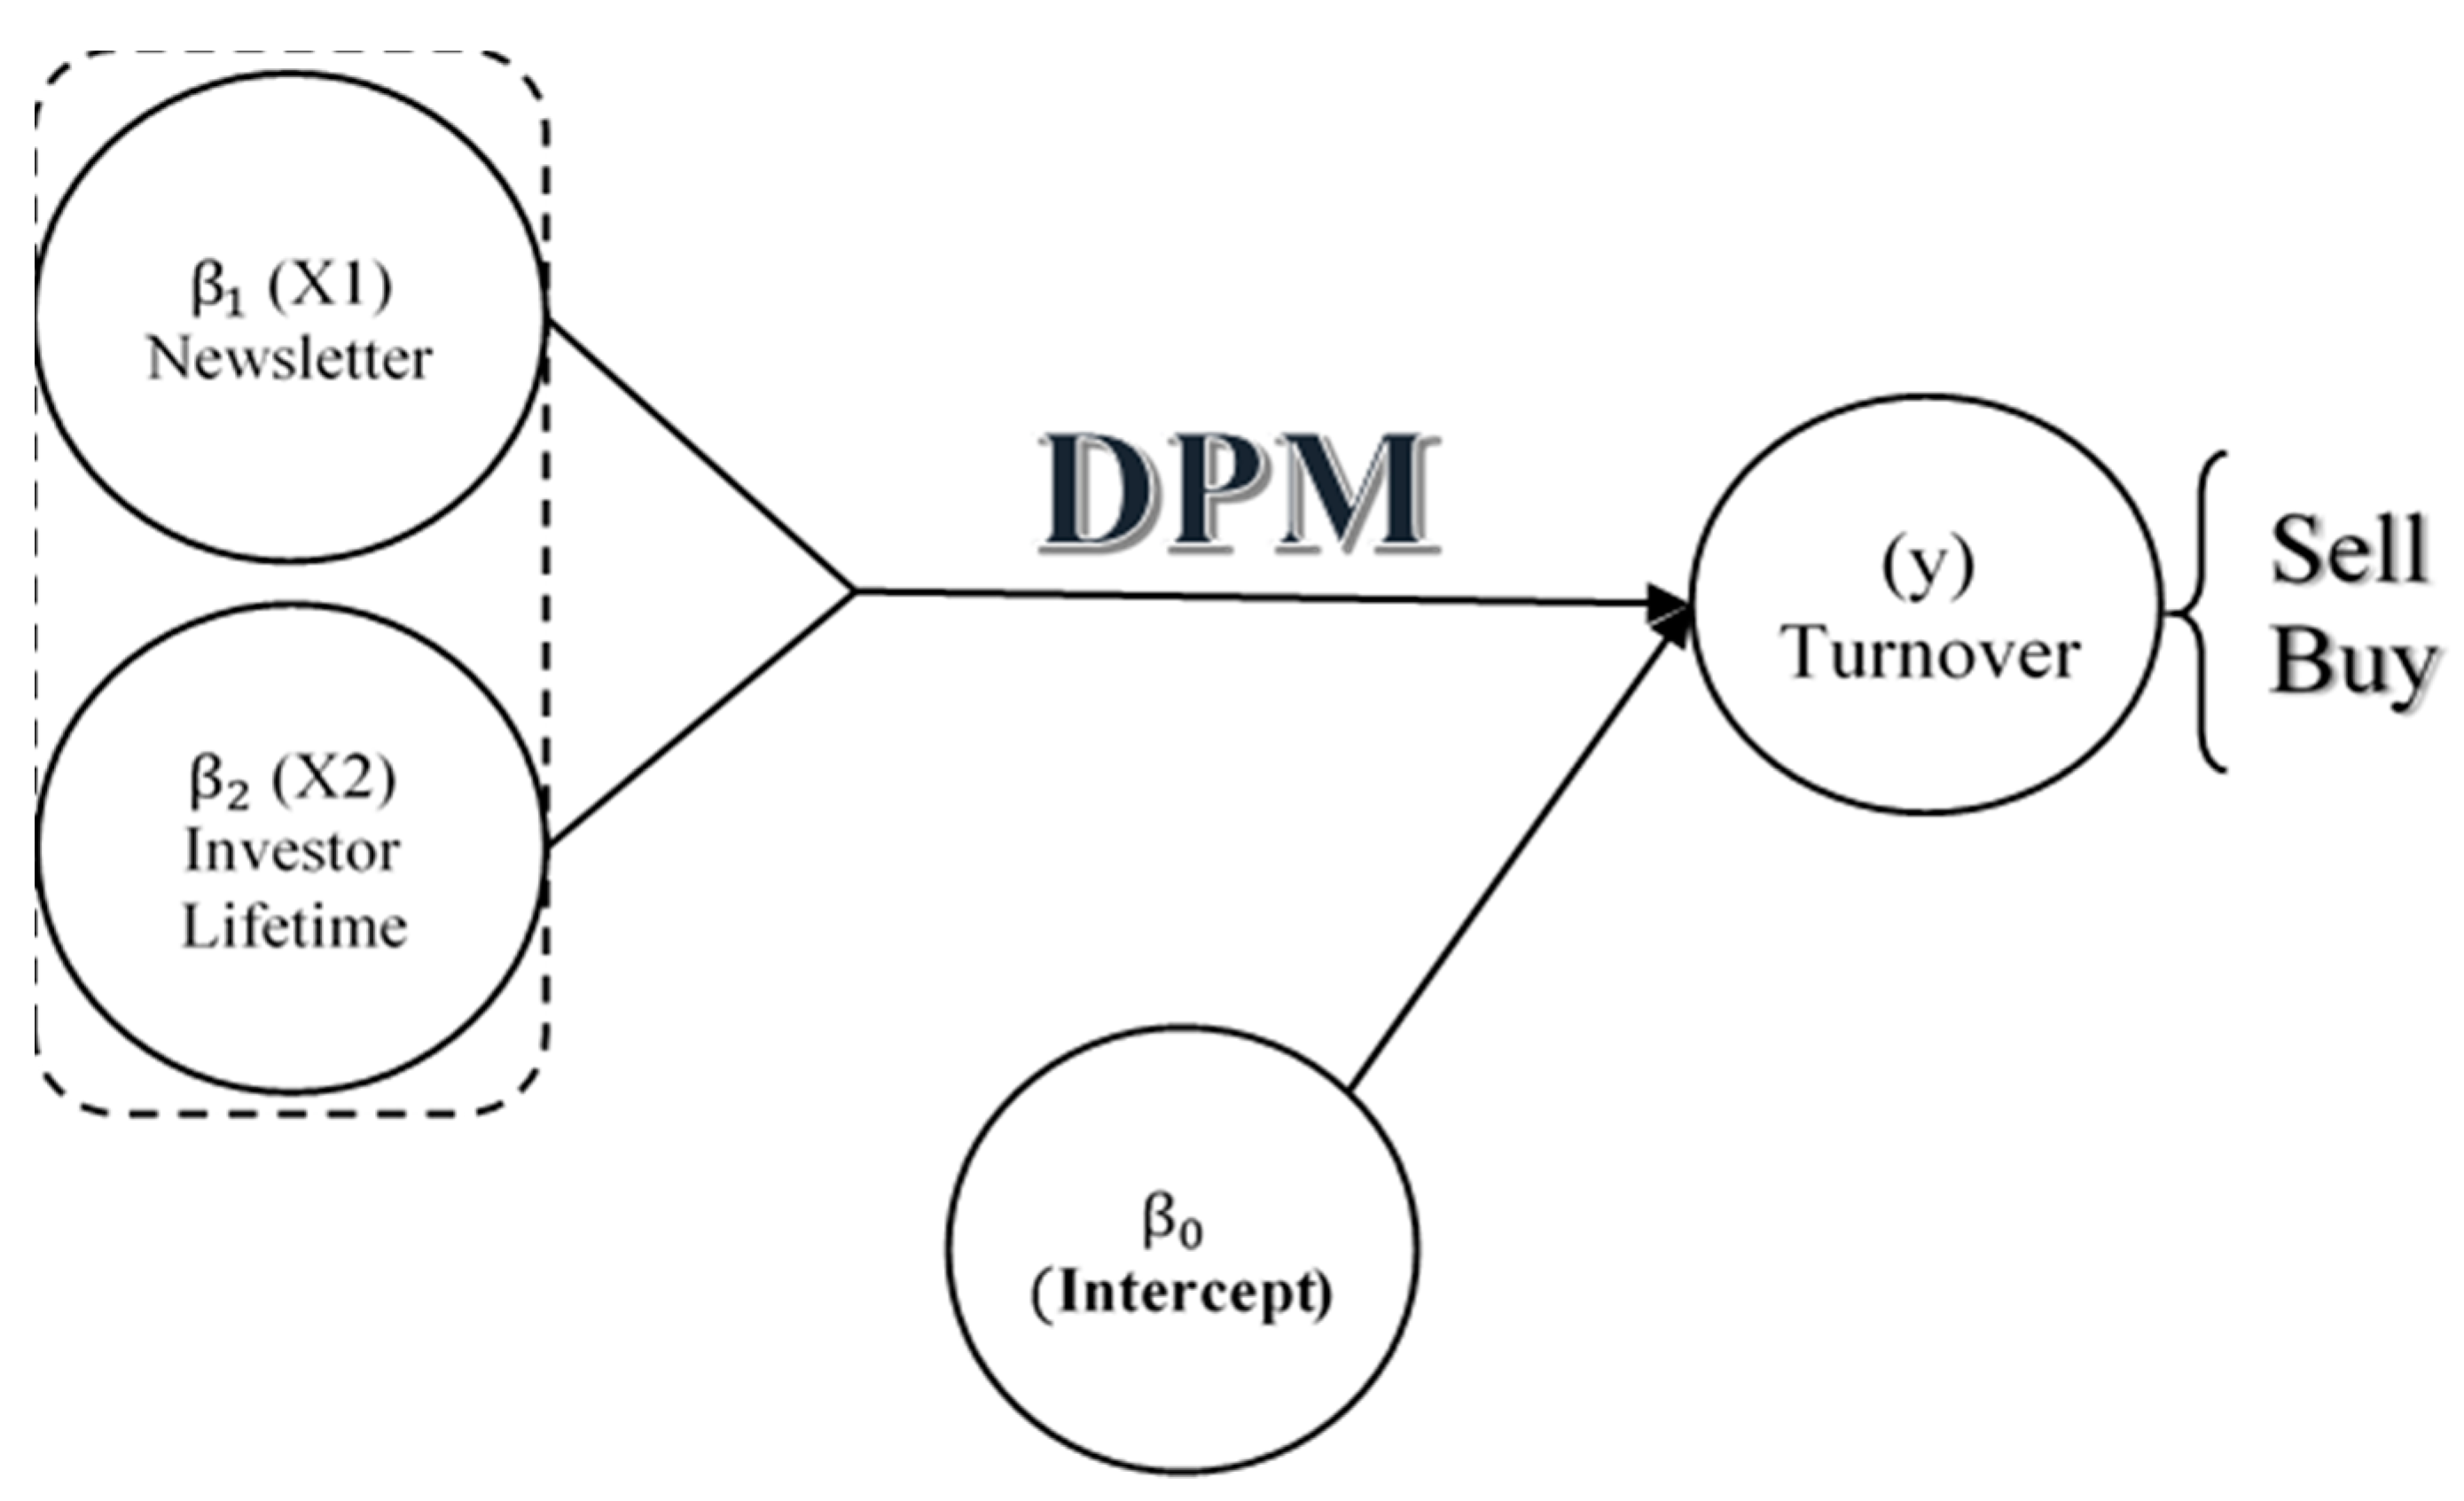
3.2. Endogeneity in the Model Specification and Dirichlet Process Mixture Model
- Generate
- 2.
- Take
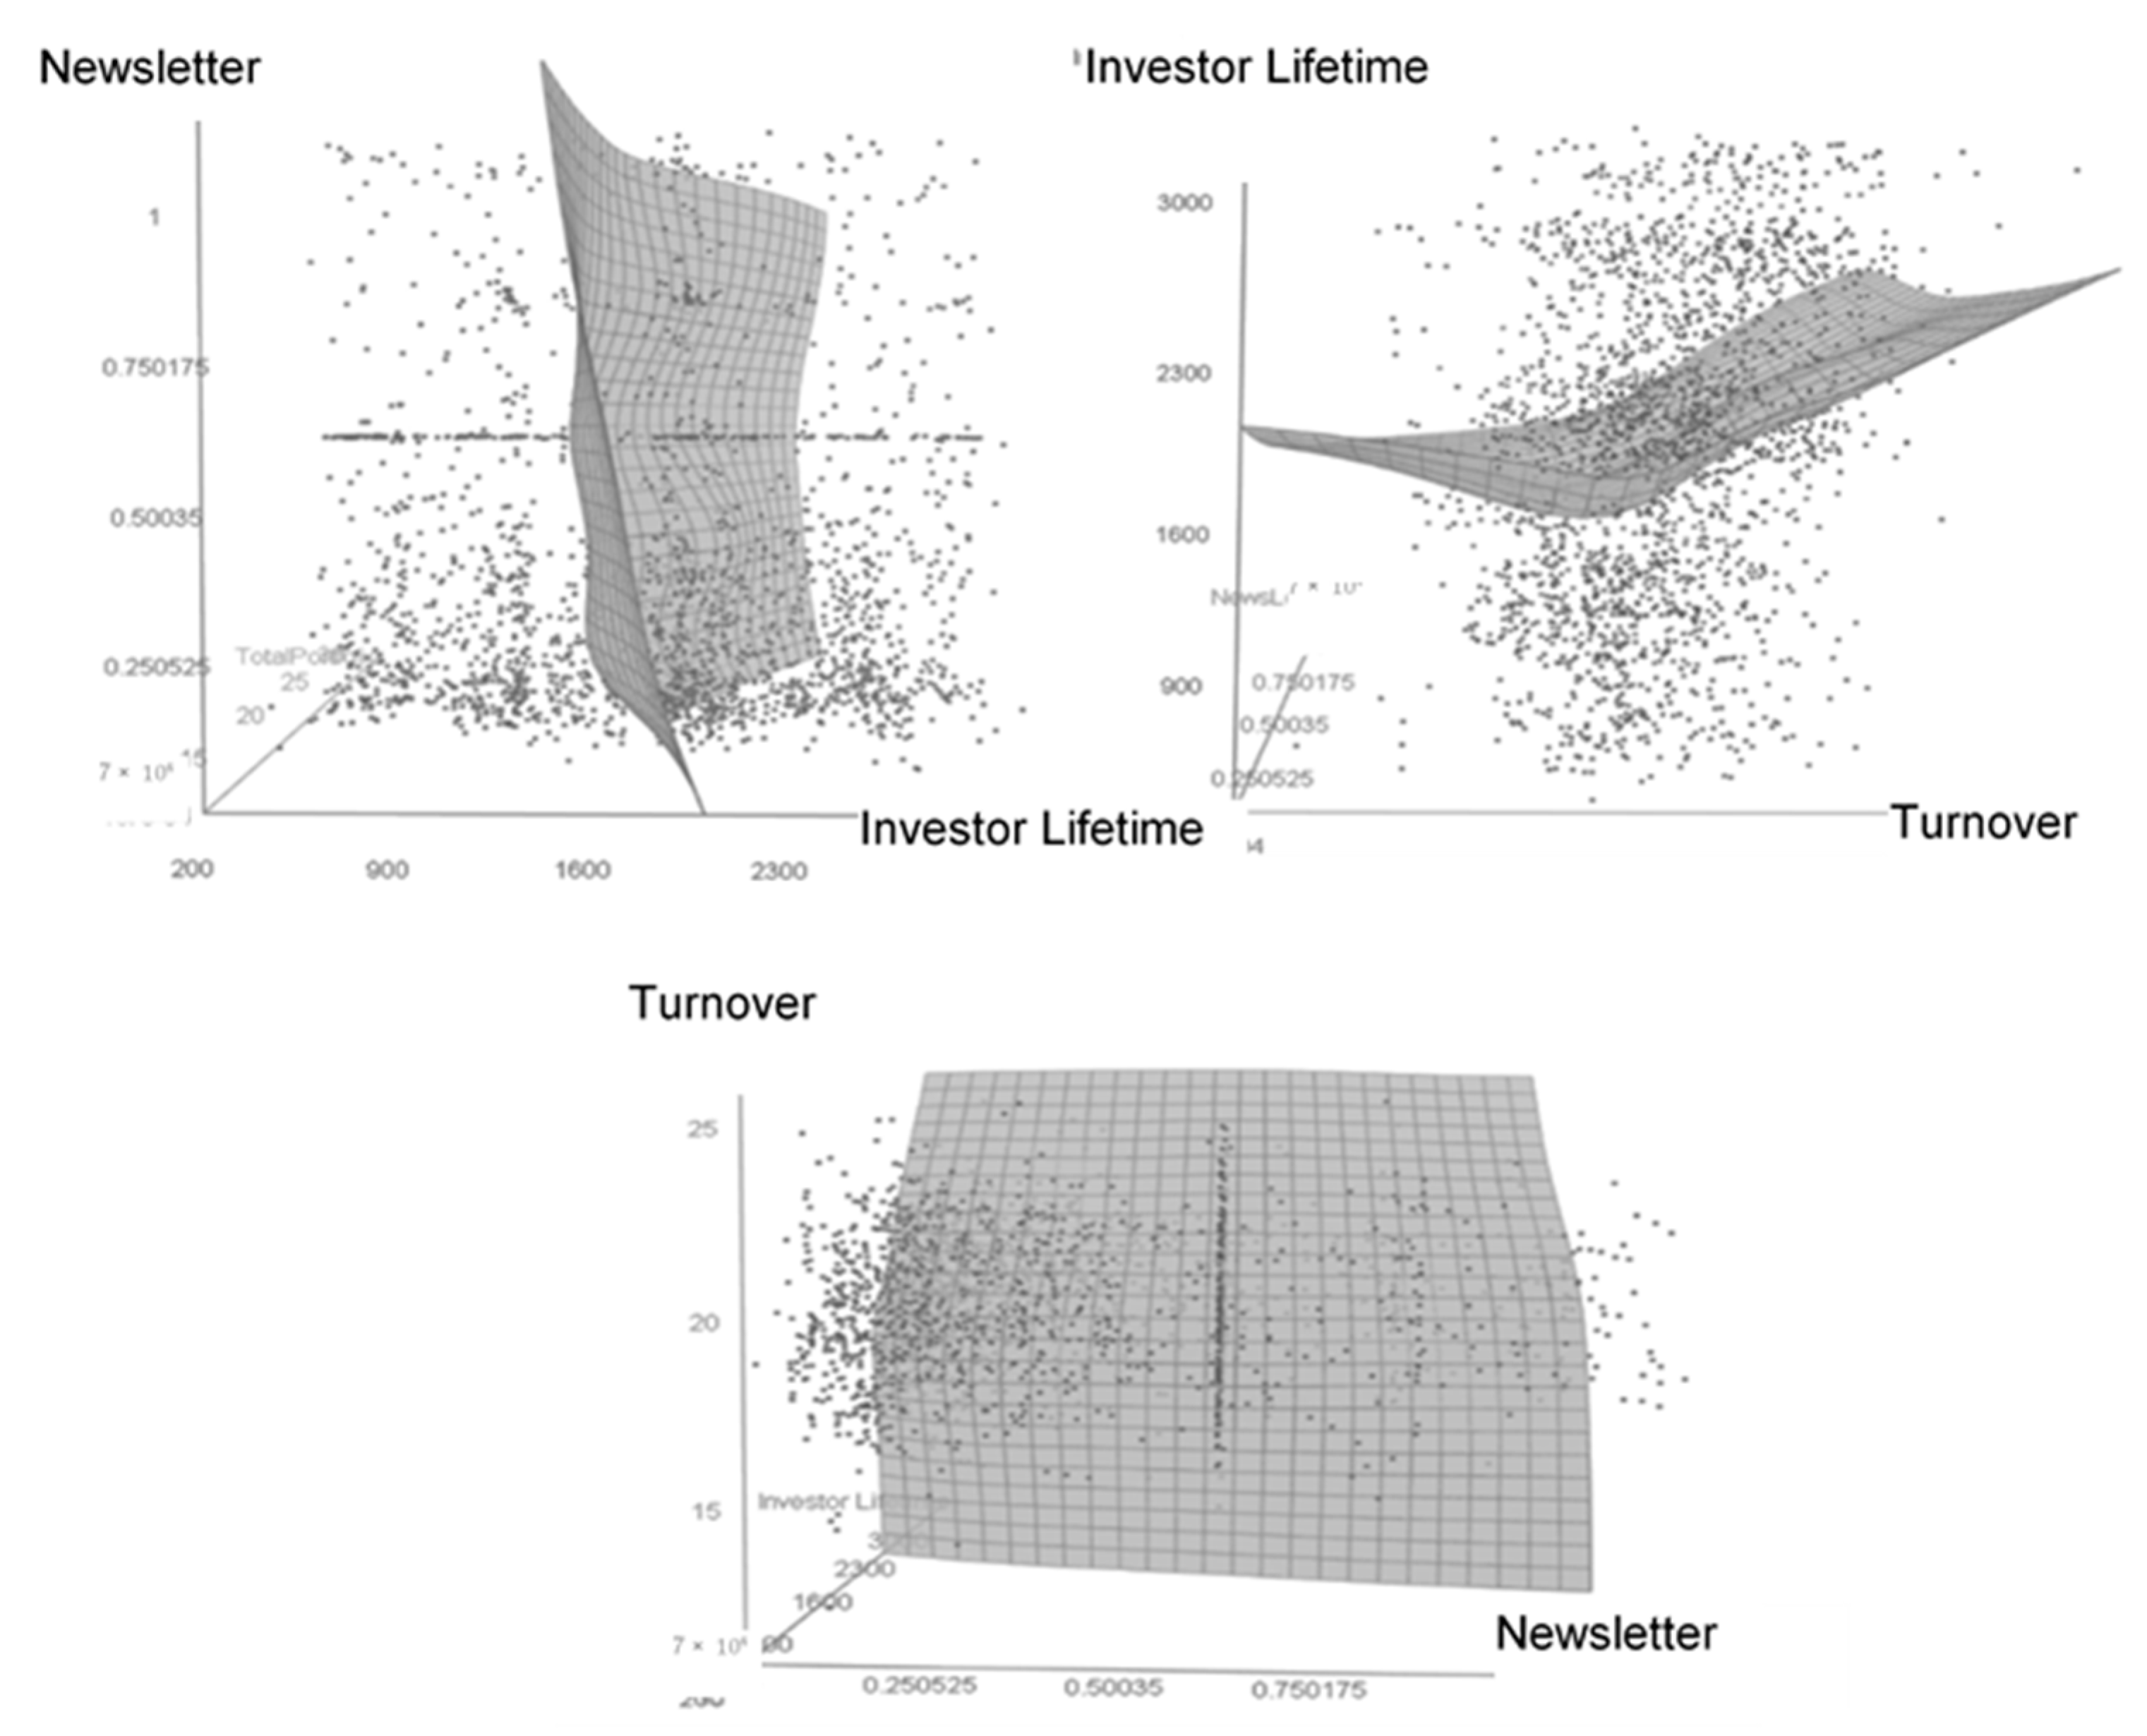
4. Results
5. Discussion, Limitations, and Future Research
Author Contributions
Funding
Institutional Review Board Statement
Informed Consent Statement
Data Availability Statement
Conflicts of Interest
Appendix A
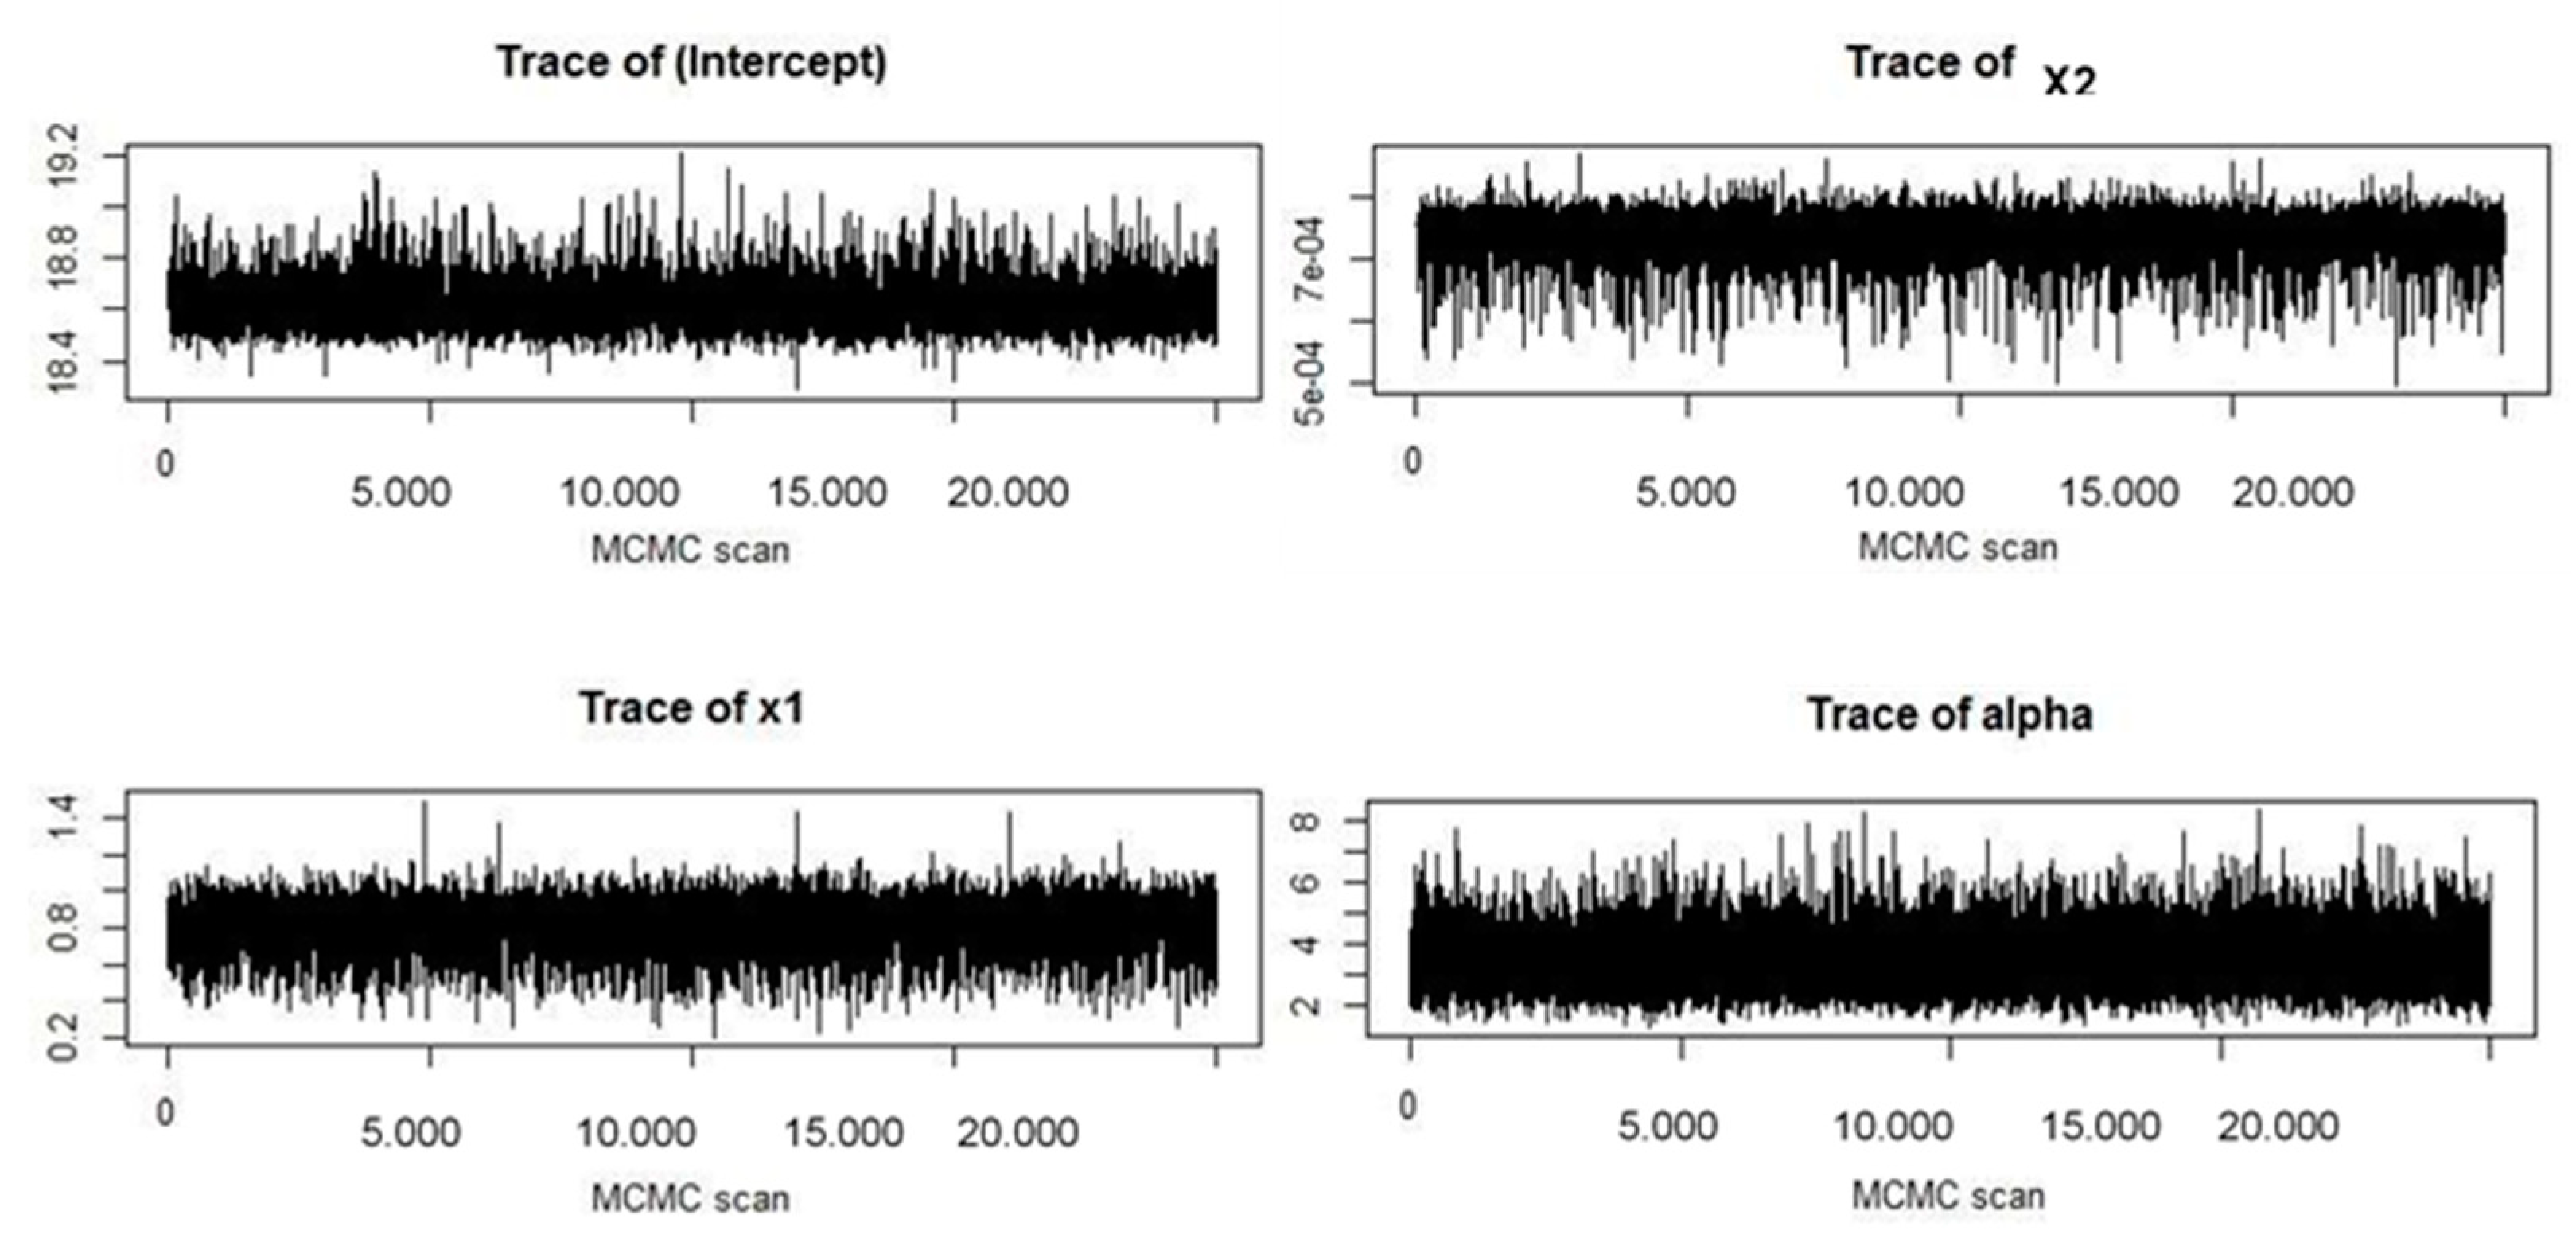
MCMC Parameters

| Step 1 | Step 2 | Step 3 | Step 4 | Step 5 | Step 6 | |
|---|---|---|---|---|---|---|
| nBurn | 5.000 | 10.000 | 15.000 | 25.000 | 50.000 | 100.000 |
| nSave | 10.000 | 5.000 | 10.000 | 10.000 | 10.000 | 20.000 |
| nSkip | 10 | 15 | 15 | 15 | 15 | 15 |
Appendix B
Posterior Predictive Distribution
| Minimum | −8.912 |
| First Quarter | −2.467 |
| Median | −2.054 |
| Mean | −2.305 |
| Third Quarter | −1.886 |
| Maximum | −1.520 |
Appendix C
Histories and Histograms of Metropolis Steps

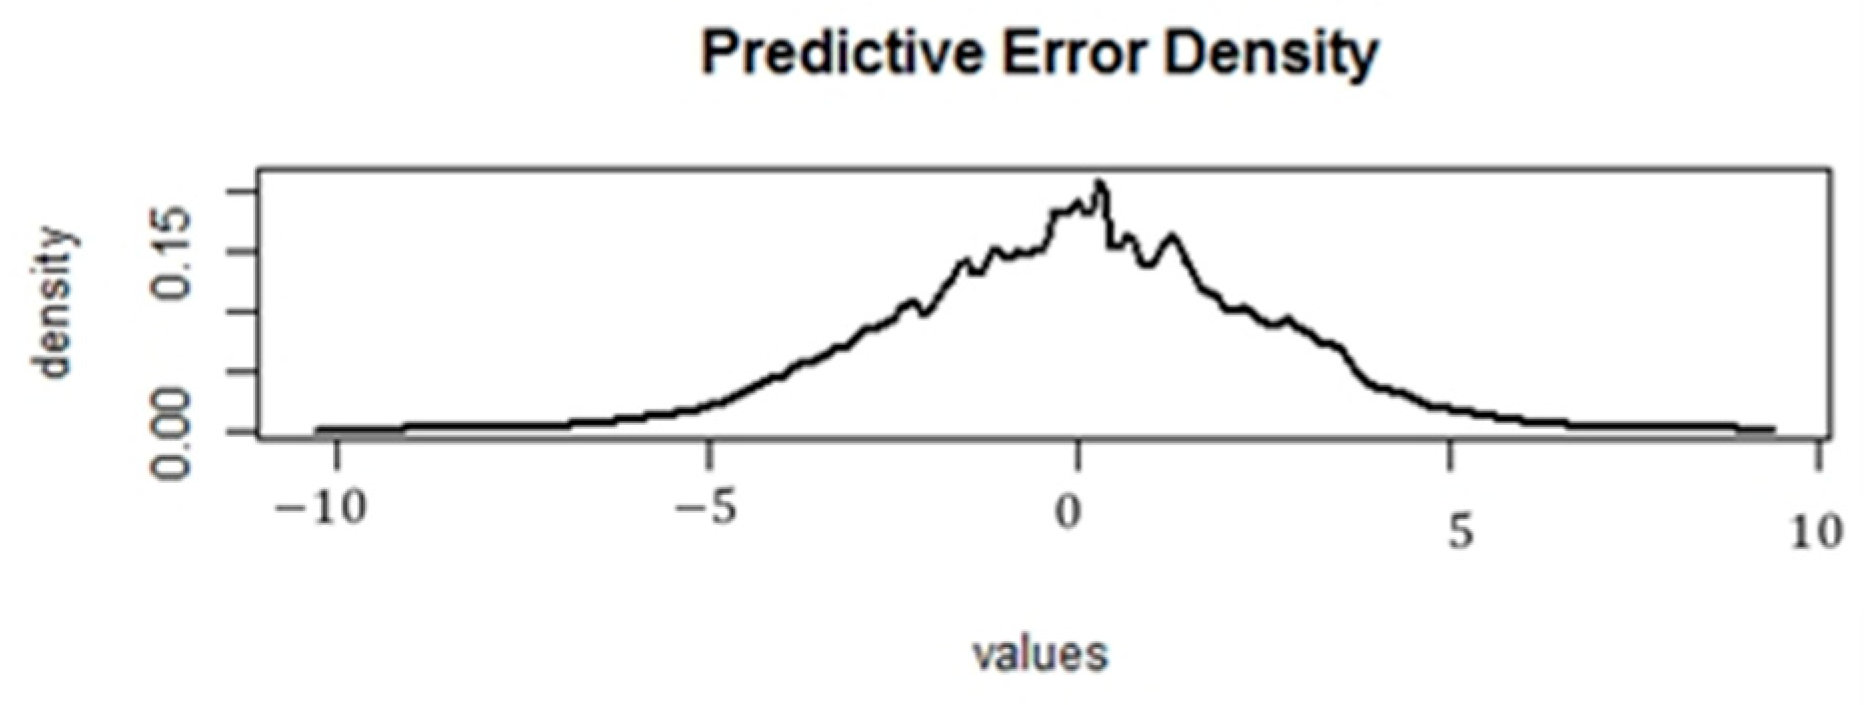
Appendix D
Predictive Error Density

References
- Abdallah, Salam, and Khalil Hilu. 2015. Exploring determinants to explain aspects of individual investors’ financial behavior. Australasian Accounting, Business and Finance Journal 9: 4–22. [Google Scholar] [CrossRef] [Green Version]
- Adrian, Palmer, and Koenig-Lewis Nicole. 2009. An experiential, social network-based approach to direct marketing. Direct Marketing: An International Journal 3: 162–76. [Google Scholar] [CrossRef]
- Ahmad, Maqsood. 2020. Does underconfidence matter in short-term and long-term investment decisions? Evidence from an emerging market. Management Decision. [Google Scholar] [CrossRef]
- Alan, Sule, Cemalcilar Mehmet, Karlan Dean, and Zinman Jonathan. 2018. Unshrouding: Evidence from bank overdrafts in Turkey. Journal of Finance 73: 481–522. [Google Scholar] [CrossRef] [Green Version]
- Asare-Frempong, Justice, and Manoj Jayabalan. 2017. Predicting customer esponse to bank direct telemarketing campaign. Paper presented at International Conference on Engineering Technology and Technopreneurship (ICE2T), Kuala Lumpur, Malaysia, September 18–20. [Google Scholar]
- Asllani, Arben, and Diane Halstead. 2015. A multi-objective optimization approach using the RFM model in direct marketing. Academy of Marketing Studies Journal 19: 65–79. [Google Scholar]
- Bank, Semra, Evrim Erdogan Yazar, and Ugur Sivri. 2019. Can social media marketing lead to abnormal portfolio returns? European Research on Management and Business Economics 25: 54–62. [Google Scholar] [CrossRef]
- Barman, Debaditya, Kamal Kumar Shaw, Anil Tudu, and Nirmalya Chowdhury. 2016. Classification of bank direct marketing data using subsets of training data. In Information Systems Design and Intelligent Applications. New Delhi: Springer, pp. 143–51. [Google Scholar]
- Benoit, Dries F., and Dirk Van den Poel. 2009. Benefits of quantile regression for the analysis of customer lifetime value in a contractual setting: An application in financial services. Expert Systems with Applications 36: 10475–84. [Google Scholar] [CrossRef]
- Buckley, Ross, and Sarah Webster. 2016. Fintech in Developing Countries: Charting New Customer Journeys. Journal of Financial Transformation 44: 1–19. [Google Scholar]
- Bult, Jan Roelf, and Tom Wansbeek. 1995. Optimal selection for direct mail. Marketing Science 14: 378–94. [Google Scholar] [CrossRef]
- Chakrabarty, Bidisha, Sang Bong Lee, and Nitish Singh. 2017. Doing good while making money: Individual investor participation in socially responsible corporations. Management Decision 55: 1645–59. [Google Scholar] [CrossRef]
- Chang, Chun-Wei, and Jonathan (Zaozao) Zhang. 2016. The Effects of Channel Experiences and Direct Marketing on Customer Retention in Multichannel Settings. Journal of Interactive Marketing 36: 77–90. [Google Scholar] [CrossRef]
- Chapman, Ben. 2021. Hedge Funds and Short-Selling: How and Why Gamestop Shook the Stock Market. Available online: https://www.gqindia.com/get-smart/content/hedge-funds-gamestop-short-selling-stocks-everything-you-need-to-know-about-how-a-sub-reddit-shook-the-stock-markets (accessed on 29 January 2021).
- Chintagunta, Pradeep, Tülin Erdem, Peter Eric Rossi, and Michel Wedel. 2006. Structural modeling in marketing: Review and assessment. Marketing Science 25: 604–16. [Google Scholar] [CrossRef] [Green Version]
- Cipolli, William, and Timothy Hanson. 2019. Supervised learning via smoothed Polya trees. Advances in Data Analysis and Classification 13: 877–904. [Google Scholar] [CrossRef]
- Dapp, Thomas, Lars Slomka, Deutsche Bank AG, and Ralf Hoffmann. 2014. Fintech–The digital (r)evolution in the financial sector. Deutsche Bank Research 11: 1–39. [Google Scholar]
- De Iorio, Maria, Peter Müller, Gary Rosner, and Steven MacEachern. 2004. An ANOVA model for dependent random measures. Journal of the American Statistical Association 99: 205–15. [Google Scholar] [CrossRef]
- Decker, Reinhold, and Ralf Wagner. 2000. Remarks on the behavioristic analysis of competitive reactions. OR-Spectrum 22: 97–116. [Google Scholar]
- Denison, David GT, and Bani Mallick. 2007. Analyzing financial data using Polya trees. In Bayesian Statistics and Its Application. New Delhi: Anamaya. [Google Scholar]
- Dey, Dipak, Peter MüIler, and Debajyoti Sinha, eds. 2012. Practical Nonparametric and Semiparametric Bayesian Statistics. Berlin: Springer Science and Business Media, vol. 133. [Google Scholar]
- Dragotӑ, Victor, and Vlad Şerbӑnescu. 2010. Some Issues concerning romanian investors’ behaviour. Results of a survey. Theoretical and Applied Economics 17: 5–16. [Google Scholar]
- Dunson, David, and Chuanhua Xing. 2009. Nonparametric Bayes modeling of multivariate categorical data. Journal of the American Statistical Association 104: 1042–51. [Google Scholar] [CrossRef] [PubMed] [Green Version]
- Dvořák, Tomáš. 2005. Do domestic investors have an information advantage? Evidence from Indonesia. The Journal of Finance 60: 817–39. [Google Scholar] [CrossRef]
- Ebbes, Peter, Michel Wedel, and Ulf Böckenholt. 2009. Frugal IV alternatives to identify the parameter for an endogenous regressor. Journal of Applied Econometrics 24: 446–68. [Google Scholar] [CrossRef]
- Elsalamony, Hany. 2014. Bank direct marketing analysis of data mining techniques. International Journal of Computer Applications 85: 12–22. [Google Scholar] [CrossRef]
- Feld, Sebastian, Heiko Frenzen, Manfred Krafft, Kay Peters, and Peter Verhoef. 2013. The effects of mailing design characteristics on direct mail campaign performance. International Journal of Research in Marketing 30: 143–59. [Google Scholar] [CrossRef] [Green Version]
- Ferrentino, Rosa, Maria Teresa Cuomo, and Carmine Boniello. 2016. On the customer lifetime value: A mathematical perspective. Computational Management Science 13: 521–39. [Google Scholar] [CrossRef]
- Goldstein, Itay, Chester Spatt, and Mao Ye. 2021. Big Data in Finance. Available online: https://ssrn.com/abstract=3809447 (accessed on 22 March 2021).
- Gomber, Peter, Jascha-Alexander Koch, and Michael Siering. 2017. Digital Finance and FinTech: Current research and future research directions. Journal of Business Economics 87: 537–80. [Google Scholar] [CrossRef]
- Gönül, Füsun, Byung-Do Kim, and Mengze Shi. 2000. Mailing smarter to catalog customers. Journal of Interactive Marketing 14: 2–16. [Google Scholar] [CrossRef]
- Gopal, Ram D., Zhiping Walter, and Arvind Tripathi. 2001. Admediation: New horizons in effective email advertising. Communications of the ACM 44: 91–96. [Google Scholar] [CrossRef]
- Guelman, Leo, Montserrat Guillén, and Ana María Pérez-Marín. 2015. A decision support framework to implement optimal personalized marketing interventions. Decision Support Systems 72: 24–32. [Google Scholar] [CrossRef]
- Guindani, Michele, and Wesley Johnson. 2018. More nonparametric Bayesian inference in applications. Statistical Methods & Applications 27: 239–51. [Google Scholar]
- Hanson, Timothy, and Wesley Johnson. 2002. Modeling regression error with a mixture of Polya trees. Journal of the American Statistical Association 97: 1020–33. [Google Scholar] [CrossRef]
- Hruschka, Harald. 2010. Considering endogeneity for optimal catalog allocation in direct marketing. European Journal of Operational Research 206: 239–47. [Google Scholar] [CrossRef]
- Imrie Brian. 2013. The influence of social capital on service quality evaluation. Management Decision 51: 871–89. [Google Scholar] [CrossRef] [Green Version]
- Jalilvand, Abolhassan, Mojtaba Rostami Noroozabad, and Jeannette Switzer. 2018. Informed and uninformed investors in Iran: Evidence from the Tehran Stock Exchange. Journal of Economics and Business 95: 47–58. [Google Scholar] [CrossRef]
- Jara, Alejandro, Timothy Hanson, Fernando Quintana, Peter Müller, and Gary Rosner. 2011. DPpackage: Bayesian Non- and Semi-parametric Modelling in R Software. Journal of Statistical Software 40: 1–30. [Google Scholar] [CrossRef] [Green Version]
- Jedidi, Kamel, Harsharanjeet Sharan Jagpal, and Wayne DeSarbo. 1997. Finite-mixture structural equation models for response-based segmentation and unobserved heterogeneity. Marketing Science 16: 39–59. [Google Scholar] [CrossRef]
- Kleinman, Ken, and Joseph Ibrahim. 1998. A semi-parametric Bayesian approach to generalized linear mixed models. Statistics in Medicine 17: 2579–96. [Google Scholar] [CrossRef]
- Krantz, Matt. 2021. Nine Investors Instantly Make $16 Billion On GameStop Stock, Squeeze. Available online: https://www.investors.com/etfs-and-funds/sectors/gme-stock-gamestop-investors-instantly-make-16-billion-gamestop-stock-squeeze/ (accessed on 1 February 2021).
- Lavery, Matthew Ryan, Parul Acharya, Stephen Sivo, and Lihua Xu. 2019. Number of predictors and multicollinearity: What are their effects on error and bias in regression? Communications in Statistics-Simulation and Computation 48: 27–38. [Google Scholar] [CrossRef]
- Lavine, Michael. 1992. Some aspects of Polya tree distributions for statistical modelling. Annals of Statistics 20: 1222–35. [Google Scholar] [CrossRef]
- Lavine, Michael. 1994. More aspects of Polya tree distributions for statistical modelling. Annals of Statistics 22: 1161–76. [Google Scholar] [CrossRef]
- Lee, Jinkook. 2002. A key to marketing financial services: The right mix of products, services, channels and customers. Journal of Services Marketing 16: 238–58. [Google Scholar] [CrossRef]
- Lee, You-Kyung. 2021. Impacts of Digital Technostress and Digital Technology Self-Efficacy on Fintech Usage Intention of Chinese Gen Z Consumers. Sustainability 13: 5077. [Google Scholar] [CrossRef]
- Liao, Shu-hsien, Yin-ju Chen, and Hsin-hua Hsieh. 2004. Mining customer knowledge for electronic catalog marketing. Expert Systems with Applications 27: 521–32. [Google Scholar] [CrossRef]
- Lillo, Fabrizio, Salvatore Micciche, Michele Tumminello, Jyrki Piilo, and Rosario Mantegna. 2015. How news affects the trading behaviour of different categories of investors in a financial market AU-Lillo, Fabrizio. Quantitative Finance 15: 213–29. [Google Scholar] [CrossRef]
- Lin, Shen, Da Ren, Wei Zhang, Yongjie Zhang, and Dehua Shen. 2016. Network interdependency between social media and stock trading activities: Evidence from China. Physica A: Statistical Mechanics and Its Applications 451: 305–12. [Google Scholar] [CrossRef]
- Lin, Yu-Cheng, Chiung-Yao Huang, and Yu-Shan Wei. 2018. Perfectionist decision-making style and ethical investment willingness: A two-factor causal mediation model. Management Decision 56: 534–49. [Google Scholar] [CrossRef]
- Link, William, and Mitchell Eaton. 2012. On thinning of chains in MCMC. Methods in Ecology and Evolution 3: 112–15. [Google Scholar] [CrossRef]
- Liu, Yi, Wei Wang, and Zuopeng Justin Zhang. 2020. The dual drivetrain model of digital transformation: Role of industrial big-data-based affordance. Management Decision. [Google Scholar] [CrossRef]
- Ma, Shaohui, Lu Hou, Wensong Yao, and Baozhen Lee. 2016. A nonhomogeneous hidden Markov model of response dynamics and mailing optimization in direct marketing. European Journal of Operational Research 253: 514–23. [Google Scholar] [CrossRef]
- Maroufkhani, Parisa, Ralf Wagner, Wan Khairuzzaman Wan Ismail, Mas Bambang Baroto, and Mohammad Nourani. 2019. Big data analytics and firm performance: A systematic review. Information 10: 226. [Google Scholar] [CrossRef] [Green Version]
- Martí-Ballester, Carmen Pilar. 2015. Investor reactions to socially responsible investment. Management Decision 53: 571–604. [Google Scholar] [CrossRef]
- Martin, Roderick, and Tahir Nisar. 2007. Activist investment: Institutional investor monitoring of portfolio companies. Management Decision 45: 827–40. [Google Scholar] [CrossRef]
- Miguéis, Vera, Ana Camanho, and José Borges. 2017. Predicting direct marketing response in banking: Comparison of class imbalance methods. Service Business 11: 831–49. [Google Scholar] [CrossRef]
- Mitik, Merve, Ozan Korkmaz, Pinar Karagoz, Ismail Hakki Toroslu, and Ferhat Yucel. 2017. Data Mining Approach for Direct Marketing of Banking Products with Profit/Cost Analysis. Review of Socionetwork Strategies 11: 17–31. [Google Scholar] [CrossRef]
- Moyo, Busani. 2018. An analysis of competition, efficiency and soundness in the South African banking sector. South African Journal of Economic and Management Sciences 21: 1–14. [Google Scholar] [CrossRef] [Green Version]
- Müller, Peter, and Abel Rodriguez. 2013. Pólya Trees Nonparametric Bayesian Inference. Beachwood: Institute of Mathematical Statistics, Alexandria: American Statistical Association, pp. 43–51. [Google Scholar]
- Müller, Peter, and Fernando Quintana. 2004. Nonparametric Bayesian data analysis. Statistical Science 19: 95–110. [Google Scholar] [CrossRef]
- Müller, Peter, and Riten Mitra. 2013. Bayesian nonparametric inference–why and how. Bayesian Analysis (Online) 8: 269–302. [Google Scholar] [CrossRef] [PubMed]
- Müller, Peter, Fernando Andrés Quintana, Alejandro Jara, and Tim Hanson. 2015. Bayesian Nonparametric Data Analysis. Berlin: Springer. [Google Scholar]
- Müller, Peter, Fernando Quintana, and Gary Rosner. 2004. A method for combining inference across related nonparametric Bayesian models. Journal of the Royal Statistical Society: Series B (Statistical Methodology) 66: 735–49. [Google Scholar] [CrossRef]
- Neal, Radford. 2000. Markov chain sampling methods for Dirichlet process mixture models. Journal of Computational and Graphical Statistics 9: 249–65. [Google Scholar]
- Nikunen, Tuulia, Martti Saarela, Eeva-Liisa Oikarinen, Matti Muhos, and Lari Isohella. 2017. Micro-Enterprise’s Digital Marketing Tools for Building Customer Relationships. Management 12: 2. [Google Scholar]
- Olbryś, Joanna, and Michał Mursztyn. 2018a. Assessing accuracy of trade side classification rules. Methods, data, and problems. In The 12th Professor Aleksander Zelias International Conference on Modelling and Forecasting of Socio-Economic Phenomena. Conference Proceedings. Cracow: Foundation of the Cracow University of Economics. [Google Scholar]
- Olbryś, Joanna, and Michał Mursztyn. 2018b. Evaluating Trade Side Classification Algorithms Using Intraday Data from the Warsaw Stock Exchange. Archives of Data Science, Series A (Online First) 4: 20. [Google Scholar]
- Olson, David, and Bongsug Kevin Chae. 2012. Direct marketing decision support through predictive customer response modeling. Decision Support Systems 54: 443–51. [Google Scholar] [CrossRef]
- Palacios-Marqués, Daniel, José Merigó, and Pedro Soto-Acosta. 2015. Online social networks as an enabler of innovation in organizations. Management Decision 53: 1906–20. [Google Scholar] [CrossRef]
- Palalic, Ramo, Veland Ramadani, Syedda Mariam Gilani, Shqipe Gërguri-Rashiti, and Leo-Paul Dana. 2020. Social media and consumer buying behavior decision: What entrepreneurs should know? Management Decision. [Google Scholar] [CrossRef]
- Parlar, Tuba, and Songül Kakilli Acaravcı. 2017. Using data mining techniques for detecting the important features of the bank direct marketing data. International Journal of Economics and Financial Issues 7: 692–96. [Google Scholar]
- Pauwels, Koen. 2014. It’s Not the Size of the Data—It’s How You Use it: Smarter Marketing with Analytics and Dashboards. New York: Amacom. [Google Scholar]
- Petersen, John Andrew, Tarun Kushwaha, and Vipin Kumar. 2015. Marketing communication strategies and consumer financial decision making: The role of national culture. Journal of Marketing 79: 44–63. [Google Scholar] [CrossRef]
- Ranjan, Jayanthi, and Vishal Bhatnagar. 2011. Role of knowledge management and analytical CRM in business: Data mining based framework. Learning Organization 18: 131–48. [Google Scholar] [CrossRef]
- Rizzo, Anthony. 2018. The Relationship of Direct Mail Data and Time Personalization and Response within the Financial Services Industry. Doctoral dissertation, Grand Canyon University, Phoenix, Arizona. [Google Scholar]
- Rzeszutek, Marcin, Adam Szyszka, and Monika Czerwonka. 2015. Investors’ expertise, personality traits and susceptibility to behavioral biases in the decision making process. Contemporary Economics 9: 237–352. [Google Scholar] [CrossRef] [Green Version]
- Saukkonen, Natalia, Teemu Laine, and Petri Suomala. 2018. Utilizing management accounting information for decision-making: Limitations stemming from the process structure and the actors involved. Qualitative Research in Accounting and Management 15: 181–205. [Google Scholar] [CrossRef]
- Scholz, Sören, and Ralf Wagner. 2005. The quality of prior information structure in business planning-An experiment in environmental scanning. In Operations Research Proceedings 2004. Berlin and Heidelberg: Springer, pp. 238–45. [Google Scholar]
- Schröder, Nadine, and Harald Hruschka. 2012. Response measurement and optimization of direct mailings. Journal für Betriebswirtschaft 62: 261–308. [Google Scholar] [CrossRef]
- Schröder, Nadine, and Harald Hruschka. 2017. Comparing alternatives to account for unobserved heterogeneity in direct marketing models. Decision Support Systems 103: 24–33. [Google Scholar] [CrossRef]
- Schultz, Don E., and James Jimmy Peltier. 2013. Social media’s slippery slope: Challenges, opportunities and future research directions. Journal of Research in Interactive Marketing 7: 86–99. [Google Scholar] [CrossRef]
- Shah, Denish, and BPS. Murthi. 2020. Marketing in a data-driven digital world: Implications for the role and scope of marketing. Journal of Business Research 125: 772–79. [Google Scholar] [CrossRef]
- Sharma, Niharika, Arvinder Kaur, Sheetal Gandotra, and Bhawna Sharma. 2015. Evaluation and comparison of data mining techniques over bank direct marketing. International Journal of Innovative Research in Science, Engineering and Technology 4: 7141–47. [Google Scholar]
- Singh, Shubhangi, Marshal Sahni, and Raj Kovid. 2020. What drives FinTech adoption? A multi-method evaluation using an adapted technology acceptance model. Management Decision 58: 1675–97. [Google Scholar] [CrossRef]
- Smith, Katherine Taken. 2012. Longitudinal study of digital marketing strategies targeting Millennials. Journal of Consumer Marketing 29: 86–92. [Google Scholar] [CrossRef]
- Taiminen, Heini Maarit, and Heikki Karjaluoto. 2015. The usage of digital marketing channels in SMEs. Journal of Small Business and Enterprise Development 22: 633–51. [Google Scholar] [CrossRef]
- Talay, M. Berk, Billur Akdeniz, Michael Obal, and Janell Townsend. 2019. Stock Market Reactions to New Product Launches in International Markets: The Moderating Role of Culture. Journal of International Marketing 27: 81–98. [Google Scholar] [CrossRef]
- Tang, Heng, Stephen Shaoyi Liao, and Sherry Xiaoyun Sun. 2013. A prediction framework based on contextual data to support mobile personalized marketing. Decision Support Systems 56: 234–46. [Google Scholar] [CrossRef]
- Thwaites, Des, and Sharon CI Lee. 1994. Direct marketing in the financial services industry. Journal of Marketing Management 10: 377–90. [Google Scholar] [CrossRef]
- Tiago, Maria Teresa Pinheiro Melo Borges, and José Manuel Cristóvão Veríssimo. 2014. Digital marketing and social media: Why bother? Business Horizons 57: 703–8. [Google Scholar] [CrossRef]
- Tikkanen, Henrikki, Joel Hietanen, Tuomas Henttonen, and Joonas Rokka. 2009. Exploring virtual worlds: Success factors in virtual world marketing. Management Decision 47: 1357–81. [Google Scholar] [CrossRef] [Green Version]
- Tolani, Kanchan, Ruchi Sao, Pritam Bhadade, and Shravan Chandak. 2020. Money and generations: Financial choices made by Gen X and Gen Y. International Journal of Management 11: 657–72. [Google Scholar]
- Trivedi, Naresh Kumar, Suresh Kumar, Sachin Jain, and Shikha Maheshwari. 2020. KFCM-Based Direct Marketing. In Rising Threats in Expert Applications and Solutions. Berlin and Heidelberg: Springer, pp. 495–502. [Google Scholar]
- Vallejos, Alejandro Antonio Jara. 2008. Bayesian Semiparametric Methods for the Analysis of Complex Data. Doctoral dissertation, Tese (Doutorado em Ciências), Faculdade de Ciências, Universidade Católica de Leuven, Leuven, Belgium. [Google Scholar]
- Venkatesan, Rajkumar, V. Kumar, and Timothy Bohling. 2007. Optimal customer relationship management using Bayesian decision theory: An application for customer selection. Journal of Marketing Research 44: 579–94. [Google Scholar] [CrossRef]
- Wansbeek, Tom, and Michel Wedel. 1999. Marketing and econometrics. Journal of Econometrics 89: 1–2. [Google Scholar] [CrossRef]
- Wienke, Andreas. 2010. Frailty Models in Survival Analysis. Amsterdam and Boca Raton: Chapman & Hall/CRC. [Google Scholar]
- Wu, Jiexing, Kate Jiayi Li, and Jun Liu. 2018. Bayesian Inference for Assessing Effects of Email Marketing Campaigns. Journal of Business and Economic Statistics 36: 253–66. [Google Scholar] [CrossRef] [Green Version]
- Yamin, Ahmad Bin. 2017. Impact of Digital Marketing as a Tool of Marketing Communication: A Behavioral Perspective on Consumers of Bangladesh. American Journal of Trade and Policy 4: 117–22. [Google Scholar] [CrossRef]
- Yelkur, Rama, and Maria Manuela Nêveda DaCosta. 2001. Differential pricing and segmentation on the Internet: The case of hotels. Management Decision 39: 252–62. [Google Scholar] [CrossRef]
- Zantedeschi, Daniel, Eleanor McDonnell Feit, and Eric Bradlow. 2016. Measuring multichannel advertising response. Management Science 63: 2706–28. [Google Scholar] [CrossRef]


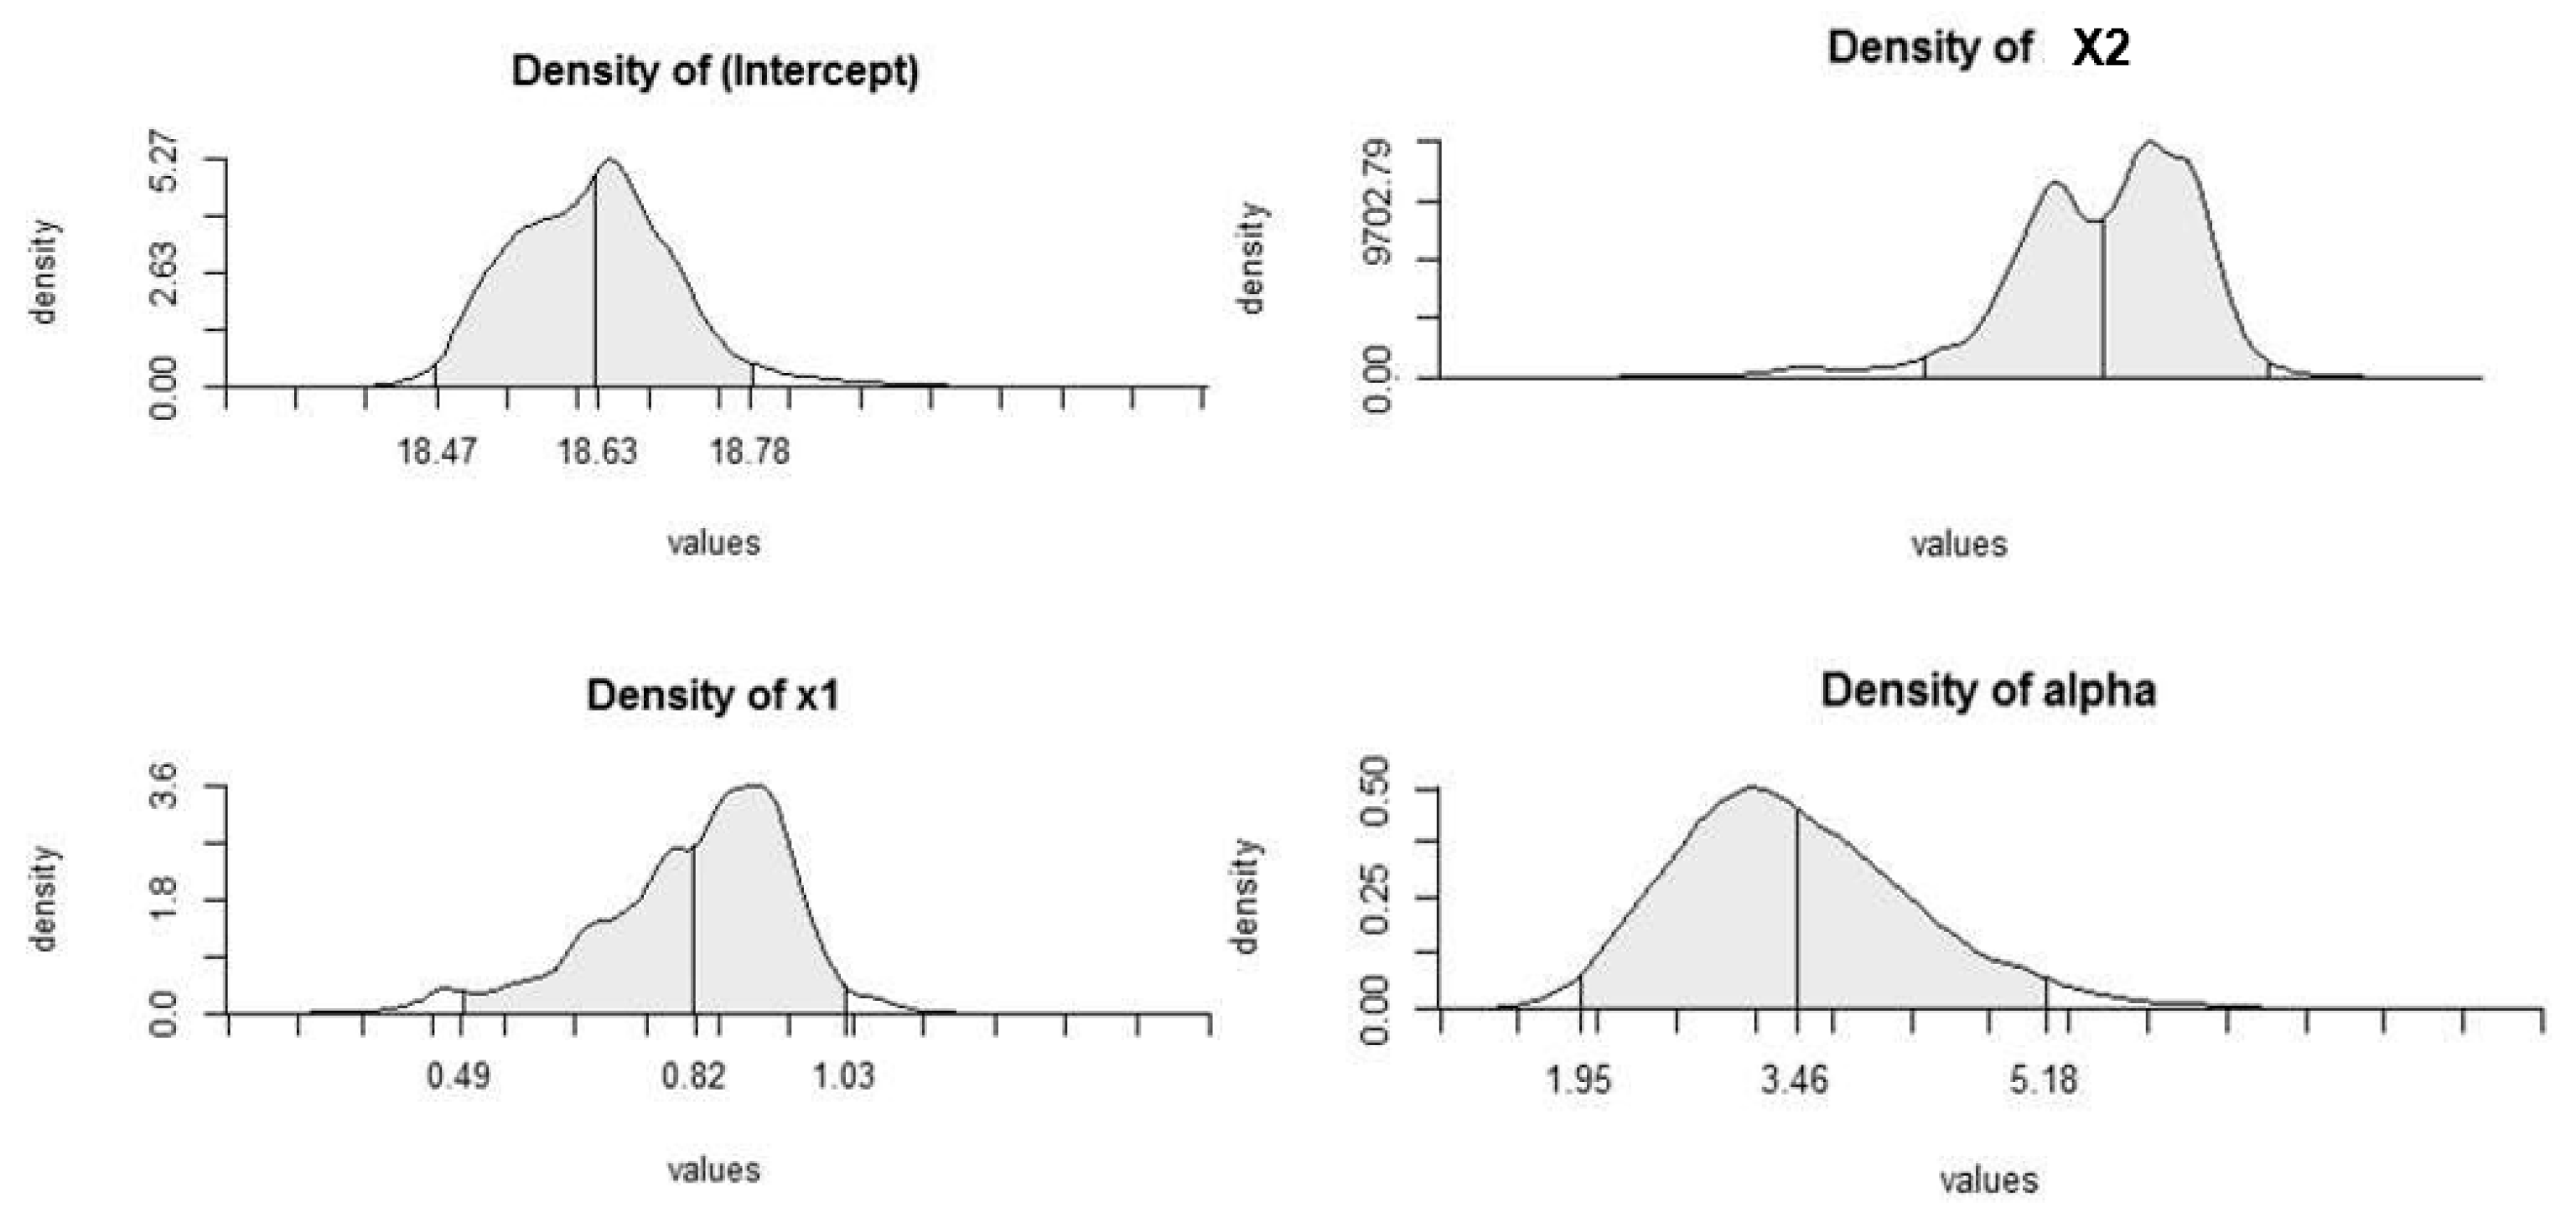
| Mean | Median | Standard Deviation | Naïve Std. Error | 95% HPD-Low | 95% HPD-Upp | |
|---|---|---|---|---|---|---|
(Intercept) | 18.630000 | 18.6300000 | 0.0850100 | 0.0006011 | 18.4700000 | 18.7800000 |
(Newsletter) | 0.8169000 | 0.8423000 | 0.1339000 | 0.0009468 | 0.49310000 | 1.03000000 |
(Investor Lifetime) | 0.0007375 | 0.0007433 | 0.0000362 | 0.0000002 | 0.00066980 | 0.00080010 |
| Precision parameter: | ||||||
| sigma2 | 5.953570 | 5.957104 | 0.321260 | 0.002272 | 0.000000 | 0.000000 |
Publisher’s Note: MDPI stays neutral with regard to jurisdictional claims in published maps and institutional affiliations. |
© 2021 by the authors. Licensee MDPI, Basel, Switzerland. This article is an open access article distributed under the terms and conditions of the Creative Commons Attribution (CC BY) license (https://creativecommons.org/licenses/by/4.0/).
Share and Cite
Samsami, M.; Wagner, R. Investment Decisions with Endogeneity: A Dirichlet Tree Analysis. J. Risk Financial Manag. 2021, 14, 299. https://doi.org/10.3390/jrfm14070299
Samsami M, Wagner R. Investment Decisions with Endogeneity: A Dirichlet Tree Analysis. Journal of Risk and Financial Management. 2021; 14(7):299. https://doi.org/10.3390/jrfm14070299
Chicago/Turabian StyleSamsami, Mahsa, and Ralf Wagner. 2021. "Investment Decisions with Endogeneity: A Dirichlet Tree Analysis" Journal of Risk and Financial Management 14, no. 7: 299. https://doi.org/10.3390/jrfm14070299