1. Introduction
The development of genetically modified (GM) crops has been considered as the most successful application of agricultural biotechnology research to date (
Wu and Butz 2004). The GM technology has been the most rapidly adopted crop technology in recent history because of its sustainable and substantial economic, socioeconomic, and environmental benefits (
James 2016). According to the statistics of the International Service for the Acquisition of Agri-biotech Applications (ISAAA), 190 million hectares (ha) of GM crops were planted amongst 29 countries worldwide in 2019 (
James 2019).
Studying the new technology adoption process from a farmer’s perspective has significant implications for risk and risk management. A better understanding of whether the new technologies offer a critical improvement over the traditional ones can help to overcome low adoption by consumers, support from policymakers, and ultimately improve the attitudes of consumers. Understanding the learning process can also help to design strategies to decrease the variance in the performance of the technology. Thus, policymakers can better understand whether the technology needs certain support through subsidies or technical assistance.
In this study, we tested the TFP growth trend of cotton is different from the other three grains and TC and TEC changes of cotton belongs to the adoption of new technology. We found that there is a learning process in the adoption of Bt technology occurs. we first document the stylized fact that when comparing the total factor productivity (TFP) of cotton to other major crops (wheat, rice, and corn) in China between 1990 and 2015, the TFP growth pattern of cotton production is significantly different from all other crops. In particular, the TFP of cotton production increased rapidly in the early 1990s then declined slightly around 2000 and rose again. This pattern coincides with the adoption of Bt cotton process in China. To further investigate the decline of TFP in the early stages of Bt cotton adoption, using aggregate provincial-level data, we implement a TFP decomposition and show that the productivity of GM technology is higher, whereas the technical efficiency of GM technology is lower than that of traditional technologies. Especially, the lower technical efficiency in Bt cotton is due to the fact that farmers did not reduce the use of pesticides when they first started to adopt Bt cotton, which is albeit an input waste but also a risk management strategy to deal with the uncertainties around the new technology. In addition, this study also demonstrates the occurrence of a learning process as GM technology diffuses throughout China: after farmers gain the knowledge of Bt cotton, pesticide use declines, and technical efficiency improves.
Our contribution to the literature is twofold: first, to our knowledge, this is first paper that documents the decline in technical efficiency after adopting a new technology. Second, this is also the first article that links the learning-by-doing effect to the decline in technical efficiency after adopting a new technology.
The remainder of this paper is organized as follows. In
Section 2, we discuss the national representative data and the sampled major cotton production provinces included in this study. Using these data, in
Section 3 we calculate and compare the total factor productivity (TFP) and technological efficiency. The learning process is discussed in
Section 4. The final section provides a conclusion.
2. Advantages of Bt Technology over Non-Bt Technology
According to the classic theory of technology adoption and diffusion, new technology requires a learning process, since it takes time for new adopters to fully master it (
Evenson and Westphal 1995;
Conley and Udry 2010;
Qiao and Huang 2020). If the new technology is similar to the traditional one, then the learning process is trivial. For example, new seed varieties are introduced every few years in China. However, since the new varieties have no different requirements in terms of production practices from those of traditional varieties, a learning process is not needed.
On the other hand, the main advantage of Bt cotton in China is the reduction of input (i.e., pesticide use). Bt cotton adopters need to spray less pesticide than those who planted traditional varieties (i.e., non-Bt varieties). That is, the production practices of Bt cotton are different from those of non-Bt cotton. Hence, if Bt cotton adopters still follow the traditional way (i.e., the way of planting non-Bt cotton) then, in practice, the technical efficiency of Bt cotton would be below. Hence, we expect that a learning process for Bt technology occurs.
In this section, we want to test our three hypotheses. In order to test Hypothesis 1, we first calculate the TFP of cotton and grain crops. Bt cotton is the only commercialized GM crop in China, while all of the grain crops are non-GM. In other words, the technologies of grain crops are all traditional technologies. Second, we decompose the TFP growth rate to TC, TEC, and residual. Then compare TC and TEC before and after Bt cotton technology is adopted respectively to test Hypotheses 2 and 3.
Hypothesis 1 (H1). The TFP growth trend of cotton is different from the other three grains.
Hypothesis 2 (H2). Compared to before the adoption of Bt cotton technology, the growth of TC pattern is different after the adoption of the new technology.
Hypothesis 3 (H3). Compared to before the adoption of Bt cotton technology, the growth of TEC pattern is different after the adoption of the new technology.
2.1. Empirical Model
To estimate TFP, the trans-log form production function is introduced by
Battese and Coelli (
1995) and has been routinely used in previous studies, such as those by
Jin et al. (
2010),
Darku et al. (
2016), and
Wang et al. (
2016). Following these studies, the trans-log form production function is used in this study.
1 Specifically, the trans-log production function can be written as:
In Equation (1), i is the ith province, while t is the tth year; w and v are error terms. The dependent variable y is output (measured in kg/ha). In this study, we consider the outputs for three grain crops (wheat, rice, and corn) and cotton.
Xit is a vector of traditional input variables. In this study, we consider three important traditional inputs: fertilizer, labor, and pesticide. According to the data, shares of these three inputs in total production cost are 59.18%, 70.22%, 71.72%, and 80.47% for wheat, rice, corn, and cotton, respectively. Hence, we believe adding these three input variables can sufficiently capture the impact of inputs on production. As in previous studies (
Wang and Wong 2012;
Xiao et al. 2012;
Zhou et al. 2015), we add time trend (i.e., year) variable in Equation (1). Specifically, “year” and “year2” capture the non-monotonic impact of technology innovations, while the interaction terms of year and other input variables accommodate Hicks-neutral technological progress. Finally,
province is a vector of provincial dummies. In this study, province dummies are added to consider the impact of those time-invariant geographic factors.
However, due to the well-known co-linearity problems between the explanatory variables, especially the interaction terms, most of the estimated coefficients of the input variables are statistically insignificant, as shown in
Table 1.
2 As the core of this study is to analyze the advantages of Bt technology over non-Bt technology, for simplicity, we focus the remaining discussion on the dynamics of TFP, technical change, and technical efficiency of cotton and grain crops.
2.2. Growth Rate of TFP
As shown in
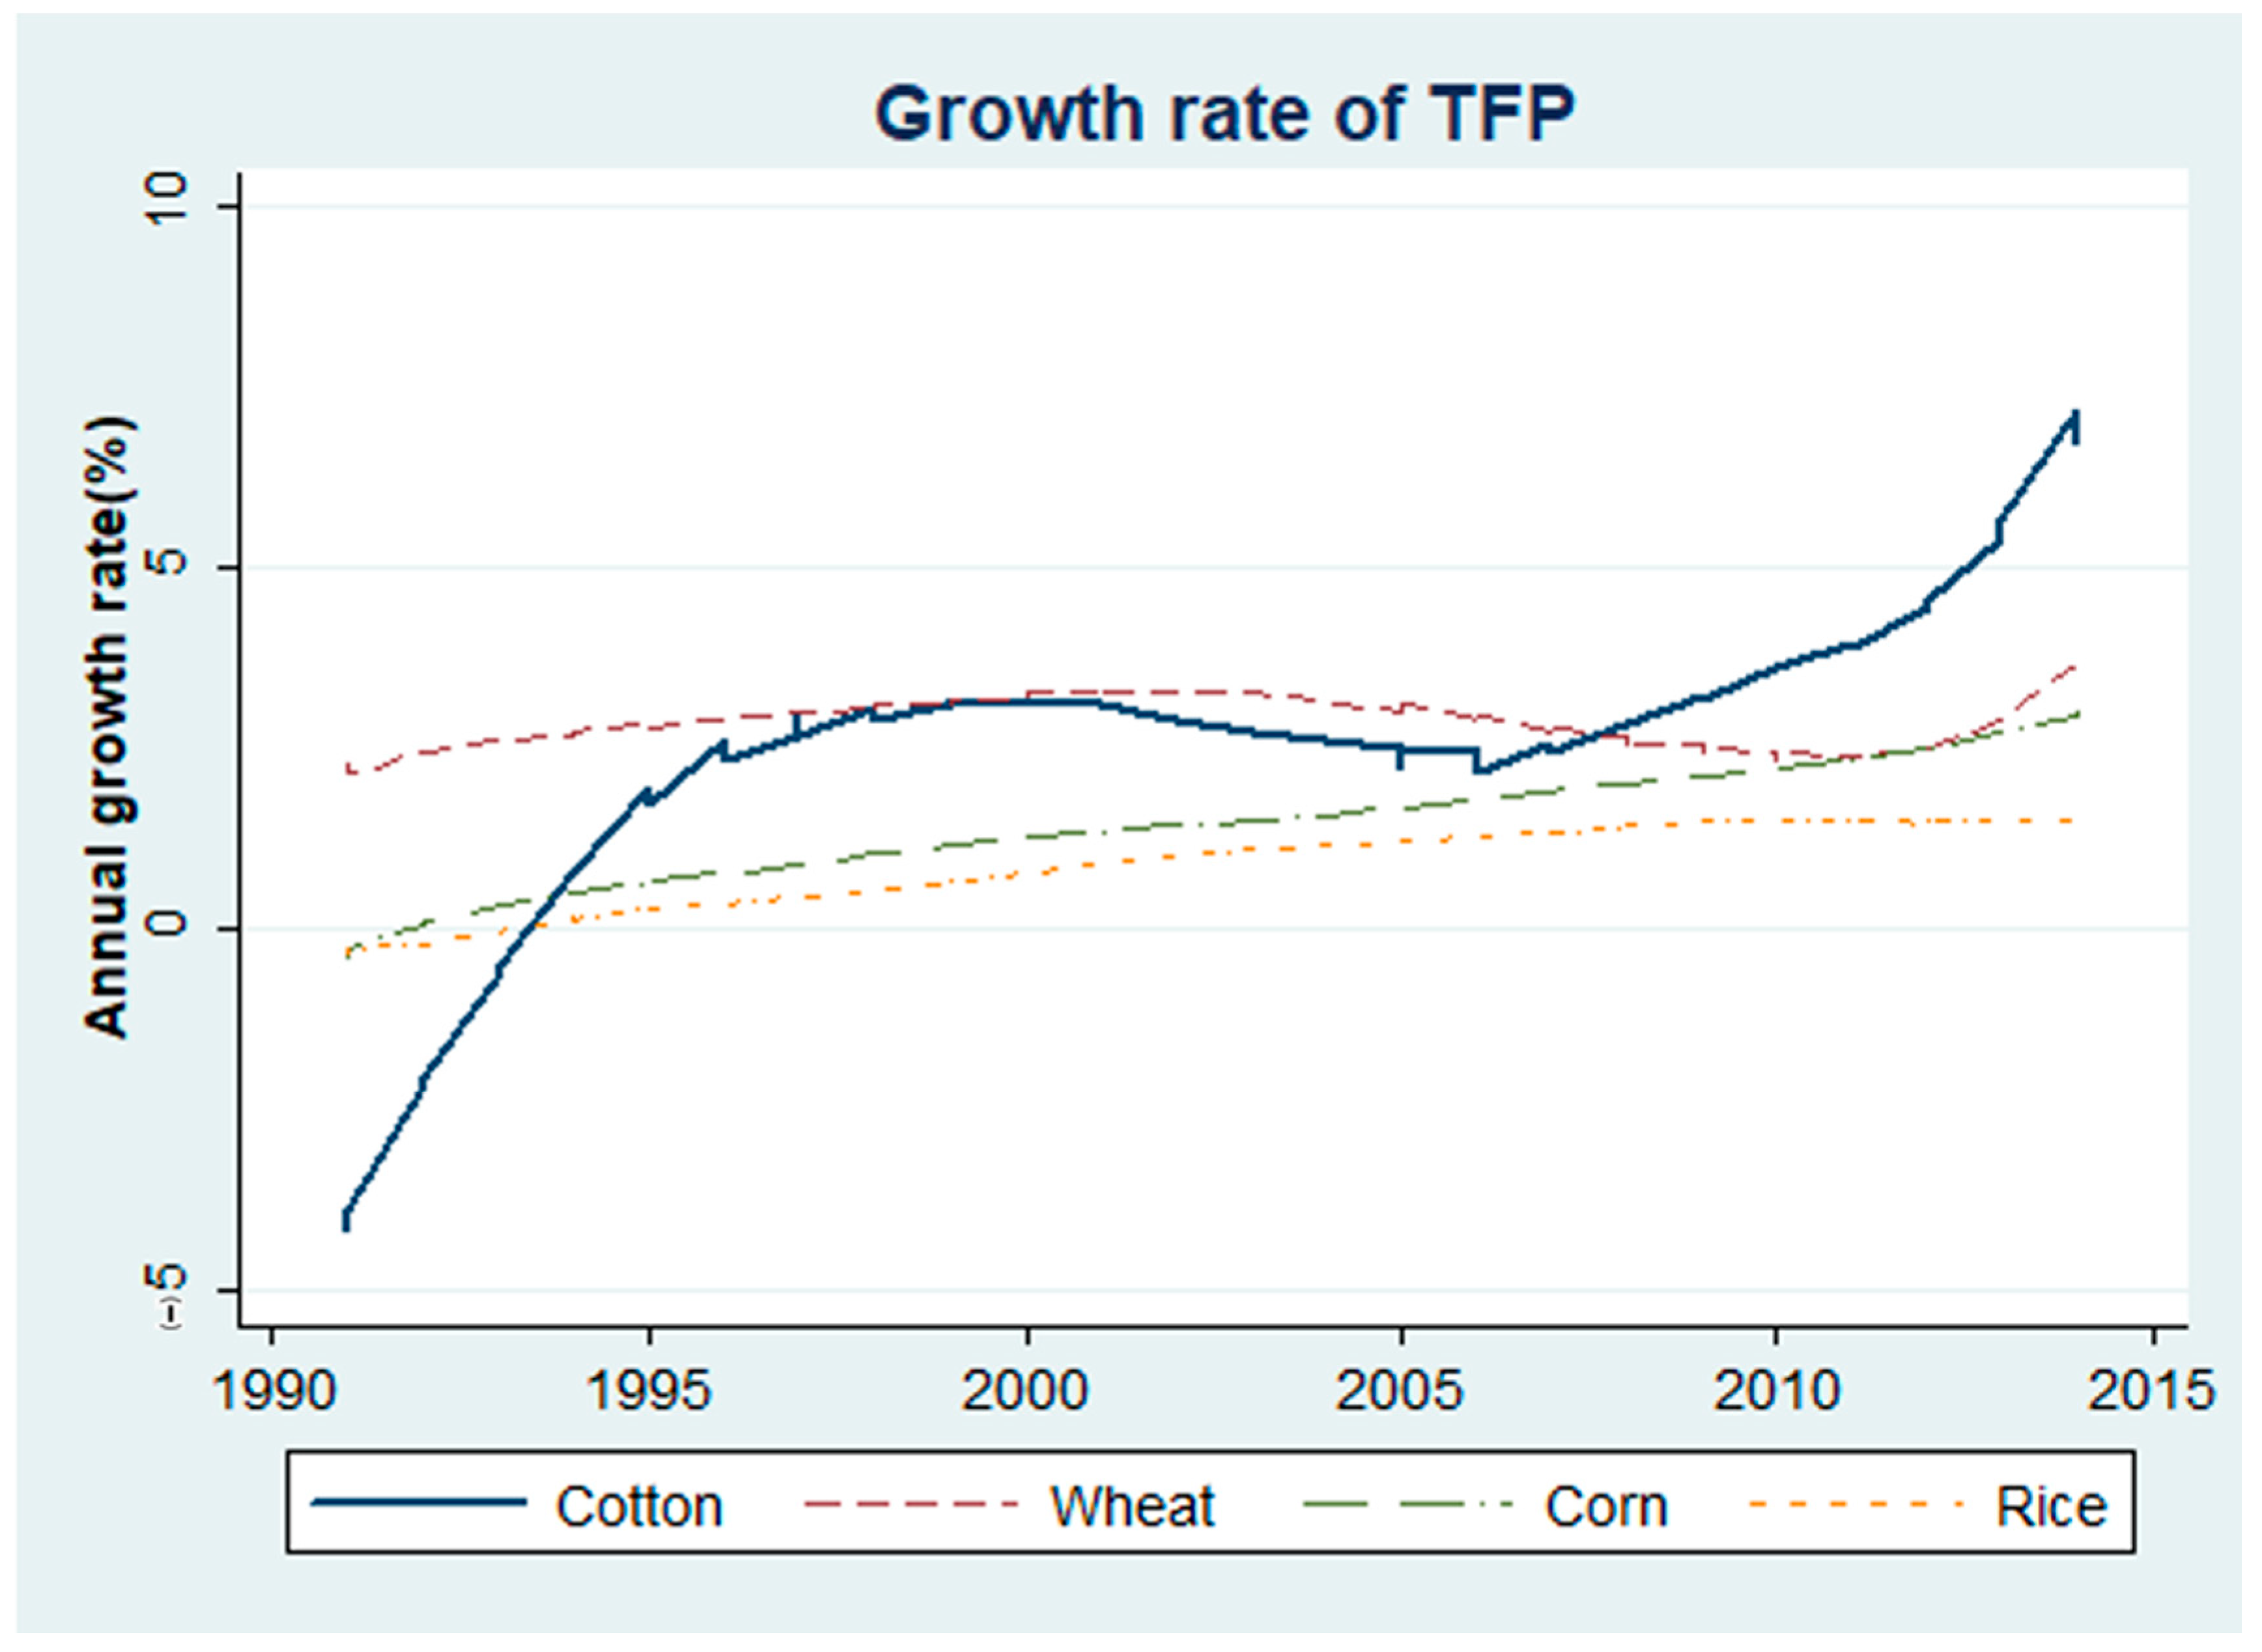
Figure 1, the growth rates of TFP for all of the grain crops (i.e., wheat, rice, and corn) show a very similar and slightly increasing trend over time. In other words, the dynamics of technological innovations and improvements in grain crops seem similar. Further observation shows that the inputs of all of the grain crops have similar monotone (either decrease or increase) trends over time.
On the other hand, the dynamics of TFP growth for cotton show a very different pattern from those for grain crops. As shown in
Figure 1, TFP growth for cotton was negative for the first few years, when the development of the pest resistance caused significant yield loss in the early 1990s (
Huang et al. 2002b). Since then, the growth rate of TFP became positive as farmers have used mixed and/or alternative pesticide methods to control cotton bollworms. In addition, farmers began to plant Bt cotton in 1997. Consequently, TFP growth accelerated since the middle of the 2000s, when Bt cotton dominated.
Importantly,
Figure 1 shows that cotton experienced different TFP growth from grain crops. Although the TFP growth for cotton and for grain crops increased over time, with a similar overall growth rate, the dynamics of TFP growth for cotton were significantly different from that for grain crops. In other words,
Figure 1 seems to show that the technological progress for cotton is different from that for grain crops.
2.3. Technical Changes before and after Bt Technology Adoption
To understand the source of the differences between the TFP growth for cotton and for grain crops, we then decompose the growth rate of TFP into different parts. Specifically, following
Kumbhakar and Lovell (
2000), we decompose the growth rate of TFP into three parts: technology change (TC), technical efficiency change (TEC), and residual.
In Equation (2), the first term, i.e., TC, measures the change in frontier output. That is, a positive TC means the technical change shifts the production frontier upward for a given level of inputs. In other words, fast technological innovations or improvements are associated with a high TC, and vice versa. Equation (3) shows how the technology change is estimated.
The second term of Equation (2), i.e., TEC, is the growth rate of the technical efficiency. This term can be interpreted as the rate at which an inefficient adopter catches up to the production frontier. A high TEC means that the full advantage of new technology is achieved at a fast speed, and vice versa. Equation (4) shows how technical efficiency change is estimated.
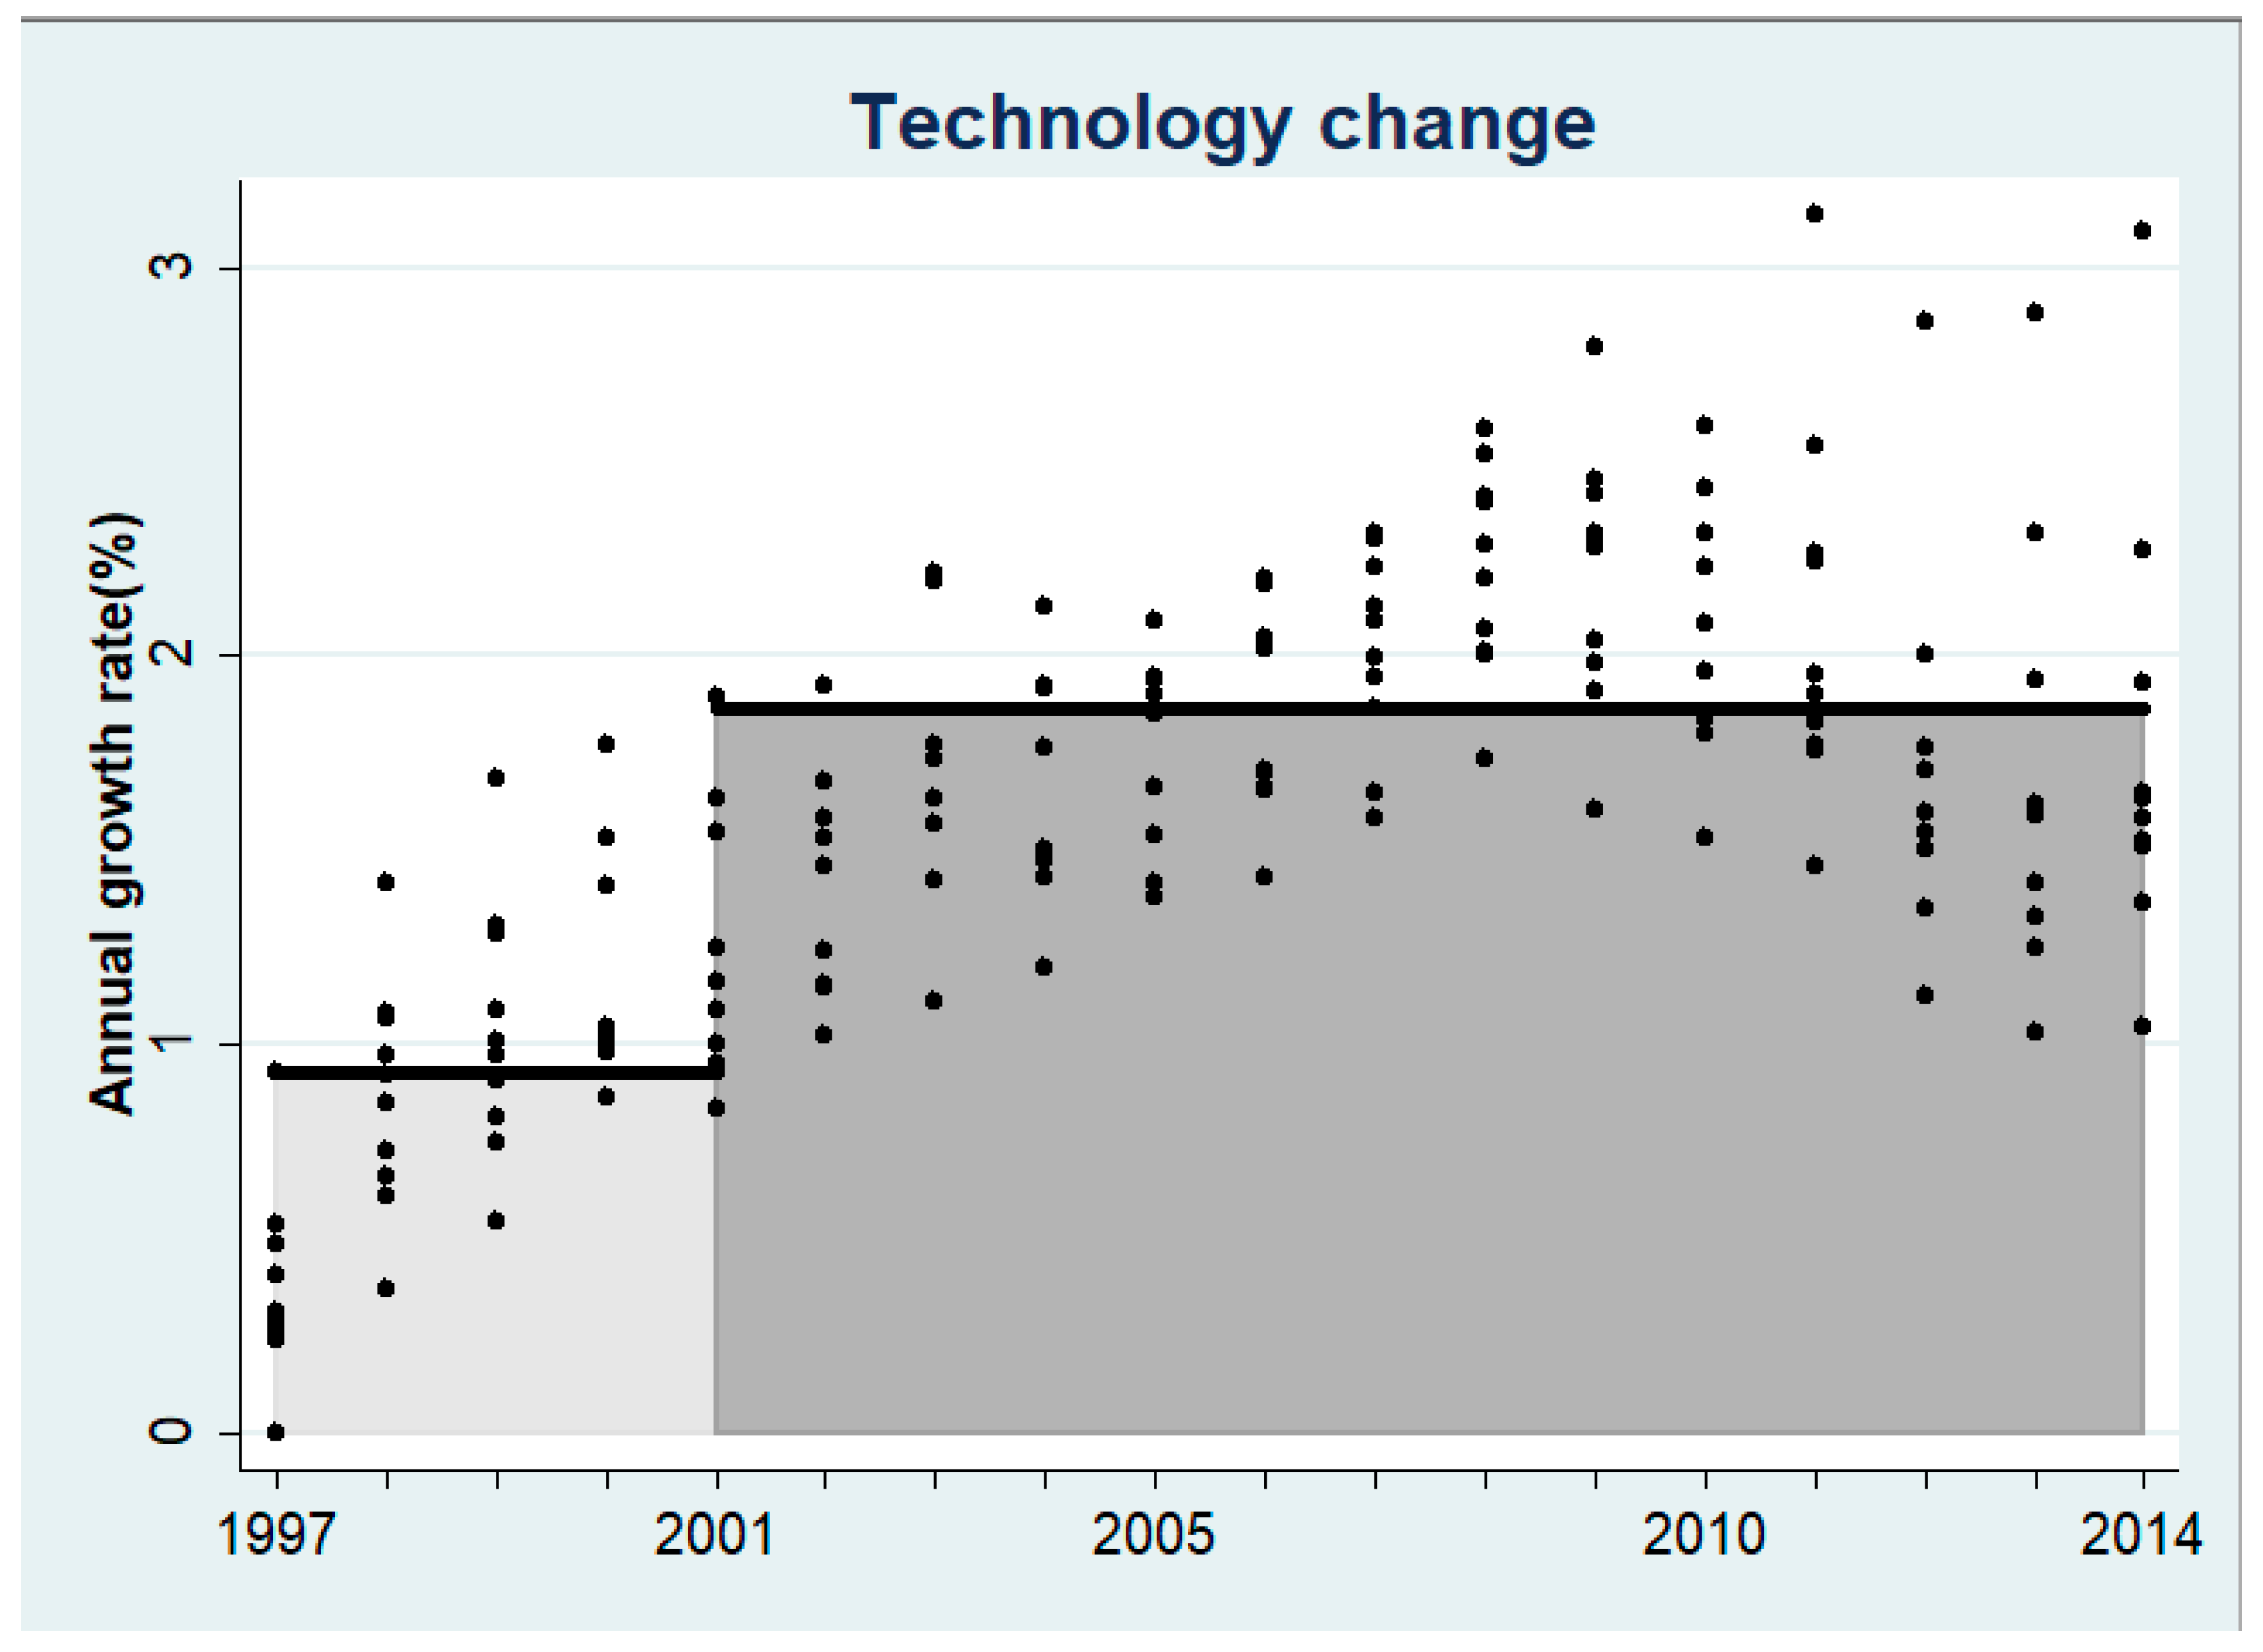
In the following, we will first check the dynamics of the TC of Bt technology. By doing so, we will show whether the spread of Bt technology is associated with increasing TC values. That is, we want to test whether Bt technology adoption leads to significant technological progress. Calculation of the TC for each province over time is shown in
Figure 2.
To compare the TC before and after Bt cotton adoption, we further divide the whole observation into two time periods: 1997–2001 and 2002–2014. As discussed above, Bt cotton was introduced in 1997, although the share of Bt cotton was less than 50% before 2002. Hence, the first time period, 1997–2001, shows the TC when traditional technology (non-Bt technology hereafter) was dominant. On the other hand, the share of Bt cotton is greater than 50% since 2002 and is consistently high (more than 80%) after that. In other words, Bt cotton is dominant in the second time period. Hence, the second period, 2002–2014, shows the TC of the new technology (Bt technology hereafter).
Figure 2 shows that the TC of the second time period (i.e., Bt technology) is higher than that of the first time period (i.e., non-Bt technology). In other words, the growth of technology accelerated from the first time period to the second time period. Further calculation shows that the average technical change is 0.93% for non-Bt technology, while it is 1.87% for Bt technology. In other words, the technical change increased 101.8% from the non-Bt technology period to the Bt technology period. Hence,
Figure 2 provides solid evidence that the new technology (i.e., Bt technology) has higher productivity than that of the traditional technology.
From our empirical results, we found that all of our three hypotheses are true. The TFP growth trend of cotton is different from the other three grains. We observed that the TFP growth pattern of cotton is increasing in the beginning, slightly decreasing, and then increasing again. While the TFP growth rates of the other three grains are very stable. Compared to before the adoption of Bt cotton technology, the growth of TC and TEC patterns are different after the adoption of the new technology. We observed that after the adoption of Bt technology, the average TC increased almost 100% than before. At the same time, the average TEC decreased. While we did not find similar changes on grain crops.
3. Data
Data were obtained from the All China Data Compilation of the Costs and Returns of Main Agricultural Products (Quanguo Nongchanpin Chengben Shouyi Ziliao Huibian—in Chinese Pinyin) and the China Statistical Yearbook (Zhongguo Tongji Nianjian—in Chinese Pinyin). Specifically, the data regarding expenditures on pesticides, labor use, and fertilizer use, as well as yields of cotton and grain crops (wheat, rice, and corn), were obtained from the All China Data Compilation of the Costs and Returns of Main Agricultural Products (National Development and Reform Commission, various years).
3 The data on national total sown areas of cotton and grain crops and price indexes were obtained from the China Statistical Yearbook (National Bureau of Statistics of China (NBSC), various years. Finally, due to a lack of national statistics, the percentages of Bt cotton in different provinces were mainly obtained from the Center for Chinese Agricultural Policy (CCAP), Chinese Academy of Sciences.
4In this study, ten major cotton production provinces were selected. China has three major cotton-producing regions: the Yellow River valley, the Yangtze River valley, and the Northwest (
Hsu and Gale 2001). Xinjiang Uygur Autonomous Region, in the Northwest region, China’s largest cotton production province, is included in this study. In addition, five provinces from the Yellow River valley—Shandong, Hebei, Henan, Shaanxi, and Shanxi; and four provinces from the Yangtze River valley—Hubei, Anhui, Jiangsu, and Jiangxi, are included in the study. These nine provinces are also the second to fourteenth largest cotton-producing provinces in China (
NBSC [2008] 2013).
5 The total cotton sown area of these ten provinces included in this study is 4.06 million ha, which is 93.46% of the national total sown area. The variables used in this study are summarized in
Table 2.
Table 2 shows the average yield and three main inputs (pesticide, fertilizer, and labor) usages of cotton and three grain crops in China from 1990 to 2015. We can observe two facts from
Table 1: (1) All the three inputs of cotton are higher than the other three crops, and (2). cotton production, especially, is a labor and pesticide intensity process
4. Dynamics of Technical Efficiency and the Learning Process
4.1. Technical Efficiency of Bt and Non-Bt Technologies
We check whether a learning process occurs in two steps. First, we compare the TE of non-Bt technology with that of Bt technology. As non-Bt cotton has been planted for decades, farmers know the non-Bt technology well. On the other hand, Bt technology is a new technology and farmers did not plant Bt cotton until 1997. Hence, we expect that the TE of non-Bt technology is higher than that of Bt technology. Second, we then compare the optimal level (in terms of maximizing output) and the actual level of pesticide use since Bt cotton was commercialized. By doing so, we should be able to tell whether a learning process has occurred.
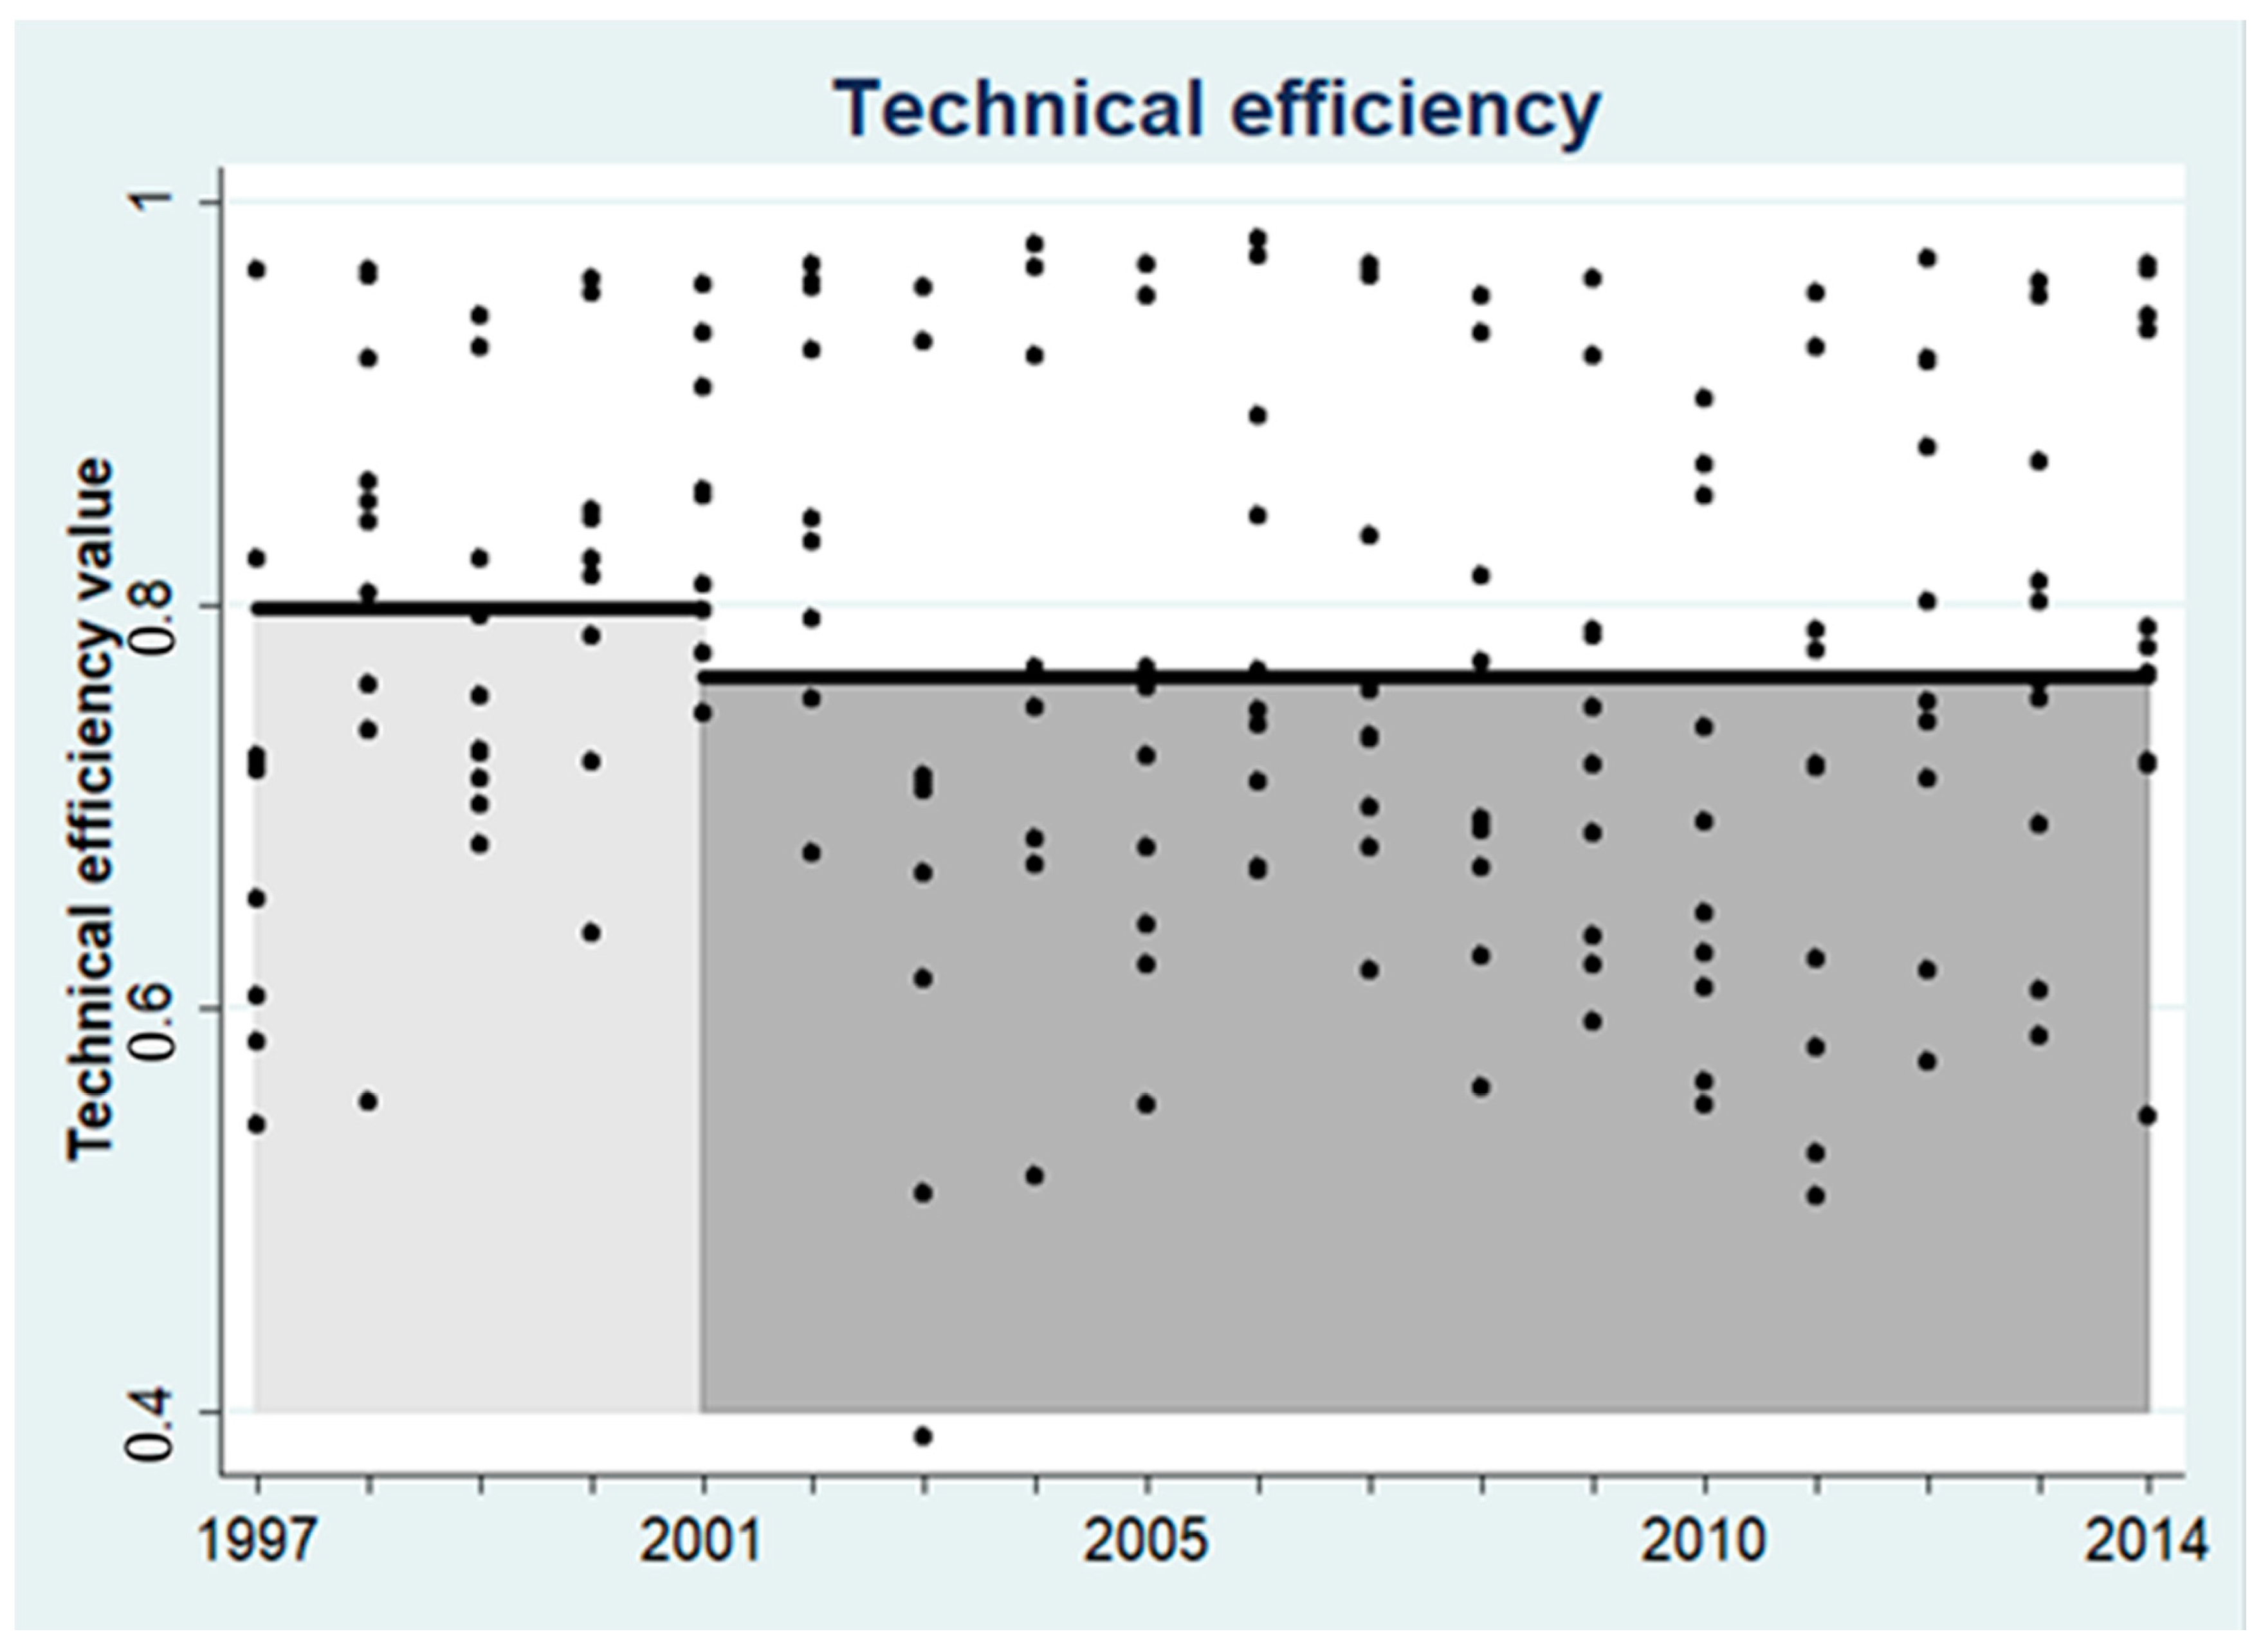
The values of TE before and after Bt technology adoption are shown in
Figure 3. Even though it is difficult to be certain from the scatter plot, it seems that the TE shows a decreasing trend over time.
Figure 3 appears to show that the TE of non-Bt cotton is higher than that of Bt. To further show the difference, we then calculated the average values of the TE of non-Bt technology (i.e., 1997–2001), and the TE of Bt technology (i.e., 2002–2014). As shown in
Figure 4 (bars), the average value of TE for 1997–2001 is higher than that for 2002–2014.
This result is as expected. As discussed earlier, non-Bt cotton is a traditional technology. There is no need for adopters to learn how to plant the new varieties. As farmers know the technology well, a high TE is expected. On the other hand, Bt technology requires different production practices. Hence, if adopters planted Bt cotton and followed the same planting methods as for traditional non-Bt cotton, a low efficiency would be expected.
4.2. A Learning Process for Bt Technology
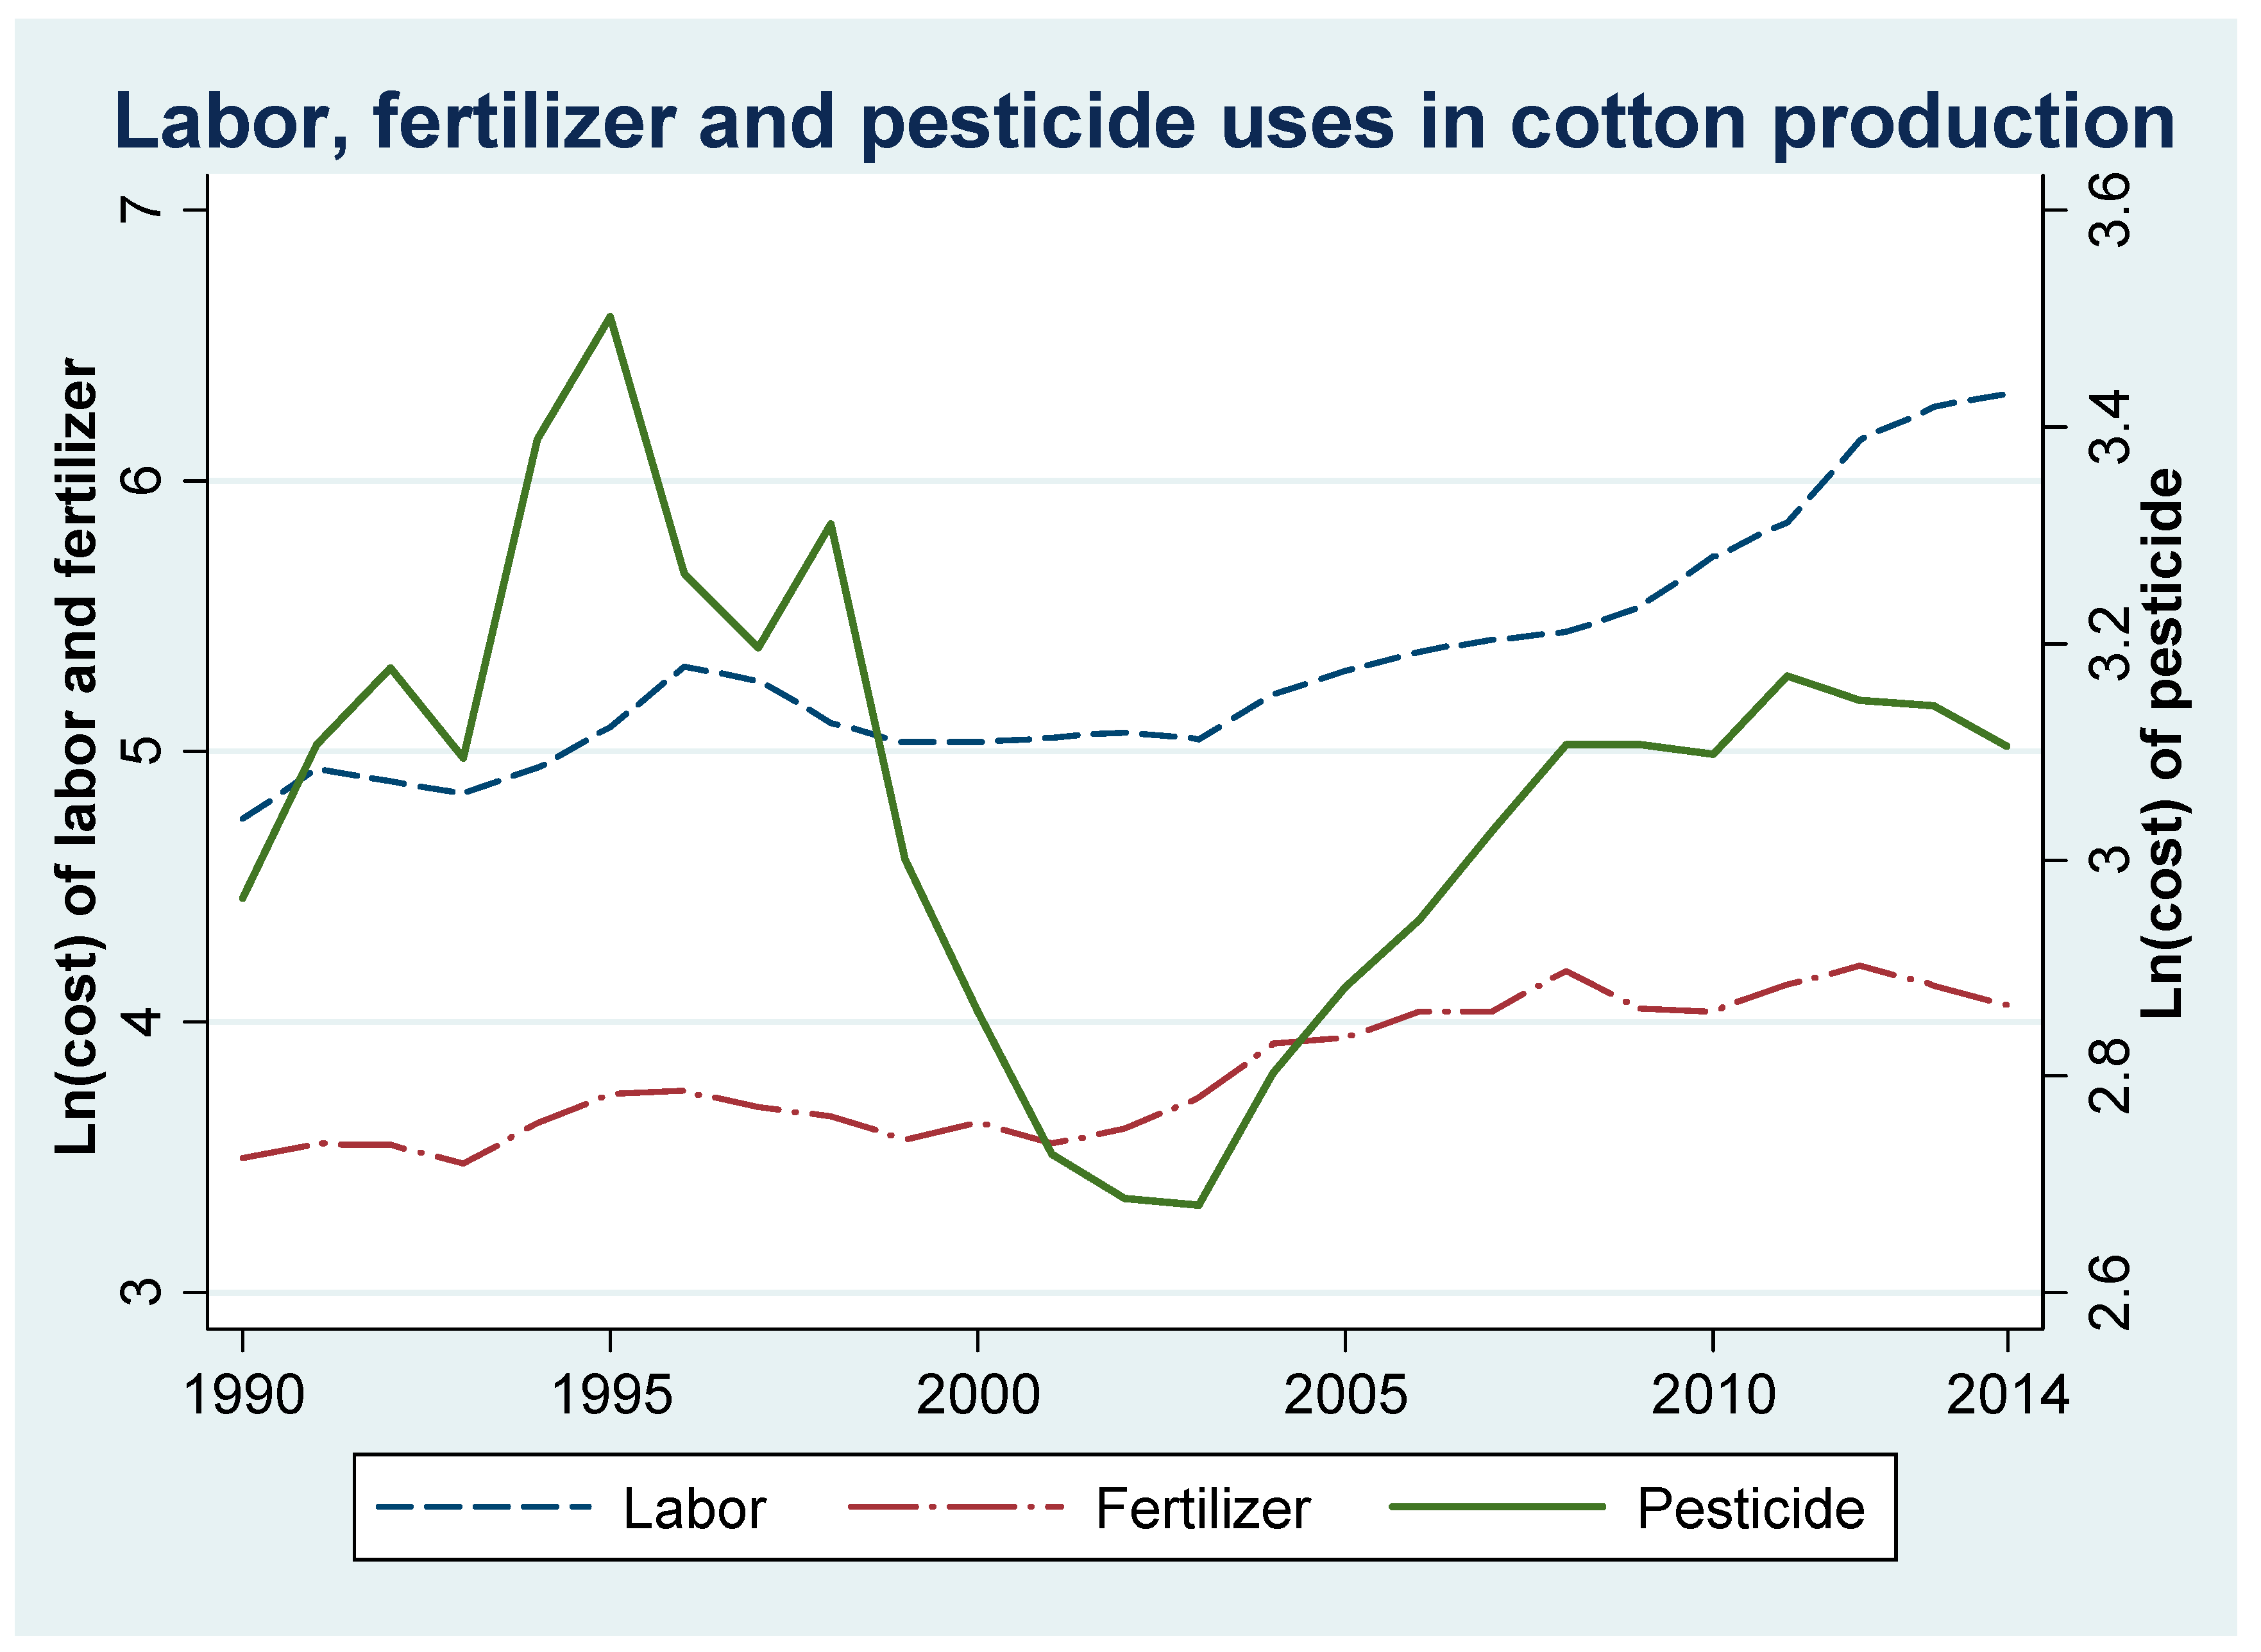
In order to uncover the source of the differences between the TFP and TC for cotton and for grain crops, we then show the dynamic of the different inputs. As shown in
Figure 5, both fertilizer cost and labor cost show monotone and smooth increases over time. On the other hand, pesticide use shows a significant decrease after 1997 when the use of Bt technology spread rapidly and widely. In addition, after 2002, when Bt cotton dominated, pesticide use remained constant or slightly increased over time. Hence, it seems that the non-monotone dynamics of the TFP and TC for cotton are associated with the non-monotone dynamics of pesticide use.
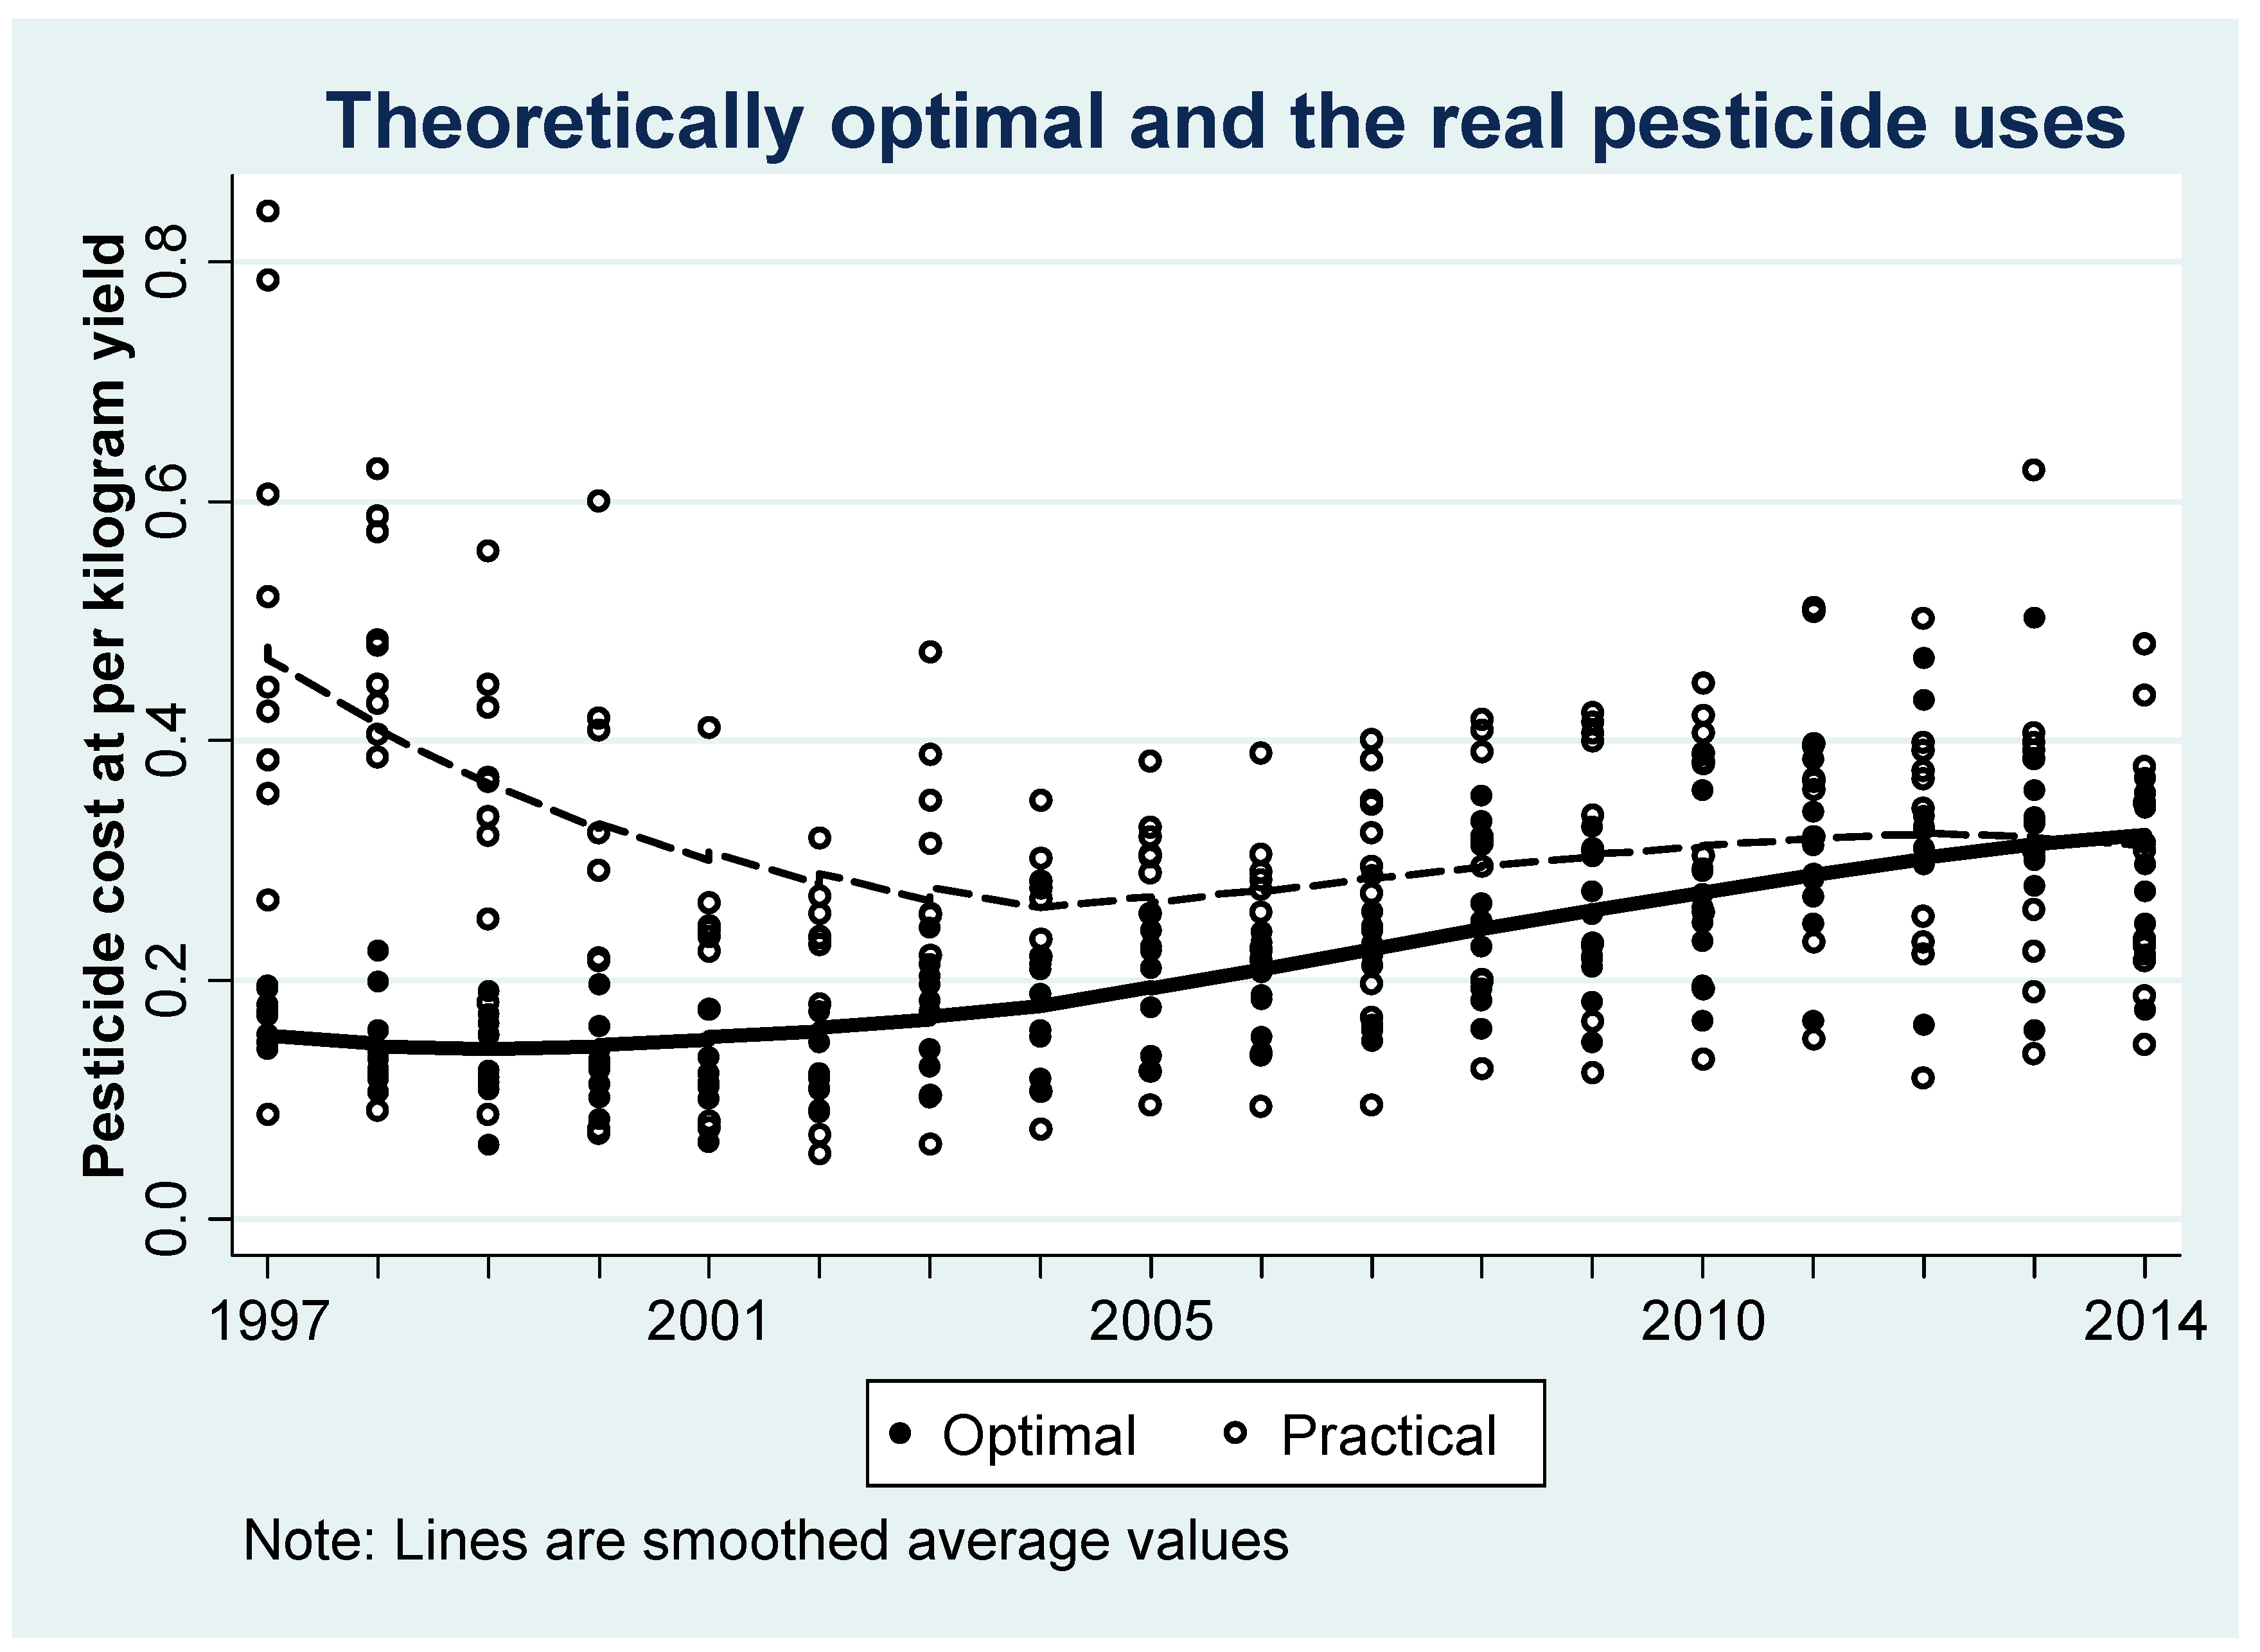
As the main advantage of the new technology (i.e., Bt technology) is reduced pesticide use, in the following section we will check whether a learning process exists by showing the dynamics of pesticide use after the introduction of Bt cotton. Specifically, we show both the theoretical optimal level of pesticide use and the level that farmers spray in practice. We then use the difference between these two levels as an index for technical efficiency. A high difference means a low technical efficiency, while a low difference means high technical efficiency. In addition, if a decreasing differences trend (i.e., an increasing TE trend) is shown after Bt cotton was commercialized, we can conclude that a learning process occurs.
As shown in
Figure 5, the difference between the optimal level of pesticide use and the real level of pesticide use decreased sharply during the 1997–2001 period, as Bt cotton use spread rapidly in China. On the other hand, as the share of Bt was more than 50% in 2002, the dynamics of the different show a constant trend. In other words,
Figure 5 seems to show that over time the amount of pesticide that farmers sprayed became closer to the economically optimal level of pesticide use. That is, the economic loss became smaller over time, while the TE became larger.
The results shown in
Figure 5 are consistent with our expectations. When Bt cotton was first introduced, farmers might not have been entirely knowledgeable of or have wished to follow the special requirements of the new technology (i.e., less pesticide use in agricultural production). Previous studies showed that farmers still overused pesticides for the first few years after Bt cotton was introduced (
Liu and Huang 2013). However, with the spread of Bt cotton use, farmers learned from their own experiences, as well as those of their neighbors and others (
Umetsu et al. 2003;
Genius et al. 2014;
Barham et al. 2015;
Atkin et al. 2017;
Gordon et al. 2021). Consequently, they gradually reduced the amount of pesticide used, which made the actual pesticide use closer to the optimal pesticide use. As a result, the TE increased over time. The dynamics of the actual pesticide use and optimal pesticide use, as shown in
Figure 5, show a clear and interesting learning process for Bt technology.
5. Conclusions and Implications
In this study, we empirically show that GM technology is a better technology than the traditional one as the TFP of GM crops is higher. Interestingly, we also show that there is a learning process for this new technology.
The results of this study have important implications in practice. Although the worldwide benefits and sustainability of GM crops have been well documented, negative attitudes towards the new technology have seemed to dominate in the public and in the media in recent years (
Kathage and Qaim 2012;
Qiao 2015;
Yu et al. 2020;
Min et al. 2021). For this reason, at least in part, the Chinese Government has stalled the commercialization of other GM crops, even though many of them (for example GM corn and rice) are ready for agricultural production (
Yu et al. 2020). In this way, delays in commercialization lead to significant economic losses (
Xie et al. 2017;
Jin et al. 2019). Undoubtedly, the empirical results of this study might contribute to a wider public debate in China, as well as in other countries, and therefore the development of GM technology worldwide.
The adoption and learning process have implications for risk management. The TFP of cotton production in China coincides with the adoption of the Bt cotton process. At first, farmers did not reduce the use of pesticide because of the uncertainties related to the new technology and established practices. Because farmers did not reduce the use of pesticide, Bt cotton exhibited lower technical efficiency. It was only after farmers gained knowledge of Bt cotton, that pesticide use declined, and technical efficiency improved. The learning process thus, affects risk through adoption, the implementation of the new technology and potential setbacks, and implications on diversification of production practices. Future studies could also link technology adoption decisions to supply chain flexibility and resilience (
Du et al. 2016;
Lu and Winfree 2021;
Lu et al. 2021), transition from traditional retail to e-commerce (
Reardon et al. 2021a,
2021b).
Author Contributions
Conceptualization, G.T. and F.Q.; methodology, G.T. and F.Q.; software, G.T.; validation, X.D., A.T.-B. and F.Q.; formal analysis, G.T.; investigation, X.D., G.T., A.T.-B. and F.Q.; resources, X.D. and F.Q.; data curation, G.T. and F.Q.; writing—original draft preparation, X.D., G.T., A.T.-B. and F.Q.; writing—review and editing, X.D., G.T., A.T.-B. and F.Q.; visualization, G.T.; supervision, X.D. and F.Q.; project administration, X.D. and F.Q.; funding acquisition, X.D. and F.Q. All authors have read and agreed to the published version of the manuscript.
Funding
Qiao would like to thank National Natural Sciences Foundation of China for funding, grant number 71773150. Du would like to thank United States Department of Agriculture National Institute of Food and Agriculture for funding, grant number 2019-38504-29891. Both Du and Trujillo-Barrera thank Idaho Agricultural Experiment Station Hatch grant for funding.
Institutional Review Board Statement
Not applicable.
Informed Consent Statement
Not applicable.
Conflicts of Interest
The authors declare no conflict of interest.
Note
| 1 | Another reason that we use trans-log production function, rather than Cobb–Douglas production function, is that the technology neutral hypothesis is tested and rejected in this study. |
| 2 | Following the methods of Battese and Coelli ( 1995), we deleted some interaction terms and re-estimated Equation (2) and obtained very similar TFP and technical efficiency to those when all interaction terms are included. In addition, different interaction terms are dropped for different crops functions. |
| 3 | Since 1953, the National Development and Reform Commission began to conduct household surveys to understand the costs and returns for each of the major crops. For cotton, the sample counties were selected based on sown area and production in all major cotton production provinces, while households were randomly selected in sample counties. The households were revisited in the following years unless they were not representative (for example some farmers abandoned cotton production). According to the 1999–2003 year data (no sample information is released after 2003), the average sample size is more than 1500. |
| 4 | To be more specific, the percentages of Bt cotton for most of the provinces of the Yellow River and the Yangtze River valleys are obtained from the CCAP data. However, the percentages of Bt cotton for Xinjiang and Gansu provinces are obtained from the author’s calculation based on Li et al. ( 2013). |
| 5 | Due to lack of data on the share of Bt ratio, Hunan, Gansu, and Tianjin provinces are excluded from this study. |
References
- Atkin, David, Azam Chaudhry, Shamyla Chaudry, Amit K. Khandelwal, and Eric Verhoogen. 2017. Organizational barriers to technology adoption: Evidence from soccer-ball producers in Pakistan. The Quarterly Journal of Economics 132: 1101–4. [Google Scholar] [CrossRef] [Green Version]
- Barham, Bradford L., Jean-Paul Chavas, Dylan Fitz, Vanessa Ríos-Salas, and Laura Schechter. 2015. Risk, learning, and technology adoption. Agricultural Economics 46: 11–24. [Google Scholar] [CrossRef]
- Battese, George Edward, and Tim J. Coelli. 1995. A model for technical inefficiency effects in a stochastic frontier production function for panel data. Empirical Economics 20: 325–32. [Google Scholar] [CrossRef] [Green Version]
- Brookes, Graham, and Peter Barfoot. 2005. GM Crops: The global economic and environmental impact—The first nine years 1996–2004. AgBio Forum 8: 187–96. [Google Scholar]
- Chavas, Jean-Paul, and Céline Nauges. 2020. Uncertainty, learning, and technology adoption in agriculture. Applied Economic Perspectives & Policy 42: 42–53. [Google Scholar]
- Conley, Timothy G., and Christopher R. Udry. 2010. Learning about a new technology: Pineapple in Ghana. American Economic Review 100: 35–69. [Google Scholar] [CrossRef] [Green Version]
- Darku, Alexander Bilson, Stavroula Malla, and Kien C. Tran. 2016. Sources and measurement of agricultural productivity and efficiency in Canadian provinces: Crops and Livestock. Canadian Journal of Agricultural Economics 64: 49–70. [Google Scholar] [CrossRef] [Green Version]
- Du, Xiaoxue, Liang Lu, Thomas Reardon, and David Zilberman. 2016. Economics of agricultural supply chain design: A portfolio selection approach. American Journal of Agricultural Economics 98: 1377–88. [Google Scholar] [CrossRef]
- Evenson, Robert E., and Larry E. Westphal. 1995. Technological change and technology strategy. In Handbook of Development Economics. Edited by Jere R. Behrman and Srinivasan Thirukodikaval Nilakanta Srinivasan. Amsterdam: North Holland Publishing Co., vol. 3A, pp. 2209–300. [Google Scholar]
- Genius, Margarita, Phoebe Koundouri, Céline Nauges, and Vangelis Tzouvelekas. 2014. Information transmission in irrigation technology adoption and diffusion: Social learning, extension services, and spatial effects. American Journal of Agricultural Economics 96: 328–44. [Google Scholar] [CrossRef] [Green Version]
- Gordon, Sidartha, Emeric Henry, and Pauli Murto. 2021. Waiting for my neighbors. The RAND Journal of Economics 52: 251–82. [Google Scholar] [CrossRef]
- Hatzenbuehler, Patrick L., Xiaoxue Du, and Kathleen Painter. 2021. Price transmission with sparse market information: The case of United States chickpeas. Agribusiness 37: 665–82. [Google Scholar] [CrossRef]
- Hossain, Ferdaus, Carl E. Pray, Yanmei Lu, Jikun Huang, Cunhui Fan, and Ruifa Hu. 2004. Genetically modified cotton and farmers’ health in China. International Journal of Occupational and Environmental Health 10: 296–303. [Google Scholar] [CrossRef] [PubMed]
- Hsu, Hsin-Hui, and Fred Gale. 2001. Regional shifts in China’s cotton production and use. In Cotton and Wool Situation and Outlook. Washington, DC: Economic Research Service of the United States Department of Agriculture. [Google Scholar]
- Huang, Jikun, Ruifa Hu, Carl Pray, Fangbin Qiao, and Scott Rozelle. 2003. Biotechnology as anlternative to chemical pesticides: A case study of Bt cotton in China. Agriculture Economics 29: 55–67. [Google Scholar] [CrossRef]
- Huang, Jikun, Ruifa Hu, Scott Rozelle, Fangbin Qiao, and Carl E. Pray. 2002a. Transgenic varieties and productivity of smallholder cotton farmers in China. The Australian Journal of Agricultural and Resource Economics 46: 367–87. [Google Scholar] [CrossRef] [Green Version]
- Huang, Jikun, Carl Pray, and Scott Rozelle. 2002b. Enhancing the crops to feed the poor. Nature 418: 678–84. [Google Scholar] [CrossRef]
- James, C. 2016. Global Status of Commercialized Biotech/GM Crops: 2016. Issue Brief No. 51. Ithaca: International Service for the Acquisition of Agri-biotech Applications. [Google Scholar]
- James, C. 2019. Global Status of Commercialized Biotech/GM Crops: 2019. Issue Brief No. 55. Ithaca: International Service for the Acquisition of Agri-biotech Applications. [Google Scholar]
- Jin, Songqing, Hengyun Ma, Jikun Huang, Ruifa Hu, and Scott Rozelle. 2010. Productivity, efficiency and technical change: Measuring the performance of China’s transforming agriculture. Journal of Productivity Analysis 33: 191–207. [Google Scholar] [CrossRef]
- Jin, Yan, Dusan Drabik, Nico Heerink, and Justus Wesseler. 2019. The cost of postponement of Bt rice commercialization in China. Frontiers in Plant Science 10: 1226. [Google Scholar] [CrossRef]
- Kathage, Jonas, and Matin Qaim. 2012. Economic impacts and impact dynamics of Bt (Bacillus thuringiensis) cotton in India. Proceedings of the National Academy of Sciences of the United States of America 109: 11652–56. [Google Scholar] [CrossRef] [PubMed] [Green Version]
- Kumbhakar, S., and K. Lovell. 2000. Stochastic Frontier Analysis. Cambridge: Cambridge University Press. [Google Scholar]
- Li, X., Z. Gong, J. Wang, J. Zheng, X. Ai, Y. Liang, X. Tu, L. Duo, M. Mo, and J. Guo. 2013. Current situation and policy suggestions for Bt cotton in Xinjiang. Paper presented at Annual Meeting of China Cotton Association, Changsha, China, August 8–9. [Google Scholar]
- Liu, Elaine M., and JiKun Huang. 2013. Risk preferences and pesticide use by cotton farmers in China. Journal of Development Economics 103: 202–15. [Google Scholar] [CrossRef] [Green Version]
- Lu, Liang, and Jason Winfree. 2021. Demand Shocks and Supply Chain Flexibility. In NBER Conference “Risks in Agricultural Supply Chains”. Berlin/Heidelberg: Springer. [Google Scholar]
- Lu, Liang, Ruby Nguyen, Md Mamunur Rahman, and Jason Winfree. 2021. Demand Shocks and Supply Chain Resilience: An Agent Based Modelling Approach and Application to the Potato Supply Chain (Working paper No. w29166). Cambridge: National Bureau of Economic Research. [Google Scholar]
- Lu, Liang, Thomas Reardon, and David Zilberman. 2016. Supply chain design and adoption of indivisible technology. American Journal of Agricultural Economics 98: 1419–31. [Google Scholar] [CrossRef]
- Min, Chen, Fei Shen, and Yajie Chu. 2021. Examining the relationship between knowledge and attitude extremity on genetic engineering technology: A conceptual replication study from China. Journal of Environmental Psychology 75: 101585. [Google Scholar] [CrossRef]
- NBSC—China National Bureau of Statistics. 2013. China Statistical Yearbook. Beijing: China Statistical Press. First published 2008. [Google Scholar]
- Pardey, Philip G., Robert S. Andrade, Terrance M. Hurley, Xudong Rao, and Frikkie G. Liebenberg. 2016. Returns to food and agricultural R&D investments in Sub-Saharan Africa, 1975–2014. Food Policy 65: 1–8. [Google Scholar] [PubMed] [Green Version]
- Pray, Carl, Danmeng Ma, Jikun Huang, and Fangbin Qiao. 2001. Impact of Bt cotton in China. World Development 29: 813–25. [Google Scholar] [CrossRef]
- Qaim, Matin. 2003. Bt cotton in India: Field trial results and economic projections. World Development 31: 2115–27. [Google Scholar] [CrossRef]
- Qiao, Fangbin. 2015. Fifteen years of Bt cotton in China: The economic impact and its dynamics. World Development 70: 177–85. [Google Scholar] [CrossRef]
- Qiao, Fangbin, and Jikun Huang. 2020. Technical efficiency of Bacillus thuringiensis cotton in China: Results from household surveys. Economic Development and Cultural Change 68: 947–63. [Google Scholar] [CrossRef]
- Qiao, Fangbin, Jikun Huang, and Caiping Zhang. 2016. The sustainability of the farm-level impact of Bt cotton in China. Journal of Agricultural Economics 67: 602–18. [Google Scholar] [CrossRef]
- Rao, Xudong, Terrance M. Hurley, and Philip G. Pardey. 2019. Are agricultural R&D returns declining and development dependent? World Development 122: 27–37. [Google Scholar]
- Reardon, Thomas, Amir Heiman, Liang Lu, Chandra SR Nuthalapati, Rob Vos, and David Zilberman. 2021a. “Pivoting” by food industry firms to cope with COVID-19 in developing regions: E-commerce and “copivoting” delivery intermediaries. Agricultural Economics 52: 459–75. [Google Scholar] [CrossRef]
- Reardon, Thomas, Ben Belton, Lenis Saweda O. Liverpool-Tasie, Liang Lu, Chandra S. R. Nuthalapati, Oyinkan Tasie, and David Zilberman. 2021b. E-commerce’s fast-tracking diffusion and adaptation in developing countries. Applied Economic Perspectives and Policy. [Google Scholar] [CrossRef]
- Reardon, Thomas, Liang Lu, and David Zilberman. 2019. Links among innovation, food system transformation, and technology adoption, with implications for food policy: Overview of a special issue. Food Policy 83: 285–88. [Google Scholar] [CrossRef]
- Umetsu, Chieko, Thamana Lekprichakul, and Ujjayant Chakravorty. 2003. Efficiency and technical change in the Philippine rice sector: A malmquist total factor productivity analysis. American Journal of Agricultural Economics 85: 943–63. [Google Scholar] [CrossRef]
- Wang, Miao, and MC Sunny Wong. 2012. International R&D transfer and technical efficiency: Evidence from panel study using stochastic frontier analysis. World Development 40: 1982–98. [Google Scholar]
- Wang, Xiaobing, Futoshi Yamauchi, and Jikun Huang. 2016. Rising wages, mechanization, and the substitution between capital and labor: Evidence from small scale farm system in china. Agricultural Economics 47: 309–17. [Google Scholar] [CrossRef]
- Wu, Felicia, and William Butz. 2004. The Future of Genetically Modified Crops: Lessons from the Green Revolution. Santa Monica: RAND Corporation. [Google Scholar]
- Xiao, Hongbo, Jimin Wang, Les Oxley, and Hengyun Ma. 2012. The evolution of hog production and potential source for future growth in China. Food Policy 37: 366–77. [Google Scholar] [CrossRef]
- Xie, Wei, Tariq Ali, Qi Cui, and Jikun Huang. 2017. Economic impacts of commercializing insect-resistant GM maize in China. China Agricultural Economic Review 9: 340–54. [Google Scholar] [CrossRef]
- Yu, Changxin, Haiyan Deng, and Ruifa Hu. 2020. Attitude gaps with respect to GM non-food crops and GM food crops and confidence in the government’s management of biotechnology: Evidence from Beijing consumers, Chinese farmers, journalists, and government officials. Sustainability 12: 324. [Google Scholar] [CrossRef] [Green Version]
- Zhou, Ying-heng, Xiao-heng Zhang, Tian Xu, Xian-hui Geng, Peng Zhang, and Bin-jian Yan. 2015. Technical and environmental efficiency of hog production in China -A stochastic frontier production function analysis. Journal of Integrative Agriculture 14: 1069–80. [Google Scholar] [CrossRef]
- Zilberman, David, Liang Lu, and Thomas Reardon. 2019. Innovation-induced food supply chain design. Food Policy 83: 289–97. [Google Scholar] [CrossRef]
| Publisher’s Note: MDPI stays neutral with regard to jurisdictional claims in published maps and institutional affiliations. |
© 2021 by the authors. Licensee MDPI, Basel, Switzerland. This article is an open access article distributed under the terms and conditions of the Creative Commons Attribution (CC BY) license (https://creativecommons.org/licenses/by/4.0/).


