1. Introduction
Over one hundred years ago, entrepreneurial activity undertaken in technologically advanced sectors was considered to be a primary source of innovation and economic growth (
Schumpeter 1911). Nowadays, economic growth and competitive power are ascribed to the innovativeness of the economy to an even greater degree (
Gherghina et al. 2020). From a policymaking perspective, special attention is devoted to high-tech companies and tools supporting innovative activity. Anecdotal evidence implies that the high-tech sector is a crucial driver of economic development. Furthermore, the endogenous growth theory assumes that the long-run growth rate has an endogenous character, and that the human factor plays a vital role (
Kopf 2007). The decision of whether to invest more in R&D or to increase public spending on education is crucial in this context. The problem is especially important for EU countries, where, over the last decade, the lower level of investments in R&D and innovativeness has created a gap as compared to the main economic partners like the U.S. or China (
Gil et al. 2019). Furthermore, investments in innovativeness create a knowledge-based society, produce intellectual capital, and finally, as (
Popescu 2019) suggests, become an integral part of national wealth.
According to the results of the McKinsey Global Survey of Business Executives, on the corporate level, executives believe that innovation is the most required element of growth (
Carden et al. 2005, p. 25). (
Hay and Kamshad 1994), at the beginning of the 1990s, designed and performed a questionnaire based on Small and medium—sized enterprises located in the U.K. The results of the study imply that investment in product innovation was, at that time, perceived as the single most crucial strategy, followed by the policy of broadening the product range and geographic expansion.
In recent years small, medium, and young companies active in high tech sectors have attracted special attention in economic literature, as they are deemed to be a major source of innovation and development for the economy. Some authors claim that these firms have a specific business model. (
Giraudo et al. 2019),
Aghion and Howitt (
2005),
Hall (
2002) stress that these firms are characterized by a specific attitude toward grasping technological innovation. Still, they also suffer from inefficient mechanisms of capital allocations, which are very severe, especially for young firms which lack track record, stable cash flows, and collaterals. (
Giraudo et al. 2019) indicate that financial constraints can be especially severe for so-called bank-based economies, like Europe.
Howell (
2016), who investigates barriers in financing innovative firms in China, stresses that the problem of financial constraints for innovative firms can be especially severe in transitioning economies with a less developed system of financial intermediaries.
From the policymaking point of view, special attention is devoted to so-called New Technology-Based Firms (NTBFs). The term was supposedly coined by Arthur D. Little (
Little 1977), who defined NTBFs as an independent venture less than 25 years old that supplies a product or service based on the exploitation of an invention or technological innovation. The issue invoked by many researchers is financial constraints, which are encountered by NTBFs at the early stage of development. So far, most studies have been focused on developed countries like the US, UK, Germany, France, or Ireland, where the institutional market environment is well established and at the same time most developed in terms of technology and science. These countries also represent a long history and have extensive experience in supporting the development of innovative activity. The high-technology firms in these countries have access to the best research centers, the best universities, and are subject to a very competitive market, and therefore their activity is based mostly on internally generated innovation.
However, scant research is devoted to the other emerging or less developed countries whose economies are trying to catch up with the leading innovators. This is especially apparent, as (
Vintilă et al. 2017, p. 38) note, for countries from Eastern Europe, which endeavor to line up with Western Europe. The specific NTBFs located in these countries have other distinctive attributes. Firstly, since they are usually in emerging economies, there is no equivalent to the best research centers and access to the best universities. Secondly, there are almost no headquarters and/or research centers of multinational companies, which are usually located in the most developed countries. Thirdly, it is much more difficult for high-tech companies to compete for leading researchers with multinational companies. Fourthly, it is much more challenging to compete with high-tech companies from leading countries due to scarce resources in terms of finance, marketing, patent protection, etc.
As a result, high-tech companies in developing countries often adopt a different strategy in which innovative activity is based in substantial part on the acquisition of external technology and to a minor degree on internally generated innovation. The purchase and implementation of new technology is the preferred and less risky strategy in comparison to the development of in-house produced innovative processes. Therefore, the specificity of the high-tech companies in emerging and developing markets is slightly different in comparison to NTBFs from leading countries. The problem is especially visible within the EU, where the concept of “Two-Speed Europe” is apparent in the economic press. Therefore, as (
Vintilă et al. 2018, p. 571) point out, the disparities between the West and East require a deeper understanding of proper public policy.
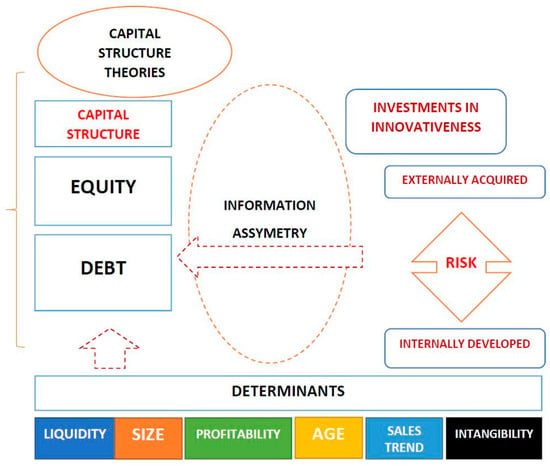
The main aim of the paper is the identification of determinants of the capital structure of NTBFs in a country that has an emerging economy. The focus of this study is on technological firms (NTBFs) headquartered in Poland, which is a very unique and specific case. Poland was the first CEE economy promoted by FTSE Russel’s index provider with the Emerging Market to Developed Market status. Since 2018, Poland has been classified as one of the 25 most advanced global economies, including the U.S., U.K., Germany, France, Japan, etc. Therefore, Poland is considered a success story in terms of economic development, but at the same time is a country with one of the lowest levels of corporate R&D expenditures within EU countries. This contradiction urges us to investigate deeper the determinants of the capital structure of Polish NTBFs with special attention given to investments in innovativeness. We select companies at a certain stage of development that are listed on the stock exchange, mostly because of the higher quality of accounting information reported in the financial statements as compared to the non-listed companies. We hypothesize that investment in innovation has an inconclusive influence on financial leverage. Therefore, we separated it into two categories: innovation generated internally (R&D projects) and innovation acquired externally. These two types of investments have significant and distinct attributes, which we posit have a differential impact on financial leverage. We provide empirical evidence that the former kind of investment has negative, while the latter one a positive impact on financial leverage. The other hypotheses conjecture the impact of the other firm’s attributes like a firm’s size, liquidity, intangibility, age, profitability, and growth opportunities.
As far as we know, there is no study related to emerging economies in which investments in innovativeness are separated into externally acquired and internally generated and treated as a potential determinant of capital structure. Our hypotheses are tested on a sample of 102 firm-year observations (34 companies). The study period (2014–2018) ends at the moment when Poland was promoted to a group of countries with Developed Market status, so it can be regarded as a study of a country with the Emerging Market status.
The first section presents a literature review of the most important studies related to the problem of the financial structure of high-tech companies, the theories, and hypothesis development. The second section presents the sample characteristics, research design, and empirical results. The last section concludes with the most important issues resulting from empirical research.
2. Theories of Capital Structure
Over the past several decades a number of capital structure theories have been developed which attempt to explain the creation of structures of economic entities’ financing. The classical capital structure theories include
Net Income Theory, Net Operating Income Theory, and
Traditional Theory. Net Income Theory is based on the assumption that a firm’s value is proportionate to its share of debt in capital structure, so a firm’s maximum value is reached in the situation of its maximum indebtedness. Net Operating Income Theory assumes the dependence of a firm’s value on the value of operating income; in the situation of determined conditions capital structure does not affect a firm’s value. According to Traditional Theory, a proper balance should be maintained between internal and external sources of financing. Therefore, a reasonable level of debt increases a firm’s value (
Durand 1952). However, the best known classical theories are those created by F. Modigliani and M. Miller (MM). In their famous paper MM argue that a firm’s value is not dependent on the capital structure but rather owners’ expectations with regard to cash flows (
Modigliani and Miller 1958). The conclusions based on the assumption of perfect capital markets were partly rejected in MM’s next work, which took into account the issue of taxation (
Modigliani and Miller 1963). MM finally admitted that indebtedness has a positive impact on a firm’s value thanks to possible tax burden reductions. In the context of determining the capital structures of high-tech companies, MM and the remaining classical theories are of limited practical application (
Coleman and Robb 2012;
Ullah et al. 2010). High-tech firms, due to high-risk levels, do not heavily rely on debt financing; however, high debt levels have a negative impact on the value of high-tech companies.
The capital structure of high-tech firms can be more affected by the agency costs theory. Its basics were developed by
Fama and Miller (
1972), and initially by
Jensen and Meckling (
1976). It assumes the existence of conflicts of interest between owners, lenders, and managers. Managers do not always act with the intention of protecting owners’ interests—they often pursue their own interests, which can be different (
Novaes and Zingales 1995). In such a situation owners are forced to exercise additional control over the management’s activities, which generates additional costs—agency costs. One of the ways of linking the interests of the above groups is relating the management’s compensation to the company’s shares. Another situation can occur in which managers implement risky investment projects, generating additional risk for lenders, while only owners benefit from higher profits. Debt can then act as a factor that disciplines the management, enforcing more active operating policies, and more effective investment policies (
Kenourgios et al. 2019). In this situation, debt decreases agency costs (
Novaes and Zingales 1995). Agency costs tend to be very high in companies with high unique value (
Colombo et al. 2014;
Sau 2007). The higher the agency costs, the lower the firm’s value (
Lins 2003).
A possibly significant role in high-tech firms is played by trade-off theory. Its creators are
Kraus and Litzenberger (
1973). All financing methods have both advantages and drawbacks. Higher debt levels provide an opportunity to deduct interest from taxable income. However, it should be noted that there are other methods of reducing tax burden with the use of non-interest tax shields including effective depreciation policies, or, in a broader sense, tax optimization (
DeAngelo and Masulis 1980). It should be stressed that a company can benefit considerably from relatively high tax rates. A company’s heavy reliance on indebtedness in its capital structure increases business risk and results in the costs of bankruptcy (
Baxter 1967). The higher the bankruptcy costs, the lower a firm’s value. Higher debt levels in the balance sheet total originally increase a firm’s value, but at a certain point, a firm’s value decreases (
Adrienn 2014). The costs of bankruptcy are then higher than tax shield positive effects. A practical confirmation of the trade-off theory is the occurrence of the so-called industry effect. The functioning of an enterprise within one industry is dependent on similar factors—economic entities are characterized by similar operating cycles, risk levels, and agency costs, hence their similar share of debt in overall financing. The companies whose share of debt in the structure of financing is below industry average tend to increase it, unlike entities that have a large share of debt in their financing structure and try to lower its level (
Kędzior 2012). The industry effect is not identical in all industries. In industries characterized by stiff competition and diversified agency costs, debt levels can vary. Unequal access to advanced technologies has a similar impact on indebtedness (
Michaelas et al. 1999). The above factors result in the existence of an optimal industry capital structure, which economic entities seek to achieve in their long-term operations (
M’ng et al. 2017).
In the case of innovative companies, it is difficult to estimate the risk of the sources of financing within the framework of trade-off theory. Many threats should be regarded as potential, and their materialization is conditional and not easy to estimate (
Sau 2007), hence difficulties in choosing adequate sources of financing. Choices made by high-tech firms with regard to financing are affected by a rapidly changing business environment and the complexity of applied technologies (
Li et al. 2006). These entities do not have the ability to offer adequate guarantees to mitigate lenders’ risk (
Sau 2007). Innovative firms have higher bankruptcy costs (
Aghion et al. 2004;
Sau 2007), so the share of liabilities in the balance sheet total cannot be dominant. High-tech companies with a relatively high volume of intangible assets are less inclined to borrow funds. On the other hand, high growth companies rely on debt financing to a smaller degree (
Castro et al. 2015). Transaction costs in such entities are also high due to risk factors and, generally, limited volumes (
Revest and Sapio 2012). Their market value is subject to large fluctuations, especially as their financial standing deteriorates. It results from the fact that their valuation is based on specialized assets as well as large growth potential. Therefore, valuation changes on stock exchanges play a crucial role in high-tech firms (
Revest and Sapio 2012).
The financial conditions and capital requirements of high-tech firms depend on the stage of their development (
Sau 2007). At the initial stage of development economic entities’ cash flows are often negative, so they are not able to repay their debts, and the acquisition of funds is difficult. In their early stages, high-tech firms’ biggest problem in product commercialization based on the use of familiar technologies is the acquisition of funds for operating activities (
Minola et al. 2013).
The creation of capital structure is greatly affected by the pecking order theory. The theory was created by
Donaldson (
1961), and then elaborated and modified by
Myers and Majluf (
1984). The authors divide sources of financing into external and internal sources. The choice of the sources of financing is mainly determined by their cost which is lower for internal capital. Therefore, companies should finance their operations by relying on retained earnings, followed by debt and, finally, the issue of shares (
Stulz 1990). This order is justified by information asymmetry in relationships between companies, banks and external investors. Banks and external investors have more difficulty accessing information about companies than people operating within company structures, so in light of the higher risk of transferring capital, they require higher interest on loans and higher rates of return. Information asymmetry leads to moral hazard and adverse selection. The adverse selection indicates that banks find it difficult to distinguish between effective and ineffective investment projects, which generates additional costs and increases risk. A high level of adverse selection also results from great uncertainty with regard to future return on investment rates as compared with traditionally implemented projects (
Carpenter and Petersen 2002). Moral hazard indicates that owners benefit more from implementing risky investment projects than debtors (
Aoun and Heshmati 2006). High information asymmetry results, to a considerable degree, from the large development potential of high-tech firms (
Castro et al. 2015). High information asymmetry in the technology sector mainly applies to small companies. Therefore, such companies can often be undervalued (
Coleman and Robb 2012).
Pecking order theory assumes that the accessibility of information about a high-tech firm has an impact on the choice of capital structure. To avoid problems resulting from the disclosure of internal information to a larger group of stakeholders, high-tech firms give preference to internal sources of financing (
Hogan et al. 2017;
Scherr et al. 1993). Due to such factors as uncertainty with regard to the ultimate results of innovative investment projects, possible cases of underinvesting and overtrading, difficulties in monitoring R&D activities, and the frequent lack of comprehensive knowledge about technology among investors and banks, access to external financing can be limited (
Revest and Sapio 2012). Generally, high reinvestment rates in technology firms force them to seek external sources of financing in the absence of their own funds (
Berggren et al. 2000).
The acquisition of external capital implies the necessity of disclosing additional information about planned operating or investment activities. Small and medium-sized high-tech firms are not inclined to disclose such information. Similar opinions are held by
Revest and Sapio (
2012). Technology firms are unwilling to disclose detailed information about R&D programs due to a very competitive market and the fear of losing competitive advantage.
Aoun and Heshmati (
2006) also claim that because of the confidential character of business operations high-tech firms have difficulty disclosing comprehensive financial data, and hence face problems with acquiring funds for business activities. As a result, markets do not possess full information, and lenders have limited knowledge about the current operations of high-tech firms (
Ullah et al. 2010). Transaction costs and greater flexibility of operations justify reliance on retained earnings as a source of financing (
Grinblatt and Titman 2002). A number of empirical research studies point to a negative correlation between profitability and indebtedness (
Bhayani 2010a;
Korkmaz and Karaca 2014). Therefore, profitable firms rely on debt financing on a limited scale.
Technology firms tend to choose financing through the issue of shares rather than indebtedness. This mainly refers to young firms at an early stage of development (
Minola et al. 2013). Innovative firms are characterized by attractive investment possibilities as compared with other business entities, but the costs of the issue of shares should be regarded as high (
Aghion et al. 2004;
Castro et al. 2015). Larger technology firms have a greater ability to raise funds through the issue of shares (
Mac an Bhaird and Lucey 2010). Frequently, young firms without a long credit history and relationships with banks are left with no other option but to issue shares (
Carpenter and Petersen 2002). Because of the lack of collateral in the form of tangible assets, innovative companies tend to rely more frequently on share capital. The issue of shares does not have to be secured by tangible assets and does not increase the threat of bankruptcy. High-tech firms can successfully implement R&D programmes if they are able to convince investors to purchase issued shares (
Carpenter and Petersen 2002). The idea of the issue of shares is also justified by technology firms’ tendency to implement high returns but also risky investments (
Carpenter and Petersen 2002).
Because of the risk of share dilution and takeovers, innovative companies tend to rely on debt financing (
Aghion et al. 2004). If the lack of transparency of disclosures is acceptable, high-tech firms can also resort to bank loans (
Berggren et al. 2000). As firms grow and gain more experience, the range of information asymmetry reduces, the value of assets (especially tangible assets) increases, and access to bank loans becomes easier (
Hogan et al. 2017). High-risk firms may not be granted loans, but they are still able to successfully implement the process of issuing shares.
It seems, however, that pecking order theory turns out to be more useful in large economic entities, which rarely issue shares because of the high values of retained earnings and the possibility of acquiring corporate bonds (
Akgül and Sigali 2018). Nevertheless, within a short time horizon, enterprises are likely to create their capital structure based on the pecking order theory. On the other hand, in longer periods of time in which the changeability of cash flows and economic conditions is less severe, companies are likely to rely on trade-off theory (
Bontempi 2002). Pecking order theory (POT) is probably more effective in describing the choice of sources of financing in mature companies as compared with high growth entities.
The signaling theory, created by
Ross (
1977), has a different impact on capital structure creation. Due to information asymmetry, people operating inside and outside of an organization have unequal access to information about a company’s financial standing. External stakeholders make intensive efforts to obtain information about a company’s future financial condition and future share valuations. Therefore, they seek additional signals concerning an economic entity’s actual financial condition. The most reliable signals and those that cannot be easily imitated refer to dividend policies and capital structure decisions (
Frankfurter and Wood 2002;
Deesomsak et al. 2004). Increased indebtedness should be regarded as a positive signal—it indicates a bank’s favorable assessment of an entity’s creditworthiness and stable projected financial results and cash flows. It can be assumed that current and projected financial results will not be diluted. On the other hand, the issue of shares is sometimes treated by financial markets as a negative signal. Companies with less optimistic financial result predictions tend to finance their operations through the issue of shares (
Leland and Pyle 1977). Managers choose the issue of shares if their current valuation is excessively high. The market’s negative response to the issue of shares can be even more severe if investors perceive a company as being characterized by great information asymmetry (
Minola et al. 2013). The range of information asymmetry is very high for new investment projects, new areas of activity and new strategies. Over time asymmetry tends to decrease (
Harris and Raviv 1988). Information asymmetry relates to new areas and issues—past events of key significance are reflected in the price of shares (
Harris and Raviv 1988).
Last but not least important is the financial life cycle theory, which assumes that a firm’s capital structure preferences vary with their life cycle (
Butzbach and Sarno 2018). The life cycle determined the availability of financial resources and the cost of capital. The theory implies that smaller and younger companies exhibit higher information asymmetry, which in turn increases the cost of capital. We expect that in the case of NTBFs the financial life cycle theory may be of use due to the fact that R&D activity increases information asymmetry and the fact that NTBFs are typically young companies with low or no reputation, and have almost no (or very low) carrying amount of tangible assets.
3. Literature Review and Hypothesis Development
Determinants of capital structure have been at the heart of finance theory for many decades. Still, as
Dobusch and Kapeller (
2018) indicate, innovation advancements and digital technologies have a big influence on changes in firms’ strategic choices, so there is a need to reconsider factors influencing corporate financing decisions, especially in high-tech sectors. The sector is expected to be a crucial factor affecting access to finance, in part because firms in different industries will be seeking to access finance for diverse reasons. High–tech firms very often look for sources of financing for innovative or R&D activity.
Hall (
2010) addresses the extent to which innovative firms are fundamentally different from established companies and how it is reflected in their financing.
In terms of methodology, the critical problem concerns the identification and measuring of financial constraints. In other words, the operationalization of this problem may be expressed by the identification determinants of financial leverage, and there is vast literature concerning that problem. However, papers related to the determinants of high-tech companies or NTBFs represent a much narrower field of study. There are at least several significant factors whose impact on financial leverage was empirically investigated and documented. These factors include, among others, the intangibility of assets, R&D intensity, the firm’s size, age, liquidity, profitability, intangibility, and institutional setting.
Several researchers identified and documented the fact that access to finance for high-tech companies is constrained.
Lee et al. (
2015), based on the study of 10,000 UK small and medium-sized companies
1, found that access to finance is much more difficult for innovative firms and that this problem has worsened since the 2008 financial crisis. They investigated the relationship between innovation and access to funding while controlling for firm characteristics (size, age, sector, several personal features of the management), and the likelihood of applying. Their focus was on the change in access to capital for innovative firms caused by the 2008 economic crises. It is important to note that their definition of innovative firms is much broader than in other studies, and extends beyond R&D intensive, high technology industries. The results suggest that there are barriers to obtaining external finance for innovative projects, even controlling for several factors that might have influenced more difficult access to funds. They indicate that there are two kinds of problems in financial systems. The first one is related to structural problems connected with financial constraints for innovative firms. The second problem concerns cyclical issues caused by the financial crisis, which, surprisingly, has had a more severe effect on non-innovative firms’ access to finance. They find that innovative firms in the UK show higher demand for external capital but encounter more significant barriers to obtaining financing (restricted supply). In their case, there is a much higher imbalance between demand and supply compared with non-innovative firms.
Brown and Lee (
2019) challenged the assumption of innovative firms having problems with access to credit. They concluded, based on the survey of 8000 UK SMEs in the period following the financial crisis of 2008, that there is no difference in access to external finance for high growth SMEs and other companies. The authors focus on the high growth of SME firms but admit that those are particularly likely to be innovative firms, and R&D activity is especially seen as growth-inducing. They find that a vast majority of high growth companies (achieving rapid growth in turnover and employment) rely strongly on debt, not equity finance for investment purposes (the situation is different in the case of working capital purposes). Based on these findings, the authors question the rationale for UK government policy aimed at increasing credit availability for high growth innovative companies.
An important strand of literature concerning the financing of innovative firms is focused on venture capital and other forms of equity financing tailored to financing risky, innovative projects. Economic literature shows that innovative firms are more dependent on equity than debt financing (
Brown et al. 2009;
Brown et al. 2013;
Falato et al. 2018). Still, there is also a growing interest in access to bank financing (the more standard, traditional form of funding).
3.1. Intangibility
Studies exploring the relationship between intangible assets and capital structure are still relatively rare. In the economic literature, tangible assets are widely recognized as an important determinant of financial leverage because of their potential to be treated as collateral. However, investigating the influence of intangibles on the corporate capital structure is of vital importance because in today’s economy a large and still increasing part of companies’ assets is represented by intangibles. For obvious reasons, it should be assumed that this phenomenon is especially evident in the case of high tech companies, where innovation activity is crucial. For that reason, intangible assets account for a substantial part of total assets. However, the situation is more complicated because of the phenomena of underreporting of R&D outlays, which is a visible problem in today’s financial reporting on emerging economies.
As
Lim et al. (
2020) indicate, internally generated intangible assets are reported in balance sheets and other companies’ reports. For that reason, it is very difficult to evaluate the impact of intangibles on financial leverage (under accounting rules, most of the internally generated intangible assets are not recognized on the balance sheet).
Peters and Taylor (
2017), based on a sample of U.S. firms, estimated that an average firm acquires externally only 19% of intangible capital. Therefore, the vast majority of intangible assets are missing from the balance sheet, so they construct a proxy to measure the value of internally acquired assets by accumulating past intangible investments reported on firms’ income statements. They define the stock of international intangible capital as the sum of knowledge capital and organizational capital. Knowledge capital is created in the process of R&D activity, and to measure it,
Peters and Taylor (
2017) use the perpetual inventory method. The accounting approach is different from externally acquired intangible assets that are capitalized.
Lim et al. (
2020) also point out that intangible assets may discourage debt financing because of poor collateralizibility and high valuation risk. However, they come to the conclusions that identifiable intangible assets have the same positive influence on financial leverage as tangible assets, and that they support debt. The study is based on a sample of 469 US public companies between 2002 to 2014. The dataset consists of targets of acquisitions, and in such transactions, there is a disclosure requirement for the acquiring firms to allocate the purchase price paid for the target to two main subsets of tangible and intangible assets. Authors in their research use fair value estimates (not the usually used book value) of both tangible and intangible assets. They divide intangible assets into two categories: identifiable intangible assets (among them technology-related as patents and in-process R&D, marketing-related as trademarks, trade names, customer contracts, customer relationships, and others as non-compete agreements, unproven mineral or gas properties) and unidentifiable intangible assets—goodwill.
Hall (
2010) indicates that in the case of high-tech companies, not only are a significant part of results intangible, but “much of it is in the form of human capital embedded in the heads of the employees.” It has low salvage value and is also idiosyncratic, which means that when a company goes out of business, it is a signal that its value is low. As Hall stresses, except for certain types of patents, there is little market for distressed intangible assets. This is one more reason for debt financing being poorly suited to the financing of R&D intensive sectors.
Some studies in the economic literature investigate the relationship between one subset of intangible assets—patent counts—and financial leverage. The main limitation of these studies is that there are no objective methods in the valuation of patents.
Mann (
2018) calculated that in 2013, 38% of US patenting firms used patent portfolios as collateral for secured debt, so this type of intangible assets contributes significantly to the financing of innovation.
Mann (
2018) also stressed that 16% of patents produced by American firms have been pledged as collateral at some point. The pledgeability of patents depends on their high level of citation counts and generality.
Brown et al. (
2009) points out that companies using patents as collateral mainly belong to the high-tech sector and feature low tangibility. Therefore, we posit the following hypothesis:
Hypothesis 1 (H1). Intangibility has a significant and negative impact on the financial leverage of NTBFs.
3.2. Investment in Innovativeness
There is ample empirical evidence suggesting that the capital structure of R&D intensive firms exhibits significantly less debt than in the case of other firms. The problem of financial constraints in financing R&D intensive or innovative firms is well pronounced in economic literature. These problems are also referred to in economic literature as structural problems of the financial system in financing R&D or, more broadly, innovations. The reasons for that include higher risk, information asymmetry between financing providers and companies themselves (the main theoretical premise for the difficulties SMEs face when accessing external capital, which are due to the context-specific nature of R&D projects, which makes them very difficult for valuation), and the lack of collateral in the case of firms based mainly on intangible assets (denied finance due to their lack of collateral). Studies typically suggest that all these reasons cause innovative firms to encounter severe obstacles when it comes to acquiring debt financing. Internal finance is usually insufficient to finance rapid growth.
A study by
Alderson and Betker (
1996) provides evidence that there is a positive relation between liquidation costs and R&D in the corporate sector. Therefore, R&D activity is associated with higher sunk costs than other types of investments.
Guiso (
1998) finds evidence for a representative sample of about 1000 Italian manufacturing firms with 50 or more employees. Those which belong to the high-tech sector are more likely to be credit-constrained than low-tech companies. Measurement problems in the proxies for high-tech firms make it difficult to provide a precise estimate of the size of the effect. The author also points out that credit constraints have a highly counter-cyclical pattern with the proportion of firms, with limited access to financing increasing during the downturn.
A very important issue is the relation between intangibility and investment in innovativeness. We distinguish two types of investments in innovativeness, which are measurable in the accounting system: external and internal. The internal one refers to R&D outlays expended in a given period (usually one year) on the firm’s own invention. The external one refers to the expenditures on other intangible assets acquired externally, having mainly an innovative character. The last concept—intangibility—refers to the attribute of total assets, which has a cumulative and resource character. Usually, high intangibility is caused by heavy investments in innovativeness over a longer period. However, in some instances, it can be triggered by a low carrying amount of tangible assets. Therefore, from the perspective of a given reporting period, the mutual correlation between intangibility and investments in innovativeness is not necessary. Both concepts: intangibility and investments in innovativeness refer to similar but different concepts.
Firstly, we conjecture that, in a country that is at the stage of development classified as an emerging market, the more a firm invests in an innovative in-house project, the less the bank sector is willing to provide external capital. We argue that in the case of emerging markets, the informational asymmetry gap caused by the R&D project is even higher than in the case of developed markets. Secondly, we hypothesize that the external acquisition of innovation (i.e., technology) does not create informational asymmetry. Therefore, it does not increase the cost of external capital. Quite the opposite, it makes a company a more attractive client for the bank sector, with better prospects for the future. Therefore, we posit that the more a company invests in externally acquired innovation, the more leveraged it will be. Based on the above-mentioned chain of reasoning, we posit the following hypotheses:
Hypothesis 2 (H2). Internal investments in innovativeness in NTBFs from emerging countries have a significant and negative impact on financial leverage.
Hypothesis 3 (H3). External investments in innovativeness in NTBFs from emerging countries have a significant and positive impact on financial leverage.
3.3. Liquidity
Liquidity is another determinant that has an impact on capital structure and is usually understood as a measure of a firm’s capability of debt repayment. High liquidity implies that a company has the potential to pay back debt or shareholders (
Ozkan 2001). Low risk of insolvency allows acquiring debt at a lower cost (
Morellec 2001). More liquid companies are more prone to undertake riskier projects and finance them via bank loans thanks to a lower risk of solvency problems (
Ramli et al. 2019).
According to the pecking order theory, more liquid companies tend to finance their activity mainly by their funds (retained earnings). By doing that, companies avoid taking more costly debt and disclosing confidential information to financial institutions (banks) or investors. Therefore, many researchers hypothesize an inverse relationship between liquidity and financial leverage (
Kara and Erdur 2015;
Karacaer et al. 2016). Internal financing is preferred over debt, and the surplus of cash flows allows the financing of investment projects. Higher liquidity translates to financial flexibility and opens up possibilities of acquiring debt at a lower cost. Based on our experience, we suppose that in the case of emerging markets liquidity may play an important factor in shaping the capital structure of high-tech companies. Therefore, we conjecture the following hypothesis:
Hypothesis 4 (H4). The liquidity of NTBFs located in emerging markets has a significant and negative impact on financial leverage.
3.4. Size
One of the most studied firm parameters is company size. Firm size is likely to influence capital structure in several ways. Larger firms are usually treated as less risky and believed to have fewer constraints in obtaining a bank loan. Risk is higher in the case of small firms, which, due to the lack of scale, cannot diversify the risk and invest in multiple projects (
Freel 2007). The financial constraints in financing are well pronounced, especially in the case of small and medium-sized innovative firms (
Schneider and Veugelers 2010;
Hutton and Lee 2012;
Mina et al. 2013;
Lee et al. 2015).
At least several important characteristics of a firm’s size are invoked in the literature. Bigger companies are able to operationalize more debt in their balance sheets due to more collateral on the asset side (
Karacaer et al. 2016;
Cai et al. 2003). The size of a company is correlated with its age. In other words, bigger companies are usually the older ones, which means that they are already established in the market, have a deeper knowledge of the market and customer preferences, and have higher credibility, which results in lower operational risk. The financial situation of bigger companies is usually more stable, and the variability of their cash flows and financial risk is lower. Bigger companies may utilize the economies of scale and transfer the cost of short-term financing to their suppliers or clients. Bigger companies tend to engage in international activities, therefore they are more able to diversify their operations and raise funds in foreign capital markets. The cost of external capital is typically lower for bigger companies in comparison to smaller ones. Additionally, bankruptcy costs are lower for bigger companies, and as a result, they are more flexible in terms of managing their liabilities (
Demir 2009). Informational asymmetry is lower for bigger companies, which corresponds to a higher quality of financial reporting. Finally, transaction costs necessary to obtain bank loans are usually lower for bigger companies (
Hall et al. 2004). All the above factors supposedly make the cost of attracting external capital lower and may imply that the bigger a company, the higher its financial leverage. The study conducted by
Nenu et al. (
2018), based on the sample of Romanian companies provides empirical evidence supporting this statement. The authors of that study point out that the trade-off theory may explain the research outcome.
In the literature, one can also find the opposite arguments. Bigger companies often accumulated retained earnings for many years, and external capital was not necessary (
Kara and Erdur 2015). Bigger companies are also more prone to the problem of moral hazard (
Frank and Goyal 2008). Many cases from the past show that bigger companies tend to accept excessive growth, which translates to lower operational efficiency and, finally, an increased cost of external capital (
Ammar et al. 2003). Agency costs are usually higher for bigger companies, which means that monitoring and auditing are more costly (
Yildirim et al. 2018). However, higher long-term debt may provide additional incentives to managers for the creation of shareholder value (
Izdihar 2019).
External finance is vital for innovative SMEs, as they usually lack the internal sources of financing needed for the commercialization of their innovations (
Beck and Demirguc-Kunt 2006;
Schneider and Veugelers 2010). The business model of innovative firms is riskier, and the intangible assets account for a bigger part than physical property in their balance sheets, which creates a problem in bank valuation. Intangibles are context-specific, which creates a problem for banks who value them and use them as collateral for lending. Also,
Canepa and Stoneman (
2008),
Czarnitzki (
2006), and
Freel (
2007) suggest that all these structural problems with innovative financing firms are amplified in the case of SMEs. Finally, as
Kijkasiwat and Phuensane (
2020) documented, bigger companies are more able to benefit from external and internal innovative projects, while the smaller ones only benefit from internal projects.
In the case of NTBFs, an increase in size should result in a decrease in operational and investment risk. However, it is probably at a higher level compared to other firms. Likewise, bankruptcy costs should be lower, yet substantial. The scope of information asymmetry will decrease, agency costs may be lower, but not low. It can be expected that NTBFs’ willingness to attract external capital will increase with its size (
Berggren et al. 2000). Therefore, we conjecture the following hypothesis:
Hypothesis 5 (H5). The size of NTBFs located in emerging markets has a significant and positive impact on financial leverage.
3.5. Age
The next important determinant of capital structure—a firm’s age—is especially important in the case of the high-tech sector. Some authors take into account the age of the firm as a determinant in obtaining a bank loan. According to
Cowling et al. (
2012), the size of the company and its track record influence bankers’ decisions to credit an entity, putting small and young firms at a disadvantage. Older companies also have more fixed assets, which can serve as collateral for the long-term credit loan, which also makes the debt more accessible and less costly. The results of empirical studies suggest that the firm’s age allows it to curtail limits typical for high-tech companies, especially higher risk. Older firms have lower bankruptcy costs, lower costs of external capital, a broader customer base, more stable financial results over time, and more profitable companies (
Malik 2011;
Bhayani 2010b).
The firm’s age, or the period counted since the IPO on the stock market, is positively correlated with the quality of corporate governance, and, consequently, lowers the agency costs and the cost of the bank loan (
Kieschnick and Moussawi 2018). On the other hand, older firms usually accumulated retained earnings from the previous periods and may not strive for capital offered by the bank sector (
Mac an Bhaird and Lucey 2010). Younger firms suffer more from agency problems, and this is the reason why access to external capital is hampered (
Mac an Bhaird and Lucey 2010). As the firm gains experience and records a more extended credit history, the risk of moral hazard becomes lower.
Younger firms usually suffer from lack of capital, and for this reason, they often apply for external capital to finance their investment projects (
Bhayani 2010b;
Hall et al. 2004). At the same time, due to the problem of moral hazard, which is a very distinctive feature of young, technological firms, applying for and getting a bank loan is the way through torment (
Hogan et al. 2017). Easier access to external capital for NTBFs is possible and can be observed in countries where the financial system is based on a well-developed banking sector. Therefore, we posit the following hypothesis:
Hypothesis 6 (H6). The age of NTBFs located in emerging markets has a significant and positive impact on financial leverage.
3.6. Profitability
The next important characteristic of the company—profitability—is an important determinant of capital structure. According to the pecking order theory, a firm first instances its activity from retained earnings. If this source is not sufficient, a company tries to obtain external sources of capital (
Myers and Majluf 1984). From this perspective, higher financial leverage does not always imply or correlate with higher profitability.
Another implication may be derived from the trade-off theory, which assumes a state of balance between equity and debt capital, while the cost of debt capital is lower. More profitable companies usually have sufficient financial resources necessary to pursue their investment plans. However, more profitable companies may find a tax shield to be a decisive argument for increasing financial leverage (
Bouallegui 2006), which is especially important for companies from countries where the tax rate is high. The theory of free cash flows also posits that more profitable companies should indebt themselves because it provides a self-control mechanism. It forces management to transfer free cash flows as dividends to their shareholders instead of investing in less profitable investment projects (
Izdihar 2019).
Highly profitable companies have much easier access to external financing at a much lower cost (
Cassar and Holmes 2003). This is also supported by the substitutive theory, which posits that less risky and more profitable companies are much more able to finance their activity from external sources, especially debt. High profitability also minimizes the risk of bankruptcy, and for this reason, the capacity of indebtedness is increased (
Ramli et al. 2019). Highly profitable companies, which finance their activity from internal sources, are not required to disclose detailed information on their operations (
Li and Islam 2019). Internal sources of finance (retained earnings) and increased indebtedness may be attractive for investors since a firm’s shareholding is not diluted (
Karacaer et al. 2016). On the basis of the above discussion, it may seem that the impact of profitability on capital structure is ambiguous (
Degryse et al. 2012). However, from the perspective of NTBFs, we can suppose that more profitable companies would have much better credit standing and better access to debt. Therefore, we treat the firm’s profitability parameter as a control variable.
3.7. Growth Opportunities
Growth opportunities are an important firm characteristic influencing capital structure in the high-tech sector. Most often, high-tech companies tend to use their own equity funds because of innate higher risk and the necessity of more costly supervision of this type of company (
Myers 1977). High growth opportunities, on the one hand, create the chance of development, but on the other hand, pave the way for new risk. Usually, enormous growth opportunities accompany low equity values which are necessary to finance important investment projects. Fortunately, these companies, even when dealing with severe financial problems, don’t have problems with raising equity capital. Indebtedness may put pressure and discipline on the management and enforce a more efficient decision-making process. The valuation process of high-tech companies is based on their future potential (option), which is heavily burdened with risk. Therefore, the market valuation is under the threat of impairment. This is especially important considering that the asset is in substantial part intangible and, as a result, cannot serve as collateral (
Karacaer et al. 2016). Thus, some researchers (
Rajan and Zingales 1995) hypothesize an inverse relationship between growth opportunities and financial leverage. This relationship is also implied by the pecking order theory, which posits that a firm tends to finance its activity by internal funds and, afterward, look for external ones. Agency costs theory provides similar implications for high-tech companies. Additional monitoring costs related to management supervision may be substantial, especially when growth opportunities do exist, which supposedly will lead to an increased cost of debt. High-tech companies will be discouraged from taking on more debt in their balance sheet in order to minimize potential conflict between shareholders and creditors (
Ramli et al. 2019). The implication of the substitution theory also confirms that relationship, because high-tech companies are more prone to the risk of financial situation deterioration. Therefore, we treat the firm’s growth opportunities as a control variable.
4. Sample Characteristics, Research Design, and Results
The study sample consisted of 31 companies listed on the Warsaw Stock Exchange classified as high-tech firms in sectors like biotechnology, R&D in physics, natural sciences, engineering, biology, medical laboratories, computer software, e-commerce, marketing analysis, etc. We decided to use data derived from firms listed on the stock exchange because of a higher quality of accounting data. These companies, under the scrutiny of stock market institutions and the public, are obliged to meet higher standards of transparency and are audited. Companies may also be classified as NTBFs because the oldest firm in the study period is 17 years old, and the average age is around six years. The initial sample consists of 155 firm-year observations covering the period of 2014–2018. The final sample is limited to only 102 firm-year observations due to the missing data.
Our main object of interest is capital structure, and as a dependent variable, we use the leverage ratio calculated as total liabilities to total assets. As a proxy for the innovation generated internally, we use a ratio of the sum of R&D expenses recorded in the P&L statement and year-to-year change in R&D outlays recorded in the balance sheet, deflated by the total assets. In our opinion, this is the only possible way to measure R&D outlays based on information derived from a financial statement. As the proxy for the innovation acquired externally, we use a year-to-year change of intangibles extracted from the balance sheet, excluding R&D expenses recognized. We also use a set of control variables such as profitability (ROE) and growth opportunities. In order to avoid the influence of outliers, all data were winsorized.
Table 1 presents the characteristics of the main variables used in the model.
In order to avoid intercorrelated variables in the model, we performed a correlation analysis, the results of which are presented in
Table 2. The highest correlations, however moderate, are between a firm’s age and profitability (ROE), financial leverage, and size. The results are logical and correspond to the conclusions of the literature review section. The older a company is, the higher its profitability. Similarly, the older the firm is, the more able it is to indebt itself. Finally, bigger companies tend to be more profitable. The results show that variables INNOV_INT and INNOV_EXT are weakly correlated. The rest of the correlation coefficients of independent variables are at a low or moderate level, so including them in the model is not controversial.
To test the hypotheses formulated in the previous section, we used the following model:
where:
LEVi,t—financial leverage (total liabilities/total assets) of the i-company in t-year
INTANGIBILITYi,t—the ratio of intangibles to total assets of the i-company in t-year
INNOV_INT1i,t—the ratio of internally generated intangibles to total assets of the i-company in t-year
INNOV_EXT2i,t—the ratio of externally acquired intangibles to total assets of the i-company in t-year
CUR_RATIOi,t—liquidity of the company measured as a current ratio (current asset/current liabilities)
SIZEi,t—the size of the i-company in t-year as a logarithm of total assets
AGEi,t—age of the i-company in t-year
ROEi,t—profitability of the i-company in t-year measured as a return on equity
SALES_TRi,t—sales trend of the i-company in t-year calculated as year-to-year change of sales (sales from the t-year minus sales from the t−1 year, and deflated by the sales from t−1 year)
We ran a regression with a robust option in order to obtain robust coefficients. It allows us to avoid many problems with the specification of the model.
We performed an extensive post-estimation diagnosis to test our model. We tested the model for multicollinearity using the variance inflation factor and detected none. We ran a Shapiro-Wilk test for residuals, and we couldn’t reject the null hypothesis which states that they are normally distributed. Finally, we used the Ramsey RESET to test for the specification of the model; results (0.048) are in the borderline and may suggest that there are some problems with the specification of the model. The model is better at detecting influence on the dependent variable and should not be treated as a predictive model. The model detects some critical links between variables and has acceptable predicting power (adj. R = 0.54). First of all, we found a strong influence of the firm’s age on financial leverage, which suggests that the older the firm is, the more leveraged it is. The results fit the theory and results of other studies. The second important conclusion is that the more liquid the company is, the less leveraged it is. The implication of that result may be that younger companies that are usually less leveraged tend to maintain a safe cash position and hold more cash within the company. Bigger companies may allow themselves to keep a relatively lower level of liquidity because they are able to raise cash faster if needed through the bank system. Therefore, we provide empirical evidence supporting our fourth and sixth hypotheses.
From our perspective, the most crucial results refer to the variables INNOV_INT and INNOVE_EXT. The p-value of those variables is at a low (10%), yet still statistically significant (see
Table 3). Firstly, INNOV_INT has a negative coefficient, which suggests that the more a company invests in an innovative in-house project, the less willing a bank sector is to finance it with debt. This provides empirical evidence supporting our second hypothesis and may be explained by the higher informational asymmetry generated by the R&D project, which probably translates to a higher cost of debt. Secondly, INNOV_EXT has a positive coefficient, which implies that the bank sector is willing to provide more external funds to companies acquiring innovation externally. We ascribe that result to the fact that external acquisition of technology/invention is perceived to be less risky and the final output more predictable. Again, we provide an argument supporting the third hypothesis. The results must be interpreted with caution, and the hypotheses need to be tested on high-tech companies from other emerging markets.
Unfortunately, we find no empirical evidence supporting the first and the fifth hypothesis. With regard to the firm’s size, this may be explained by the fact that the majority of companies are of moderate size. In the case of the intangibility parameter, we suppose that this parameter would be more important for companies in sectors other than high-tech. In our opinion, this matter needs further investigation.
5. Concluding Remarks
High-tech firms play an increasingly important role in the contemporary economy. Their growth is more dynamic than classical industries. Employment in high-tech industries has increased considerably, while other industries often record reductions in the number of employees. High-tech firms, especially NTBFs, are characterized by high risk, great information asymmetry, high agency and bankruptcy costs, and a great likelihood of deterioration in their financial standing, which makes access to external financing and, in particular, debt financing, more difficult.
The results of empirical studies allow for the verification of the second hypothesis which states that internal investments in innovativeness have a negative impact on the level of indebtedness in NTBFs, while external investments in innovativeness have a positive impact on the level of debt. These results can undoubtedly be attributed to higher information asymmetry and risk in financing new technologies generated internally as compared with innovations purchased on the market, the usefulness of which is well known and proven. It should be noted that internal investments in innovativeness are not always bound to succeed, and their output is very risky. Financial liquidity has an adverse effect on the level of indebtedness in the structure of financing, so companies with high liquidity and availability of their own funds rely on their own resources and, possibly, on debt financing (Hypothesis 4). Due to big market changes and changes in technologies, highly liquid NTBFs give preference to financing based on their own funds. Age has a positive impact on the share of debt in the capital structure (Hypothesis 6). Those NTBFs which are well established on the market and have long credit history and high reliability tend to rely on debt financing. This effect can be limited in NTBFs with excess liquidity. The impact of intangibility turns out to be statistically insignificant. This may result from the fact that the possession of intangible assets is not a necessary, sufficient or decisive factor in determining a decrease in debt financing. The size of NTBFs does not have a positive impact on indebtedness probably due to the fact that the analyzed sample comprises moderate-sized entities. The impact of profitability and growth potential is also limited. The impact of these factors on debt levels in NTBFs is probably diversified.
Polish NTBFs create their capital structure, which to a certain degree can be explained by the trade-off theory. This view can be justified by the positive impact of age and liquidity on the level of indebtedness, resulting in lower bankruptcy costs. The analyzed NTBF’s population also fits the agency theory because of the limited scale of business operations and relatively limited market experience. Pecking order theory applies to the analysis to a smaller degree—an impact of profitability, size, and risk on indebtedness is not visible. Polish NTBFs apply the following order of financing: retained earnings followed by share capital and debt financing.
The obtained results can be useful for high-tech firms, stock market investors, banks and standard setters. Without support offered by the government and various public institutions the development of NTBFs, especially in countries with a low level of innovativeness, can be hindered due to difficulties in acquiring necessary funds for expansion.
This paper attempts to narrow a theoretical gap in the area of capital structure creation and explore the impact of capital structure theory on the level of indebtedness in NTBFs in an emerging economy. We believe that the empirical verification of the impact of internally and externally generated investment in innovativeness, and the verification of the impact of other capital structure factors on NTFBs in emerging markets characterized by low innovativeness, can be regarded as a significant contribution to the research of the determinants of capital structure in NTBFs. In our opinion, there are not many research studies on emerging markets which empirically verify the determinants of NTBF capital structure, hence the need for further analyses.
The major limitations of this work include a relatively short period of research and a small number of analyzed NTBFs. Further analyses should comprise a larger number of countries and observations, as well as a longer period of study. Possibly significant determinants of NTFB capital structure include various corporate governance characteristics and macroeconomic and country-level factors.


