1. Introduction
Most publicly traded large companies issue both stock and corporate bonds. Fintech innovations have made it increasingly easier and cheaper for investors to buy and sell stocks, but not so much when it comes to bonds. For example, Robinhood was a pioneer in the Fintech space, with their mobile application platform that enabled investors to buy and sell stock without paying commissions. Other brokerages, such as Fidelity, Charles Schwab and JP Morgan Chase, followed suit, reducing their commission to zero.
On the other hand, corporate bond trading has not experienced similar innovation within the same time frame, and therefore, has not delivered high value-added returns for the small investor. One reason the corporate bond market remains in a state of stagnation is its lack of transparency. There is no large established exchange to trade corporate bonds, compared to how stocks are traded on the NYSE or NASDAQ. The majority of corporate bonds remain traded OTC, and a small portion of the USD 19 billion of the US corporate bond can be traded on the NYSE.
The opaque nature of the corporate bond market makes it an ideal environment for corruption; recently, some of the biggest banks, including Bank of America, JP Morgan Chase, Morgan Stanley and Goldman Sachs, have been implicated in an antitrust lawsuit that alleges that they conspired against small investors trading “odd-lot” corporate bonds.
Aside from the moral outrage stemming from the big banks colluding to reap ever greater profits, the opaque state of the corporate bond market would be of little interest to the small investor; but what if the corporate bond market holds unlocked value for investors seeking to increase the returns without increasing risk exposure?
Asset allocation determination has been thoroughly examined across the portfolio, with Markowitz’s portfolio theory introduced in 1950s by
Markowitz (
1952). While mean-variance optimization continues to be taught in business schools across the world, others have attempted to expand on Markowitz’s work (see
Simaan (
1997),
Yin and Zhou (
2004),
Zhu and Zhou (
2009) and more recently Asness, Frazzini and Pedersen (
Asness et al. 2012). Additionally, research into individual stock returns and their anomalies has been thoroughly documented by
Fama (
1972),
Fama and French (
2012),
Liew and Vassalou (
2000) and
Jegadeesh and Titman (
1993), as well as many others. In this work we examine the allocation process at the company-level. Namely, we are interested in the company-level asset allocation decision by a representative agent choosing investment weights across a company’s equity and corporate bonds. Prior research examining company equity and bond prediction (see (
Campello et al. 2008), (
Friewald et al. 2014) and
Anginer and Yıldızhan (
2017)) has documented mixed results. Others have focused on the contemporaneous relationship between stock and bond returns ((
Collin-Dufresne et al. 2001),
Kapadia and Pu (
2012), and (
Demirovic et al. 2017)).
Most investors are aware of the “60/40 rule”, which recommends allocating 60% of your investment portfolio to stocks and the remaining 40% to bonds. We wondered what results we would find when applying this 60/40 rule, not at the macro portfolio level, but at the micro company level. In other words, will the returns from applying the 60/40 rule in buying a company’s stocks and bonds outperform returns from buying an investment consisting entirely of a company’s stock? The origins of the 60/40 theory stem from work on the dedicated portfolio theory, which includes notable contributions from Leibowitz (see
Fabozzi (
1992),
Macaulay (
1938),
Hicks (
1939),
Koopmans (
1942)) and culminated in a 1952 paper by
Redington (
1952).
2. Materials and Methods
In our study, we limited our analysis to 30 large publicly traded companies that have available corporate bond issuances. Our corporate bond data comes from TRACE.
As of 2019, according to the Security Industry and Financial Markets Association (SIFMA), the US Corporate Bond market had over USD $9.6 trillion in issuance outstanding, making it a massive component of the capital markets. By assembling pricing data from the TRACE database, which provides publicly available historical corporate bond prices, we constructed a single-series per company. We employ these series to represent the performances of the companies’ corporate bonds. For ease of analysis, we have omitted the financial companies from our analysis and discovered results with important implications.
First, not surprisingly, at the company level, holding a portfolio of 60/40 results in a return stream that is less volatile than that of a 100% investment in the company’s stock. We therefore volatility-adjusted our 60/40 monthly returns to match the same volatility of the 100% stock investment. We also made several innocuous assumptions about leveraging; for this analysis, we assumed that we could borrow funds at 1% per annum so that we can volatility-adjust our 60/40 portfolio.
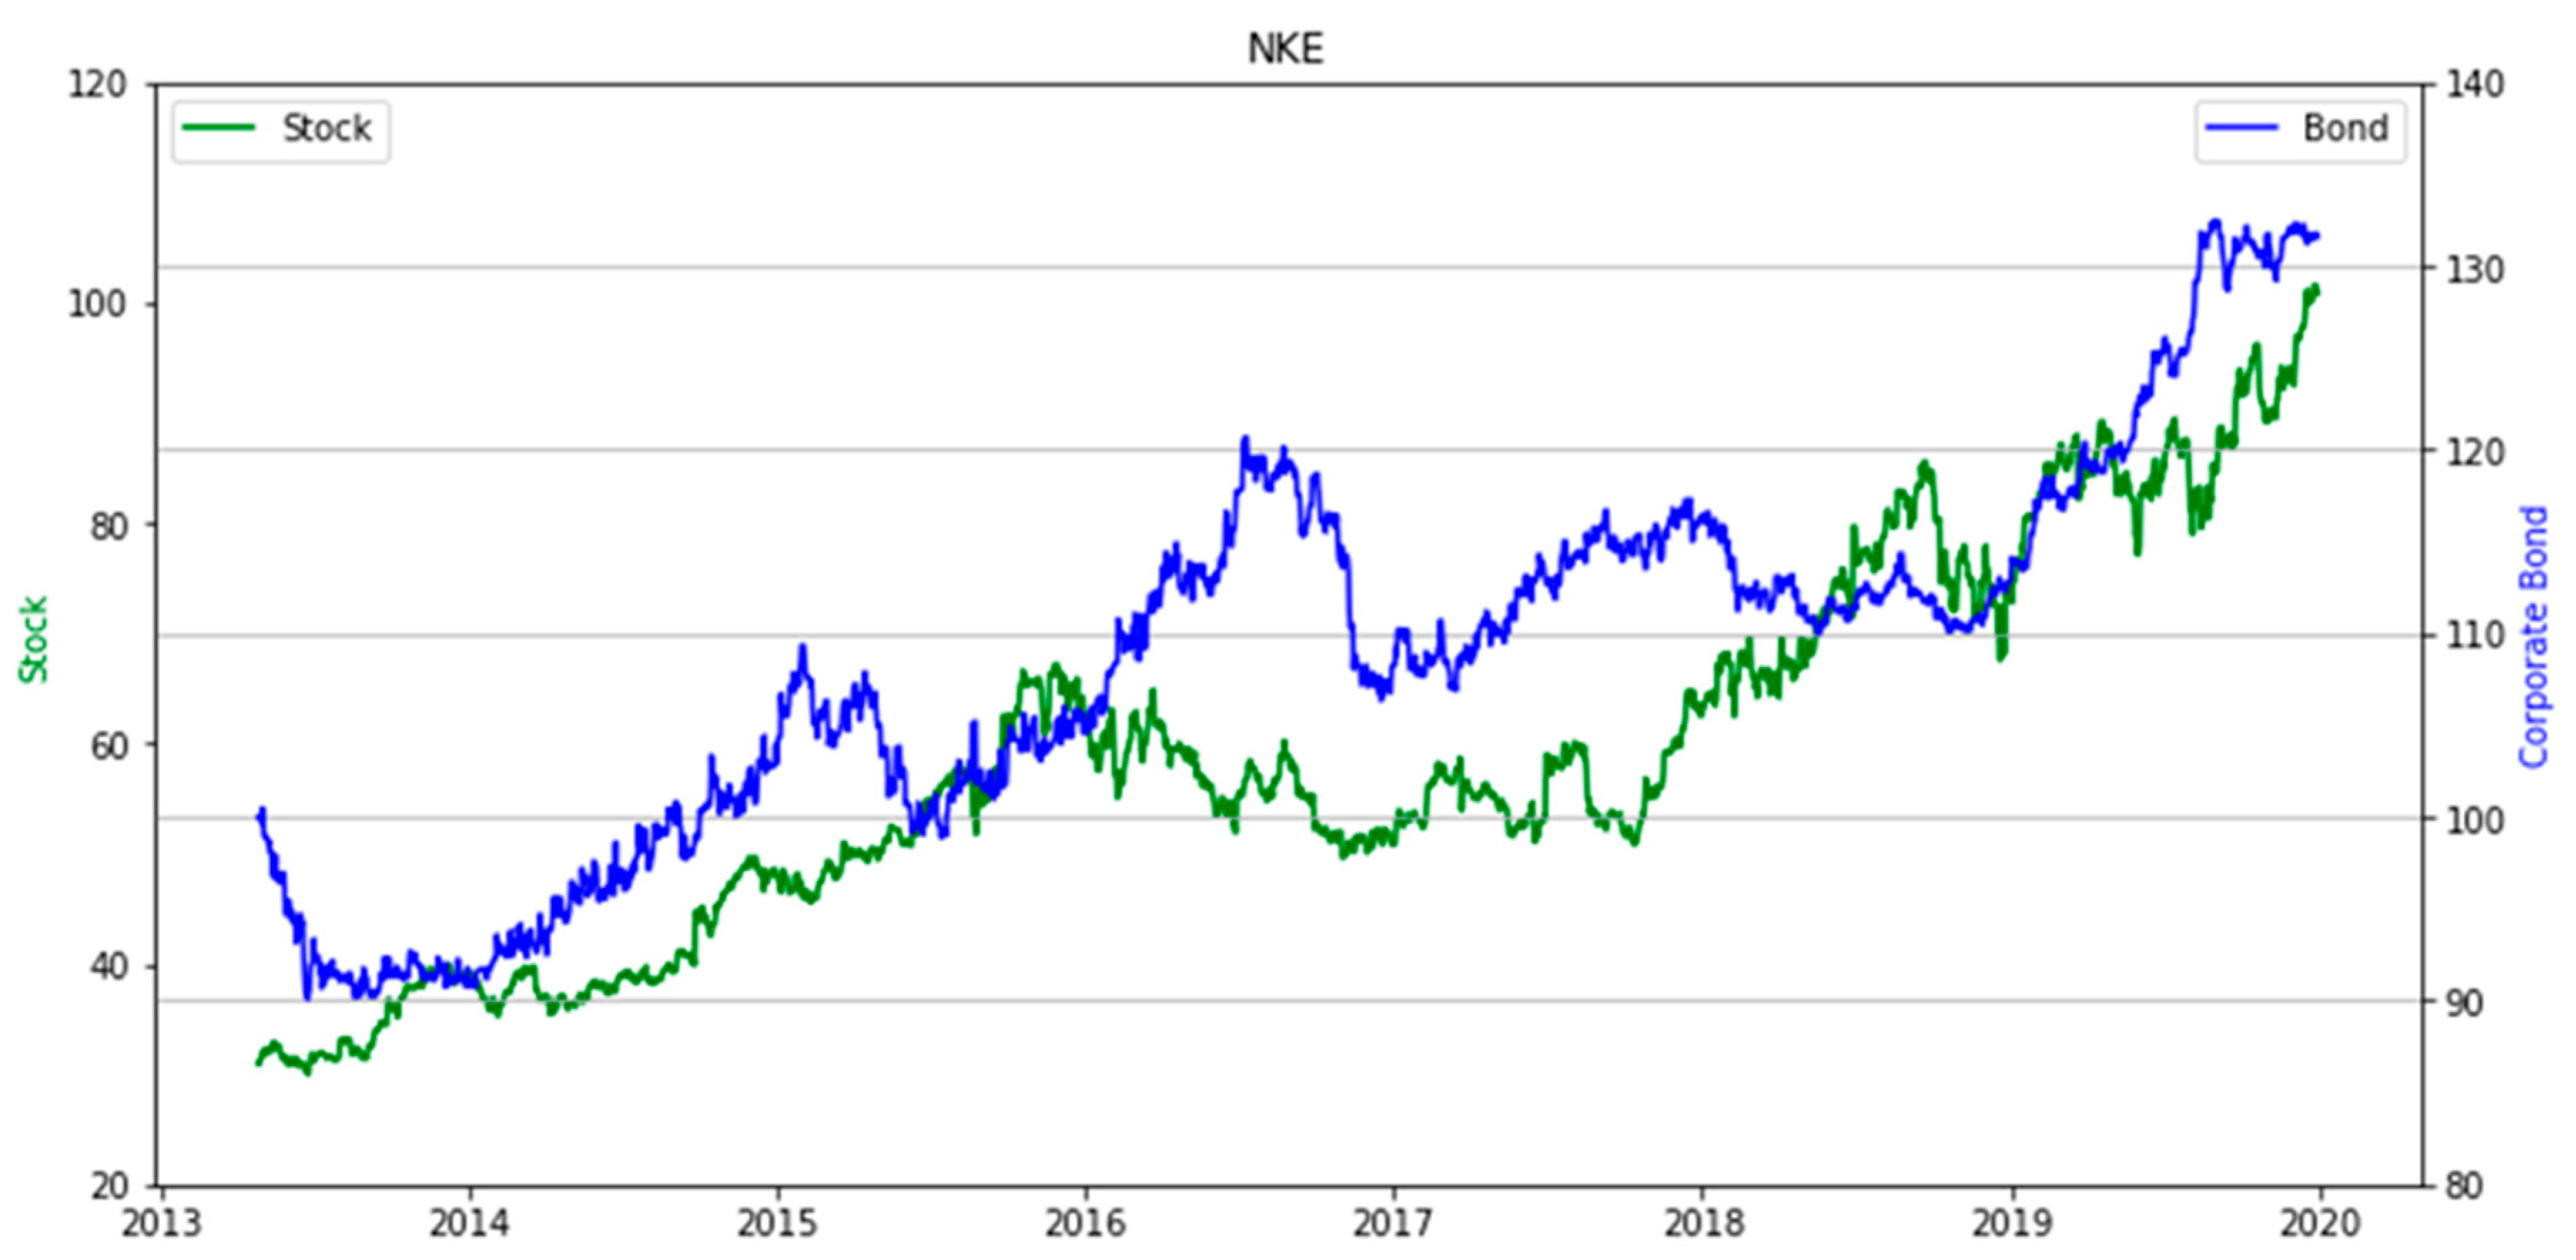
In order to illustrate this idea with a simple example, we analyzed one single company, Nike (NKE).
Figure 1 displays the average historical performance of all Nike bonds reported to TRACE and their equity price series. Both prices are drifting upwards over time. Over the period from April 2013 to December 2019, Nike had an annual performance of 19.4% for its stock and 4.4% for its corporate bonds, with standard deviations of 19.8% and 6.9%, respectively. The correlation between the stock and corporate bond returns was −0.03. Given the long-term positive drift in both the equity and bond side, coupled with the low correlation between the two series, we hypothesized that a portfolio of 60/40 will achieve the diversification benefits.
It is well known that the application of modest levels of leverage does not change the diversification profile of two investments. Bridgewater famously exploited this fact by leveraging US TIPs and provided these diversification benefits to institutional investors. We followed a similar approach, but at the individual company level.
3. Results
Below, in
Figure 2, we present a histogram of the 30 correlations paired with stock and corporate bond returns. We document that the diversification benefits do exist, given that a given company’s stock and corporate bonds are not perfectly correlated. The average correlation for the sample of companies was 0.07, with three-quarters of them in the range between 0.0 to 0.15.
Next, we compare two investments: (1) fully 100% into the stock, and (2) volatility-adjusted 60% into the stock and 40% into the corporate bonds.
A 60/40 portfolio generates a lower standard deviation of returns when compared to fully invested equity, and as such, we adjusted the volatility of the 60/40 portfolio to match that of the fully invested portfolio in equity. In order to increase the volatility of the 60/40 portfolio, we assume that we have access to leverage at a cost of 1% per year. To match the volatility of the stock, we notice that we need an average 1.65× levered position. See
Figure 3.
Finally, we plot the distribution of excess returns when we compare the volatility-adjusted 60/40 performance versus the corresponding full investment in the stock. We find that out of our 30 companies that we examined, only 1 had negative excess returns. The other 29 out of the 30 names were positive, with an average annualized excess return of 1.85%, and three-quarters were between 1.14% and 2.73%. Below, in
Figure 4, we document the empirical evidence that the historical annual excess returns for investments in 60/40 volatility-adjusted portfolios outperform the equity-only investment.
4. Conclusions
In conclusion, when we apply the 60/40 rule at the individual company level, we discover some exciting results. To our knowledge, we have not found other researchers that have examined the same combination of equity, corporate bonds and leverage in the manner that we have introduced in this work. While there have been many prior research efforts made into equities, corporate bonds, and equities and corporate bonds, our unique combination of volatility-adjusted 60/40 portfolios at the company-level provides a new empirical research branch. We believe this branch continues to extend the vast body of financial knowledge, and will lead to even more discoveries.
The most important takeaway from our work is that diversification benefits exist within the capital structure of a company. For our sample of 30 large-cap companies, equity returns had historically low correlations with corporate bond returns, therefore providing diversification benefits to investors holding both equity shares and corporate bonds in a company. In finding that bond positions have less volatility than equity positions, we further leveraged the resultant portfolio of 60/40 to match the equity volatility. Investors can now take advantage of intra-company diversification benefits, given that a company’s stock returns and corporate bond returns are not perfectly correlated. This is hopefully just one of many more Fintech innovations that we will discover, using this new paradigm of investing, for those seeking long-term advantages.


