Article

EU Stock Markets vs. Germany, UK and US: Analysis of Dynamic Comovements Using Time-Varying DCCA Correlation Coefficients

by
Oussama Tilfani
1,
Paulo Ferreira
2,3,4,*,
Andreia Dionisio
4 and
My Youssef El Boukfaoui
1
1
Faculty of Sciences and Techniques, Cadi Ayyad University, Marrakech 40000, Morocco
2
VALORIZA—Research Center for Endogenous Resource Valorization, 7300 Portalegre, Portugal
3
Instituto Politécnico de Portalegre, 7300 Portalegre, Portugal
4
Center for Advanced Studies in Management and Economics of the Universidade de Évora (CEFAGE), IIFA, Universidade de Évora, Largo dos Colegiais 2, 7000 Évora, Portugal
*
Author to whom correspondence should be addressed.
J. Risk Financial Manag. 2020, 13(5), 91; https://doi.org/10.3390/jrfm13050091
Submission received: 30 March 2020 / Revised: 23 April 2020 / Accepted: 4 May 2020 / Published: 7 May 2020
(This article belongs to the Special Issue Stock Markets Behavior)

Abstract

:
For this paper, we dynamically analysed the comovements between three major stock markets—Germany, the UK, and the US—and the countries of the European Union, divided into two groups: Eurozone and non-Eurozone. Correlation coefficients based on a detrended cross-correlation analysis (DCCA) were used, and the respective temporal variation was evaluated. Given the objective of performing a dynamic analysis, sliding windows were used in an attempt to represent short and long-term analyses. Critical moments in financial markets worldwide were also taken into account, namely the subprime debt crisis, the sovereign debt crisis, and Brexit. The results suggest that Germany and other Eurozone countries generally share high levels of comovements, although the Brexit decision reduced those connections. The subprime crisis also increases comovements among markets.

1. Introduction and Literature Review

Comovements among stock markets is a continuing and important topic in the financial literature, related with the phenomenon of stock market integration. Besides academic interest, it is worth mentioning the various impacts of stock market integration on welfare, consumption, and economic growth (see, for example, Obstfeld 1994; Kearney and Lucey 2004; Bekaert et al. 2005). This integration is also relevant given its effects on the increasing risk of shock transmission, since more integrated markets could amplify the effects of financial crises (see, for example, Bekaert et al. 2014).
With the occurrence of financial crises, the analysis of stock market comovements becomes more important, because these events can have a relevant impact on financial variables and cause increased financial contagion (Beine et al. 2010). Forbes and Rigobon (2002) found that contagion occurs when a given shock leads to an increased shift in assets’ comovements. Moreover, interest in studying times of turmoil is also related to the fact that complex systems, such as financial markets, reveal their characteristics better at those times than in normal conditions (Sornette 2003). In this work, we do not explore the contagion effect identified by Forbes and Rigobon (2002), since we do not consider a given event separating before and after that event, but we make a differential analysis to study how stock market comovements have evolved over time.
The literature contains many different methodologies to assess the linkages between assets, with both linear and non-linear approaches, which are usually taken for financial analysis purposes (see, for example, Gabriel (2012), for an application of several non-linear approaches to analyse volatility in the Romanian stock market). The literature also includes find static and dynamic analyses, with many approaches using time-varying models. Here, we present a brief overview of some recent papers devoted to the study of financial markets’ comovements in the Eurozone, focusing on this particular phenomenon and on contagion. The research on this topic indicates, in general, that Central European countries share high levels of connection, with lower levels in the case of peripheral ones. Moreover, changes in behaviour occur at times of financial crisis. For example, Berben and Jansen (2005) not only analysed correlations between stock returns but also performed an industry level analysis. Using generalized autoregressive conditional heteroskedastic (GARCH) models and by applying time-varying analysis, they found that correlations between Germany, the UK, and the US more than doubled, and the correlations remained similar for the other market studied, the Japanese one. The results were similar at a sectorial level, despite the fact that the moment of the shift was not equally defined for the different countries and sectors. In a paper using a long sample (from 1973 to 2004) for the US, the UK, Germany, and Japan, Morana and Beltratti (2008) found evidence of progressive integration defined by the increase of comovements, with particular incidence in the linkage between the US and Europe. Bekaert et al. (2013) studied the process of economic and financial integration in the EU, concluding that there was an increase of integration in those countries. Curiously, when several countries adopted a common currency, this did not have the same effect. Virk and Javed (2017) employed a variation of the dynamic conditional correlation to study the integration patterns of several European countries against Germany and found that small countries are more linked with Germany in the short run. Lyócsa et al. (2019) made a broad study using a sample of 40 stock indices to analyse the connectedness of those markets using a network, and they showed that geographical proximity, defined by the temporal proximity of closing hours in the stock markets, is relevant for propagation purposes.
Despite the widespread use of linear approaches such as Pearson correlations, vector of autocorrelation models (VAR models), and Granger causality, financial markets have nonlinearities, self-similarities, non-stationarity, and other issues such as non-heterogeneity (see, for example, Wang et al. 2012; Valls 2012; Ayub et al. 2015; Martin-Montoya et al. 2015).
Though with a different methodology from the one used in this paper, Dajcman et al. (2012) also applied a time-varying and a multiscale approach considering some EU countries. With a dynamic conditional correlation-generalized autoregressive conditional heteroskedastic (DCC-GARCH) and a wavelet analysis, the authors found that the global financial crisis increased comovements but did not do so uniformly across markets and time scales, although the shift was just temporary. Raileanu-Szeles and Albu (2015) applied nonparametric methods and analysed financial integration in the EU from 2000 to 2013. The authors found a significant impact of the subprime crisis, concluding on declining integration in the long-term. Globan and Soric (2017) analysed the degree of financial integration in the EU and Eurozone using Euler equation tests. The analysis was done for several assets (bond, stock, and money markets) in the period of 1994–2014, while also studying the pre-crisis period; they found that the old EU members had higher integration levels than newer member states. The authors concluded that the crisis inverted this trend.
In order to assess the effect of financial crises, most studies have analysed the effect of the subprime crisis. For example, Dimitriou et al. (2013) studied contagion effects as a consequence of the global financial crisis based on a dynamic conditional correlation derived from autoregressive conditional heteroscedasticity models in the case of the BRICS (Brasil, Russia, India and China). The results showed that these markets were not affected by contagion, and comovements with the US stock market increased. Burzala (2016) used a spectral analysis to verify the occurrence of contagion caused by the global financial crisis of 2007–2009. This work performed on a set of European stock markets (Germany, France, the UK, and Poland) indicated that respective returns reacted simultaneously, suggesting the existence of interdependence in those markets. More recently, Apergis et al. (2019) investigated whether contagion occurred during the subprime crisis by testing changes in correlation, co-skewness, co-kurtosis, and co-volatility. The findings suggested significant evidence of contagion mainly for higher order moments. Specifically for Central and Eastern European (CEE) countries, which are also analysed in our work, Syllignakis and Kouretas (2011) employed multivariate approaches to analyse time-varying conditional correlations for the period between 1997 and 2009, and they found that the US and German stock markets saw their comovements increase with CEE countries, meaning that those markets were more exposed to shocks from those countries.
Other papers have analysed how the Eurozone financial crisis had an impact on financial markets. Samitas and Tsakalos (2013) used copula functions and asymmetric dynamic conditional correlation (ADCC) to investigate correlation dynamics between Greek and other European stock markets (Italy, France, Greece, Spain, Portugal, and the UK) during the sovereign debt crisis. The results showed contagion during the subprime crisis, though the contagion effect was not detected in the Eurozone debt crisis. Specifically for the Eurozone countries, Grammatikos and Vermeulen (2012) analysed the impact of both financial crises (global and European debt); using several different indices (financial and non-financial), the authors found transmission from the financial sector to non-financial sectors. Moreover, the authors found that financial indices became more dependent after the global financial crisis. Allegret et al. (2017) analysed the impact of the European debt crisis on bank equity returns for 15 European countries; based on a multifactor equity return and smooth transition regression, which could identify shift contagion due to parameter changing, a negative impact of the crisis on European banks’ equity returns was found, while US banks were found to benefit from that crisis. Niţoi and Pochea (2019) applied a dynamic conditional correlation methodology to analyse comovements between EU stock markets, and they found differences in the linkage between markets according to countries’ different stages of development. In particular, these authors found that economic similarities given by similar behaviour in macroeconomic variables explained different paths of comovements, although during crises, that explanation was not s clear. Niţoi and Pochea (2020) added to the analysis the effect of investors’ sentiment, identifying that this is an important factor that goes towards explaining increasing comovements during crises.
Regarding the impact of the Brexit referendum on stock markets, Burdekin et al. (2018) analysed the effects of the referendum result in a wide set of countries, finding that this decision caused some turmoil in stock markets, with high (and expected) intensity in the Eurozone but especially in countries with higher levels of debt.
The way policy-makers act at times of turmoil could have a direct impact on economies. In this context, the work of Papadamou et al. (2019a, 2019b, 2020) analysed how unconventional monetary policies affect macroeconomic variables and found that those policies affect output and prices differently but also have linkages with stock markets. In particular, Papadamou et al. (2019b) identified that US unconventional monetary policies had significant and greater effects on more developed economies, although the effect was also visible in emerging markets (albeit less intensive). These results highlighted the importance of a whole set of variables in how stock markets commove between each other.
The use of detrended cross-correlation analysis (DCCA) is common in the literature on financial markets, as is the respective correlation coefficient. In the particular case of stock markets, some studies have analysed comovements between different stock markets, e.g., China and surrounding markets (Ma et al. 2014), the Middle East and North Africa (El Alaoui and Benbachir 2013), China and the US (Shi et al. 2014), and Portugal and Brazil (Ferreira 2017). Other studies have analysed the variation of DCCA correlation coefficients over time, e.g., those of da Silva et al. (2016), Wang et al. (2017), and Mohti et al. (2019).
Despite the vast amount of literature devoted to this topic, some of it using the DCCA correlation coefficient, this work combined that correlation coefficient with a sliding windows approach, allowing us to have a time-varying feature. Specifically, our proposal measured the evolution of the multiscale DCCA correlation coefficient over time for a large set of stock market indices, namely all European Union (EU) countries. We analysed the comovements with Germany, the UK, and the US. Consequently, we were able to see if EU stock markets behaved differently from those main markets. The German and British markets were chosen because these countries are drivers of European economy, politics, and social development, and both have important (but different) roles in the sovereign debt crisis and the Brexit referendum, events that caused some turmoil in stock markets; the US stock market was chosen because of its importance in the world and also because it was at the origin of one of the most severe crises in the recent past.
Another interesting feature of the markets used in this paper is the fact that in the EU, we have a set of countries that share a common currency, the Euro, and others with their own currencies. We evaluated if the pattern of comovements was similar or different according to this particular feature.
Our main contribution lies in the use of time-varying DCCA cross-correlation coefficients, which enabled us to study stock market evolution over time, i.e., to assess to what extent comovements in the EU evolved and how this was affected by crises or specific shocks. In particular, we analysed the effects of the subprime crisis, the sovereign debt crisis, and the Brexit referendum. Following the proposal of Guedes et al. (2018a, 2018b), the significance of the previously identified evolution of stock market comovements was assessed. Because we used a multiscale approach, we also had this multiscale vision of the market, distinguishing between short and long-term behaviour. According to Peters (1994), investors’ heterogeneity is the cornerstone of the fractal market hypothesis (FMH). This FMH states that investors make use of information, interpreting it according to their personal objectives, a feature that ensures the existence of market liquidity. The interest in FMH as a theoretical framework has increased in recent years because it rejects the implications of the efficient market hypothesis (EMH) introduced by Fama (1970).
The results of this study are important not only for actual and potential investors but also for policy-makers. Our main results corroborated previous findings about this topic in the literature and showed high levels of comovements, especially among Eurozone countries, with Germany and the UK showing some decrease in those comovements with the UK after the sovereign debt crisis and Brexit. Comovements with the US are also significant for the majority of countries, with some decline after the subprime crisis.
The remainder of this paper is as follows: Section 2 presents the data and methodologies used. Section 3 presents the results. Finally, Section 4 presents the discussion and some concluding remarks.

2. Methodology and Data

As already defined, our purpose was to identify how comovements of each EU stock market evolved in relation to the German, British, and American stock markets. DCCA correlation coefficients (measuring the extent of these comovements) and a time-varying approach (which analyses the evolution, over time, of the estimated correlations) were applied. Moreover, because in our sample we had some crisis episodes (namely subprime and the euro debt) and the specific event of the Brexit referendum, the effect of these shocks/events could be assessed.
The methodological basis of our approach was the DCCA, which is used to calculate long-range cross-correlations between two time series x t and y t , with the same length N, starting by calculating the integration of both time series (i.e., x ( t ) = k = 1 t x k and y ( t ) = k = 1 t y k ), followed by the division of both series into N-n boxes of length n. After this, a linear local trend is calculated with the ordinary least squares for each box ( x ˜ k and y ˜ k ), and this trend is then used to detrend previous series. Then, for each box, f D C C A 2 = 1 n 1 k = i i + n ( x k x ˜ k ) ( y k y ˜ k ) , which is the covariance of the results, is calculated, thus allowing for the calculation of the detrended covariance given by the sum of f D C C A 2 for all boxes of size n and given by F D C C A 2 ( n ) = 1 N n i = 1 N n f D C C A 2 . After repeating the process for all the existing length boxes, a log-log regression between the DCCA fluctuation and n is performed, resulting in F D C C A ( n ) n λ , with the λ measuring the long-range correlation. For more details, see the original work of Podobnik and Stanley (2008).
Based on the DCCA, Zebende (2011) built one correlation coefficient that is able to quantify cross-correlation levels across time scales between two different time series. This approach, which can capture correlation coefficients even if time series are non-stationary, combines the DCCA with the detrended fluctuation analysis (DFA) of Peng et al. (1994). The DFA, used to measure the dependence of an individual time series, is based on a similar relationship to that of the DCCA, in this case relating the detrended variance function F D F A ( n ) and the time scale n.
The DCCA correlation coefficient proposed by Zebende (2011) is defined as:
ρ DCCA ( n ) = F 2 D C C A ( n ) F D F A { x i } ( n ) F D F A { y i } ( n ) ,
and is a scale-dependent correlation coefficient. This scale dependence feature is an advantage of ρ DCCA as well as its efficiency, even in the case of non-stationarity in time series (Kristoufek 2014a, 2014b). Moreover, it has the desired property of being 1 ρ DCCA ( n ) 1 . Aiming to test the significance of the correlation coefficients, we used the 95% confidence level critical values found in the work of Podobnik et al. (2011).
For the estimation of ρ DCCA we used filtered time series from a conditional variance with a GARCH(1,1), ht, aiming to reduce possible volatility bias and using the following transformation:
r t , f = r t / h t ,
(see Cajueiro and Tabak 2004b; Horta et al. 2014; Kristoufek 2012).
The methodology previously explained allowed us to calculate the DCCA correlation coefficients for a given sample. However, one of our objectives was to analyse the evolution of the DCCA correlation coefficients over time. For this purpose, a sliding windows approach was applied for the calculation of the correlation coefficients in order to provide a continuous view of the evolution of the multiscale correlation among stock markets. This is a new approach, presented in the paper by Tilfani et al. (2019b) and extended here to study the effect in the EU stock markets. As in that paper, we used a windows size of 1000 observations (about 4 years), with each step equivalent to one day (correlation coefficients based on windows of 500 were also calculated, with qualitatively similar results).
The literature contains many examples of the use of sliding windows applied to other methodologies, such as for the estimation of local Hurst exponents, (Cajueiro and Tabak 2004a, 2004b, 2006, 2008; Ferreira 2018; Kristoufek 2012, among others). The combination of sliding windows and DCCA correlation was introduced by Tilfani et al. (2019a) to study Central and Eastern European stock markets’ comovements. Thus, this approach allowed us to meet the double objective of analysing the comovements in European countries and to assess the effect of specific shocks, such as crises or specific events, on those comovements.
With this approach, we could dynamically analyse correlation coefficients. As each correlation coefficient gave us information about the comovements at that particular moment, and as we had the coefficients’ evolution, we could evaluate the evolution of the comovements over time. Thus, based on the proposal of da Silva et al. (2016), we calculated Δ ρ DCCA ( n ) = ρ DCCA t ( n ) ρ DCCA t 1000 ( n ) . According to Guedes et al. (2018a, 2018b), the significance of that variable can be tested:
H 0 :   Δ ρ DCCA ( n ) = 0
H 1 :   Δ ρ DCCA ( n ) 0
The critical values for this test can be found in Guedes et al. (2018a, 2018b).
Regarding data, in this paper, we used information for the 28 EU stock markets plus information about the US stock market. Some indices have different sample sizes, with most of them starting at the beginning of 1999 and all of them ending on 12 April 2019, with a total of 5290 observations. Due to data constraints, the Cypriot stock index has 3810 observations, the Latvia and Lithuania index has 5029, the Slovenia index has 3400, and the Bulgaria index has 4820. This large time set allowed us to evaluate the evolution of the comovements over time and to assess the effects of different extreme events. Table 1 summarizes the information of the indices used.
Recently, we found some discussion about data frequency, since different results depend on the data frequency used (see, for example, Narayan and Sharma 2015). However, as stated by Bannigidadmath and Narayan (2016), the use of high frequency data, such as the comparison between daily and monthly, is desirable because it gives richer information.

3. Results

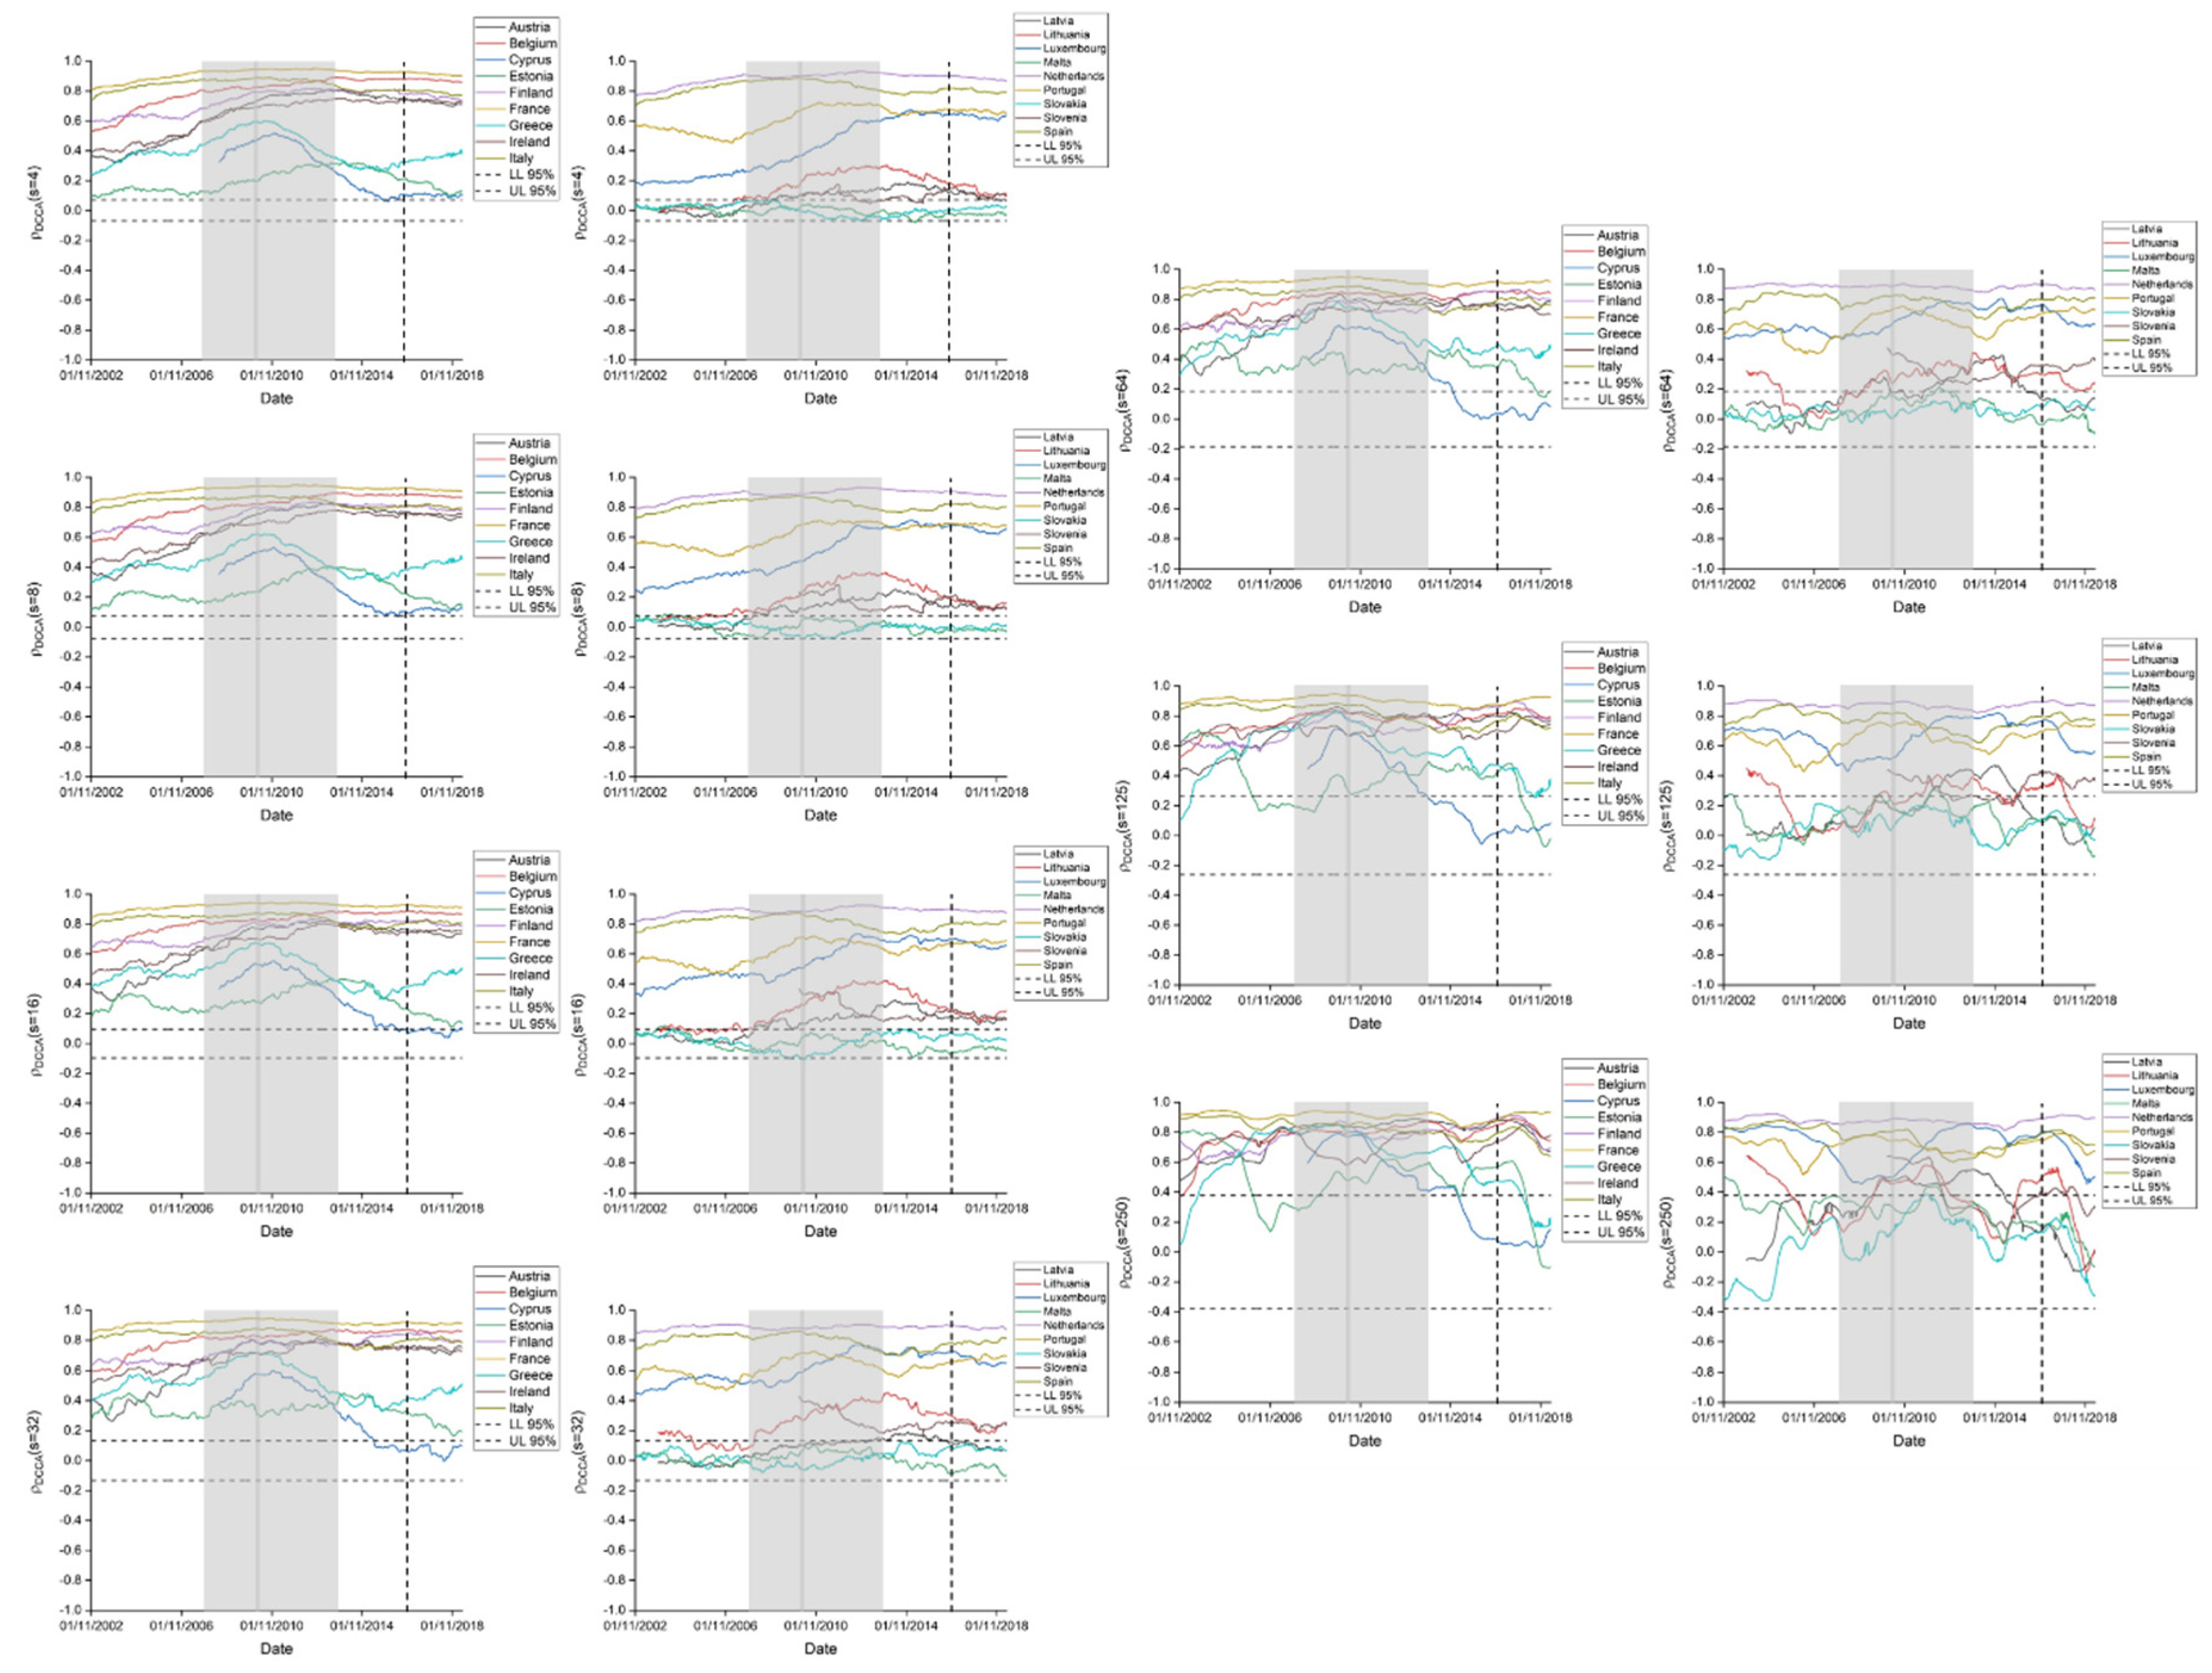
3.1. Evolution of the DCCA Correlation Coefficients over Time

In order to dynamically evaluate the comovements between EU stock markets and three the different stock markets of Germany, the UK, and the US, we started by calculating the ρ D C C A between each of the EU stock markets, separated in Eurozone and non-Eurozone countries, against the Germany, the UK, and the US stock markets. Figure 1, Figure 2, Figure 3 and Figure 4 show the results for time scales of 4, 32, and 250 days for a window size of 1000 observations for Eurozone countries, while Figure 4 shows the same information for non-Eurozone countries. The shaded areas correspond to different crises (subprime and sovereign debt crises). The end of the subprime crisis coincided with the beginning of the sovereign debt one, with darker shading in that period (Fry-McKibbin et al. 2014; Ferreira et al. 2016). The figures also include the moment of the Brexit referendum, with a vertical bar. LL and UL are the critical values used to test the existence of a statistically significant correlation coefficient, i.e., the lower and upper limits, respectively, of the confidence interval. In this case, the presence of a coefficient between LL and UL means that the correlation was not significant. On the contrary, if the correlation coefficient stays outside the bounds of LL and UL, it means that calculated correlations were significant.
Appendix A presents the estimations for several time scales (4, 8, 16, 32, 64, 125, and 250), between Eurozone and non-Eurozone stock markets and Germany (Figure A1 and Figure A2). Appendix B (Figure A3 and Figure A4) presents the results for a smaller window length (w = 500) for the German case and can be used for comparison purposes (concluding on the qualitative similarity of the results, although the coefficients for windows of w = 500 were more unstable, which could have been caused by the smaller size of each window). Due to space constraints, the relationships of EU stock markets and other major stock markets can be provided on request.
Figure 1, Figure 2 and Figure 3 show the results for the DCCA correlations between Eurozone countries and Germany, the UK, and the US, respectively.
As we can see, Germany showed higher linkage with Central European economies, which is consistent with previous work (see, for example, Ferreira et al. 2016). Moreover, we found evidence of decreased connection in economies such as Greece and Cyprus after the sovereign debt crisis. Considering that the Greek economy was probably the most affected by this crisis and that Cyprus also suffered huge effects, these results were not surprising. In the long-run analysis, there was a decline in comovements for the majority of stock markets after the sovereign debt crisis and then after Brexit.
The correlation of Eurozone stock markets with the UK was not substantially different from that presented by Germany. In the short run, there was no evidence of integration with Slovakia, Malta, and Slovenia. There were strong connections with Central European economies. Besides this, the comovement levels were relatively stable for most stock markets. The results of higher time scales showed a decrease in comovements after the sovereign debt crisis and again after Brexit. The results were quite understandable and expected, (see for example, Guedes et al. 2019). In fact, the UK is an extremely important economy for the Eurozone, and the consequences of crises or important events involving this country are important for Europe as a whole.
As for the correlation between Eurozone stock markets and the US, we should note that despite the globally significant levels of comovements, they were lower than the ones with Germany and the UK, which can be explained by the geographical and economic proximity of the markets. In the short run, there was some stability of relations, with the correlation with Slovakia, Malta, and Slovenia being non-significant. In the long run, there was increased linkage after the end of the subprime crisis and at the beginning of the sovereign debt crisis, as well as a decrease after the end of the latter crisis and after Brexit.
The correlations of Germany, the UK and the US with non-Eurozone stock markets are presented in Figure 4 in the left, middle, and right panels, respectively.
The results for Germany pointed to higher levels of comovements with older EU members like Denmark, the UK, and Sweden. Romania and Bulgaria did not show evidence of integration before the subprime crisis, but there was subsequently an increased linkage with that particular market. In the long run, countries like Romania, Bulgaria, and Croatia had little or no evidence of significant correlations. This was in line with the results of other work (see, for example, Ferreira and Dionísio 2015; Ferreira et al. 2016). It is worth noting that after Brexit, there was a tendency towards a decrease in comovements for the majority of countries.
The UK had similar results to the German stock market, without sign of significant correlations with Romania and Bulgaria, and, in the long run, the existing connections decreased significantly after the referendum.
The results between the US and non-Eurozone stock markets were also similar to the German results. In the short run, Bulgaria and Romania showed no significance before the subprime crisis. In the long run, a significant decrease after the subprime crisis was noted in most countries.
Through comparison, we observed there are no significant differences in Eurozone and non-Eurozone stock markets’ relation with Germany, the UK, and the US. The obtained values pointed to Germany as being the main influencer in EU countries globally. This result was perfectly understandable, given the economic, financial, and strategic importance of Germany in the EU.
We also observed scale dependence patterns in the case of Luxembourg. For example, for a short-term horizon (n = 4), even if the DCCA correlation was significant, we observed low levels at the beginning ( ρ D C C A ( 4 ) 0.2 ) that increased to 0.6 at the end of the sample. For a medium-term horizon (n = 32), we observed a higher level of DCCA correlation ( ρ D C C A ( 32 ) 0.4) that still increased to reach 0.75 at the end of the sample. Finally, for long-term horizons (n = 250), we observed a decreasing trend in correlation levels during the subprime crisis and after the Brexit referendum, a clearer trend when observing results against the UK and the USA. Those results supported the FMH, which states that investors’ behaviour is heterogeneous and can be taken into consideration by investors looking for international portfolio diversification.

3.2. Dynamic Stock Market Comovements

With the dynamic information of ρ DCCA allowing for the verification of the evolution of comovements between markets over time, we estimated Δ ρ DCCA ( n ) , according to da Silva et al. (2016). This Δ ρ DCCA can be seen as an indicator of increasing/decreasing integration between two different moments. Because the sliding windows were calculated with 1000 observations, values of Δ ρ DCCA ( n ) with that distance were also considered, resulting in an assessment of the variation of stock market comovements for a period of around four years. Figure 5, Figure 6 and Figure 7 show the evolution of comovements between Eurozone stock markets and Germany, the UK, and the US, respectively, while Figure 8 shows the same information for non-Eurozone countries. Once again, shaded areas represent both crisis periods, and the vertical line represents the Brexit referendum. The critical values used were the ones of Guedes et al. (2018a, 2018b). Note that in this case, both upper and lower levels were very near, so it could be difficult to distinguish between them in the figures. The whole set of time scales between the two groups of EU countries and Germany are presented in Appendix C (Figure A5 and Figure A6).
The analysis of dynamic comovements of Eurozone stock markets with Germany is presented in Figure 5. The results pointed to statistical evidence of differential comovements for all countries, with a major decrease after the subprime crisis. In the long-run analysis, there was also evidence of such a decrease after Brexit.
Some of those results were common to other studies stating that after a given shock, markets’ comovements are reinforced (see, for example, Ang and Chen 2002; Ang and Bekaert 2002) or a correlation breakdown occurs, meaning that gains from diversification can be undermined in a period of turmoil (see Bertero and Mayer 1990; Calvo and Reinhart 1996; Phylaktis and Xia 2009). The new finding was that after the Brexit referendum, comovements mainly decreased in the long-term. As the FMH states, long-term investors are those belonging to fundamentals. As Brexit was not an ordinary shock but a process that caused a slowdown in the world’s financial markets, the comovements consequently slowed down.
The UK results did not differ very much from those of Germany (Figure 6), although there was an increase in the levels of differential comovements after Brexit, especially with Slovenia and Luxembourg. The dynamic correlation between the Eurozone stock markets and the US was stable in the short run for the majority of countries under analysis, with a decrease after the sovereign debt crisis and an increase after Brexit (Figure 7).
The dynamic analysis of the comovements of non-Eurozone stock markets with Germany is presented in Figure 8 in the left panel. The results did not differ from the results obtained for Eurozone countries. We note the existence of statistical evidence that comovements changed with all countries, being positive till the beginning of the sovereign debt crisis. In the long-run analysis, there was evidence of some increase in this dynamic correlation after Brexit.
In the central panel of Figure 8, we show the results for the UK and non-Eurozone stock markets. The results were quite similar to those obtained for Germany, with positive differences till the sovereign debt crisis and negative thereafter, along with some attempt to increase after Brexit.
The US results, once again, did not differ greatly from the results obtained for Germany and the UK. There was an increase of the differential correlation until the subprime crisis, being negative after the sovereign debt crisis and showing some attempt to increase after Brexit (Figure 8, right panel).

4. Discussion and Concluding Remarks

In the present research, the objective was to dynamically analyse the comovements between the three major stock markets of Germany, the UK, and the US, as well as the countries of the European Union, divided into two groups: Eurozone and non-Eurozone. In order to perform such an in-depth and detailed analysis, the DCCA correlation coefficient was applied, and then the respective temporal variation was evaluated. Given the objective of performing a dynamic analysis, sliding windows were used in an attempt to represent short and long-term analysis. Critical moments in financial markets worldwide were also taken into account, namely the subprime and sovereign debt crises and the Brexit referendum.
The results suggested high levels of comovements between Germany and the Eurozone countries, with a declining path with Greece and Cyprus following the sovereign debt crisis. In the long run, however, there was a decrease in comovements after the Brexit result. These results were similar to the comovements between Germany and non-Eurozone countries, with the highest levels being presented for the older EU countries, namely Denmark, the UK, and Sweden. The results were somewhat surprising, as comovements with EU countries were expected to be strengthened after the Brexit referendum. This is because, as expected, there was a looser connection between the UK and the other EU countries after the referendum, especially in the long run analysis. We also noted that linkages with the US did not benefit from some of the European events that have led to a decrease in comovements.
Overall, we conclude that the subprime crisis may have boosted comovements over the three analysed markets, but the decreases after the sovereign debt crisis and Brexit referendum point to a further distancing of these stock markets from EU countries, whether Eurozone or non-Eurozone stock markets.
The results about comovements in the EU are important because they could have an impact on EU countries’ future decisions. For example, to enhance the benefits of belonging to the EU in general and to the common currency in particular, countries should have higher levels of financial integration, for which the level of comovements could be used as a proxy. The heterogeneity of those levels could mean that some countries (the least integrated ones) would not be able to exploit all the opportunities of belonging to a common economic area such as the EU.
Secondly, in the potential case of countries deciding to adopt the common currency, it is crucial for those countries to have high levels of financial integration with their partners, not only to be able to maximize benefits but also to minimize the possible risks of entering a common currency without a completed financial integration process.
Finally, the Brexit referendum and its consequences in the comovement levels of the British stock market are also important. As we can see, the Brexit decision affected the linkage between markets, but comovement levels remained high with EU countries. This means that stock markets remained connected, and, as such, are still exposed to price shocks.
Our results confirmed the evidence of prior studies, e.g., Virk and Javed (2017), Niţoi and Pochea (2019, 2020), as already identified. These studies employed variations of the dynamic conditional correlation, allowing for time-varying behaviour and finding that proximity and the different degrees of countries and financial markets’ development are relevant in explaining different degrees of comovements. Though those studies used other kinds of information, e.g., macroeconomic variables or investors’ sentiments, to analyse comovements, the results were not so different from ours.
The constant evolution of the connections between stock markets could have important consequences for different market participants. For example, the change in correlations has an impact on optimal portfolios because it affects the way some assets could be used for diversification purposes. As correlations increase between certain markets, those markets will be most exposed to possible shocks, with it being desirable, for diversification purposes, that other less correlated indices become more important. With our results, emerging stock markets could take an important role, although we could expect their behaviour to be close to more developed markets.
For policy-makers, the information about comovements is also relevant, mainly if comovements are greater now than in the past. As previously mentioned, an increase in comovements implies higher exposure, which would be crucial information in the future because it could also imply a higher risk of contagion.
The confirmation of Brexit and studying the connectedness of those markets are important features to understand the possible economic effects and risks for the stock markets involved, making it important to continue analysing this topic in the future.

Author Contributions

Conceptualization, O.T., P.F., A.D., and M.Y.E.B.; methodology, O.T., P.F., A.D., and M.Y.E.B.; formal analysis, O.T., P.F., A.D., and M.Y.E.B.; writing—original draft preparation, O.T., P.F., A.D., and M.Y.E.B.; writing—review and editing, O.T., P.F., A.D., and M.Y.E.B. All authors have read and agreed to the published version of the manuscript.

Funding

P.F. and A.D. are pleased to acknowledge financial support from Fundação para a Ciência e Tecnologia (grant UIDB/04007/2020). P.F. also acknowledges the financial support of Fundação para a Ciência e a Tecnologia (grant UIDB/05064/2020).

Conflicts of Interest

The authors declare no conflict of interest.

Appendix A

Figure A1. Evolution of ρ DCCA between Eurozone stock markets and Germany (time scales of 4, 8, 16, 32, 64, 125, and 250 days with a window size w = 1000). LL and UL are, respectively, the lower and upper limits of the confidence interval. Shaded areas represent the global financial crisis and the Eurozone debt crisis. The vertical dashed line refers to the moment of the Brexit referendum.
Jrfm 13 00091 g0a1
Figure A2. Evolution of ρ DCCA between non-Eurozone stock markets and Germany (time scales of 4, 8, 16, 32, 64, 125, and 250 days with a window size w = 1000). LL and UL are, respectively, the lower and upper limits of the confidence interval. Shaded areas represent the global financial crisis and the Eurozone debt crisis. The vertical dashed line refers to the moment of the Brexit referendum.
Jrfm 13 00091 g0a2

Appendix B

Figure A3. Evolution of ρ DCCA between Eurozone stock markets and Germany (time scales of 4, 8, 16, 32, 64, 125, and 250 days with a window size w = 500). LL and UL are, respectively, the lower and upper limits of the confidence interval. Shaded areas represent the global financial crisis and the Eurozone debt crisis. The vertical dashed line refers to the moment of the Brexit referendum.
Jrfm 13 00091 g0a3
Figure A4. Evolution of ρ DCCA between non-Eurozone stock markets and Germany (time scales of 4, 8, 16, 32, 64, 125, and 250 days with a window size w = 500). LL and UL are, respectively, the lower and upper limits of the confidence interval. Shaded areas represent the global financial crisis and the Eurozone debt crisis. The vertical dashed line refers to the moment of the Brexit referendum.
Jrfm 13 00091 g0a4

Appendix C

Figure A5. Evolution of the Δ ρ DCCA between Eurozone stock markets and Germany for time scales of 4, 8, 16, 32, 64, 125, and 250 days, considering that Δ ρ DCCA ( 1 ) = ρ DCCA ( 1001 ) ρ DCCA ( 1 ) . LL and UL are, respectively, the lower and upper limits of the confidence interval. Shaded areas represent the global financial crisis and the Eurozone debt crisis. The vertical dashed line refers to the moment of the Brexit referendum.
Jrfm 13 00091 g0a5
Figure A6. Evolution of the Δ ρ DCCA between non-Eurozone stock markets and Germany for time scales of 4, 8, 16, 32, 64, 125, and 250 days, considering that Δ ρ DCCA ( 1 ) = ρ DCCA ( 1001 ) ρ DCCA ( 1 ) . LL and UL are, respectively, the lower and upper limits of the confidence interval. Shaded areas represent the global financial crisis and the Eurozone debt crisis. The vertical dashed line refers to the moment of the Brexit referendum.
Jrfm 13 00091 g0a6

References

  1. Allegret, Jean-Pierre, Hélène Raimond, and Houda Rharrabti. 2017. The impact of the European sovereign debt crisis on banks stocks. Some evidence of shift contagion in Europe. Journal of Banking & Finance 74: 24–37. [Google Scholar]
  2. Ang, Andrew, and Geert Bekaert. 2002. International asset allocation with regime shifts. The Review of Financial Studies 15: 1137–87. [Google Scholar] [CrossRef]
  3. Ang, Andrew, and Joseph Chen. 2002. Asymmetric correlations of equity portfolios. Journal of Financial Economics 63: 443–94. [Google Scholar] [CrossRef]
  4. Apergis, Nicholas, Christina Christou, and Iason Kynigakis. 2019. Contagion across US and European financial markets: Evidence from the CDS markets. Journal of International Money and Finance 96: 1–12. [Google Scholar] [CrossRef]
  5. Ayub, Usman, Syed Zshah, and Qaisar Abbas. 2015. Robust analysis for downside risk in portfolio management for a volatile stock market. Economic Modelling 44: 86–96. [Google Scholar] [CrossRef]
  6. Bannigidadmath, Deepa, and Paresh Narayan. 2016. Stock return predictability and determinants of predictability profits. Emerging Markets Review 26: 153–73. [Google Scholar] [CrossRef]
  7. Beine, Michel, Antonio Cosma, and Robert Vermeulen. 2010. The dark side of global integration: Increasing tail dependence. Journal of Banking & Finance 34: 184–92. [Google Scholar]
  8. Bekaert, Geert, Campbell Harvey, and Christian Lundblad. 2005. Does financial liberalization spur growth? Journal of Financial Economics 77: 3–56. [Google Scholar] [CrossRef] [Green Version]
  9. Bekaert, Geert, Campbell Harvey, Christian Lundblad, and Stephan Siegel. 2013. The European Union, the Euro and equity market integration. Journal of Financial Economics 109: 583–603. [Google Scholar] [CrossRef] [Green Version]
  10. Bekaert, Geert, Michael Ehrmann, Marcel Fratzscher, and Arnaud Mehl. 2014. The Global Crisis and Equity Market Contagion. The Journal of Finance 69: 2597–649. [Google Scholar] [CrossRef] [Green Version]
  11. Berben, Robert-Paul, and Jos Jansen. 2005. Comovement in international equity markets: A sectoral view. Journal of International Money and Finance 24: 832–57. [Google Scholar] [CrossRef] [Green Version]
  12. Bertero, Elisabetta, and Colin Mayer. 1990. Structure and performance: Global interdependence of stock markets around the crash of October 1987. European Economic Review 34: 1150–80. [Google Scholar] [CrossRef]
  13. Burdekin, Richard, Eric Hughson, and Jinlin Gu. 2018. A first look at Brexit and global equity markets. Applied Economics Letters 25: 136–40. [Google Scholar] [CrossRef]
  14. Burzala, Milda. 2016. Contagion effects in selected European capital markets during the financial crisis of 2007–2009. Research in International Business and Finance 37: 556–71. [Google Scholar] [CrossRef]
  15. Cajueiro, Daniel, and Benjamin Tabak. 2004a. The Hurst exponent over time: Testing the assertion that emerging markets are becoming more efficient. Physica A 336: 521–37. [Google Scholar] [CrossRef]
  16. Cajueiro, Daniel, and Benjamin Tabak. 2004b. Evidence of long-range dependence in Asian equity markets: The role of liquidity and market restrictions. Physica A 342: 656–64. [Google Scholar] [CrossRef]
  17. Cajueiro, Daniel, and Benjamin Tabak. 2006. Testing for predictability in equity returns for European transition markets. Economic Systems 30: 56–78. [Google Scholar] [CrossRef]
  18. Cajueiro, Daniel, and Benjamin Tabak. 2008. Testing for time-varying long-range dependence in real estate equity returns. Chaos Solitons & Fractals 38: 293–307. [Google Scholar]
  19. Calvo, Sara, and Carmen Reinhart. 1996. Capital flows to Latin America: Is there evidence of contagion effects? In Private Capital Flows to Emerging Markets after the Mexican Crisis. Edited by Guillermo Calvo, Morris Goldstein and Eduard Hochreiter. Washington, DC: Institute for International Economics, pp. 151–71. [Google Scholar]
  20. da Silva, Marcus, Éder Pereira, Aloísio Filho, Arleys Castro, José Miranda, and Gilney Zebende. 2016. Quantifying the contagion effect of the 2008 financial crisis between the G7 countries (by GDP nominal). Physica A 453: 1–8. [Google Scholar] [CrossRef]
  21. Dajcman, Silvo, Merja Festic, and Alenka Kavkler. 2012. European stock market comovement dynamics during some major financial market turmoils in the period 1997 to 2010—A comparative DCC-GARCH and wavelet correlation analysis. Applied Economics Letters 19: 1249–56. [Google Scholar] [CrossRef]
  22. Dimitriou, Dimitrios, Dimitris Kenourgios, and Theodore Simos. 2013. Global financial crisis and emerging stock market contagion: A multivariate FIAPARCH–DCC approach. International Review of Financial Analysis 30: 46–56. [Google Scholar] [CrossRef]
  23. El Alaoui, Marwane, and Saâd Benbachir. 2013. Multifractal detrended cross-correlation analysis in the MENA area. Physica A 392: 5985–93. [Google Scholar] [CrossRef]
  24. Fama, Eugene. 1970. Efficient Capital Markets: A Review of Theory and Empirical Work. Journal of Finance 25: 383–417. [Google Scholar] [CrossRef]
  25. Ferreira, Paulo. 2017. Portuguese and Brazilian stock market integration: A non-linear and detrended approach. Portuguese Economic Journal 16: 49–63. [Google Scholar] [CrossRef] [Green Version]
  26. Ferreira, Paulo. 2018. Long-range dependencies of Eastern European stock markets: A dynamic detrended analysis. Physica A 505: 454–70. [Google Scholar] [CrossRef]
  27. Ferreira, Paulo, and Andreia Dionísio. 2015. Revisiting covered interest parity in the European Union: The DCCA approach. International Economic Journal 29: 597–615. [Google Scholar] [CrossRef] [Green Version]
  28. Ferreira, Paulo, Andreia Dionísio, and Gilney Zebende. 2016. Why does the Euro fail? The DCCA approach. Physica A 443: 543–54. [Google Scholar] [CrossRef]
  29. Forbes, Kristin, and Roberto Rigobon. 2002. No contagion, only interdependence: Measuring stock market co-movements. The Journal of Finance 57: 2223–61. [Google Scholar] [CrossRef]
  30. Fry-McKibbin, Renée, Vance L. Martin, and Chrismin Tang. 2014. Financial contagion and asset pricing. Journal of Banking & Finance 47: 296–308. [Google Scholar]
  31. Gabriel, Anton. 2012. Evaluating the Forecasting Performance of GARCH Models. Evidence from Romania. Procedia-Social and Behavioral Sciences 62: 1006–10. [Google Scholar] [CrossRef] [Green Version]
  32. Globan, Tomislav, and Petar Soric. 2017. Financial integration before and after the Crisis: Euler Equations (re)visit the European Union. Ekonomickýčasopis/Journal of Economics 65: 237–62. [Google Scholar]
  33. Grammatikos, Theoharry, and Robert Vermeulen. 2012. Transmission of the financial and sovereign debt crises to the EMU: Stock prices, CDS spreads and exchange rates. Journal of International Money and Finance 31: 517–33. [Google Scholar] [CrossRef]
  34. Guedes, Everaldo, Andréa Brito, Florêncio Filho, Basílio Fernandez, Arleys Castro, Aloísio Filho, and Gilney Zebende. 2018a. Statistical test for DCCA cross-correlation coefficient. Physica A 501: 134–40. [Google Scholar] [CrossRef]
  35. Guedes, Everaldo, Andreá Brito, Florêncio Filho, Basílio Fernandez, Arleys Castro, Aloísio Filho, and Gilney Zebende. 2018b. Statistical test for DCCA: Methods and data. Data Brief 18: 795–98. [Google Scholar] [CrossRef]
  36. Guedes, Everaldo, Paulo Ferreira, Andreia Dionísio, and Gilney Zebende. 2019. An econophysics approach to study the effect of BREXIT referendum on European Union stock markets. Physica A 523: 1175–82. [Google Scholar] [CrossRef]
  37. Horta, Paulo, Sérgio Lagoa, and Luís Martins. 2014. The impact of the 2008 and 2010 financial crises on the Hurst exponents of international stock markets: Implications for efficiency and contagion. International Review of Financial Analysis 35: 140–53. [Google Scholar] [CrossRef]
  38. Kearney, Colm, and Brian Lucey. 2004. International equity market integration: Theory, evidence and implications. International Review of Financial Analysis 13: 571–83. [Google Scholar] [CrossRef]
  39. Kristoufek, Ladislav. 2012. Fractal market hypothesis and the global financial crisis: Scaling, investment horizons and liquidity. Advances in Complex Systems 15: 1250065. [Google Scholar] [CrossRef] [Green Version]
  40. Kristoufek, Ladislav. 2014a. Measuring correlations between non-stationary series with DCCA coefficient. Physica A 402: 291–98. [Google Scholar] [CrossRef] [Green Version]
  41. Kristoufek, Ladislav. 2014b. Detrending moving-average cross-correlation coefficient: Measuring cross-correlations between non-stationary series. Physica A 406: 169–75. [Google Scholar] [CrossRef] [Green Version]
  42. Lyócsa, Štefan, Tomáš Výrost, and Eduard Baumöhl. 2019. Return spillovers around the globe: A network approach. Economic Modelling 77: 133–46. [Google Scholar] [CrossRef] [Green Version]
  43. Ma, Feng, Qian Zhang, Peng Chen, and Yu Wei. 2014. Multifractal detrended cross-correlation analysis of the oil-dependent economies: Evidence from the West Texas intermediate crude oil and the GCC stock markets. Physica A 410: 154–66. [Google Scholar] [CrossRef]
  44. Martin-Montoya, Ligia, Natali Aranda-Camacho, and Carlos Quimbay. 2015. Long-range correlations and trends in Colombian seismic time series. Physica A 421: 361–70. [Google Scholar] [CrossRef] [Green Version]
  45. Mohti, Wahbeeah, Andreia Dionísio, Isabel Vieira, and Paulo Ferreira. 2019. Financial contagion analysis in frontier markets: Evidence from the US subprime and the Eurozone debt crises. Physica A 525: 1388–98. [Google Scholar] [CrossRef]
  46. Morana, Claudio, and Andrea Beltratti. 2008. Comovements in international stock markets. Journal of International Financial Markets, Institutions and Money 18: 31–45. [Google Scholar] [CrossRef]
  47. Narayan, Paresh, and Susan Sharma. 2015. Does data frequency matter for the impact of forward premium on spot exchange rate? International Review of Financial Analysis 39: 45–53. [Google Scholar] [CrossRef]
  48. Niţoi, Mihai, and Maria Pochea. 2019. What drives European Union stock market co-movements? Journal of International Money and Finance 97: 57–69. [Google Scholar] [CrossRef]
  49. Niţoi, Mihai, and Maria Pochea. 2020. Time-varying dependence in European equity markets: A contagion and investor sentiment driven analysis. Economic Modelling 86: 133–47. [Google Scholar] [CrossRef]
  50. Obstfeld, Maurice. 1994. Risk-taking, global diversification, and growth. The American Economic Review 84: 1310–29. [Google Scholar]
  51. Papadamou, Stephanos, Nikolaos Kyriazis, and Panayiotis Tzeremes. 2019a. Unconventional monetary policy effects on output and inflation: A meta-analysis. International Review of Financial Analysis 61: 295–305. [Google Scholar] [CrossRef]
  52. Papadamou, Stephanos, Nikolaos Kyriazis, and Panayiotis Tzeremes. 2019b. US non-linear causal effects on global equity indices in normal times versus unconventional eras. International Economics and Economic Policy, 1–27. [Google Scholar] [CrossRef]
  53. Papadamou, Stephanos, Costas Siriopoulos, and Nikolaos Kyriazis. 2020. A survey of empirical findings on unconventional central bank policies. Journal of Economic Studies. [Google Scholar] [CrossRef]
  54. Peng, Chung-Kang, Sergey Buldyrev, Shlomo Havlin, Michael Simons, Harry Eugene Stanley, and Ary Goldberger. 1994. Mosaic organization of DNA nucleotides. Physical Review E 49: 1685–89. [Google Scholar] [CrossRef] [PubMed] [Green Version]
  55. Peters, Edgar. 1994. Fractal Market Analysis-Applying Chaos Theory to Investment and Economics. New York: John Wiley & Sons, Inc. [Google Scholar]
  56. Phylaktis, Kate, and Lichuan Xia. 2009. Equity market comovement and contagion: A sectoral perspective. Financial Management 38: 381–409. [Google Scholar] [CrossRef]
  57. Podobnik, Boris, and Harry Stanley. 2008. Detrended cross-correlation analysis: A new method for analysing two non-stationary time series. Physical Review Letters 100: 084102. [Google Scholar] [CrossRef] [PubMed] [Green Version]
  58. Podobnik, Boris, Zhi-Qiang Jiang, Wei-Xing Zhou, and Harry Eugene Stanley. 2011. Statistical tests for power-law cross-correlated processes. Physical Review E 84: 1–8. [Google Scholar] [CrossRef] [Green Version]
  59. Raileanu-Szeles, Monica, and Lucian Albu. 2015. Nonlinearities and divergences in the process of European financial integration. Economic Modelling 46: 416–25. [Google Scholar] [CrossRef]
  60. Samitas, Aristeidis, and Ioannis Tsakalos. 2013. How can a small country affect the European economy? The Greek contagion phenomenon. Journal of International Financial Markets, Institutions and Money 25: 18–32. [Google Scholar] [CrossRef]
  61. Shi, Wenbin, Pengjian Shan, Jog Wang, and Aijing Lin. 2014. Multiscale multifractal detrended cross-correlation analysis of financial time series. Physica A 403: 35–44. [Google Scholar] [CrossRef]
  62. Sornette, Didier. 2003. Why Stock Markets Crash? Critical Events in Complex Financial Systems. Princeton: Princeton University Press. [Google Scholar]
  63. Syllignakis, Manolis, and Georgios Kouretas. 2011. Dynamic correlation analysis of financial contagion: Evidence from the Central and Eastern European markets. International Review of Economics & Finance 20: 717–32. [Google Scholar]
  64. Tilfani, Oussama, Paulo Ferreira, and My Youssef El Boukfaoui. 2019a. Revisiting stock market integration in Central and Eastern European stock markets with a dynamic analysis. Post-Communist Economies. [Google Scholar] [CrossRef]
  65. Tilfani, Oussama, Paulo Ferreira, and My Youssef El Boukfaoui. 2019b. Dynamic cross-correlation and dynamic contagion of stock markets: A sliding windows approach with the DCCA correlation coefficient. Empirical Economics, 1–30. [Google Scholar] [CrossRef]
  66. Valls, Claudia. 2012. Rational integrability of a nonlinear finance system. Chaos Solitons & Fractals 45: 141–46. [Google Scholar]
  67. Virk, Nader, and Farrukh Javed. 2017. European equity market integration and joint relationship of conditional volatility and correlations. Journal of International Money and Finance 71: 53–77. [Google Scholar] [CrossRef] [Green Version]
  68. Wang, Gang-Jin, Chi Xie, Feng Han, and Bo Sun. 2012. Similarity measure and topology evolution of foreign exchange markets using dynamic time warping method: Evidence from minimal spanning tree. Physica A 391: 4136–46. [Google Scholar] [CrossRef]
  69. Wang, Gang-Jin, Chi Xie, Min Lin, and Harry Stanley. 2017. Stock market contagion during the global financial crisis: A multiscale approach. Finance Research Letters 22: 163–68. [Google Scholar] [CrossRef]
  70. Zebende, Gilney. 2011. DCCA cross-correlation coefficient: Quantifying a level of cross-correlation. Physica A 390: 1643–62. [Google Scholar] [CrossRef]
Figure 1. Evolution of the correlation coefficient of the detrended cross-correlation analysis ( ρ D C C A ) between Eurozone stock markets and Germany (time scales of 4, 32, and 250 days and window size w = 1000). LL and UL are, respectively, the lower and upper limits of the confidence interval. Shaded areas represent the global financial crisis and the Eurozone debt crisis. The vertical dashed line refers to the moment of the Brexit referendum.
Jrfm 13 00091 g001
Figure 2. Evolution of ρ D C C A between Eurozone stock markets and the UK (time scales of 4, 32, and 250 days and window size w = 1000). LL and UL are, respectively, the lower and upper limits of the confidence interval. Shaded areas represent the global financial crisis and the Eurozone debt crisis. The vertical dashed line refers to the moment of the Brexit referendum.
Jrfm 13 00091 g002
Figure 3. Evolution of ρ D C C A between Eurozone stock markets and the USA (time scales of 4, 32, and 250 days and window size w = 1000). LL and UL are, respectively, the lower and upper limits of the confidence interval. Shaded areas represent the global financial crisis and the Eurozone debt crisis. The vertical dashed line refers to the moment of the Brexit referendum.
Jrfm 13 00091 g003
Figure 4. Evolution of ρ D C C A between non-Eurozone stock markets and Germany (left panel), the UK (middle panel), and the US (right panel) (time scales of 4, 32, and 250 days and window size w = 1000). LL and UL are, respectively, the lower and upper limits of the confidence interval. Shaded areas represent the global financial crisis and the Eurozone debt crisis. The vertical dashed line refers to the moment of the Brexit referendum.
Jrfm 13 00091 g004
Figure 5. Evolution of the Δ ρ DCCA between Eurozone stock markets and Germany for time scales of 4, 32, and 250 days, considering that Δ ρ DCCA ( 1 ) = ρ DCCA ( 1001 ) ρ DCCA ( 1 ) . LL and UL are, respectively, the lower and upper limits of the confidence interval. Shaded areas represent the global financial crisis and the Eurozone debt crisis. The vertical dashed line refers to the moment of the Brexit referendum.
Jrfm 13 00091 g005
Figure 6. Evolution of the Δ ρ DCCA between Eurozone stock markets and the UK for time scales of 4, 32, and 250 days, considering that Δ ρ DCCA ( 1 ) = ρ DCCA ( 1001 ) ρ DCCA ( 1 ) . LL and UL are, respectively, the lower and upper limits of the confidence interval. Shaded areas represent the global financial crisis and the Eurozone debt crisis. The vertical dashed line refers to the moment of the Brexit referendum.
Jrfm 13 00091 g006
Figure 7. Evolution of the Δ ρ DCCA between Eurozone stock markets and the US for time scales of 4, 32, and 250 days, considering that Δ ρ DCCA ( 1 ) = ρ DCCA ( 1001 ) ρ DCCA ( 1 ) . LL and UL are, respectively, the lower and upper limits of the confidence interval. Shaded areas represent the global financial crisis and the Eurozone debt crisis. The vertical dashed line refers to the moment of the Brexit referendum.
Jrfm 13 00091 g007
Figure 8. Evolution of the Δ ρ DCCA between non-Eurozone stock markets and Germany (left panel), the UK (middle panel), and the US (right panel), for time scales of 4, 32, and 250 days, considering that Δ ρ DCCA ( 1 ) = ρ DCCA ( 1001 ) ρ DCCA ( 1 ) . LL and UL are, respectively, the lower and upper limits of the confidence interval. Shaded areas represent the global financial crisis and the Eurozone debt crisis. The vertical dashed line refers to the moment of the Brexit referendum.
Jrfm 13 00091 g008
Table 1. Stock markets used in the paper.
CountryIndexCountryIndex
GERMANYDAX35NETHERLANDSAEX Index
AUSTRIAATXPORTUGALPSI 20
BELGIUMBEL 20SLOVAKIASAX 16
CYPRUSCySE GeneralSLOVENIASBITOP
ESTONIAOMX TallinSPAINIBEX 35
FINLANDOMX HelsinkiBULGARIASOFIX
FRANCECAC 40CROATIACROBEX
GREECEAthex 20CZECH REPUBLICPX Index
IRELANDISEQ 20DENMARKOMXC 20
ITALYFTSE MIBHUNGARYBUX
LATVIAOMX RigaPOLANDWIG Index
LITHUANIAOMX VilniusROMANIABET
LUXEMBOURGLSESWEDENOMX Stockholm 30
MALTAMSEUKFTSE 100

