Article

Adaptive Market Hypothesis: Evidence from the Vietnamese Stock Market

by
Dzung Phan Tran Trung
1 and
Hung Pham Quang
2,*
1
Faculty of Banking & Finance, Foreign Trade University, Hanoi 100000, Vietnam
2
Branch of PwC (Vietnam) Limited in Hanoi, Hanoi 100000, Vietnam
*
Author to whom correspondence should be addressed.
J. Risk Financial Manag. 2019, 12(2), 81; https://doi.org/10.3390/jrfm12020081
Submission received: 30 March 2019 / Revised: 1 May 2019 / Accepted: 5 May 2019 / Published: 8 May 2019
(This article belongs to the Special Issue Entrepreneurial Finance at the Dawn of Industry 4.0)

Abstract

:
This paper aims to test the adaptive market hypothesis in the two main Vietnamese stock exchanges, namely Ho Chi Minh City Stock Exchange (HSX) and Hanoi Stock Exchange (HNX), by measuring the relationship between current stock returns and historical stock returns. In particular, the tests employed are the automatic variance ratio test (“AVR”), the automatic portmanteau test (“AP”), the generalized spectral test (“GS”), and the time-varying autoregressive (TV-AR) approach. The empirical results validate the adaptive market hypothesis in the Vietnamese stock market. Furthermore, the results suggest that the evolution of HSX has served as an important factor of the adaptive market hypothesis.

Graphical Abstract

1. Introduction

Efficient market hypothesis (EMH), proposed by Fama (1970), despite being well known and influential in finance theory and practice, is still controversial in the predictability of stock market return. A strong and still rising school of theory, behavioral finance, is one of the strongest opponents against the arguments of EMH. The core question to this debate is whether stock market movements are predictable. The idea for the adaptive market hypothesis (AMH) stemmed from the reasoning of Lo (2004), which claimed much of evidence of an investor’s irrationality (e.g., loss aversion, overconfidence, overreaction) is, in fact, consistent with the evolutionary model of human behaviors. Such an evolutionary model indicates that humans adaptation to the ever-changing surroundings is a result of their continuous perception and learning of the latter. This evolutionary model is further developed into the adaptive market hypothesis (Lo 2004). Lo (2005) states “Based on evolutionary principles, the adaptive market hypothesis implies that the degree of market efficiency is related to environmental factors characterizing market ecologies such as the number of competitors in the market, the magnitude of profit opportunities available, and the adaptability of the market participants.” The key point for AMH to be the harmonization of EMH and BF is investor’s ability to learn and to adapt to the market’s updated situation, as a result, financial markets can be wrong from time to time, but they learned, evolved to be right, until the next mistake. Cyclical repeats of market inefficiency are the sign of adaptation, according to AMH. Since its emergence, the AMH theory has drawn significant attention from academic researchers.

1.1. Papers Discussing Adaptive Market Hypothesis (AMH)

In expansion to Lo’s work (2004), Lim and Brooks (2011) proposed two criteria to test the AMH theory:
  • The market efficiency should be varying through time;
  • The market efficiency should be dependent on market conditions (i.e., financial crises, market crashes, stock bubbles, …).
Most of the evidences found in existing literature conclude that the AMH theory describes the fluctuations of stock returns better that the EMH theory. Specifically, interesting findings about overtime changes of market efficiency are clearly seen in the studies of Lim et al. (2006) examining the cases of in developed and emerging countries and Ito and Sugiyama (2009) researching the phenomenon of time-varying autocorrelation of the monthly S&P 500 stock returns.
Neely et al. (2009) studied the intertemporal stability of excess returns to technical trading rules in the foreign exchange market by conducting true, out-of-sample tests on previously studied rules. They found that excess returns were genuine in the 1970s and 1980s, but gradually declined in the 1990s. This result was consistent with the AMH framework.
Kim et al. (2011) examined the AMH theory by testing the feasibility of stock return forecast, using the daily and weekly Dow Jones Industrial Average (DJIA) stock returns from 1900 to 2009. They discovered that in the case where current stock returns can be accurately predicted using historical prices, the market efficiency is low. Kim employed three autocorrelation tests, which were the variance ratio test, portmanteau test and the generalized spectral (GS) test to measure the significance of the autocorrelation. The results indicate that the autocorrelation significance in the data series fluctuated over time and was dependent on the market conditions. Regarding the market condition dependency, the market is efficient in times of market crashes, however, it is inefficient in times of crises.
Smith (2012) tested the AMH theory in 15 stock markets of emerging European countries with those of more developed ones, such as Greece, Portugal, and United England. The variance ratio test is conducted on the time series data from February 2000 to December 2009. The results show that market efficiency changes over time to some extent, which is consistent with the AMH theory.
Lim et al. (2013) found that in large US stock indices, the degree of market efficiency expressed volatility over time. The study applies autocorrelation tests on a rolling-window basis. Additionally, the bootstrapping procedure was also used to make conclusions. Their main finding is that the studied market went through multiple periods of efficiency and periods of inefficiency.
Urquhart and McGroarty (2014) tested the adaptive market hypothesis through four well-known calendar anomalies in the Dow Jones Industrial Average from 1900 to 2013 using subsample analysis and rolling window analysis. The results showed that all four calendar anomalies support the AMH, with each calendar anomaly’s performance varying over time. They concluded that the AMH provides a better explanation for calendar anomalies than the EMH.
Hiremath and Kumari (2014) employed linear and non-linear methods to test the cyclical phenomenon in India’s stock market. They found that with the linear method the Indian stock market showed a cyclical pattern, while this pattern was not found using the non-linear method.
Besides the statistical tests using the moving window method, another approach is also employed to measure market efficiency, i.e., the time-varying model approach.
Ito et al. (2014) applied a non-Bayesian time-varying vector autoregressive (TV-VAR) model to estimate the joint degree of market efficiency. Their results conclude that the international linkages and market efficiency change over time and that market behaviors correspond well to historical events of the international financial system.
Ito et al. (2016) applied TV-AR model to test the evolution through time of the U.S. stock market. The main findings show that (i) the U.S. market efficiency changes over time, and (ii) efficiency were violated during recessions, consistent with the assumption of behavioral finance.
Noda (2016) tested AMH within the Japanese context, the study employed a time-varying model approach, and concluded that the degree of market efficiency changes over time in the markets (TOPIX and TSE2), the evolving process of the market efficiency varies among stock markets, and the results support the AMH for the more qualified stock market in Japan.
Almost all of the aforementioned papers have the same finding, which is that the AMH theory describes fluctuations in stock prices more accurately than the EMH theory. Using two criteria proposed by Lim and Brooks (2011), some important aspects needed to take into consideration in this paper are: (1) the evolution through time of market, (2) applicability of AMH in different exchanges and (3) the connection between market efficiency and economic cycle.

1.2. Papers Discussing Vietnamese Stock Market Efficiency

The Viet Nam Stock Market (VSM) consists of two stock exchanges: Ho Chi Minh stock exchange (HOSE) and Hanoi Stock Exchange (HNX) and the VSM performs better now than in the pre-World Trade Organization (WTO) period in terms of both initial public offerings (IPOs) and seasoned offerings (Vuong 2018). Vietnamese stock market, despite having a great opportunity to have an upgraded status from frontier market to emerging market by Morgan Stanley Capital International (MSCI) in the near future, still faces with many potential issues regarding efficiency due to its special characteristics especially in the age of digitization and globalization, listed companies worldwide particularly are facing increasing pressure to innovate, increase productivity and increase competitiveness (Vu et al. 2019). Efficiency is, therefore, of the utmost importance to firms and markets as well. With 19 years of existence, the market has gone through different phases, from almost inactive in the first 5 years, then a boom and burst in the next 3 years, and unstable status with different ups and downs afterward until the moment when speed is everything: Speed of calculation, the speed of thinking, the speed of failing (Vuong 2019). There is a constant pressure to keep up the streams of content and investors tend to make decisions based on external information of quotations on the stock market. Apart from that, the number of institutional investors and foreign investors in the Vietnamese stock market is approximately around 1% each, contributing to the strong emotional volatility of the market.
Dong Loc et al. (2010) reviewed developments in the Stock Trading Centre (STC) in Ho Chi Minh City, the precedent of the current HSX to test the weak-form efficiency of the Vietnamese stock market. An important element of the investigation concerns the possible bias of the results caused by the thin trading that characterizes the STC. The main conclusion of this paper is that the STC is not efficient in the weak form.
Phan and Zhou (2014) discussed the weak-form efficiency for the Vietnamese stock market. The paper tested the random walk hypothesis for weekly stock market returns employing the autocorrelation test, variance ratio test, and runs test for the period from July 2000 to July 2013. Results have strongly rejected the random walk hypothesis for the whole period and two out of the three cycles of the market. Interestingly, the third cycle alone (from February 2009 to July 2013) provided evidence supporting the random walk hypothesis in the stock index of HSX (VN-Index) showing that the efficiency of the Vietnamese stock market has gradually been improved during nearly 10 years in operation.
Cuong and Jian (2014) applied Theory of Planned Behavior (TPB) to explore the impact of factors influencing individuals’ investment behavioral intention in the Vietnamese stock market. Results found in this research have supported the hypotheses that an individual investor’s investment intention is significantly affected by three factors mentioned in the original TPB model including attitude, subjective norm and perceived behavioral control. The study also found evidence that psychological factors and also gender have a significant impact on the individuals’ attitude towards investment.
Vo (2015) discussed the role of foreign investors in reducing market volatility using panel data analysis and found evidence supporting this hypothesis. A suggestion for a higher ratio of foreign investor existence was also proposed.
However, there was no paper mentioned AMH for the Vietnamese stock market in the literature the authors have researched, setting up a research gap for further evaluations and evidence of this market’s efficiency. Also, in line with the assumption of the varying efficiency from time to time of the AMH, there were signals from the market movements showing that Vietnamese markets might have learned to adapt through time, and became more stable after each period of turmoil, and a test for AMH in the Vietnamese market context shall contribute to answering the question of efficiency.

2. Methods and Data Sources

2.1. Methods

This paper examines the AMH theory in two ways: a battery of autocorrelation tests and a time-varying autoregressive model.
The first battery of tests includes popular serial correlation tests, i.e., the automatic variance ratio (AVR) test, automatic portmanteau (AO) test, the generalized spectral (GS) test. These tests detect the linear and non-linear relationships in a time series, from which a conclusion regarding the validation of the AMH theory can be made.
The second method is involved with the construction of a time-varying autoregressive (“TV-AR”) model, i.e., an autoregressive model with the coefficients changing over time. This is a fairly new testing method, which has been introduced in the work of Ito et al. (2014). This method possesses several advantages over other testing methods.
The details of the methods are presented in the following sections.

2.1.1. Autocorrelation Testing Approach

This paper quantifies the market efficiency through three tests of autocorrelation to examine whether the level of market efficiency significantly changes over time, aiming at evaluating the weak-form efficiency of the stock market. The task usually requires autocorrelation tests. The common understanding is that if time series data exhibit significant autocorrelations, it will be easier to predict the stock returns using historical prices, and the investors will obtain abnormal gains more easily. In other words, the more serially correlated the time series data are, the lower the market efficiency is.
Among popular autocorrelation tests, the paper adopted the following quantitative tests:
  • Automatic Variance Ratio (“AVR”) test;
  • Automatic Portmanteau (“AP”) test; and
  • Generalized Spectral (“GS”) test
The main reason why these tests are utilized is that these tests work on data which suffer from conditional heteroskedasticity, which is a common symptom of financial time series. This is also the case of Vietnamese stock market indices—in fact, a simple plotting (i.e., Figure 1 and Figure 2) shows that both VN-INDEX data and HNX-INDEX data exhibit the conditional heteroskedasticity:
There is visual evidence of conditional heteroskedasticity in both plots above that the series of returns since volatility clustering can be observed. Particularly, the weeks with large variances in weekly returns cluster in the period from 2006 to 2010 and the weeks with smaller variance clusters in more recent periods. Due to such symptom, the paper opts to the three tests above to analyze this type of data. On a side note, the AVR test and the GS test employ the wild bootstrapping approach, which is most suited for data of small sample size like Vietnamese stock indices.
Each test possesses different statistical characteristics, which can be complementary to one another. The characteristics are as follows:
  • The AVR test, which is modified from the traditional variance ratio test, is the most popular test in the AMH examination. This is the primary testing method of this paper.
  • The AP test is an asymptotic test, which relies on the squared correlation coefficients. This method eliminates the possibility that the positive correlations and the negative correlations offset one another (Kim et al. 2011).
  • The GS test is an autocorrelation test that can determine the non-linear relationship in the data series. The non-linear relationship in stock data can be recognized (Lim and Brooks 2011), yet cannot be detected by popular linear tests such as the AVR test and the AP test.
These tests are conducted with the “vrtest” package in R. Specifically, the test statistics were calculated on the basis of the rolling window method with a fixed 1-year window length. In fact, the window length observably had a minimal effect on the test results according to the work of Kim et al. (2011). Afterward, the quantitative results were assessed qualitatively to examine the impact of market conditions on the degree of market efficiency.
The details on how to conduct each test are as follows:
  • The Automatic Variance Ratio (AVR) test
The AVR test is developed based on the traditional variance ratio test (Lo and MacKinlay 1988), which is the most popular test of the random walk theory, according to Hoque et al. (2007). The test is based on the statistical feature that the variance of k-periods stock returns equals to k times the variance of 1-period stock returns, provided that the stock returns series follows a random walk.
The variance ratio is defined to be the weighted sum of correlation coefficients in the stock returns series:
V R ( k ) = σ k 2 k   σ 2 = 1 + 2 j = 1 k 1 ( 1 j k ) ρ j ,
in which: σ k 2 is the variance of k-period stock returns, σ 2 is the variance of 1-period stock returns. ρ j is the j-degree correlation coefficient. The closer to 1 the VR test statistics are, the better the data series follow a random walk. If the VR test statistics are greater than 1, a positive correlation is concluded, otherwise, if such statistics are less than 1, the series is undergoing a mean reversion. The VR test statistics are estimated as follows:
V R ( k ) =   σ k 2 k   σ 2 = 1 + 2 j = 1 k 1 ( 1 j k ) ρ j ^
in which ρ j ^ is an estimate of ρ j .
One major setback of this approach is that the value of k is selected based on personal perceptions. In other words, the traditional variance ratio approach is subjective and may provide irreproducible results. Choi (1999) proposed the automatic variance ratio test, which employs the data-oriented method to determine the optimal ( k ^ ). In the AVR test, Choi assumed that the stock returns series is identical and independently distributed, and claimed that:
A V R (   k   ^ ) = T k ^ [ V R (   k   ^ ) 1 ] 2 d   N ( 0   ,   1 )
However, if the data suffered from conditional heteroskedasticity, the test results may not be reliable, especially when the sample size is small. In particular, the construction of confidence intervals following N(0,1) distribution may not reflect the level of uncertainty in the estimate of k. Accordingly, Kim (2006) proposed an alternative to the normal distribution approach—the wild bootstrapping approach. This approach is proved to be more suitable than the simple residual bootstrapping method in case the data exhibits heteroskedasticity.
  • The Automatic Portmanteau (AP) test
The AP test is a popular tool to detect autocorrelations in time series data. However, one shortcoming of the traditional AP test is that when the time series data suffer from conditional heteroskedasticity, the test statistics may be inaccurate. Accordingly, Lobato et al. (2001) suggested an advanced AP test, which utilizes the following test statistics:
Q p * = T i = 1 p ρ ˜ i 2
in which: ρ ˜ i 2 = γ ^ i 2 / τ i 2 ( γ ^ i 2 is the estimator for the autocovariance of the time series data of order i, and τ i 2 represents the autocovariance of the squared stock returns. Similar to the selection of k in the traditional VR test, the advanced AP test also suffers from irreproducibility as the selection of lag p is based on personal judgements. In order to fix the problem, Escanciano and Lobato (2009) proposed an automatic data-driven approach which determines the optimal lag p. The test statistics, therefore, can be calculated as follows:
A Q     Q p * =   T i = 1 p ˜ ρ ˜ i 2
In which, p ˜   is the optimal estimator of lag p, determined by Akaike information criterion (AIC) or Bayesian information criterion (BIC). The AP test statistics follow the Chi-squared distribution with one degree of freedom.
  • The Generalized Spectral (GS) test
The nonlinear correlation, which is ignored in the linear correlation tests such as the AVR test and the AP test, has been commonly detected in the stock returns (Lim and Brooks 2011).
Accordingly, Escanciano and Velasco (2006) proposed the generalized spectral test, which can assess the nonlinear relationship in time series data. This is based on the knowledge that when the stock return follows a general martingale difference sequence, its normalized spectral density function is equal to one at all frequencies. The paper suggests that the test statistics are to be calculated as follows:
D n 2 =   j = 1 n 1 ( n   j ) 1 ( j π ) 2 | γ ^ j ( x ) | 2 W ( d x )
The paper also involved the wild bootstrapping method, in which they obtained the p-value of the test. If the p-value corresponding with the test statistics is less than 5%, it can be concluded that the market is inefficient at that point in time.

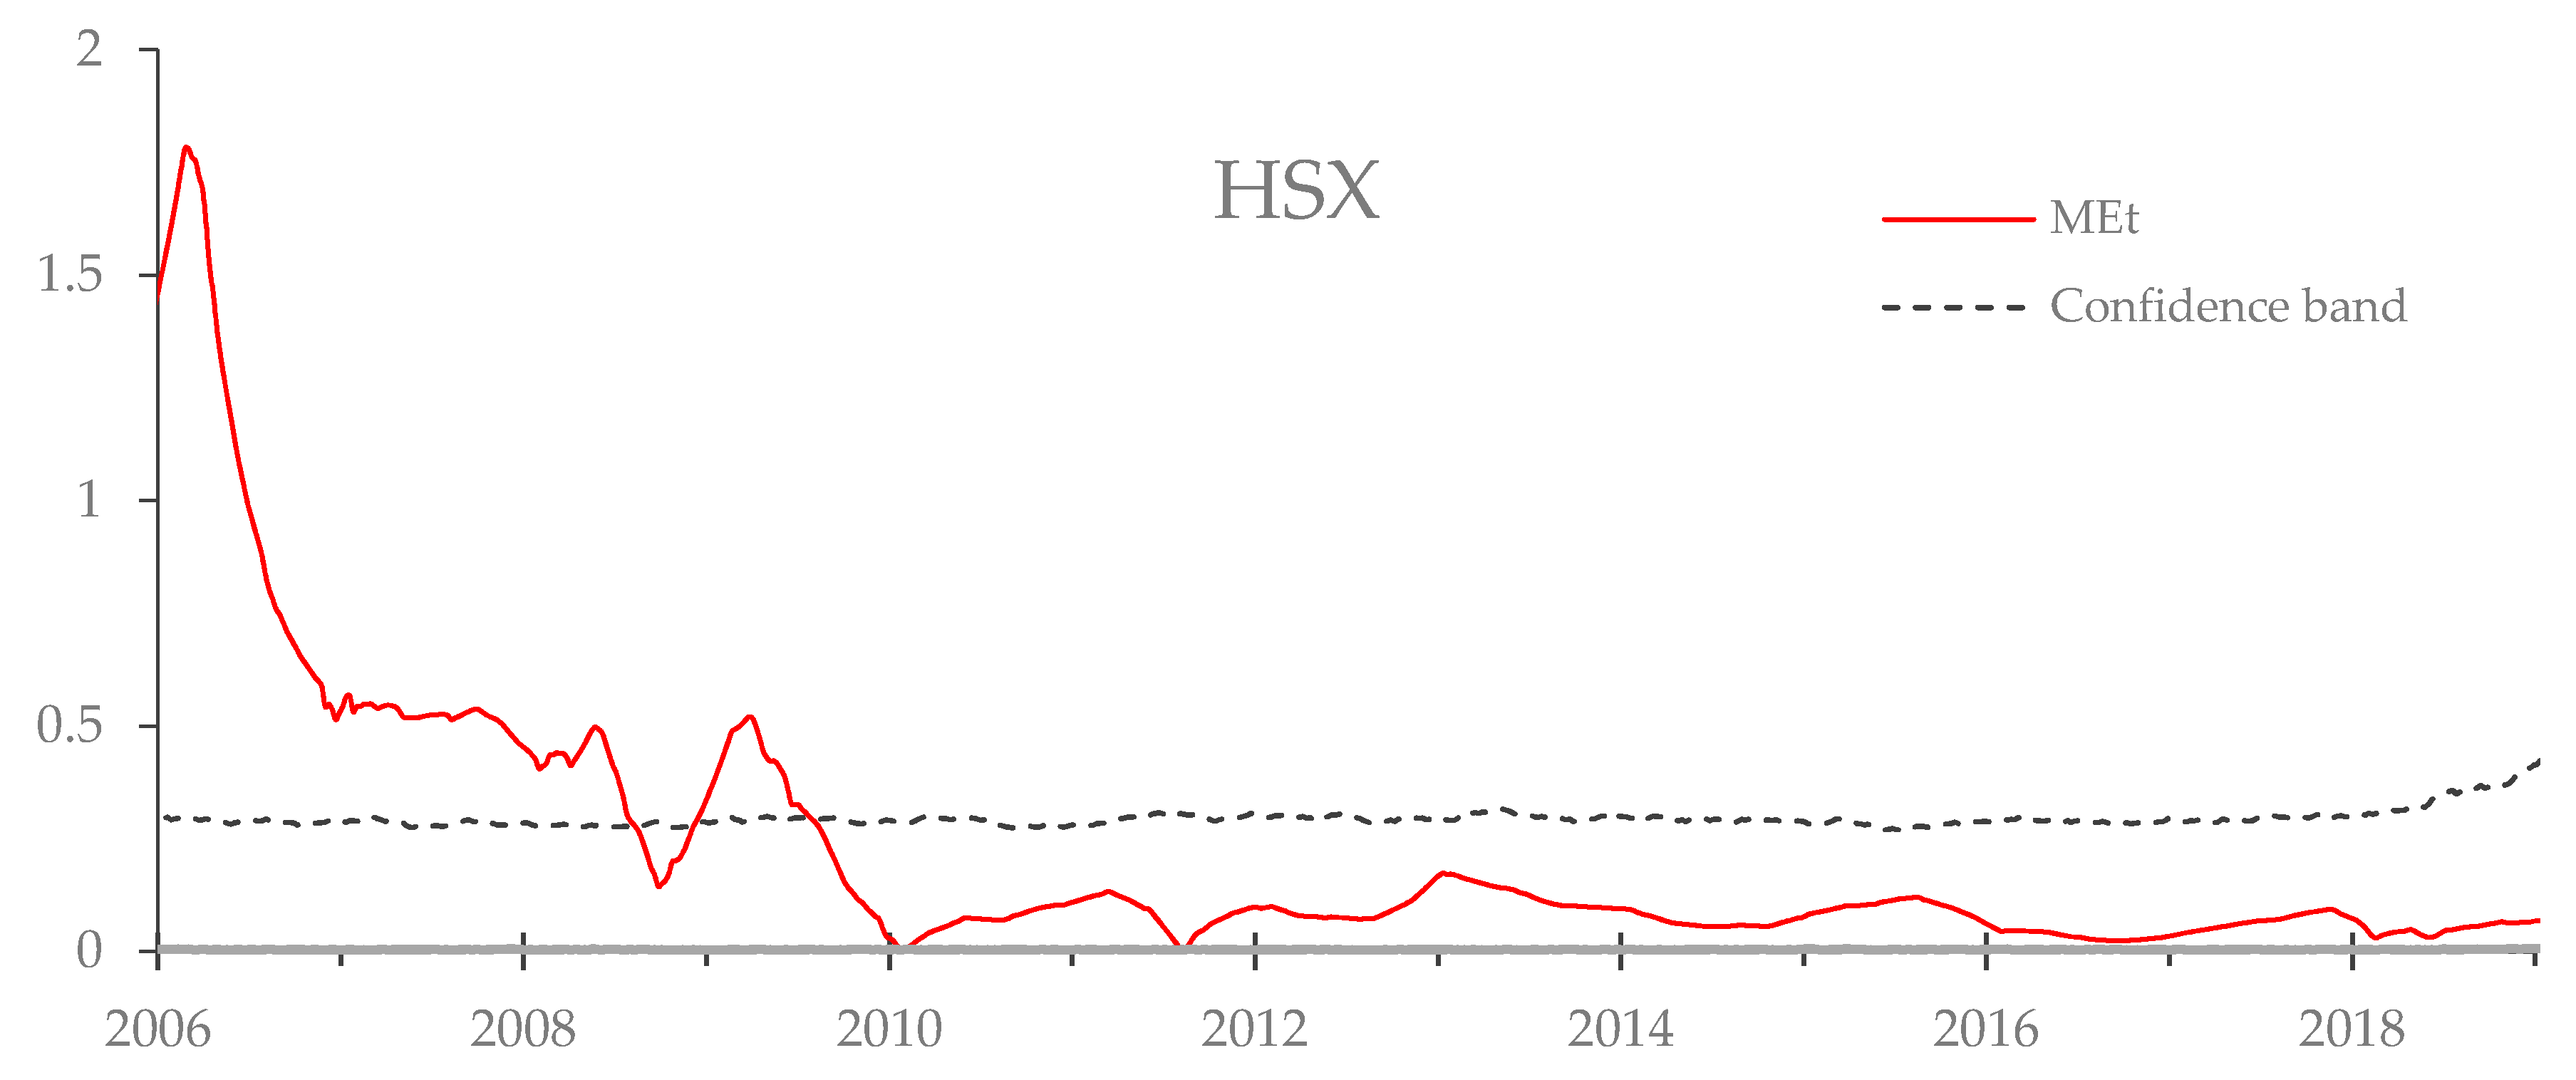
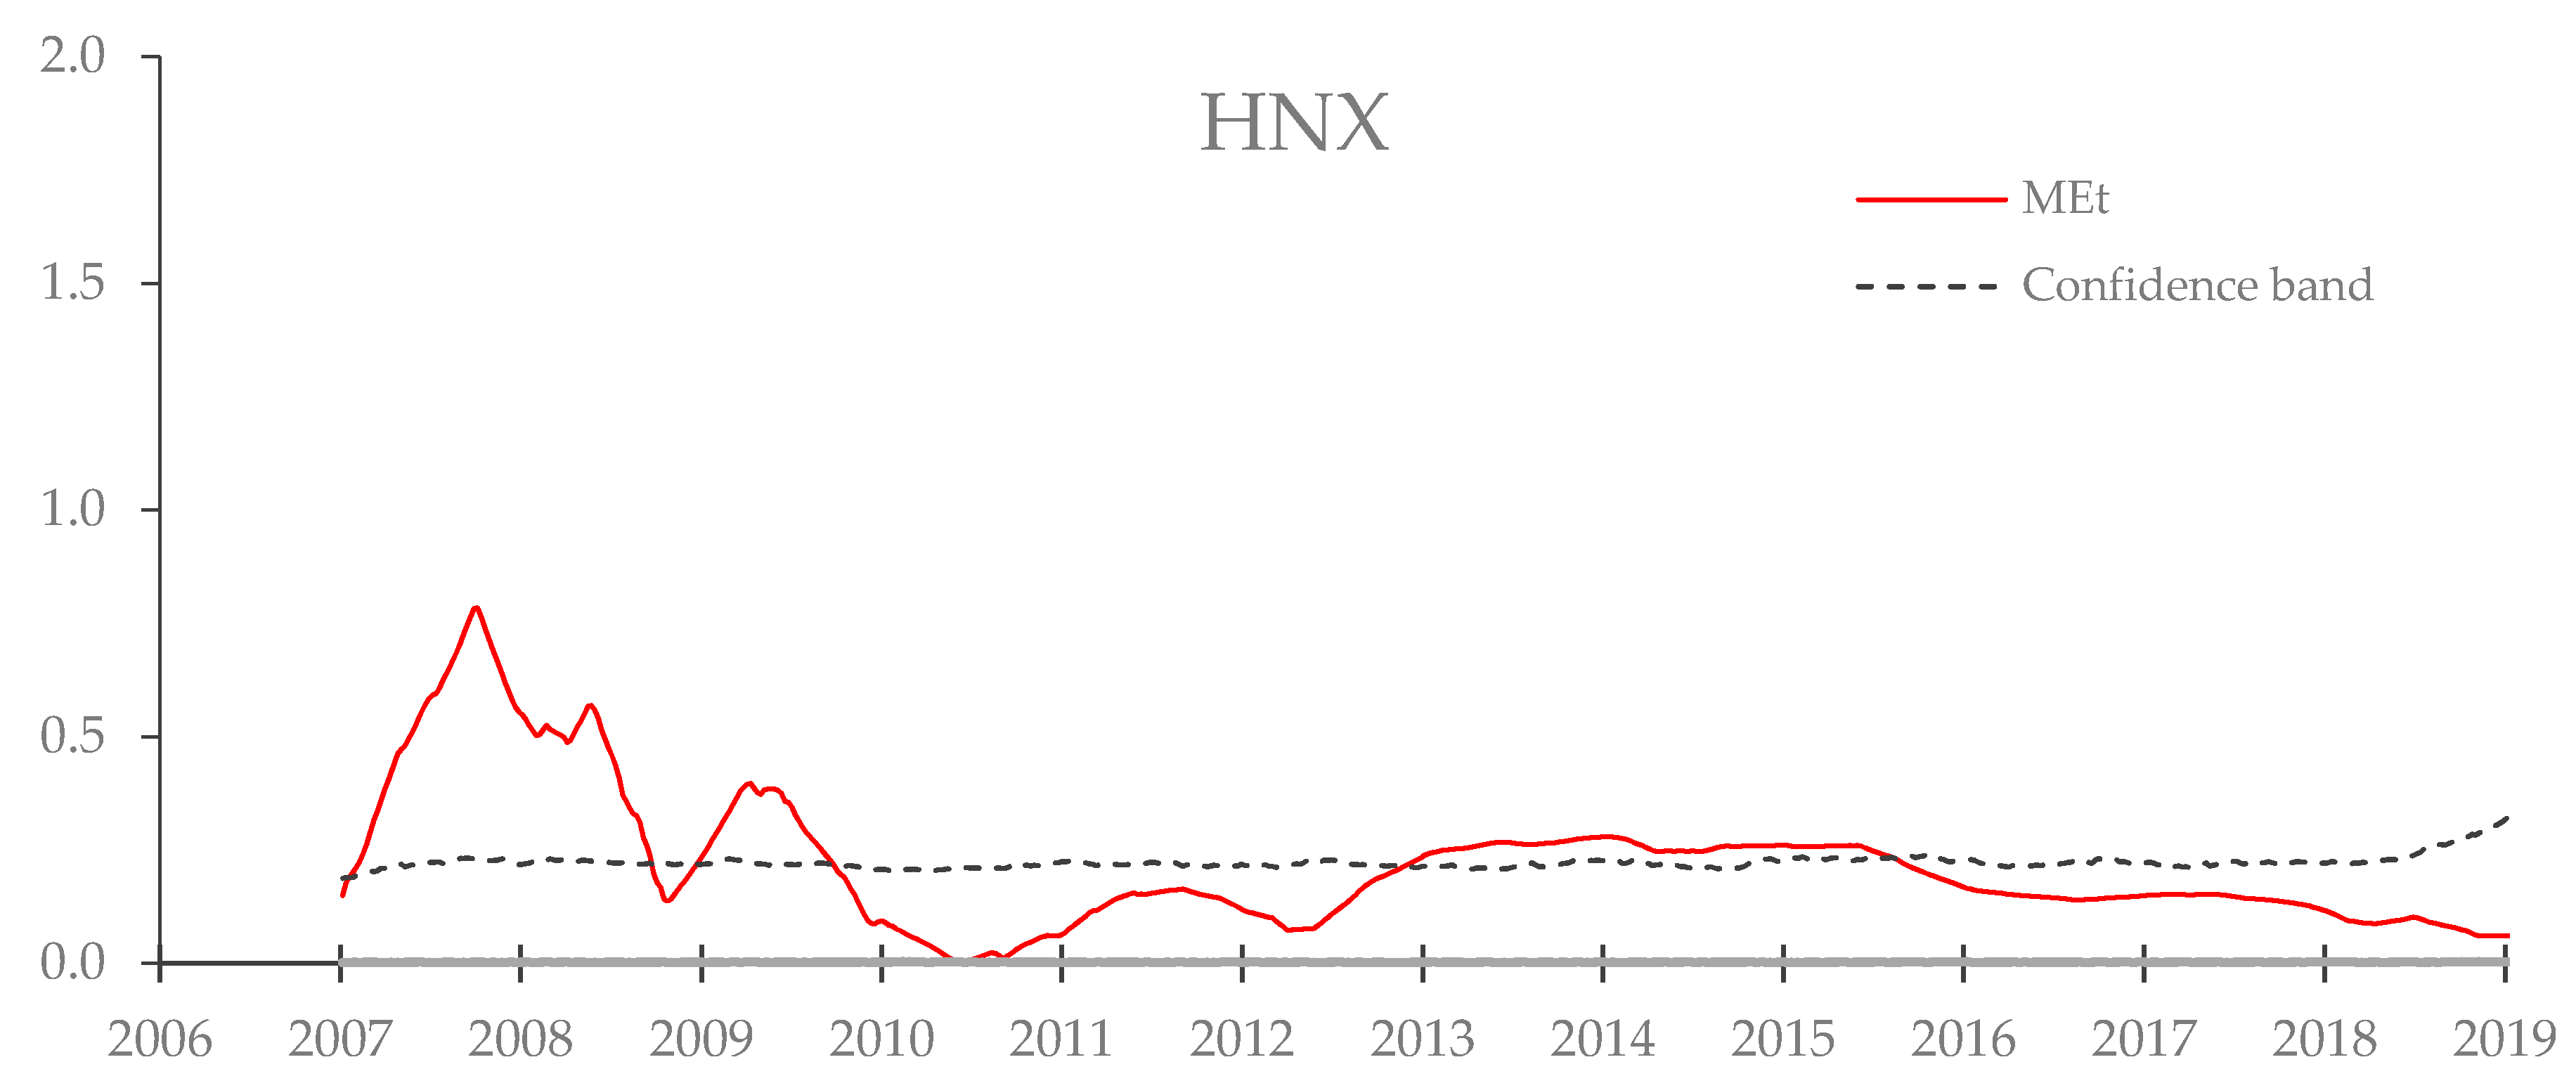
2.1.2. The Time-Varying Autoregressive (TV-AR) Approach
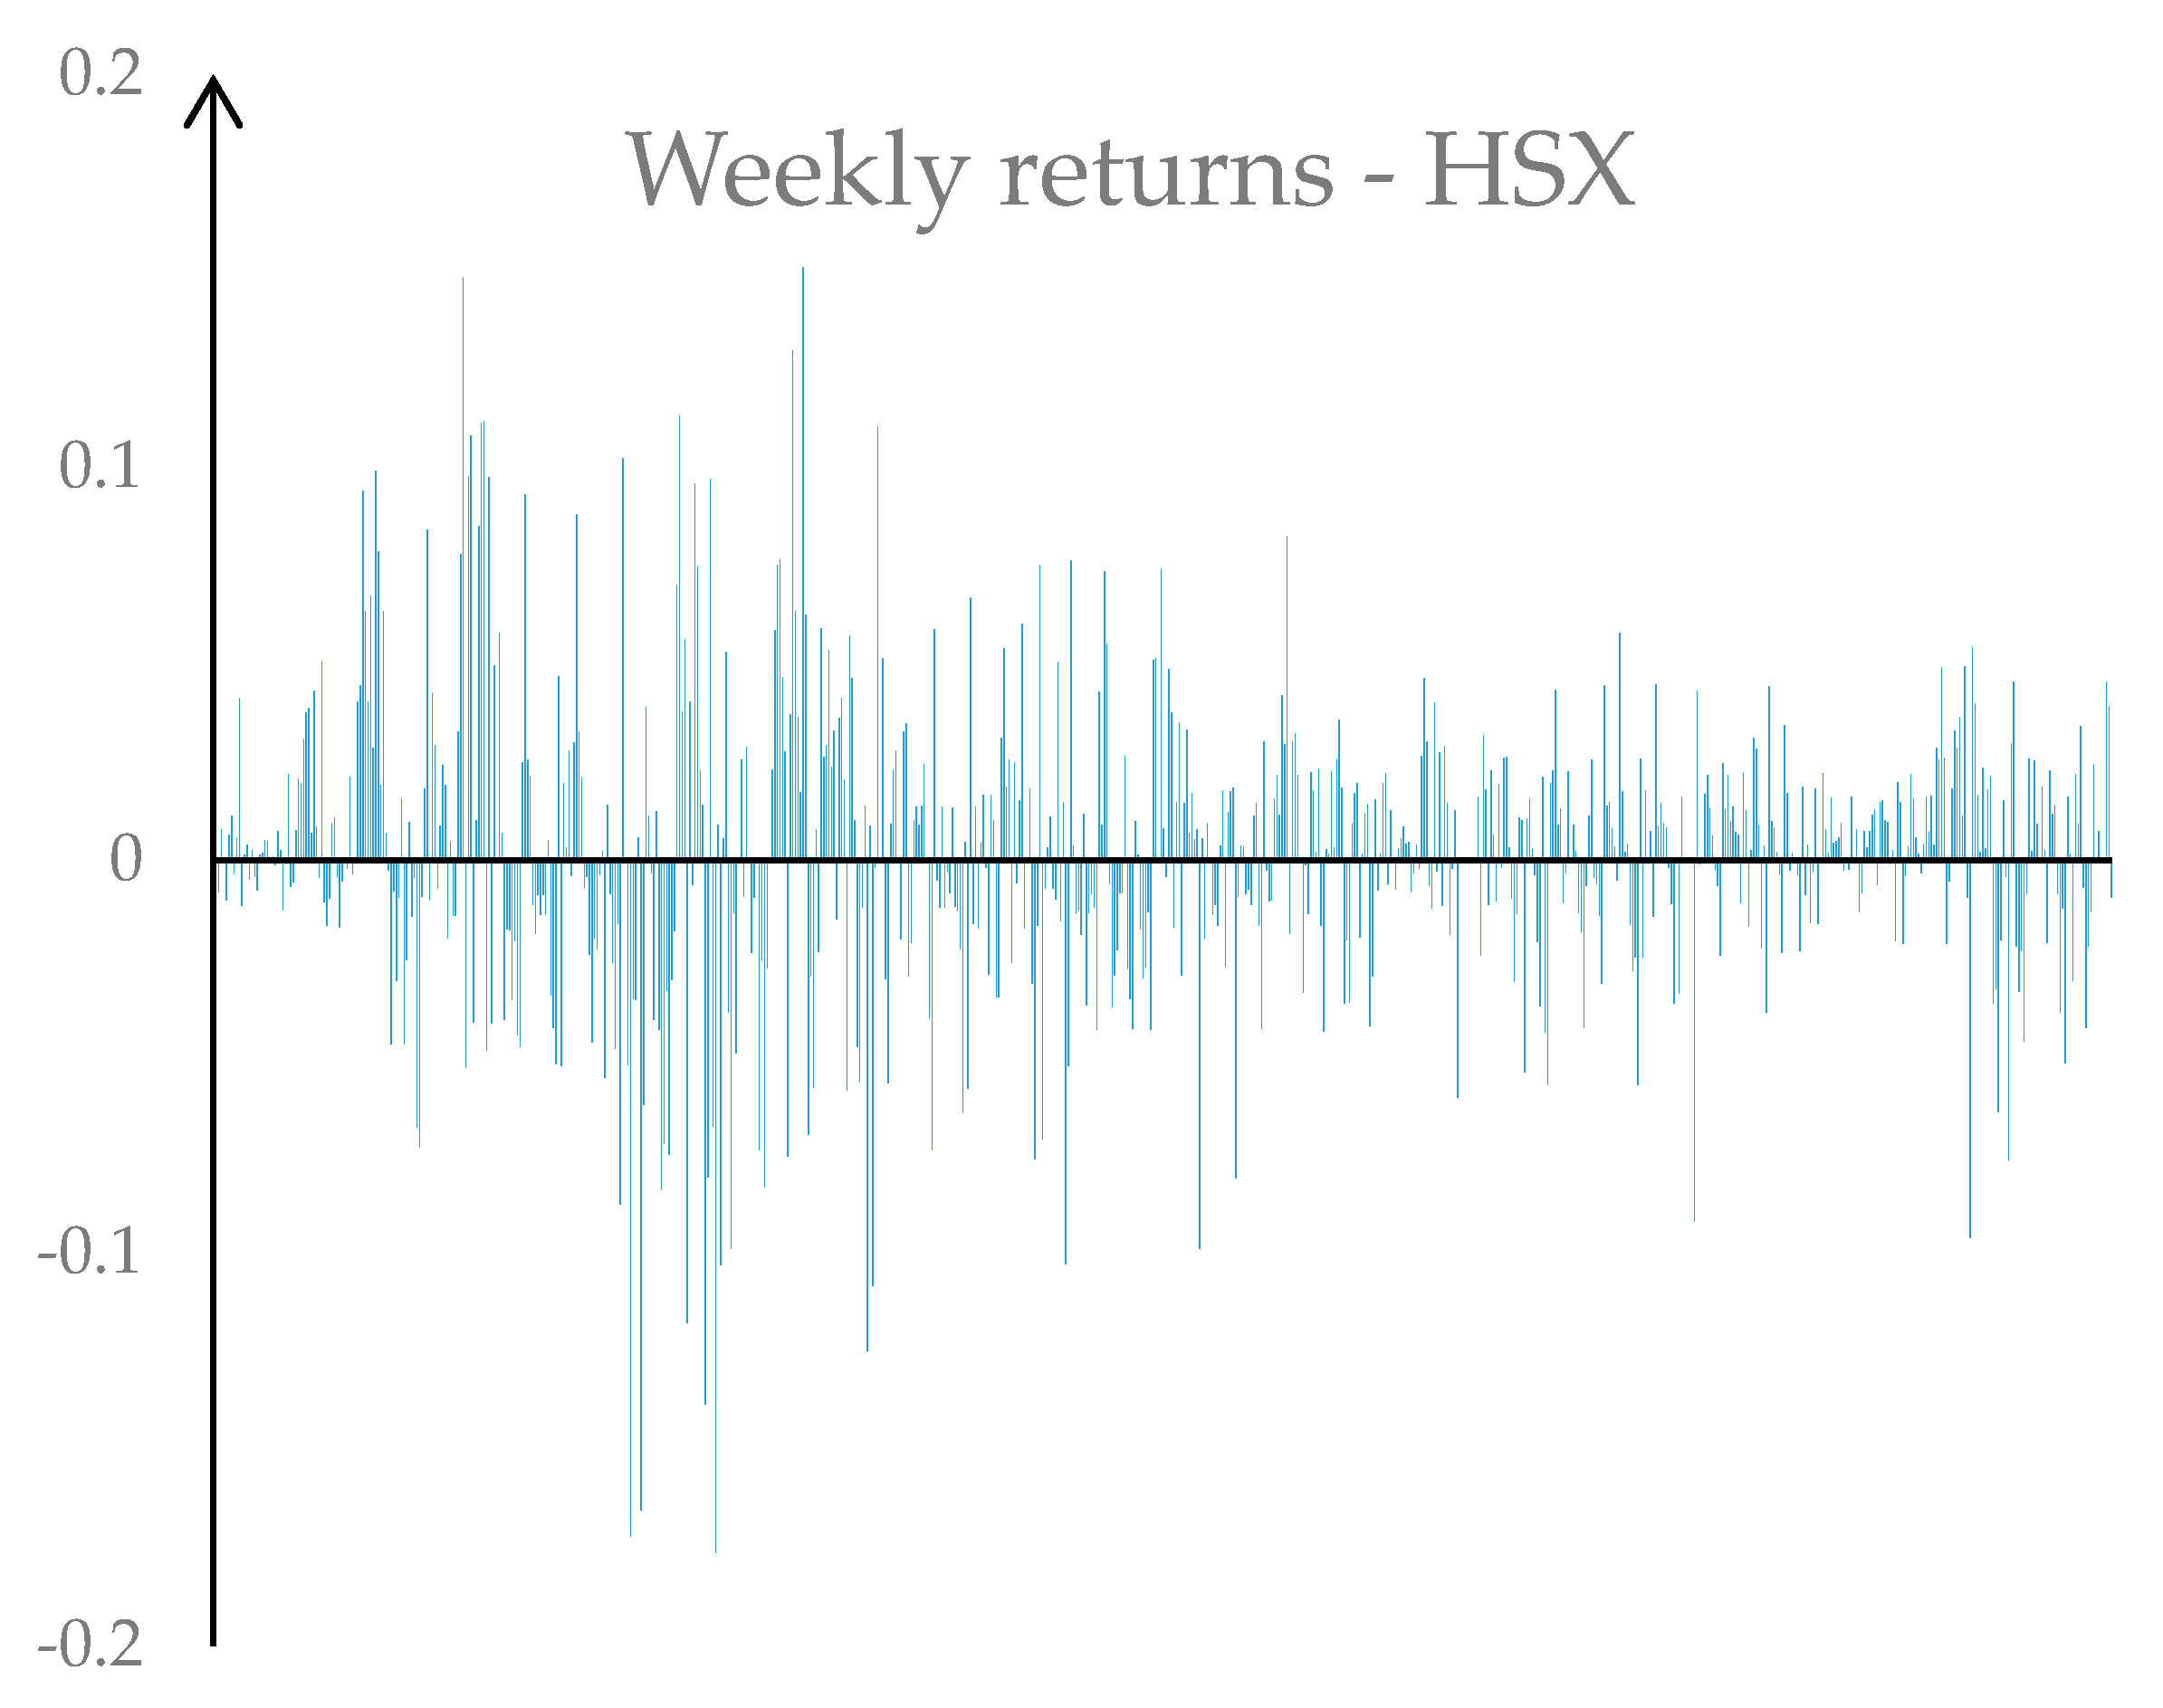
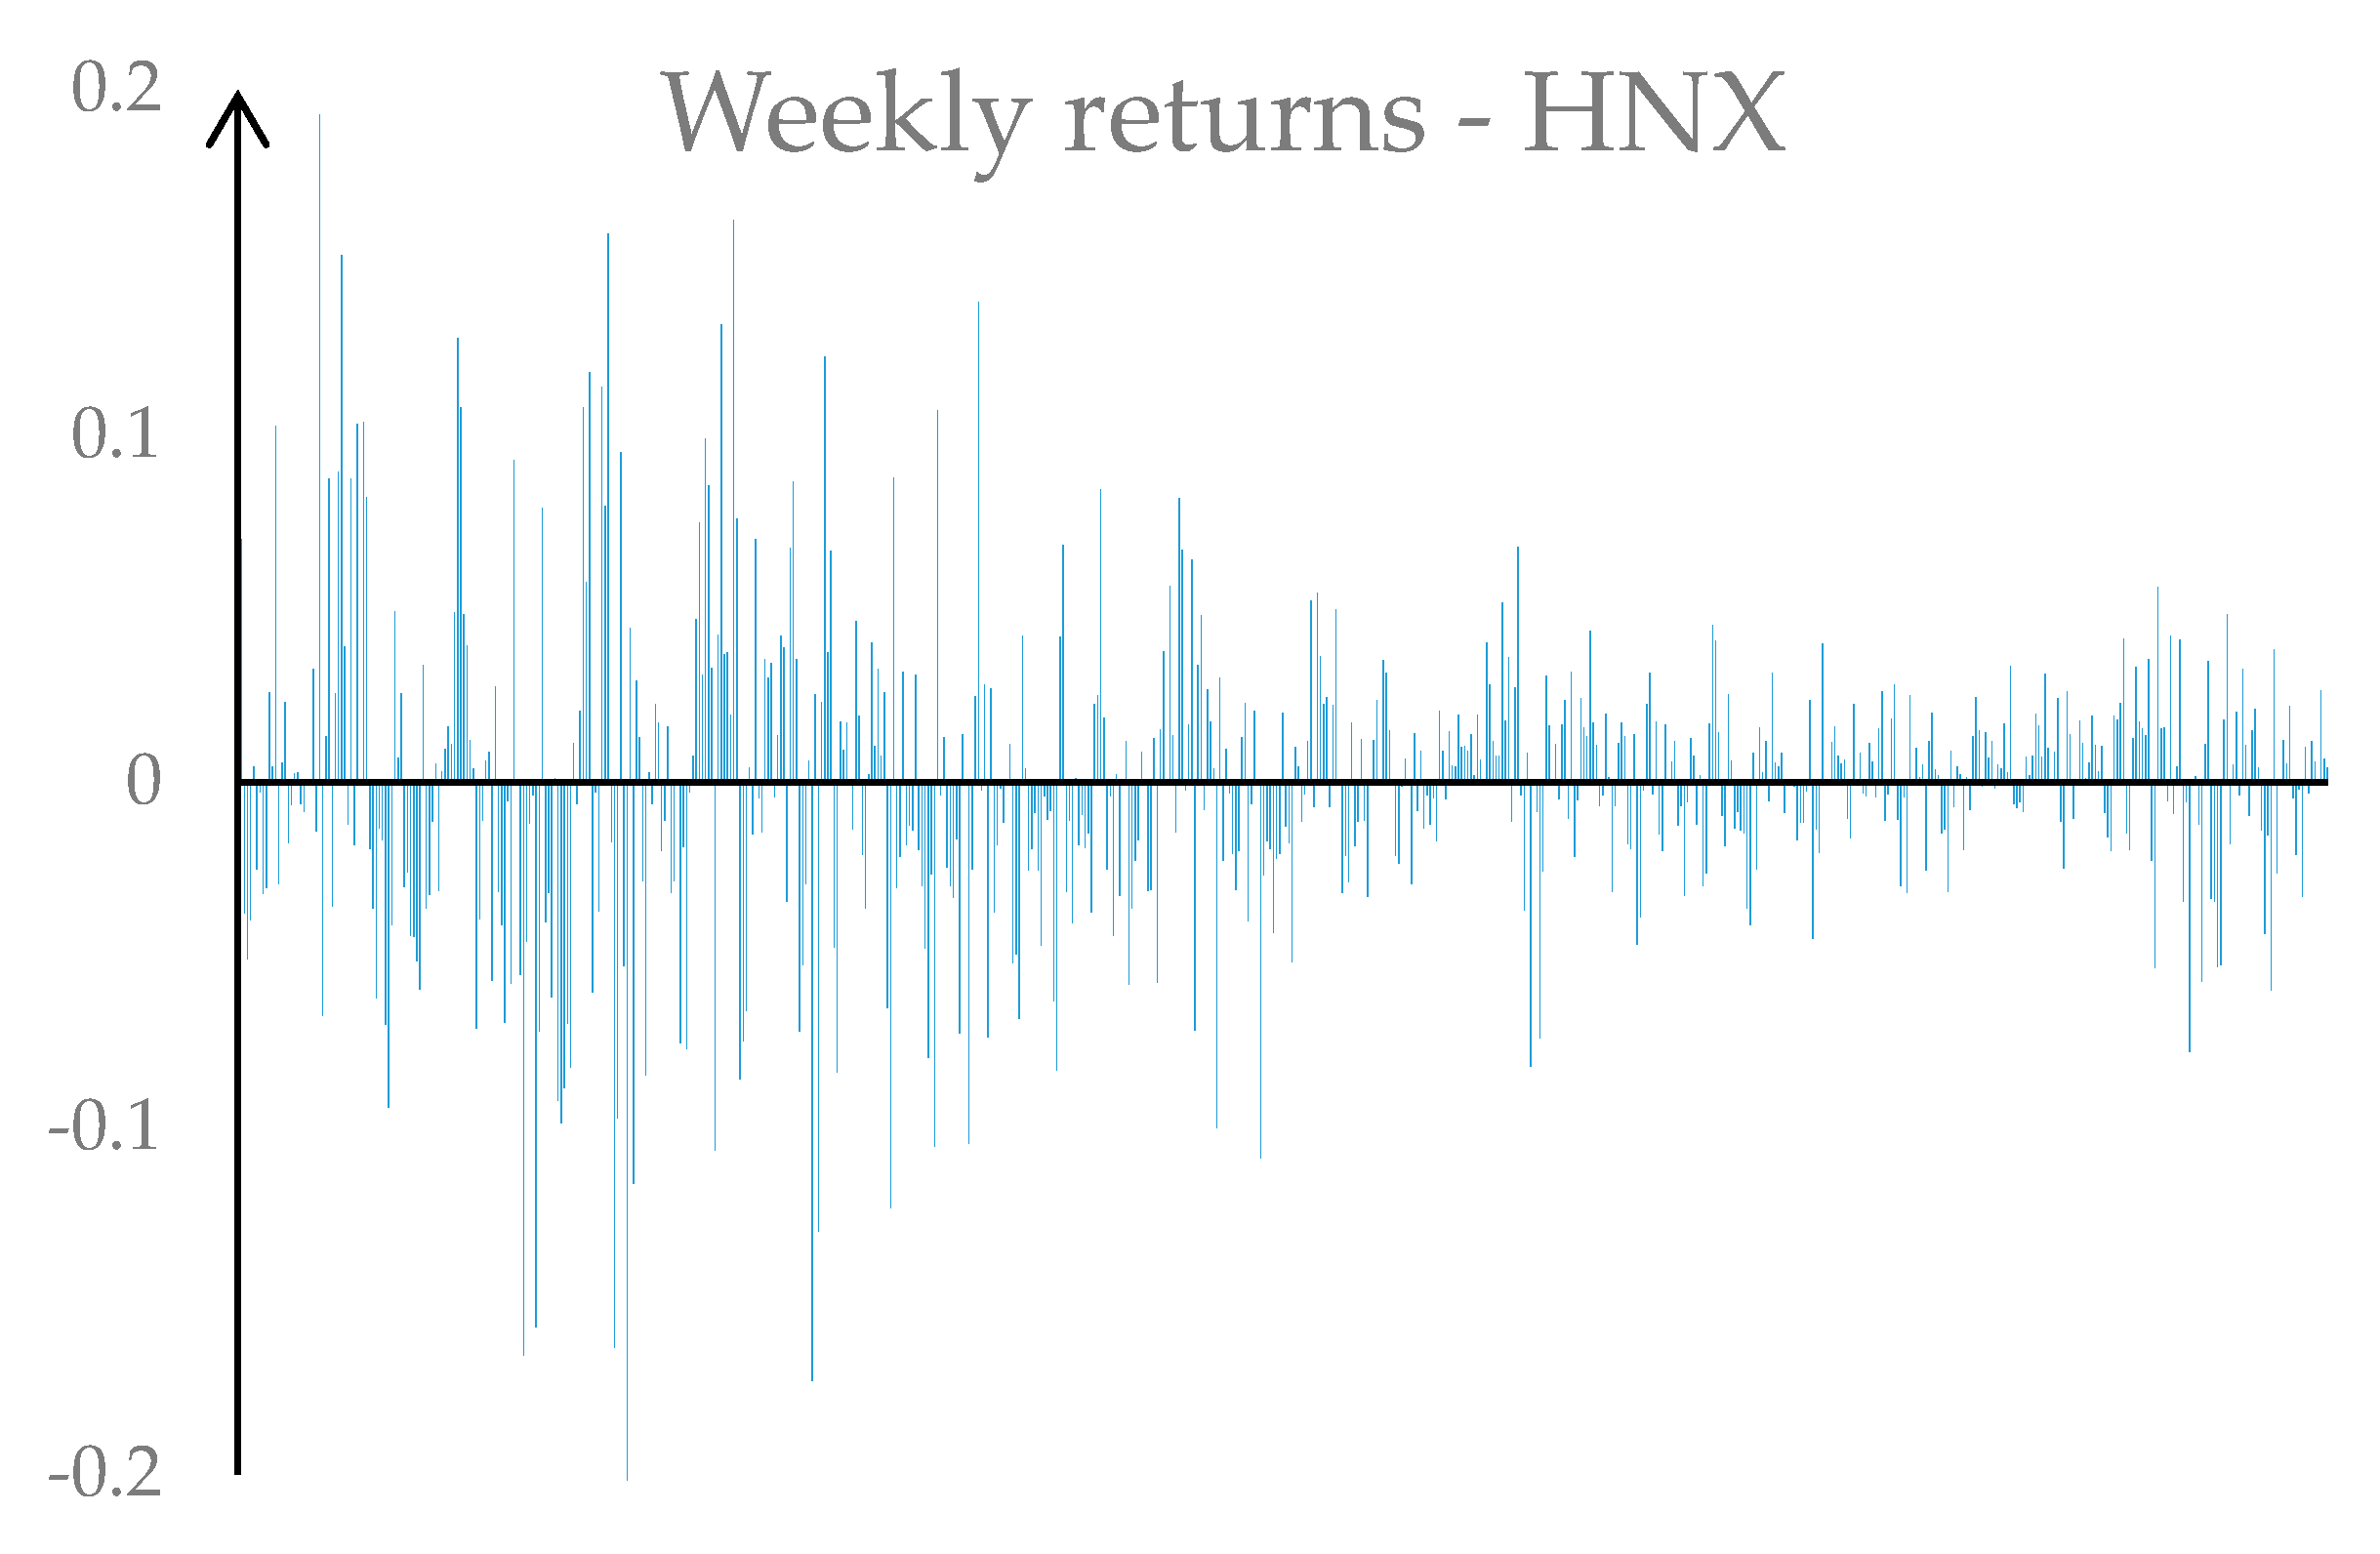
The time-varying autoregressive model is developed from the simple autoregressive model.
The simple autoregressive model has long been used to assess the linear relationship in time series data. However, one major drawback of this model is that the coefficients are fixed, and therefore the simple model cannot handle the time series data with structural breaks, such as stock returns.
Ito et al. (2014) introduced the time-varying autoregressive model as a solution for the aforementioned drawback.The detail on how to employ the model in the AMH testing is presented below.
Firstly, the optimal lag order for each series is chosen using the BIC. The optimal lag orders for VN-INDEX and HNX-INDEX are 2 and 1 correspondingly. Subsequently, a regression followingthe TV-AR model is conducted, of which the theoretical framework is elaborated below.
The TV-AR model is presented in the form of an equation system as follows (with the assumption that parameter dynamics restrict the parameters):
x t =   α 0 + α 1 ,   t x t 1 + α 2 , t x t 2 + + α q , t x t q + u t  
α i , t   = α i , t 1 + v i , t ( i   =   1 ,   2 , ,   q )
E ( u t ) = E ( u t 2 ) = E ( u t u t m ) = 0   m  
E ( v i , t ) = E ( v i , t 2 ) = E ( v i , t v t m ) = 0   m
where x t represents the stock return at time t, α i is the time-varying coefficients, u t and v t are the residuals of the model. (1) and (2) form a system of simultaneous equations for the model.
Denotation of matrices are deployed as follows:
X t 1 =   [ x t 1 x t 2 x t q ] ;   A t   =   [ α 1 , t α 2 , t     α q , t ] ;   I q   is   an   identity   matrix   of   order   q .
Equation (1) can be rewritten accordingly:
x t =   α 0 + X t 1 T × A t T + U t
where X t 1 T ,   A t T are the transpose of X t 1 ,   A t correspondingly.
Assign a range of values (from 1 to T) to the parameter t to obtain the following equation:
[ x 1 x 2 x T ] = [ 1 X 0 T O 1   ×   T 1 X 1 T 1 O 1   ×   T X T 1 T ] × [ α 0 A 1 T A T T ] + [ u 1 u 2 : u T ]
Denote y =   [ x 1 x 2 x T ] ;   β = [ α 0 A 1 T A T T ] ;   U =   [ u 1 u 2 : u T ] ;   M = [ 1 X 0 T O 1   ×   T 1 X 1 T 1 O 1   ×   T X T 1 T ]
where O 1   ×   T is a 1 × T null matrix.
Equation (3) can be simplified accordingly:
y =   M × β +   U  
In a similar manner, Equation (2) can be re-written as:
[ A 0 T 0 0 ] = [ O q   ×   1   I q O q   ×   q O q   ×   1 I q   I q O q   ×   1 O q   ×   q   I q ] × [ α 0 A 1 T A T T ] +   [ v 1 v 2 : v T ]
Denote :   Z =   [ A 0 T 0 0 ] ;   W =   [ O q   ×   1   I q O q   ×   q O q   ×   1 I q   I q O q   ×   1 O q   ×   q   I q ] ;   V =   [ v 1 v 2 : v T ]
The following equation is obtained:
z =   W   ×   β +   V  
Equations (4) and (5) form the equation system of the TV-AR model in the matrix form. It can also be further deducted as below:
[ y z ] =   [ M W ] β + [ U V ]
The result below is obtained using ordinary least squares (OLS) regression:
β ^ =   ( [ M W ] T [ M W ] ) 1 [ M W ] T [ y z ]
The market efficiency is quantified using the following formula, which was used in the work of Noda (2016), a special case of Ito et al. (2014):
MEt   =   | j = 1 p α ^ j , t 1 ( j = 1 p α ^ j , t ) |
This formula measures the deviation from the zero coefficients of the corresponding time-varying moving average (TV-MA) model to our TV-AR model. Hence, the large deviations of MEt from zero is considered evidence of market inefficiency.
Lastly, the authors also employ the bootstrap procedure to construct the confidence band for MEt. The detail of the bootstrapping steps is elaborated in the work of Noda (2016). The bootstrap is conducted under the null hypothesis of zero autocorrelations with 2000 iterations.

2.2. Data

The primary data used in this paper are the weekly stock returns in HNX and HSX, calculated based on the HNX-INDEX and VN-INDEX correspondingly as below:
r t = ln (   P t P t 1   ) =   l n ( P t )   l n ( P t 1 )
where:
  • rt is the weekly stock returns at week t
  • Pt is the value of VN-INDEX/HNX-INDEX at the last trading day of week t
  • Pt−1 is the value of VN-INDEX/HNX-INDEX at the last trading day of week (t − 1)
VN-INDEX data are collected from January 2005 to February 2019, which skipped the first 5 years from 2000 to 2004 of HSX due to the lack of trading activities during this period. HNX-INDEX is collected from May 2006 to February 2019. The data were collected from the online portals of two Vietnamese securities companies, namely VNDIRECT Securities Company and Bao Viet Securities Company (Supplementary Materials).

3. Empirical Results and Discussion

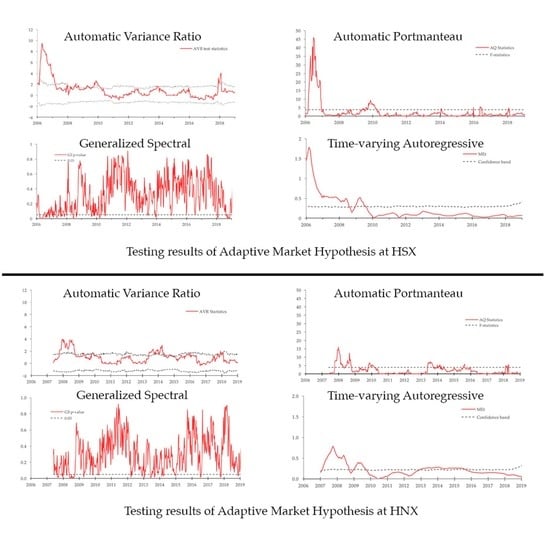
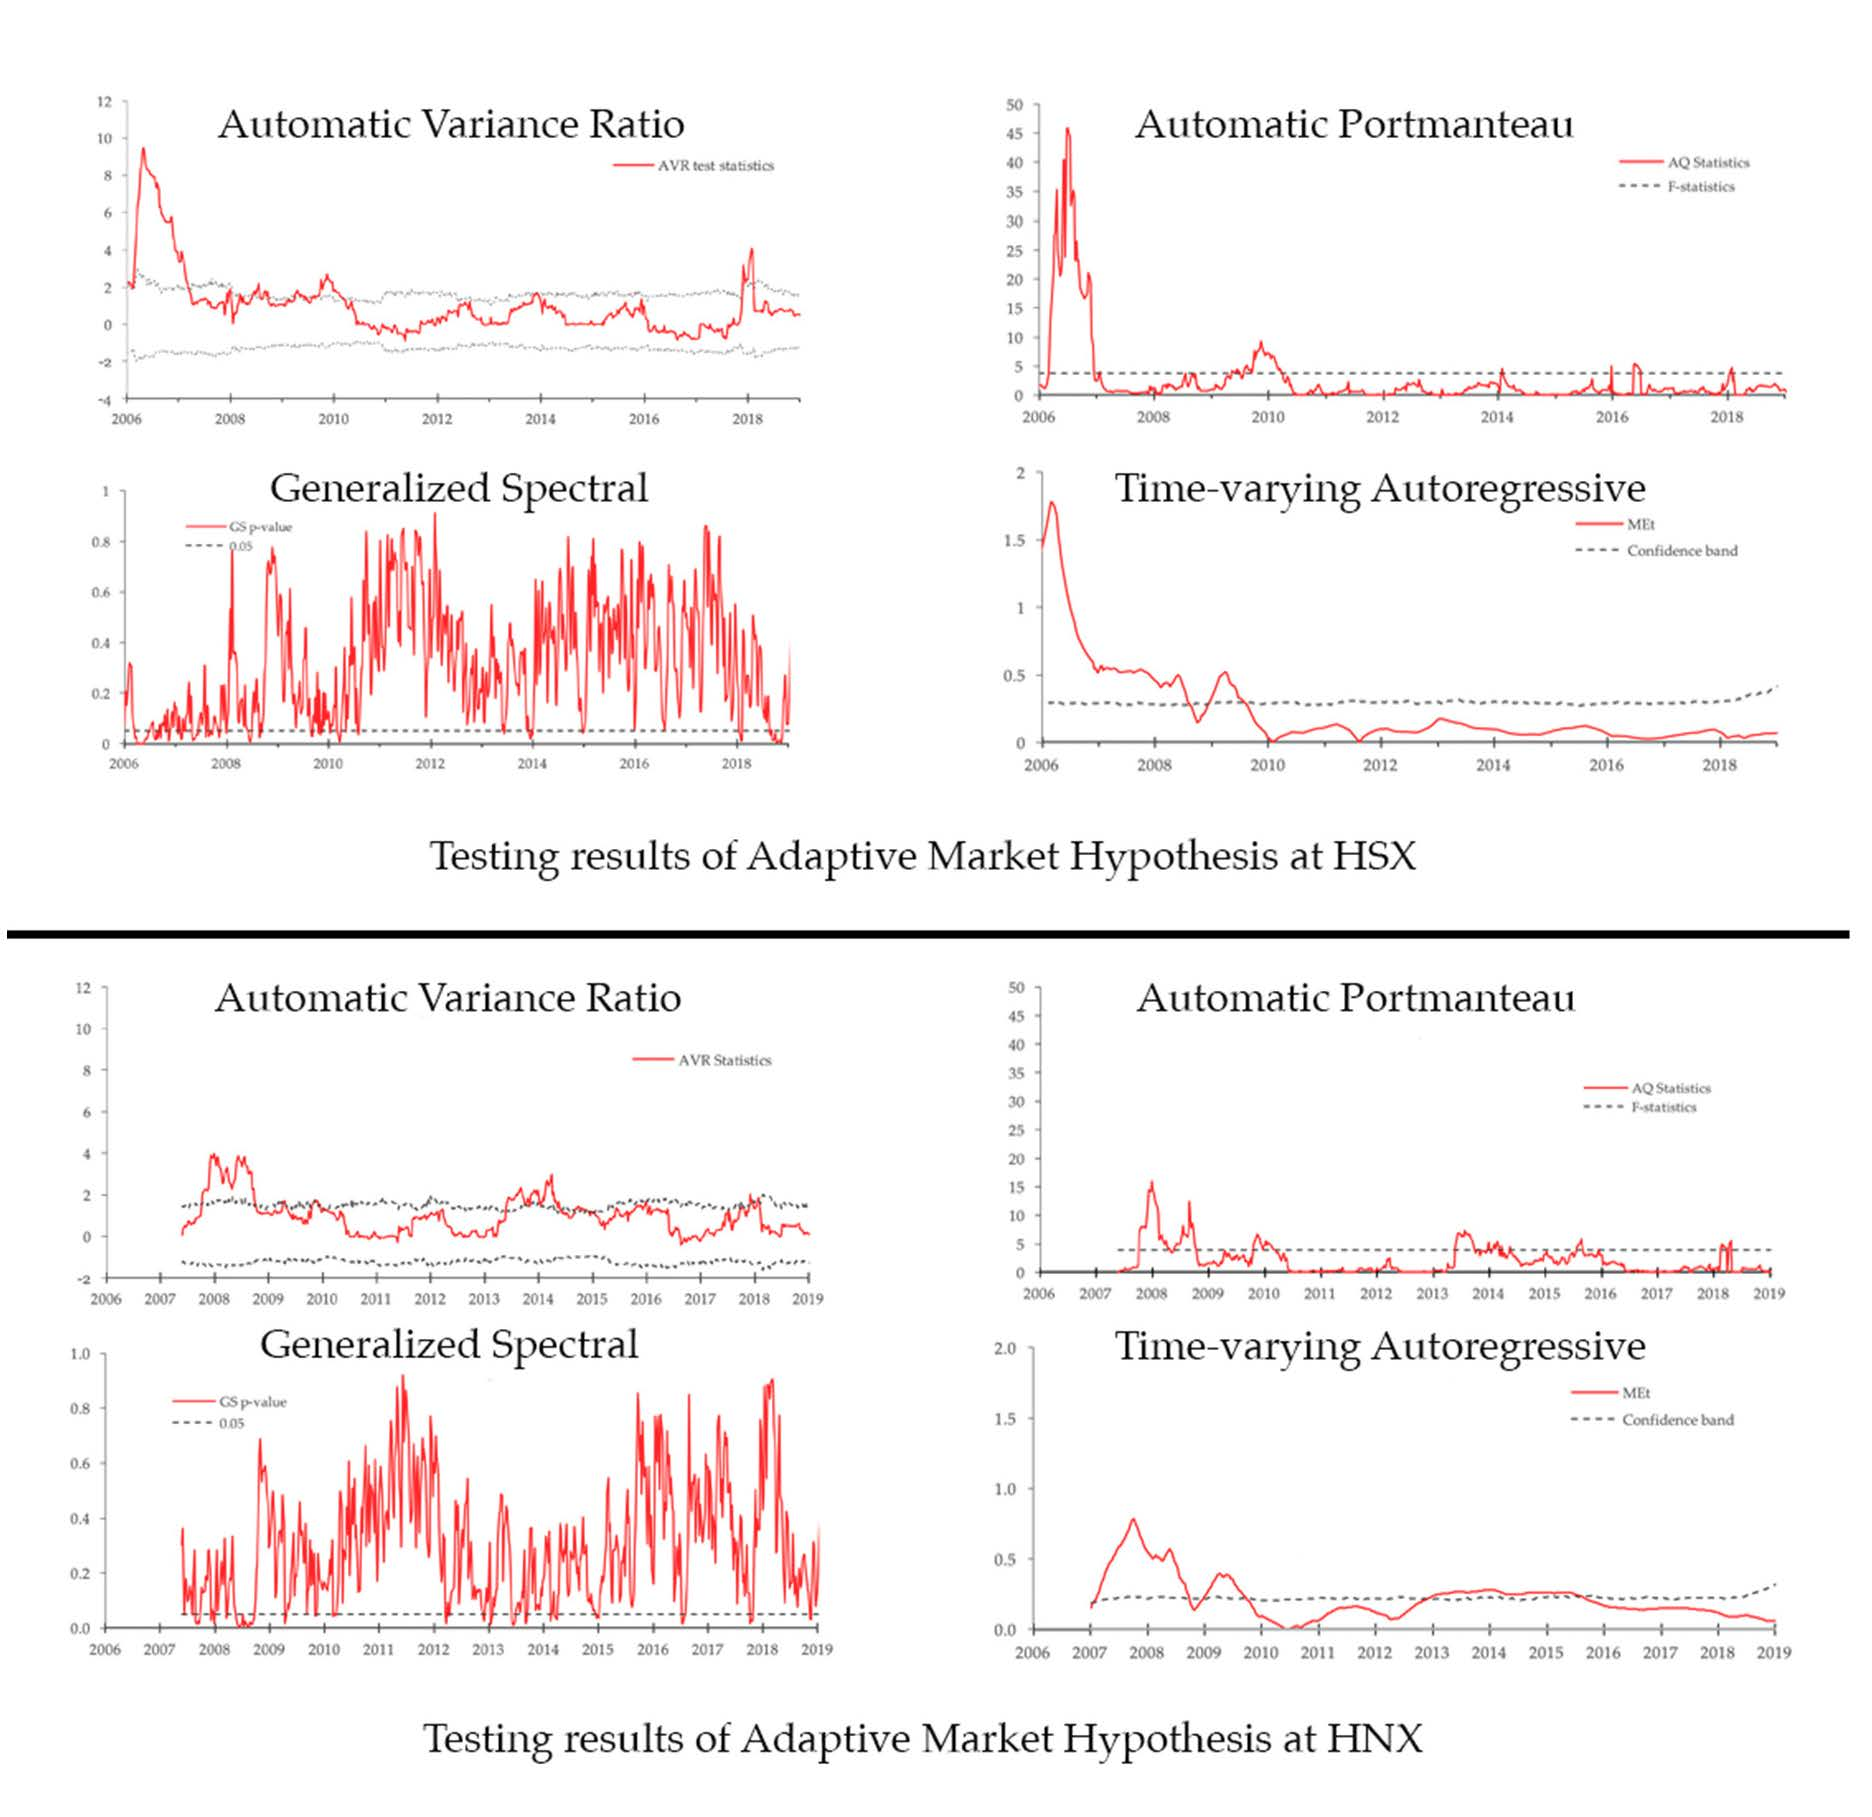
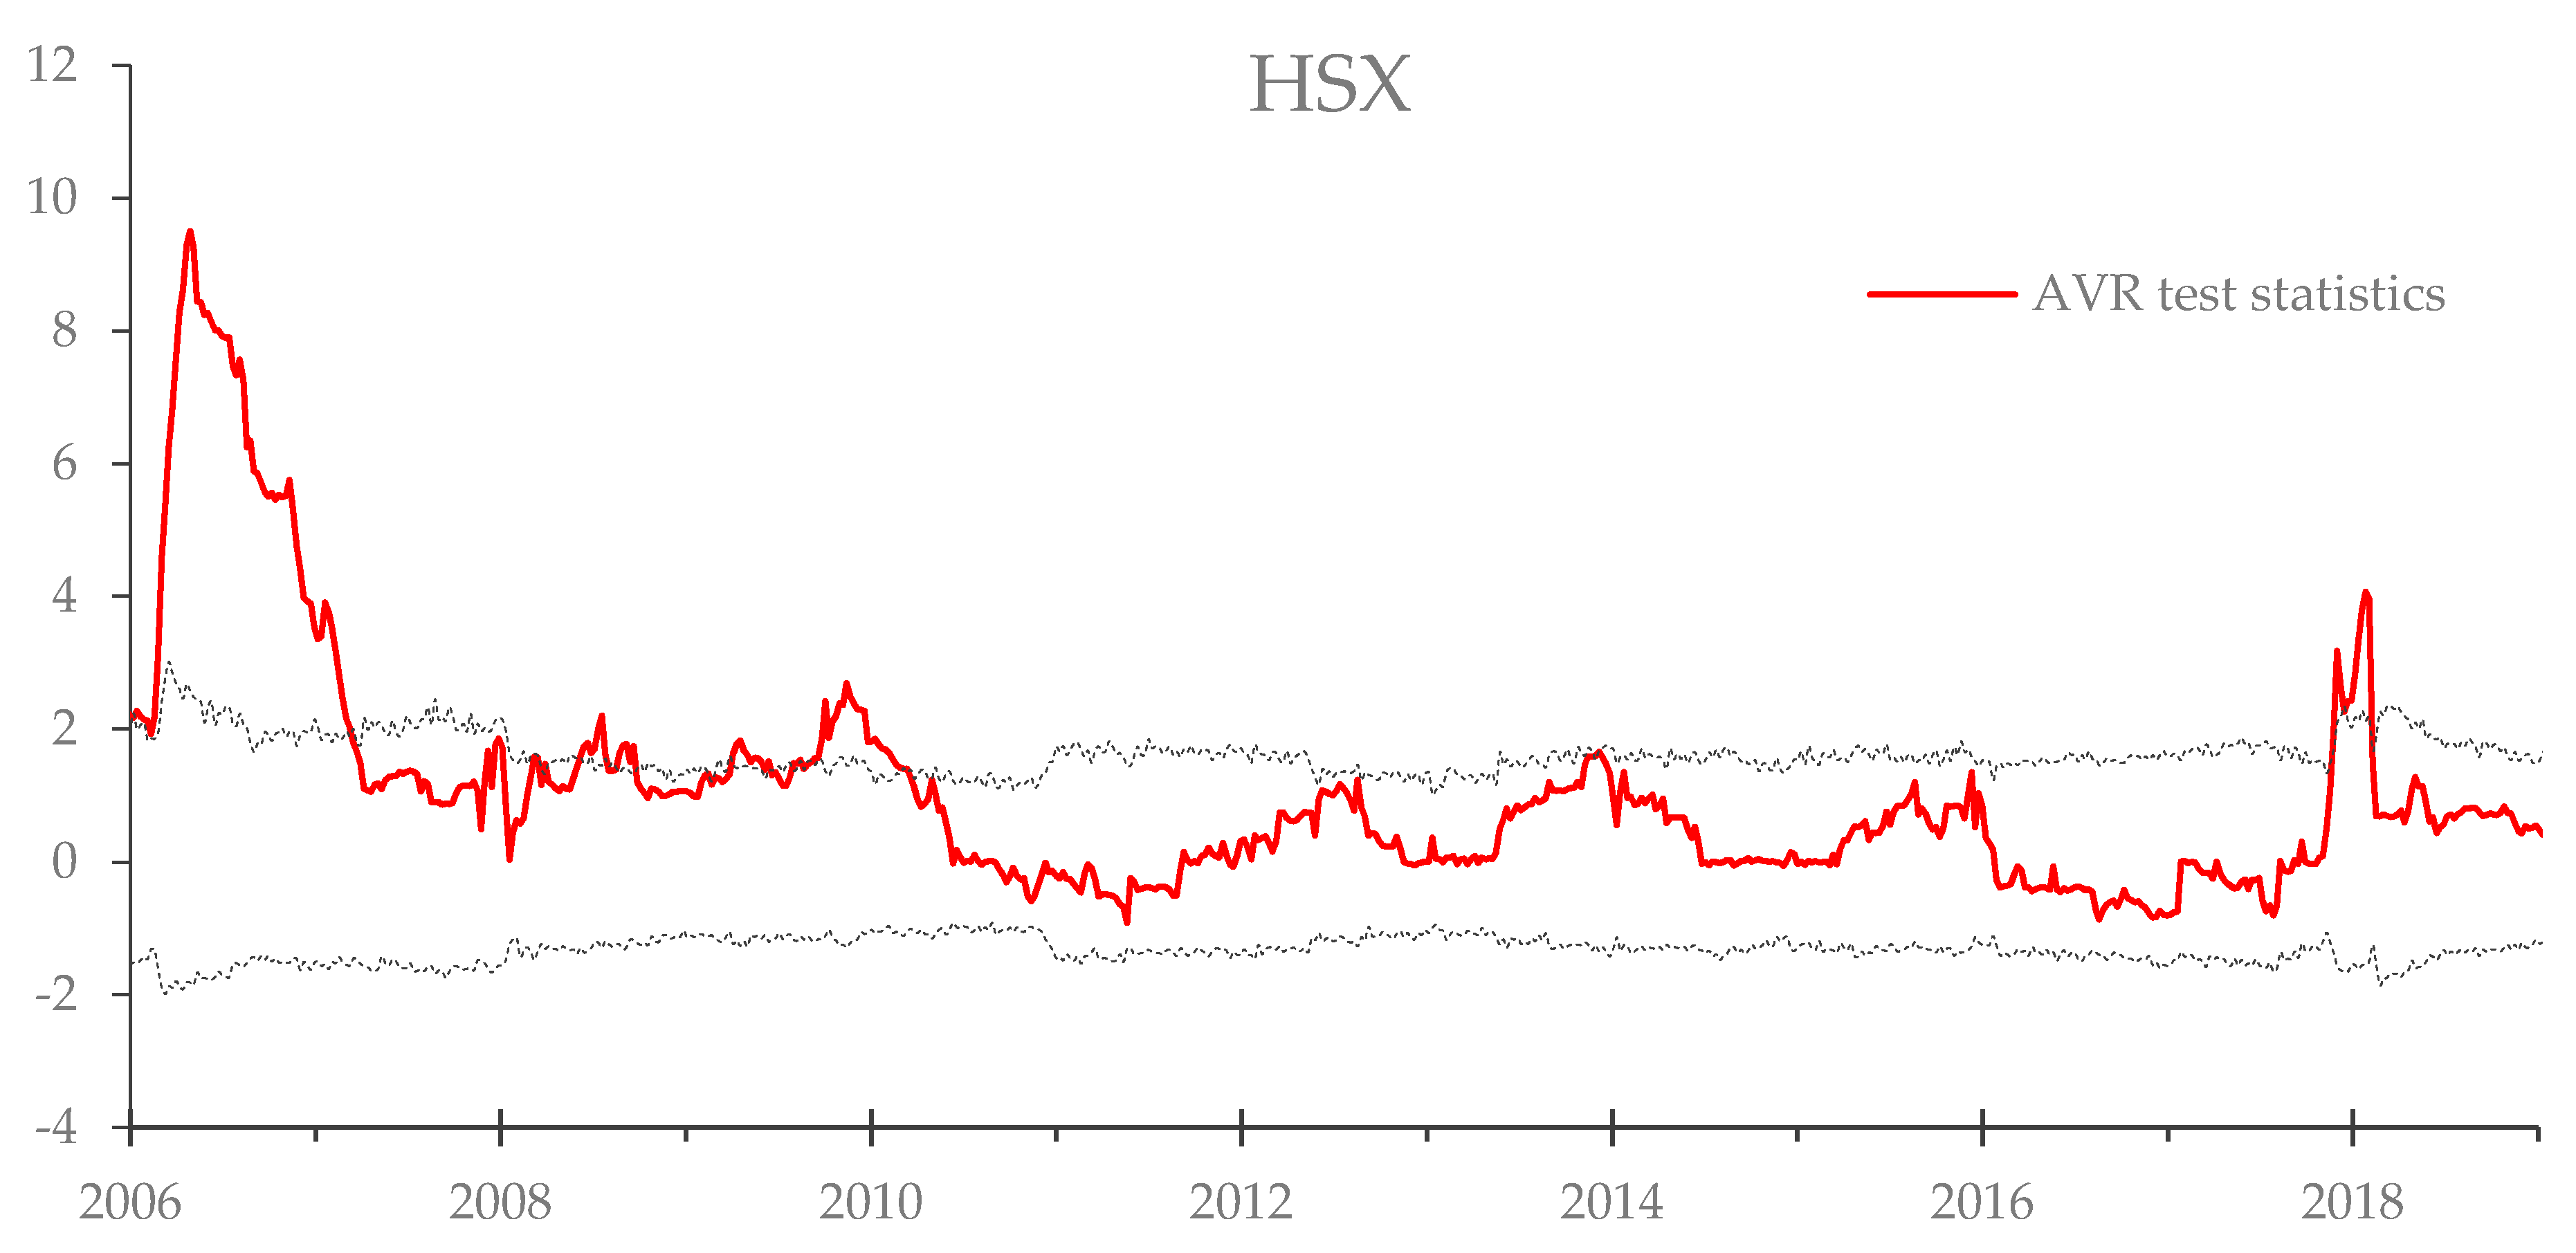
3.1. AVR Test Results

Figure 3 presents the AVR test results at HSX. The red line represents the AVR test statistics, while the dotted black line represents the upper bound and lower bound of the confidence interval.
In general, HSX stock prices were unstable in the first post-creation years, but recently, such variations have been lessened. The market efficiency has improved significantly.
The period from 2006 to 2008 witnessed the peak of AVR statistics, which marked the most inefficient period of HSX. It is worth noting that, during this period, Vietnam was severely impacted by the global financial crisis, with VN-INDEX dropped from more than 70% in just one year. Investors heavily relied on the majority to make trading decisions instead of on the available market information. Not until 2008 did the AVR test statistics drop to the normal level (i.e., within the confidence interval), meaning the market achieved efficiency. This behavior is in line with Kim et al.’s (2011) finding that market efficiency hit bottom in the event of a market crisis and reached its peak when the market crashed.
During the 2008–2010 period, the AVR test statistics were generally greater than the upper bound but not by a large amount. This implies that the market retrieved its stability, but was still considered inefficient, which is likely due to the lasting effect of the financial crisis.
In the first few months of 2011, the AVR statistics continued to drop to nearly zero. This happened at the same time with the global financial crisis, which resulted from the government debt crisis in Greece. This behavior, once again, validates the finding of Kim et al. (2011). More importantly, the impact of the succeeding crisis was not as strong as the preceding one, most probably because investors were becoming better informed and cautious in trading activities. In fact, the herd mentality in 2011 was much less serious in 2007, as the market capitalization only increased by 140% in 2010 in comparison with an increase of 1100% in 2006. This further proves the adaptive nature of the market, which is also an important implication of the AMH theory.
From 2012 until recently, the AVR statistics have stayed within the confidence interval most of the time. The AVR statistics occasionally crossed the upper bound and went up (at the beginning of 2018, with an expectation of increasing risk level due to the worsening U.S-China trade war, interest hike and quantitative tightening), nevertheless, the test statistics have never been too far off the band and quickly reverted in a short period of time. It can be concluded that while HSX may not be fully efficient, it has improved substantially in such regard.
The AVR test statistics of HNX are demonstrated in Figure 4 below:
In the first post-creation years, the AVR test statistics at HNX had been remarkably high, which is likely to result from the market inefficiency and the negative effect of the financial crisis in 2007 and 2011. From 2011 onwards, the AVR test statistics in HNX gained stability and have been highly correlated with the test statistics in HSX. This suggests that the market efficiency of HNX, despite the market’s most recent formation, has experienced periods of efficiency and inefficiency although it has been dependent on market conditions.
In conclusion, according to the AVR test statistics, the market efficiency in both exchanges expressed the same behavior: It has been varying over time, with alternating periods of efficiency and periods of inefficiency. In addition, the study proves that market efficiency is affected by market conditions.

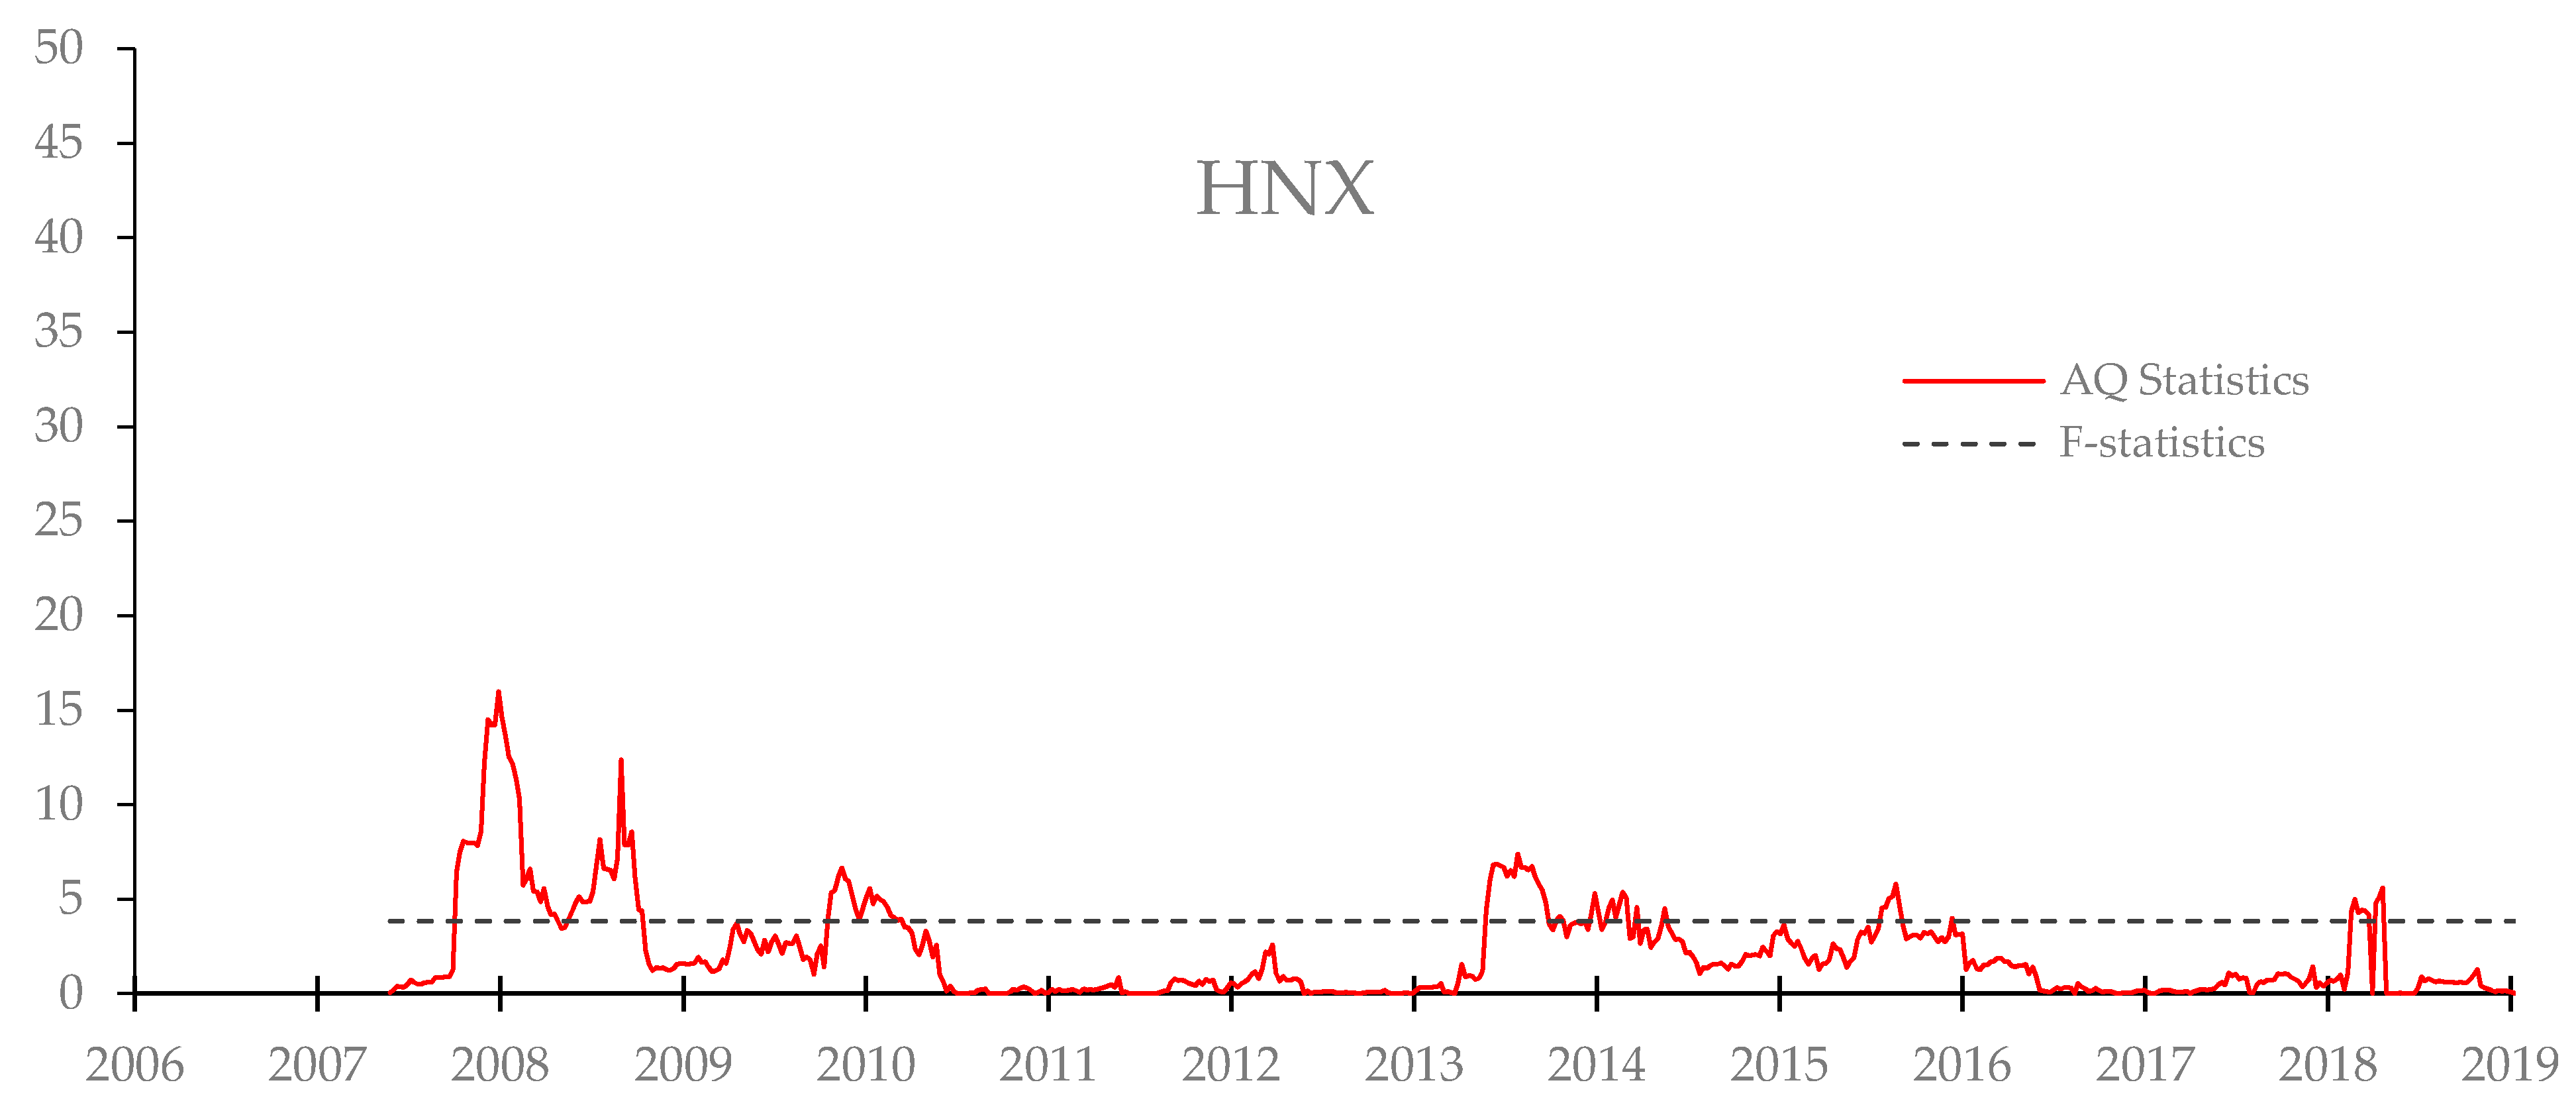
3.2. AP Test Results

The purpose of the AP test is to solidify the AVR test results and to make sure that no positive and negative correlations are canceled out. The AP test results of HSX and HNX are illustrated in Figure 5 and Figure 6 correspondingly, with the red line representing the test statistics and the black dotted line representing the F-statistics at 5% significance level:
The results are highly consistent with the AVR test results, which implies that no correlations with the opposites canceled out each other. The AP results also confirm the AMH theory in the case of the Vietnamese stock market.

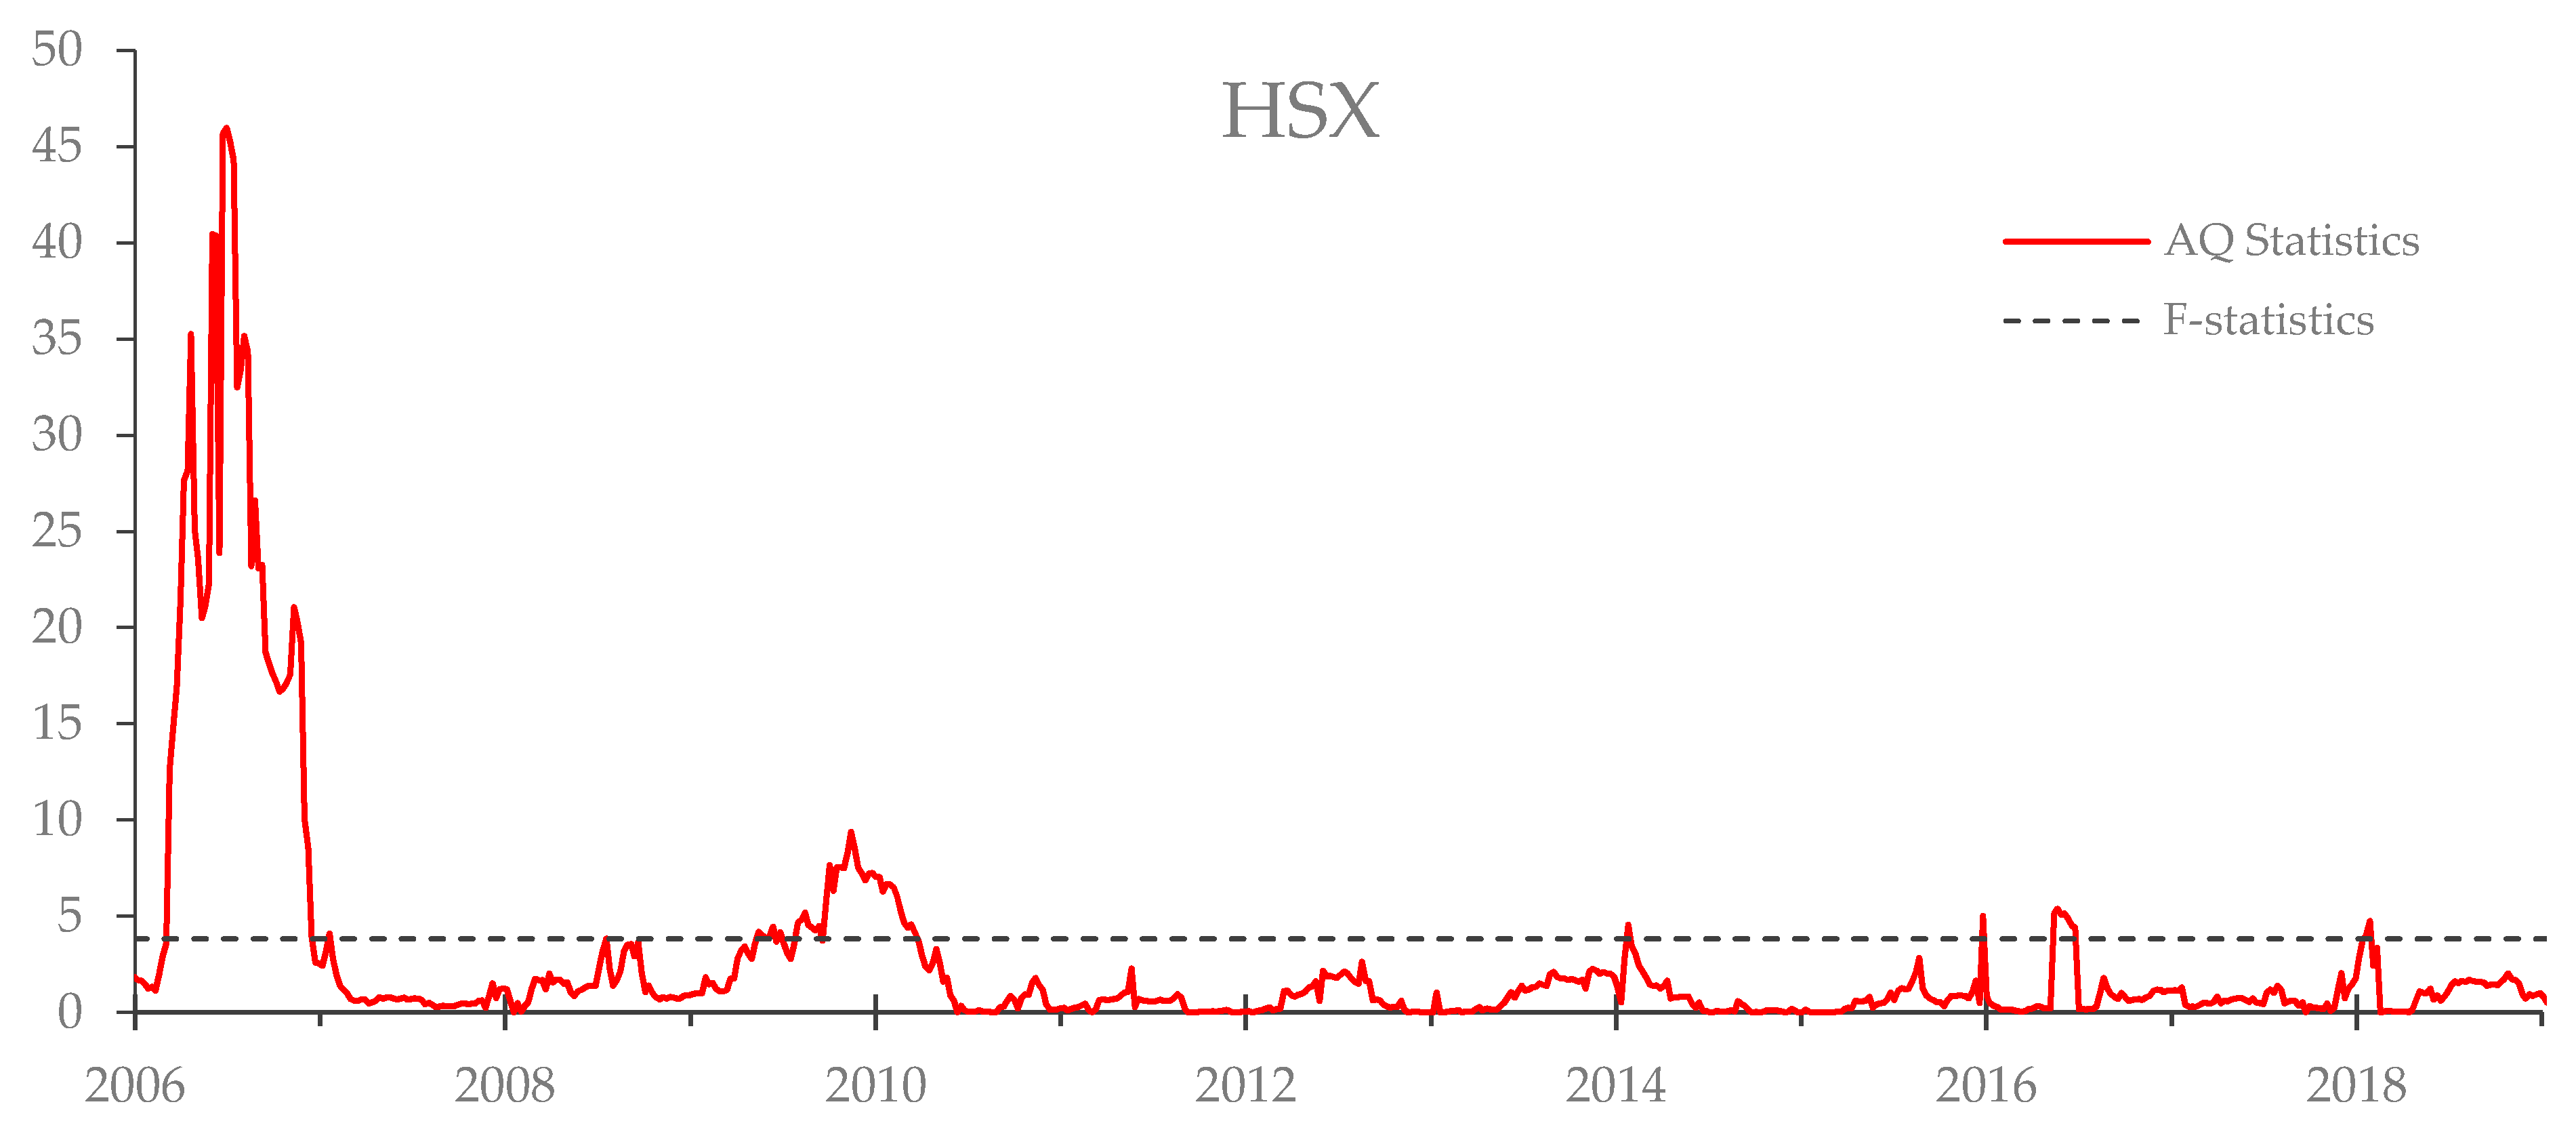
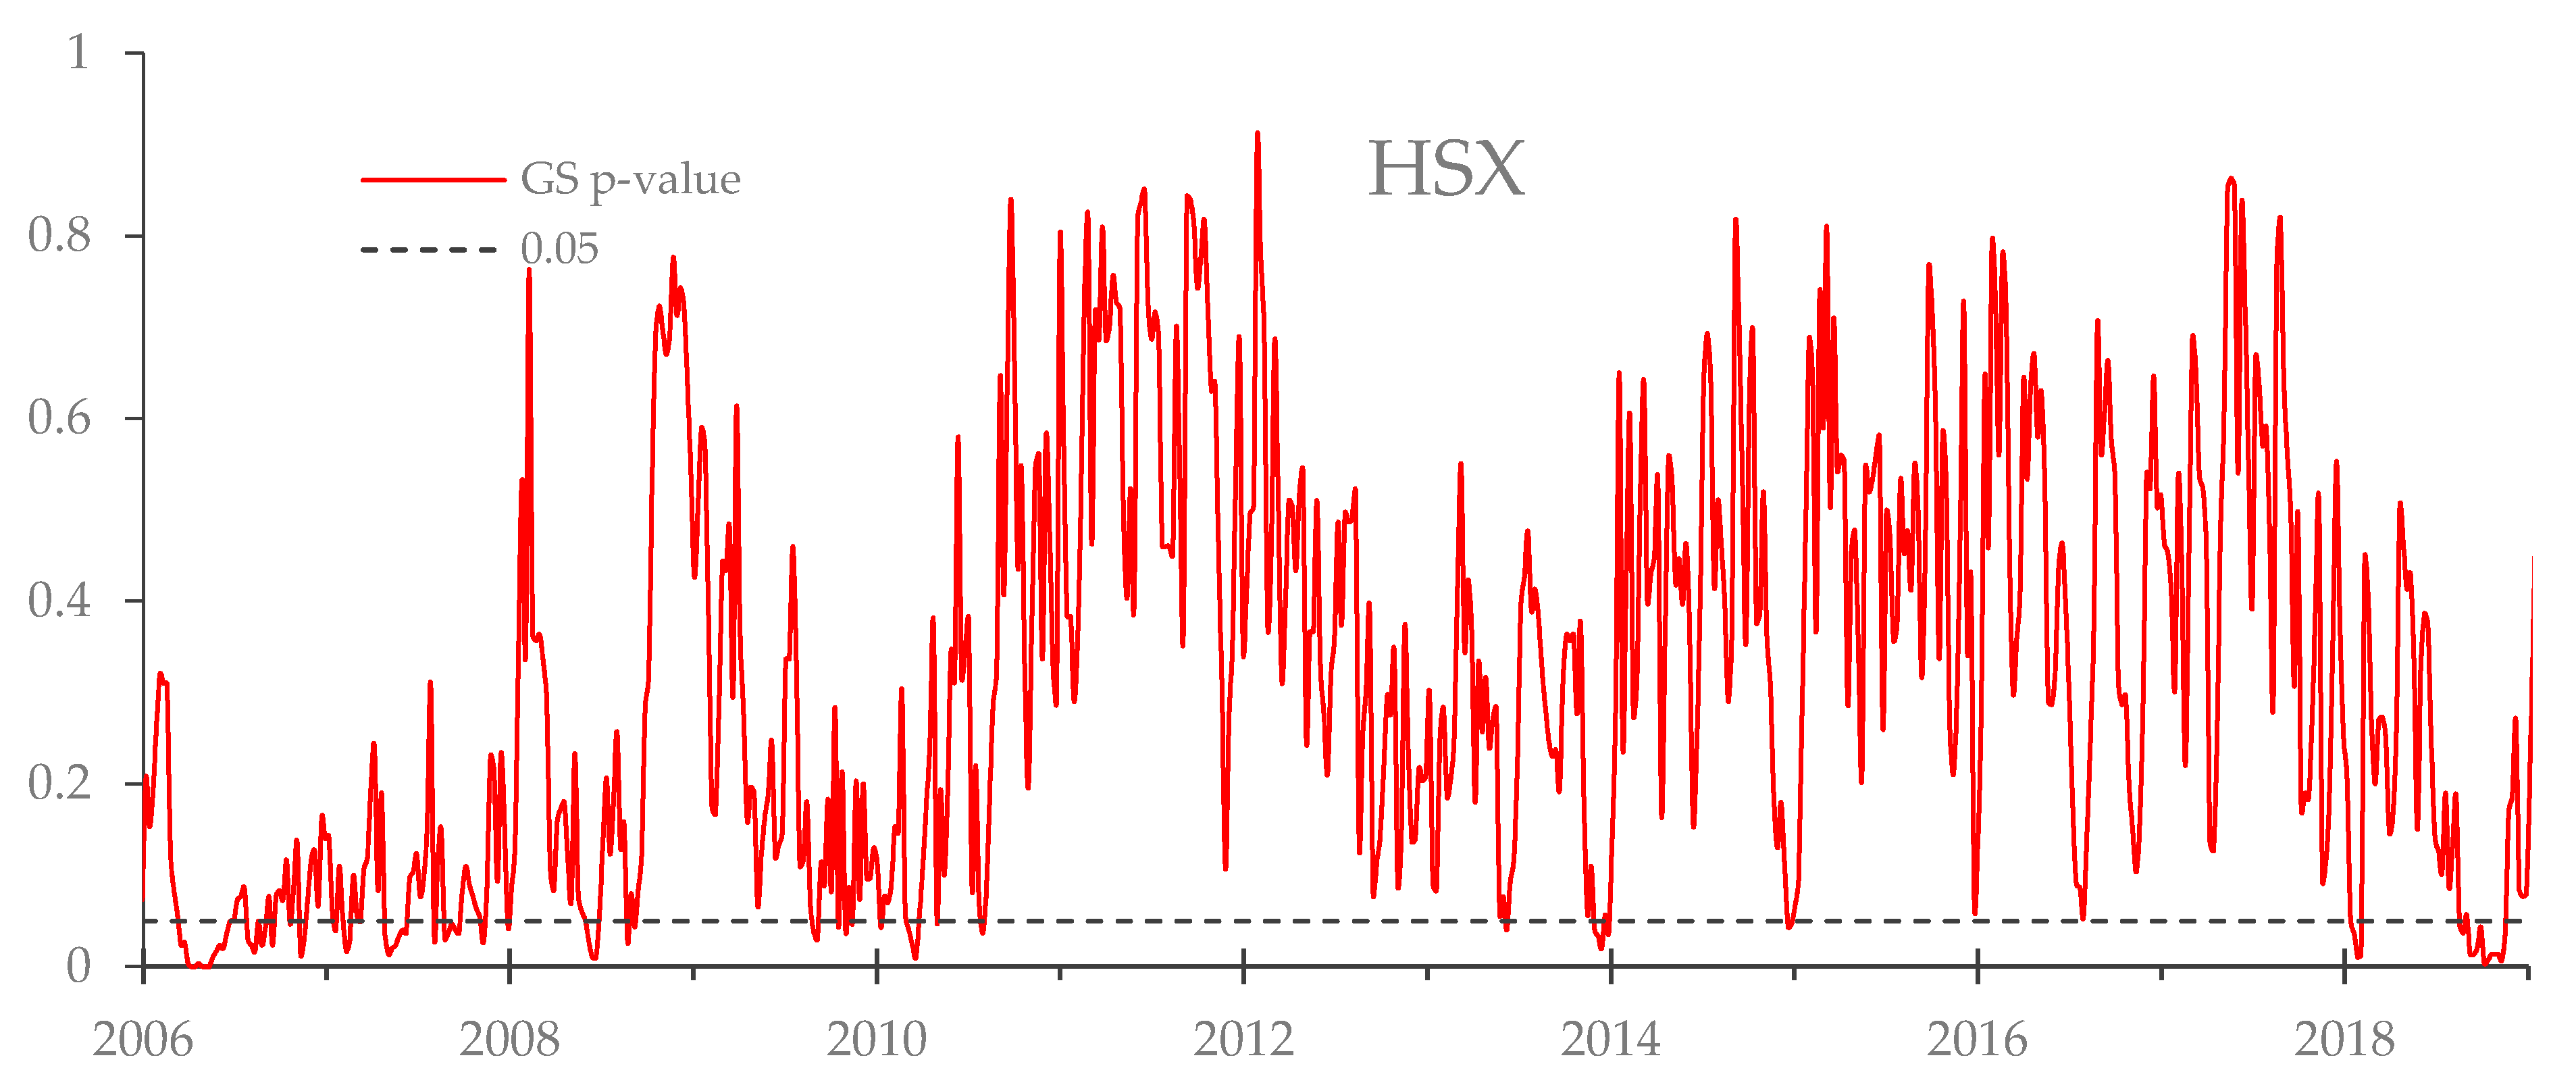
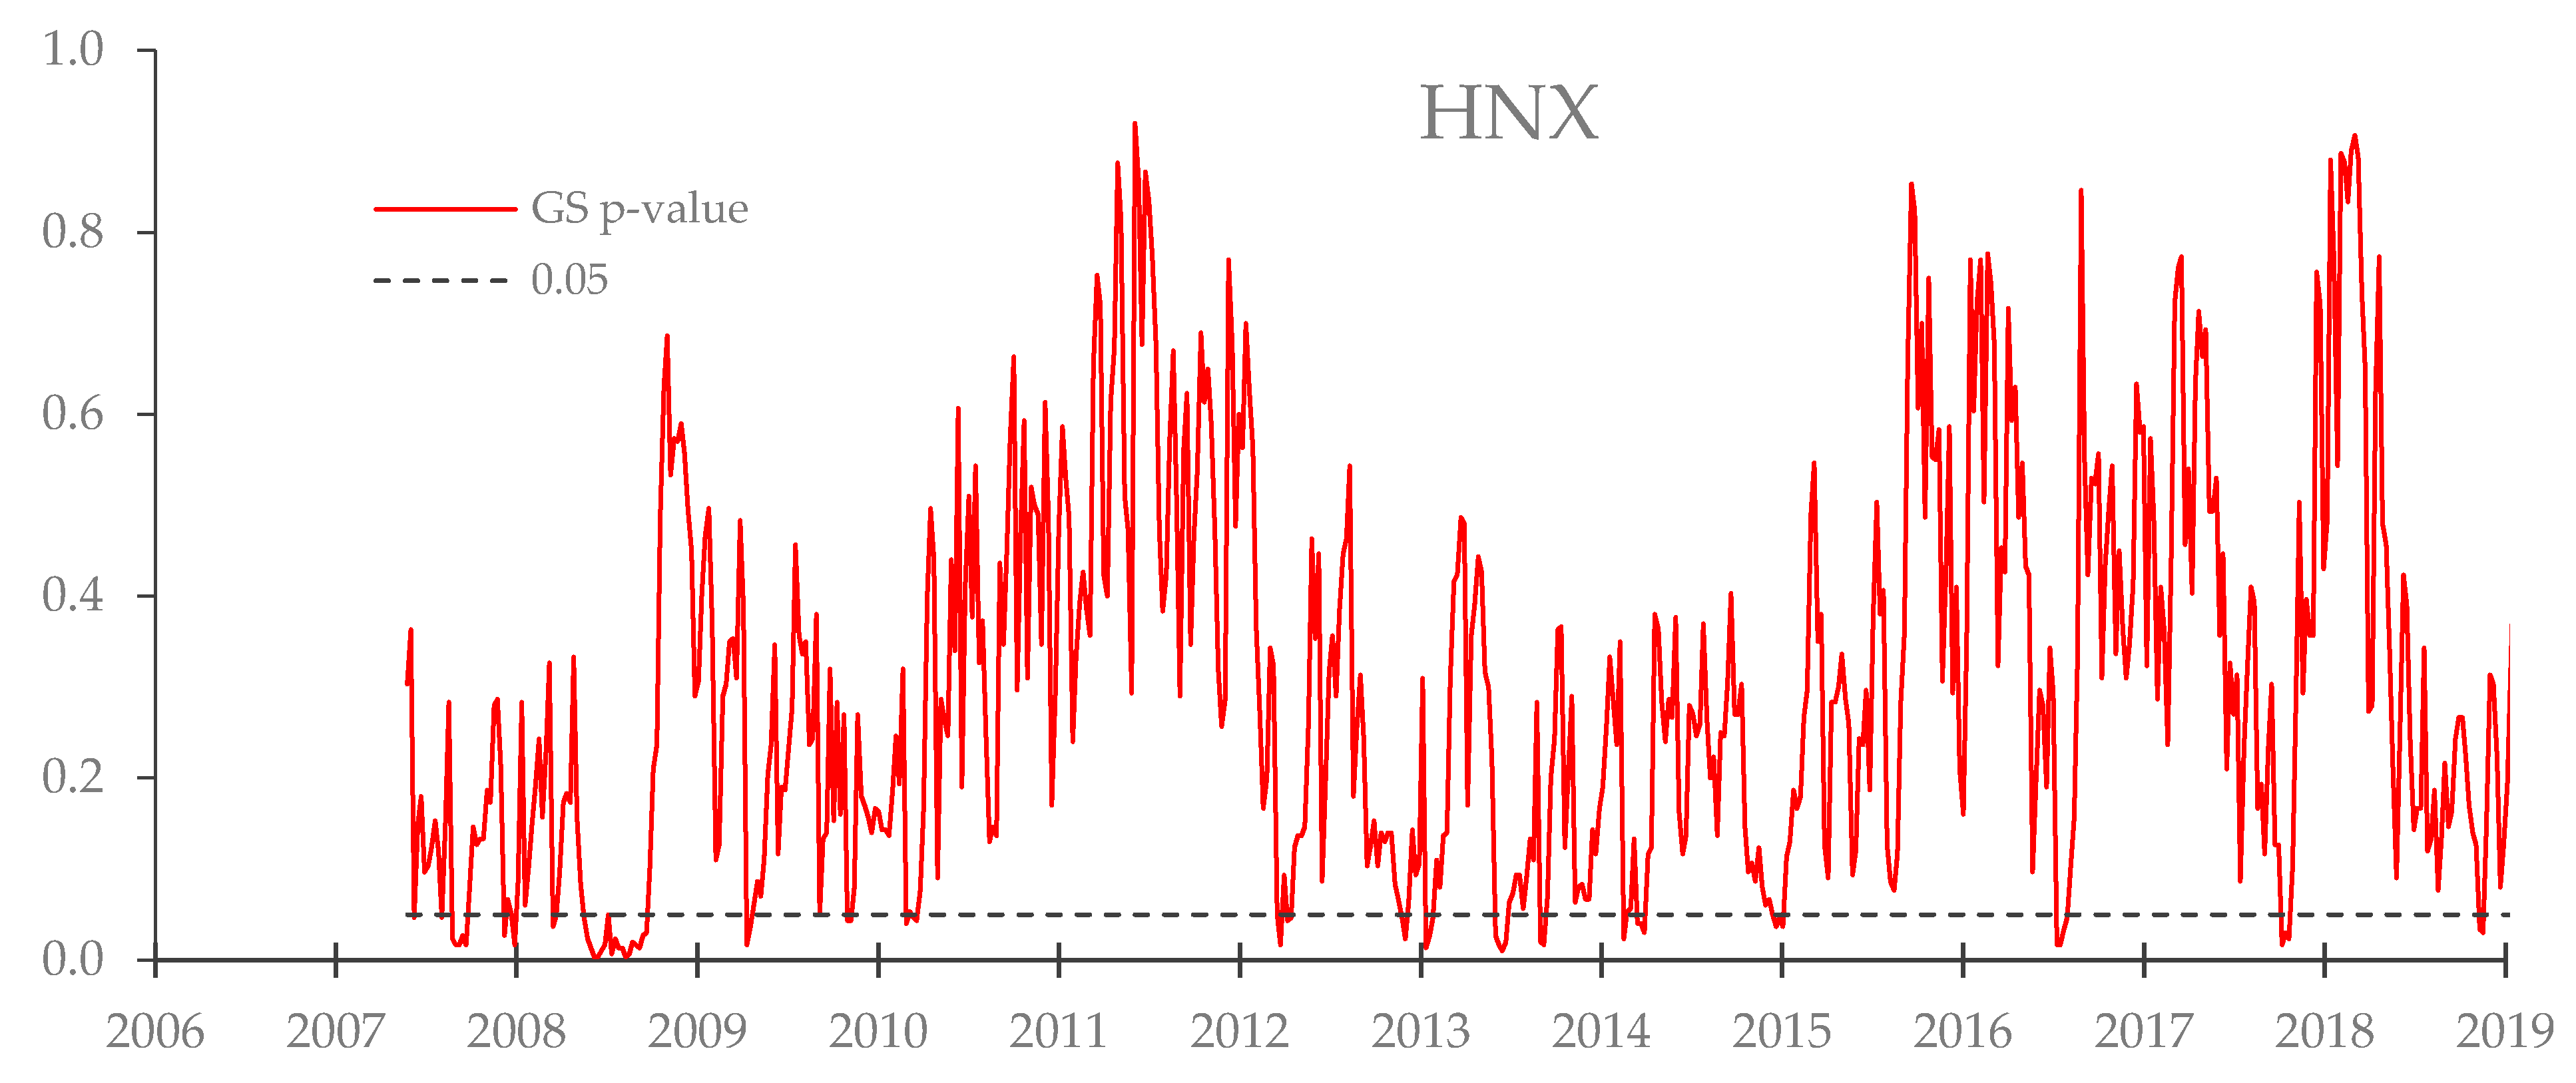
3.3. The GS Test Statistics

The GS test statistics are utilized to detect the non-linear relationship within time series data. The p-values of GS test results of HSX and HNX are presented in Figure 7 and Figure 8, with the red line being the p-values and the black dotted line being the 5% significance level.
The p-values of the GS test results indicate that market efficiency has undergone many alternating periods of efficiency and inefficiency. The test also reveals a few periods of inefficiency that were omitted in the previous two tests, implying the existence of significant non-linear autocorrelations in stock prices.
The line representing the GS test p-value might look different from the line representing the AVR test statistics and the AP test statistics. This is mainly due to the fact that market efficiency is indicated by lower test statistics in the AVR test and AP test; meanwhile, it is indicated by a higher p-value in the GS test.Therefore, the GS test resultsis still considered to be highly consistent with the previous tests, which confirm the AMH theory in the Vietnamese stock market.

3.4. The TV-AR Approach

The degree of market efficiency MEt obtained from this approach is presented in Figure 9 and Figure 10, with the red line being the value of MEt and the black dotted line being the 5% significance level.
It can be observed that the results of the TV-AR are highly consistent with the other battery of autocorrelation tests. This serves as a validation for the battery of autocorrelation tests, that the results of the autocorrelation tests are robust and the conclusions remain consistent with a different approach.

4. Limitations and Suggestions

The most significant drawback of this research paper is that the second criterion proposed by Lim and Brooks (2011), i.e., the market efficiency should be dependent on market conditions, was only assessed qualitatively. This qualitative approach was selected due to the fact that the Vietnamese market had only undergone one brief period of stock market bubble-induced crisis, and therefore it impossible to form a large enough sample for a statistically meaningful analysis. Our future research will expand to cover further analysis using Bayesian network modeling with the R package Bayes VL (Vuong and La 2019) As a qualitative assessment might suffer from the subjective opinion of the authors, the paper cannot provide a strong argument for that matter.
Our recommended workaround for this drawback is to pool a large sample of stock indices, including the Vietnamese stock indices and other comparable indices from other countries which are similar to Vietnam. The data should be collected in the form of panel data, so the data in relation to market conditions can be large enough to provide a correct inference. This approach requires that researchers have the sound knowledge of the Vietnamese stock market and the stock markets in similar countries, and that the selected approach should be compatible with panel data.

5. Conclusions

This paper aims to examine the AMH theory in the Vietnamese stock market through a battery of autocorrelation tests, namely the AVR test, the AP test, and the GS test, and a time-varying autoregressive approach. The rolling window method is used with the fixed 2-year window length.
The AVR test, the primary testing method of this paper results in different times of efficiency and inefficiency, with the strongest AVR statistics in the crisis period 2007–2008 in Vietnam. There were consequent signals of inefficiency afterward, but the level was decreasing over time, consistent with the AMH. Test results are in general identical between HSX and HNX.
In order to eliminate the effect of signs, the AP test which relies on the squared correlation coefficients is employed. The outcome of AP test shows consistency with the AVR test, rejecting the effect of signs offsetting.
The non-linear relationship which cannot be detected by linear tests is examined by the GS test, and despite having similar results to the aforementioned tests, it does show some inefficiencies which are missed by linear testing methods.
Aside from the battery of statistical tests, we have also fitted a TV-AR model, which serves as an alternative approach and a robustness check for the testing results. In the TV-AR model, the deviation of coefficients is the proxy for the degree of market inefficiency. Accordingly, we have found that the result of the TV-AR approach is highly consistent with the result of the other approach. The result shows that the market inefficiency peaked and dropped in the period 2006–2008 and 2011, similar to the findings in the battery of autocorrelation tests.
The main implications of the tests are summarized below:
Evidence of market inefficiency is significant in financial crises, i.e., the period 2006–2007 and 2011, followed by a normalization phase when the market crashed andmarket efficiency was back to normal. This behavior is found to be consistent with those in the study conducted by Kim et al. (2011), which discovered that the market efficiency slumped in the event of financial crises and peaked when the market crashed.
Moreover, we also found that the impact of the financial crisis in 2011 was less severe than that of the financial crisis in 2007, which is likely due to an increase in investors’ rationality. In other words, there is evidence suggesting that market behaviors have gradually improved—which is a critical implication of AMH theory.
In conclusion, as the Vietnamese stock market efficiency are both varying over time and influenced by the market conditions, it is concluded that the behavior of the Vietnamese stock market is in line with the adaptive market hypothesis.

Supplementary Materials

The following are available online at https://www.mdpi.com/1911-8074/12/2/81/s1.

Author Contributions

Both the authors were involved in conceptualization and writing. D.P.T.T. provided contributions to concept development, statistical model checks and results discussion. H.P.Q. provided contributions to methodology and data analysis, and R software analysis deployment.

Funding

This paper is funded by Research Project coded B2019-NTH-02 from Ministry of Education and Training, Vietnam.

Conflicts of Interest

The authors declare no conflict of interest.

References

  1. Choi, In. 1999. Testing the Random Walk Hypothesis for Real Exchange Rates. Journal of Applied Econometrics 14: 293–308. [Google Scholar] [CrossRef]
  2. Cuong, Phan Khoa, and Zhou Jian. 2014. Factors influencing individual investors’ behavior: An empirical study of the Vietnamese stock market. American Journal of Business and Management 3: 77–94. [Google Scholar] [CrossRef]
  3. Dong Loc, Truong, Ger Lanjouw, and Robert Lensink. 2010. Stock-market efficiency in thin-trading markets: The case of the Vietnamese stock market. Applied Economics 42: 3519–32. [Google Scholar] [CrossRef]
  4. Escanciano, J. Carlos, and Carlos Velasco. 2006. Generalized Spectral Tests for the Martingale Difference Hypothesis. Journal of Econometrics 134: 151–85. [Google Scholar] [CrossRef]
  5. Escanciano, J. Carlos, and Ignacio N. Lobato. 2009. Testing the Martingale Hypothesis. Palgrave Handbook of Econometrics, 972–1003. [Google Scholar]
  6. Fama, Eugene F. 1970. Efficient Capital Markets: A Review of Theory and Empirical Work. The Journal of Finance 25: 383–417. [Google Scholar] [CrossRef]
  7. Hiremath, Gourishankar S., and Jyoti Kumari. 2014. Stock Returns Predictability and the Adaptive Market Hypothesis in Emerging Markets: Evidence from India. SpringerPlus 3: 428. [Google Scholar] [CrossRef]
  8. Hoque, Hafiz A.A.B., Jae H. Kim, and Chong Soo Pyun. 2007. A Comparison of Variance Ratio Tests of Random Walk: A Case of Asian Emerging Stock Markets. International Review of Economics & Finance 16: 488–502. [Google Scholar]
  9. Ito, Mikio, Akihiko Noda, and Tatsuma Wada. 2014. International Stock Market Efficiency: A Non-Bayesian Time-Varying Model Approach. Applied Economics 46: 2744–54. [Google Scholar] [CrossRef]
  10. Ito, Mikio, and Shunsuke Sugiyama. 2009. Measuring the Degree of Time Varying Market Inefficiency. Economics Letters 103: 62–64. [Google Scholar] [CrossRef]
  11. Ito, Mikio, Akihiko Noda, and Tatsuma Wada. 2016. The evolution of stock market efficiency in the US: A non-Bayesian time-varying model approach. Applied Economics 48: 621–35. [Google Scholar] [CrossRef]
  12. Kim, Jae H. 2006. Wild Bootstrapping Variance Ratio Tests. Economics Letters 92: 38–43. [Google Scholar] [CrossRef]
  13. Kim, Jae H., Abul Shamsuddin, and Kian-Ping Lim. 2011. Stock Return Predictability and the Adaptive Markets Hypothesis: Evidence from Century-Long U.S. Data. Journal of Empirical Finance 18: 868–79. [Google Scholar] [CrossRef]
  14. Lim, Kian-Ping, and Robert Brooks. 2011. The evolution of stock market efficiency over time: A survey of the empirical literature. Journal of Economic Surveys 25: 69–108. [Google Scholar] [CrossRef]
  15. Lim, Kian-Ping, Robert Darren Brooks, and Melvin Hinich. 2006. Testing the Assertion That Emerging Asian Stock Markets Are Becoming More Efficient. SSRN Journal. Available online: https://papers.ssrn.com/sol3/papers.cfm?abstract_id=906515 (accessed on 29 March 2019). [CrossRef]
  16. Lim, Kian-Ping, Weiwei Luo, and Jae H. Kim. 2013. Are US Stock Index Returns Predictable? Evidence from Automatic Autocorrelation-Based Tests. Applied Economics 45: 953–62. [Google Scholar] [CrossRef]
  17. Lo, Andrew W. 2004. The Adaptive Markets Hypothesis: Market Efficiency from an Evolutionary Perspective. Journal of Portfolio Management 30: 15–29. [Google Scholar] [CrossRef]
  18. Lo, Andrew W. 2005. Reconciling Efficient Markets with Behavioral Finance: The Adaptive Markets Hypothesis. Journal of Investment Consulting 7: 21–44. [Google Scholar]
  19. Lo, Andrew, and A. Craig MacKinlay. 1988. Stock Market Prices Do Not Follow Random Walks: Evidence From a Simple Specification Test. Review of Financial Studies 1: 41–66. [Google Scholar] [CrossRef]
  20. Lobato, Ignacio, John C. Nankervis, and N. E. Savin. 2001. Testing for Autocorrelation Using a Modified Box-Pierce Q Test. International Economic Review 42: 187–205. [Google Scholar] [CrossRef]
  21. Neely, Christopher J., Paul A. Weller, and Joshua M. Ulrich. 2009. The adaptive markets hypothesis: evidence from the foreign exchange market. Journal of Financial and Quantitative Analysis 44: 467–88. [Google Scholar] [CrossRef]
  22. Noda, Akihiko. 2016. A Test of the Adaptive Market Hypothesis Using a Time-Varying AR Model in Japan. Finance Research Letters 17: 66–71. [Google Scholar] [CrossRef]
  23. Phan, Khoa Cuong, and Jian Zhou. 2014. Market efficiency in emerging stock markets: A case study of the Vietnamese stock market. IOSR Journal of Business and Management 16: 61–73. [Google Scholar] [CrossRef]
  24. Smith, Graham. 2012. The Changing and Relative Efficiency of European Emerging Stock Markets. The European Journal of Finance 18: 689–708. [Google Scholar] [CrossRef]
  25. Urquhart, Andrew, and Frank McGroarty. 2014. Calendar effects, market conditions and the Adaptive Market Hypothesis: Evidence from long-run US data. International Review of Financial Analysis 35: 154–66. [Google Scholar] [CrossRef]
  26. Vo, Xuan Vinh. 2015. Foreign ownership and stock return volatility–Evidence from Vietnam. Journal of Multinational Financial Management 30: 101–9. [Google Scholar] [CrossRef]
  27. Vu, Thi Hanh, Nguyen Van Duy, Ho Manh Tung, and Vuong Quan Hoang. 2019. Determinants of Vietnamese Listed firms performance: Competition, Wage, CEO, Firm Size, Age, and International Trade. Journal of Risk and Financial Management 12: 62. [Google Scholar] [CrossRef]
  28. Vuong, Quan Hoang, and Viet Phuong La. 2019. BayesVL Package for Bayesian Statistical Analyses in R. Github: BayesVL version 0.6.5. Available online: https://github.com/sshpa/bayesvl (accessed on 7 May 2019). [CrossRef]
  29. Vuong, Quan Hoang. 2018. The Financial Economy of Viet Nam in an Age of Reform, 1986–2016. Routledge Handbook of Banking and Finance in Asia Routledge. Available online: http://www.routledgehandbooks.com/doi/10.4324/9781315543222-12 (accessed on 7 May 2019).
  30. Vuong, Quan-Hoang. 2019. Computational entrepreneurship: From Economic Complexities to Interdisciplinary. Problems and Perspective in Management 17: 117–29. [Google Scholar] [CrossRef]
Figure 1. The weekly returns of HSX in the period from 2005 to 2019.
Jrfm 12 00081 g001
Figure 2. The weekly returns of Hanoi Stock Exchange (HNX) in the period from 2006 to 2019.
Jrfm 12 00081 g002
Figure 3. Automatic variance ratio (AVR) test results for HSX.
Jrfm 12 00081 g003
Figure 4. AVR test results in HNX.
Jrfm 12 00081 g004
Figure 5. The Automatic Portmanteau (AP) results of HSX.
Jrfm 12 00081 g005
Figure 6. The AP results of HNX.
Jrfm 12 00081 g006
Figure 7. The generalized spectral (GS) results of HSX.
Jrfm 12 00081 g007
Figure 8. Results of HNX.
Jrfm 12 00081 g008
Figure 9. The time-varying autoregressive (TV-AR) result in HSX.
Jrfm 12 00081 g009
Figure 10. The TV-AR result of HNX.
Jrfm 12 00081 g010

