
Investigation of Underlying Association between Anthropometric and Cardiorespiratory Fitness Markers among Overweight and Obese Adolescents in Canada
 , ,
, ,
Abstract
:1. Introduction
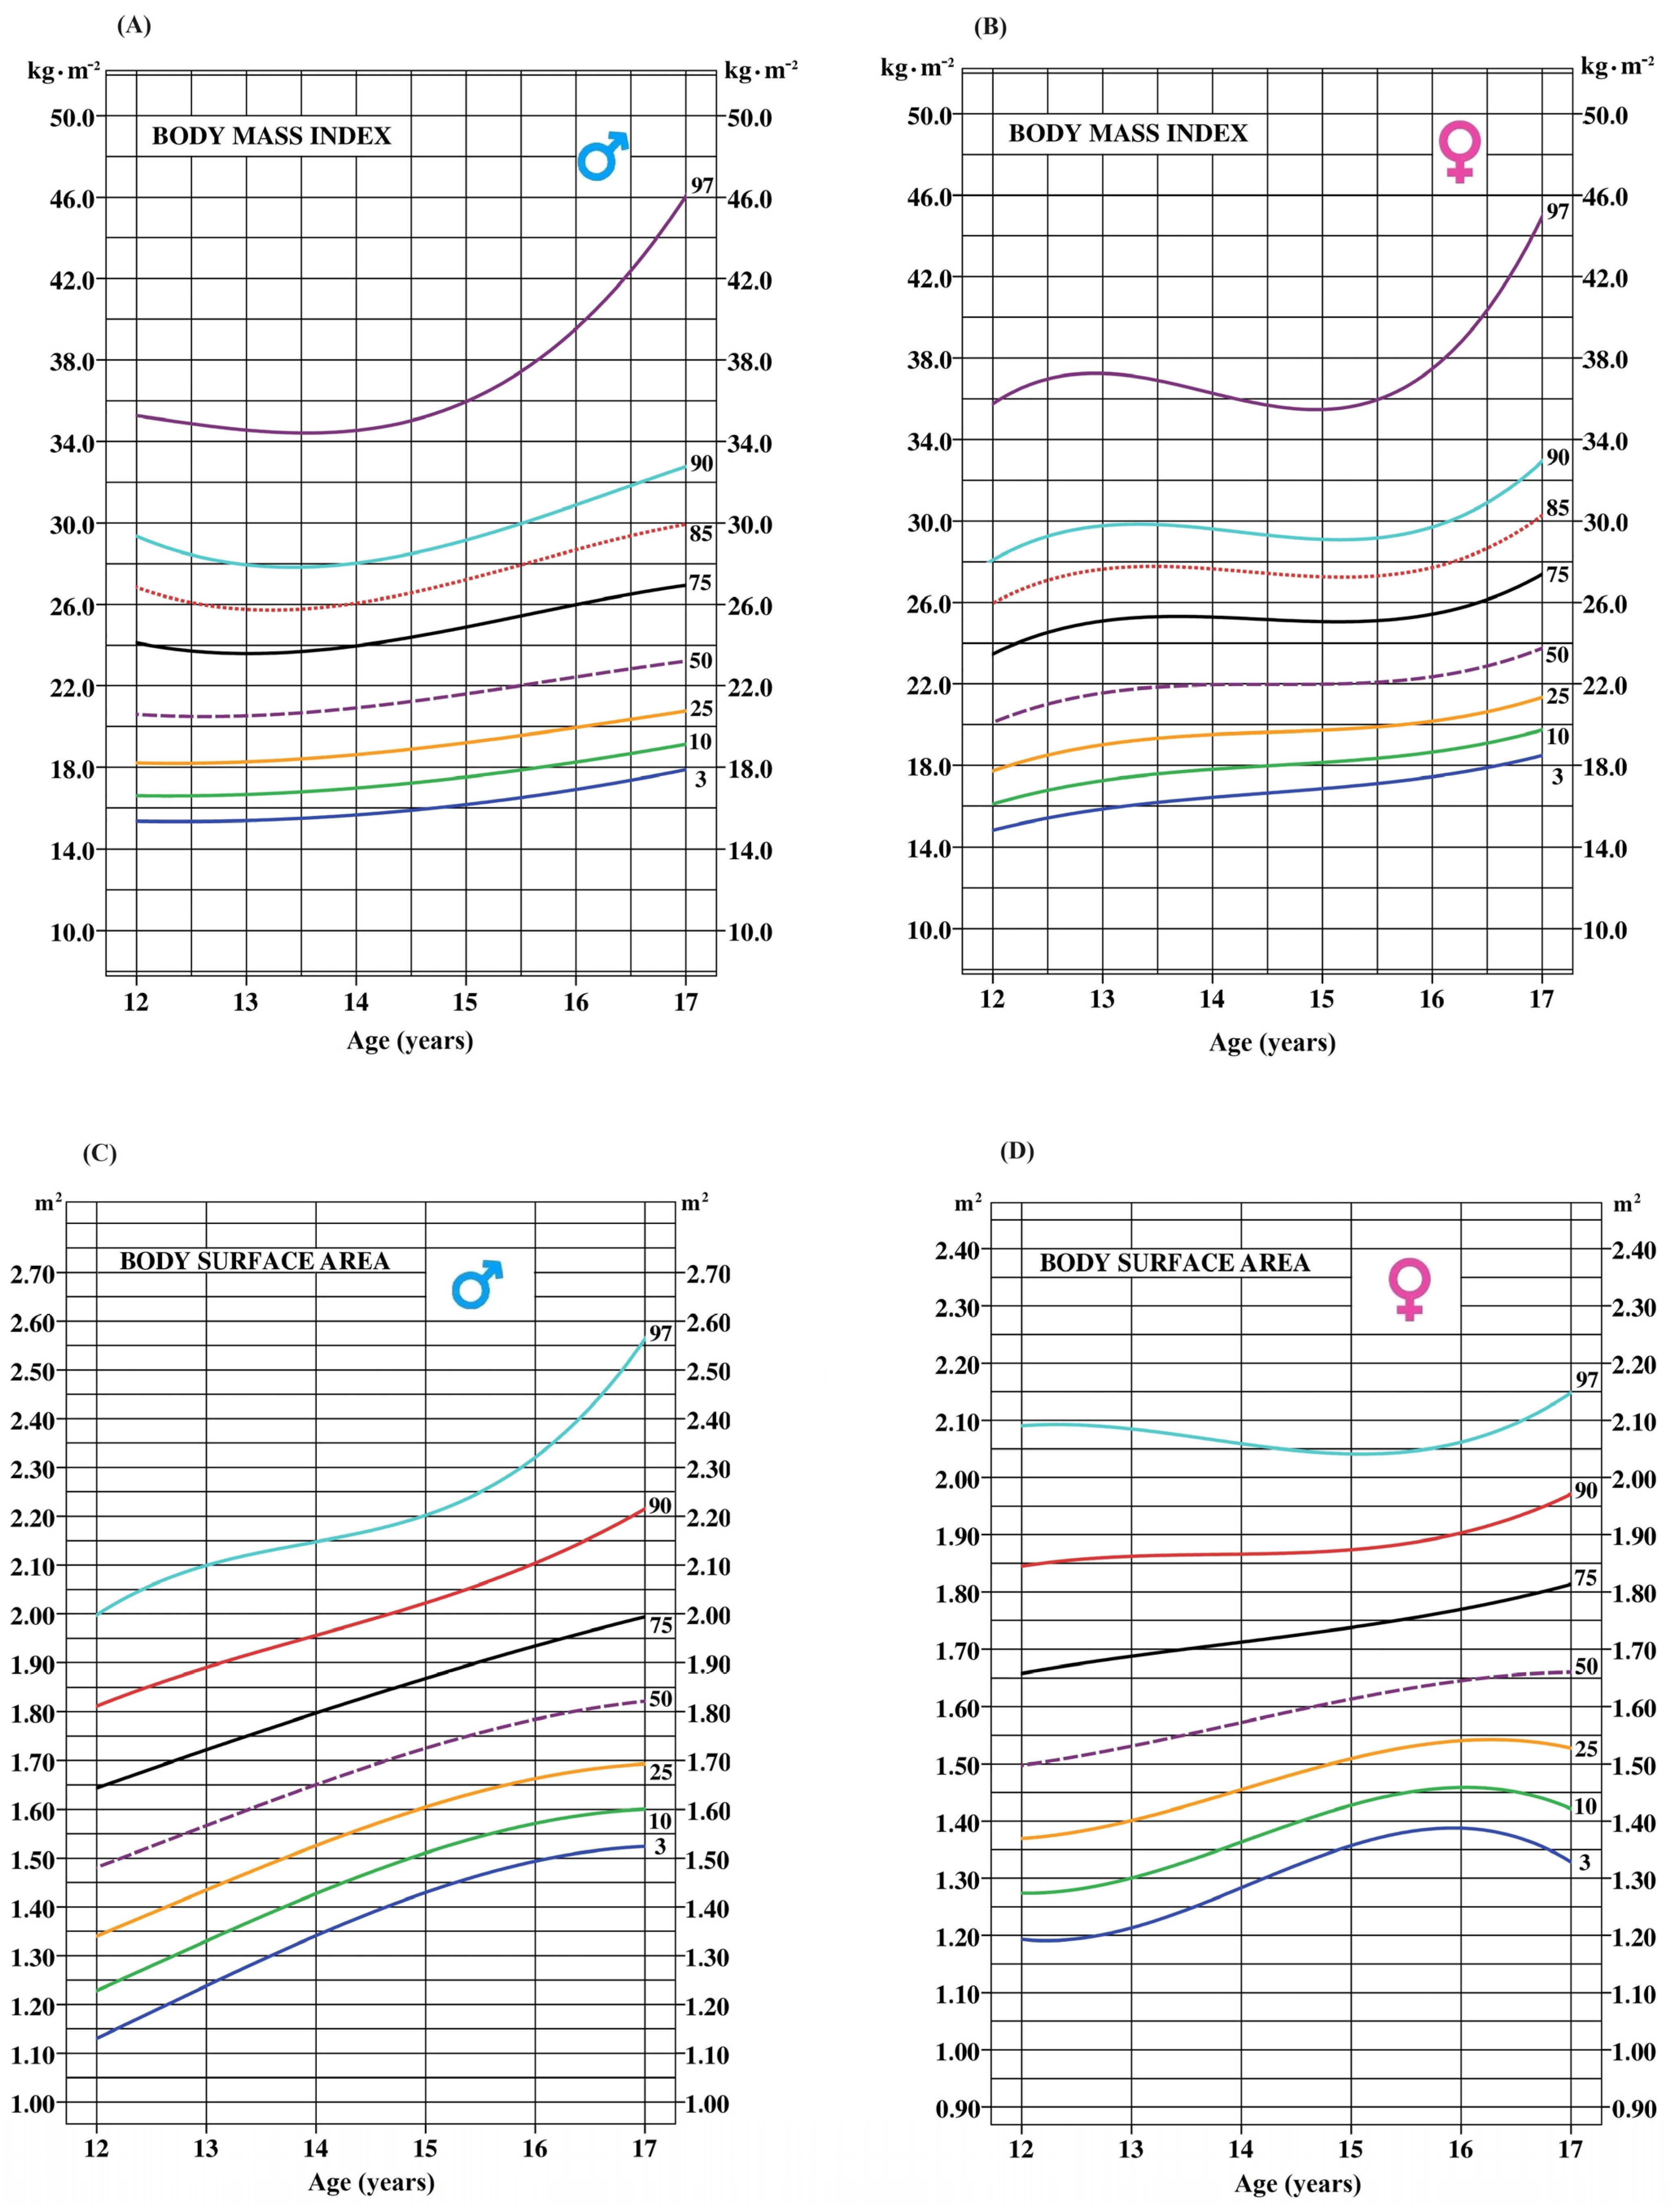
1.1. Body Composition Assessment
Body Mass Index
1.2. Other Anthropometric Markers
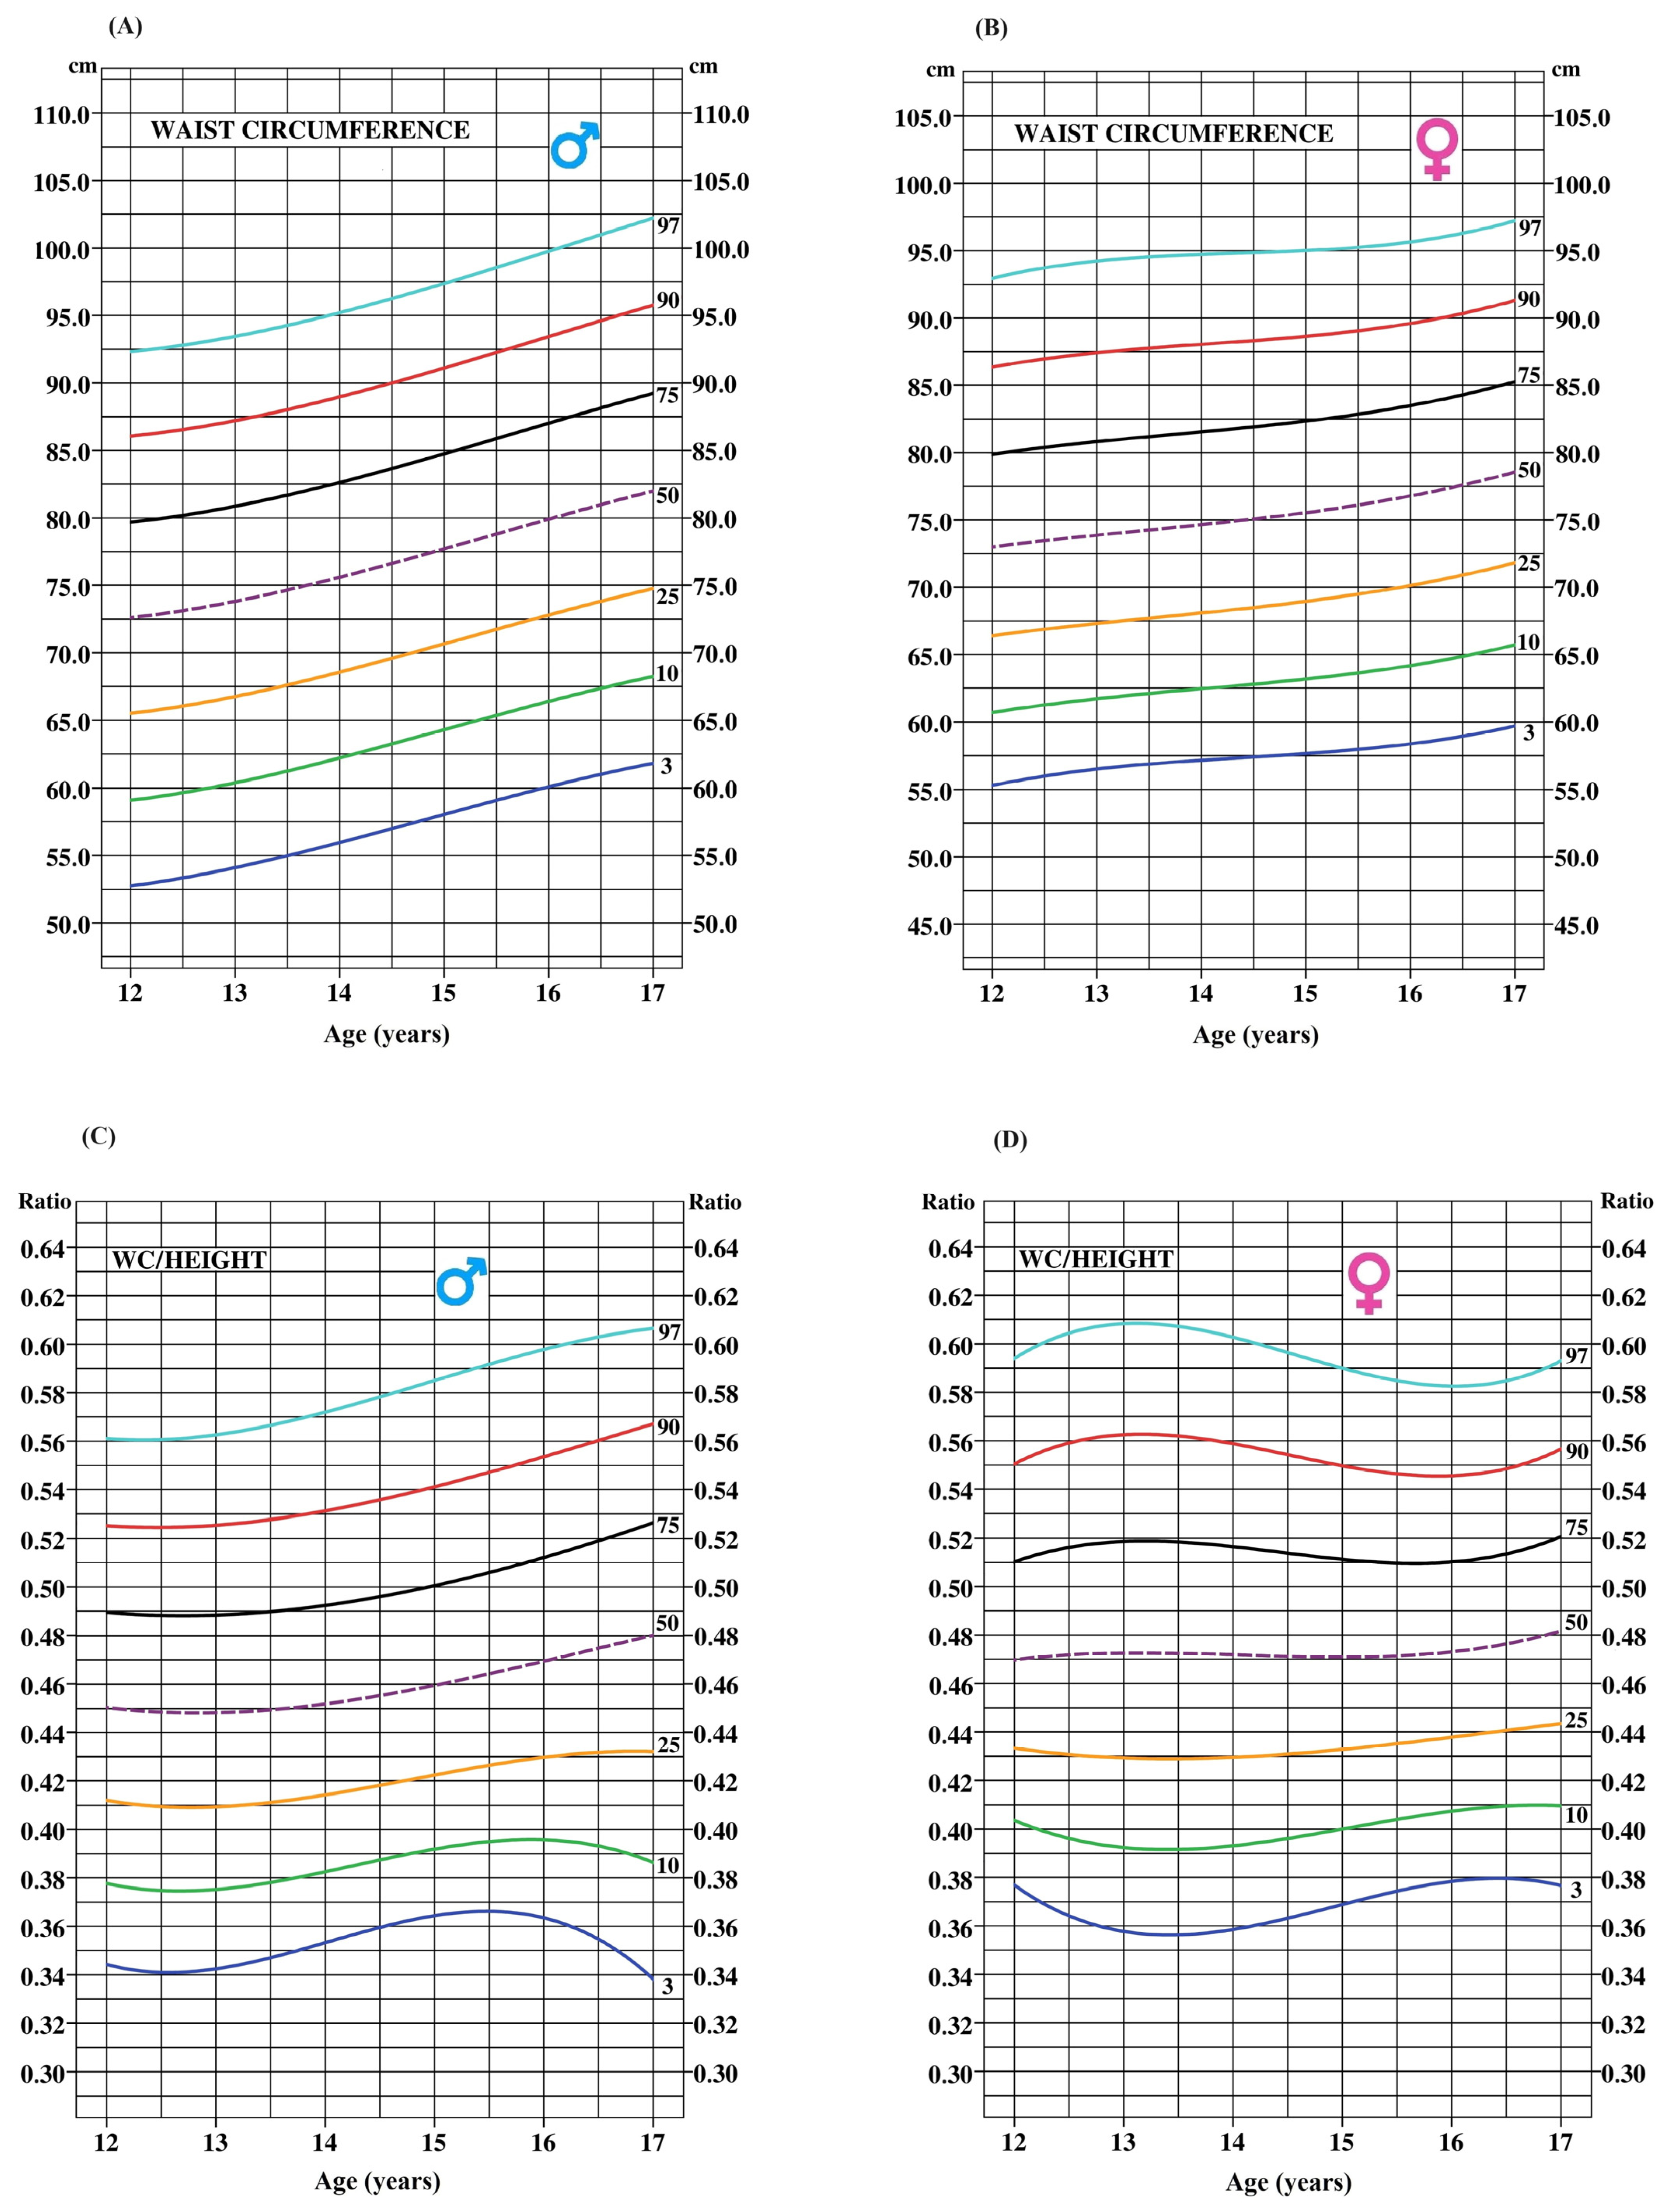
1.2.1. Waist Circumference (WC)
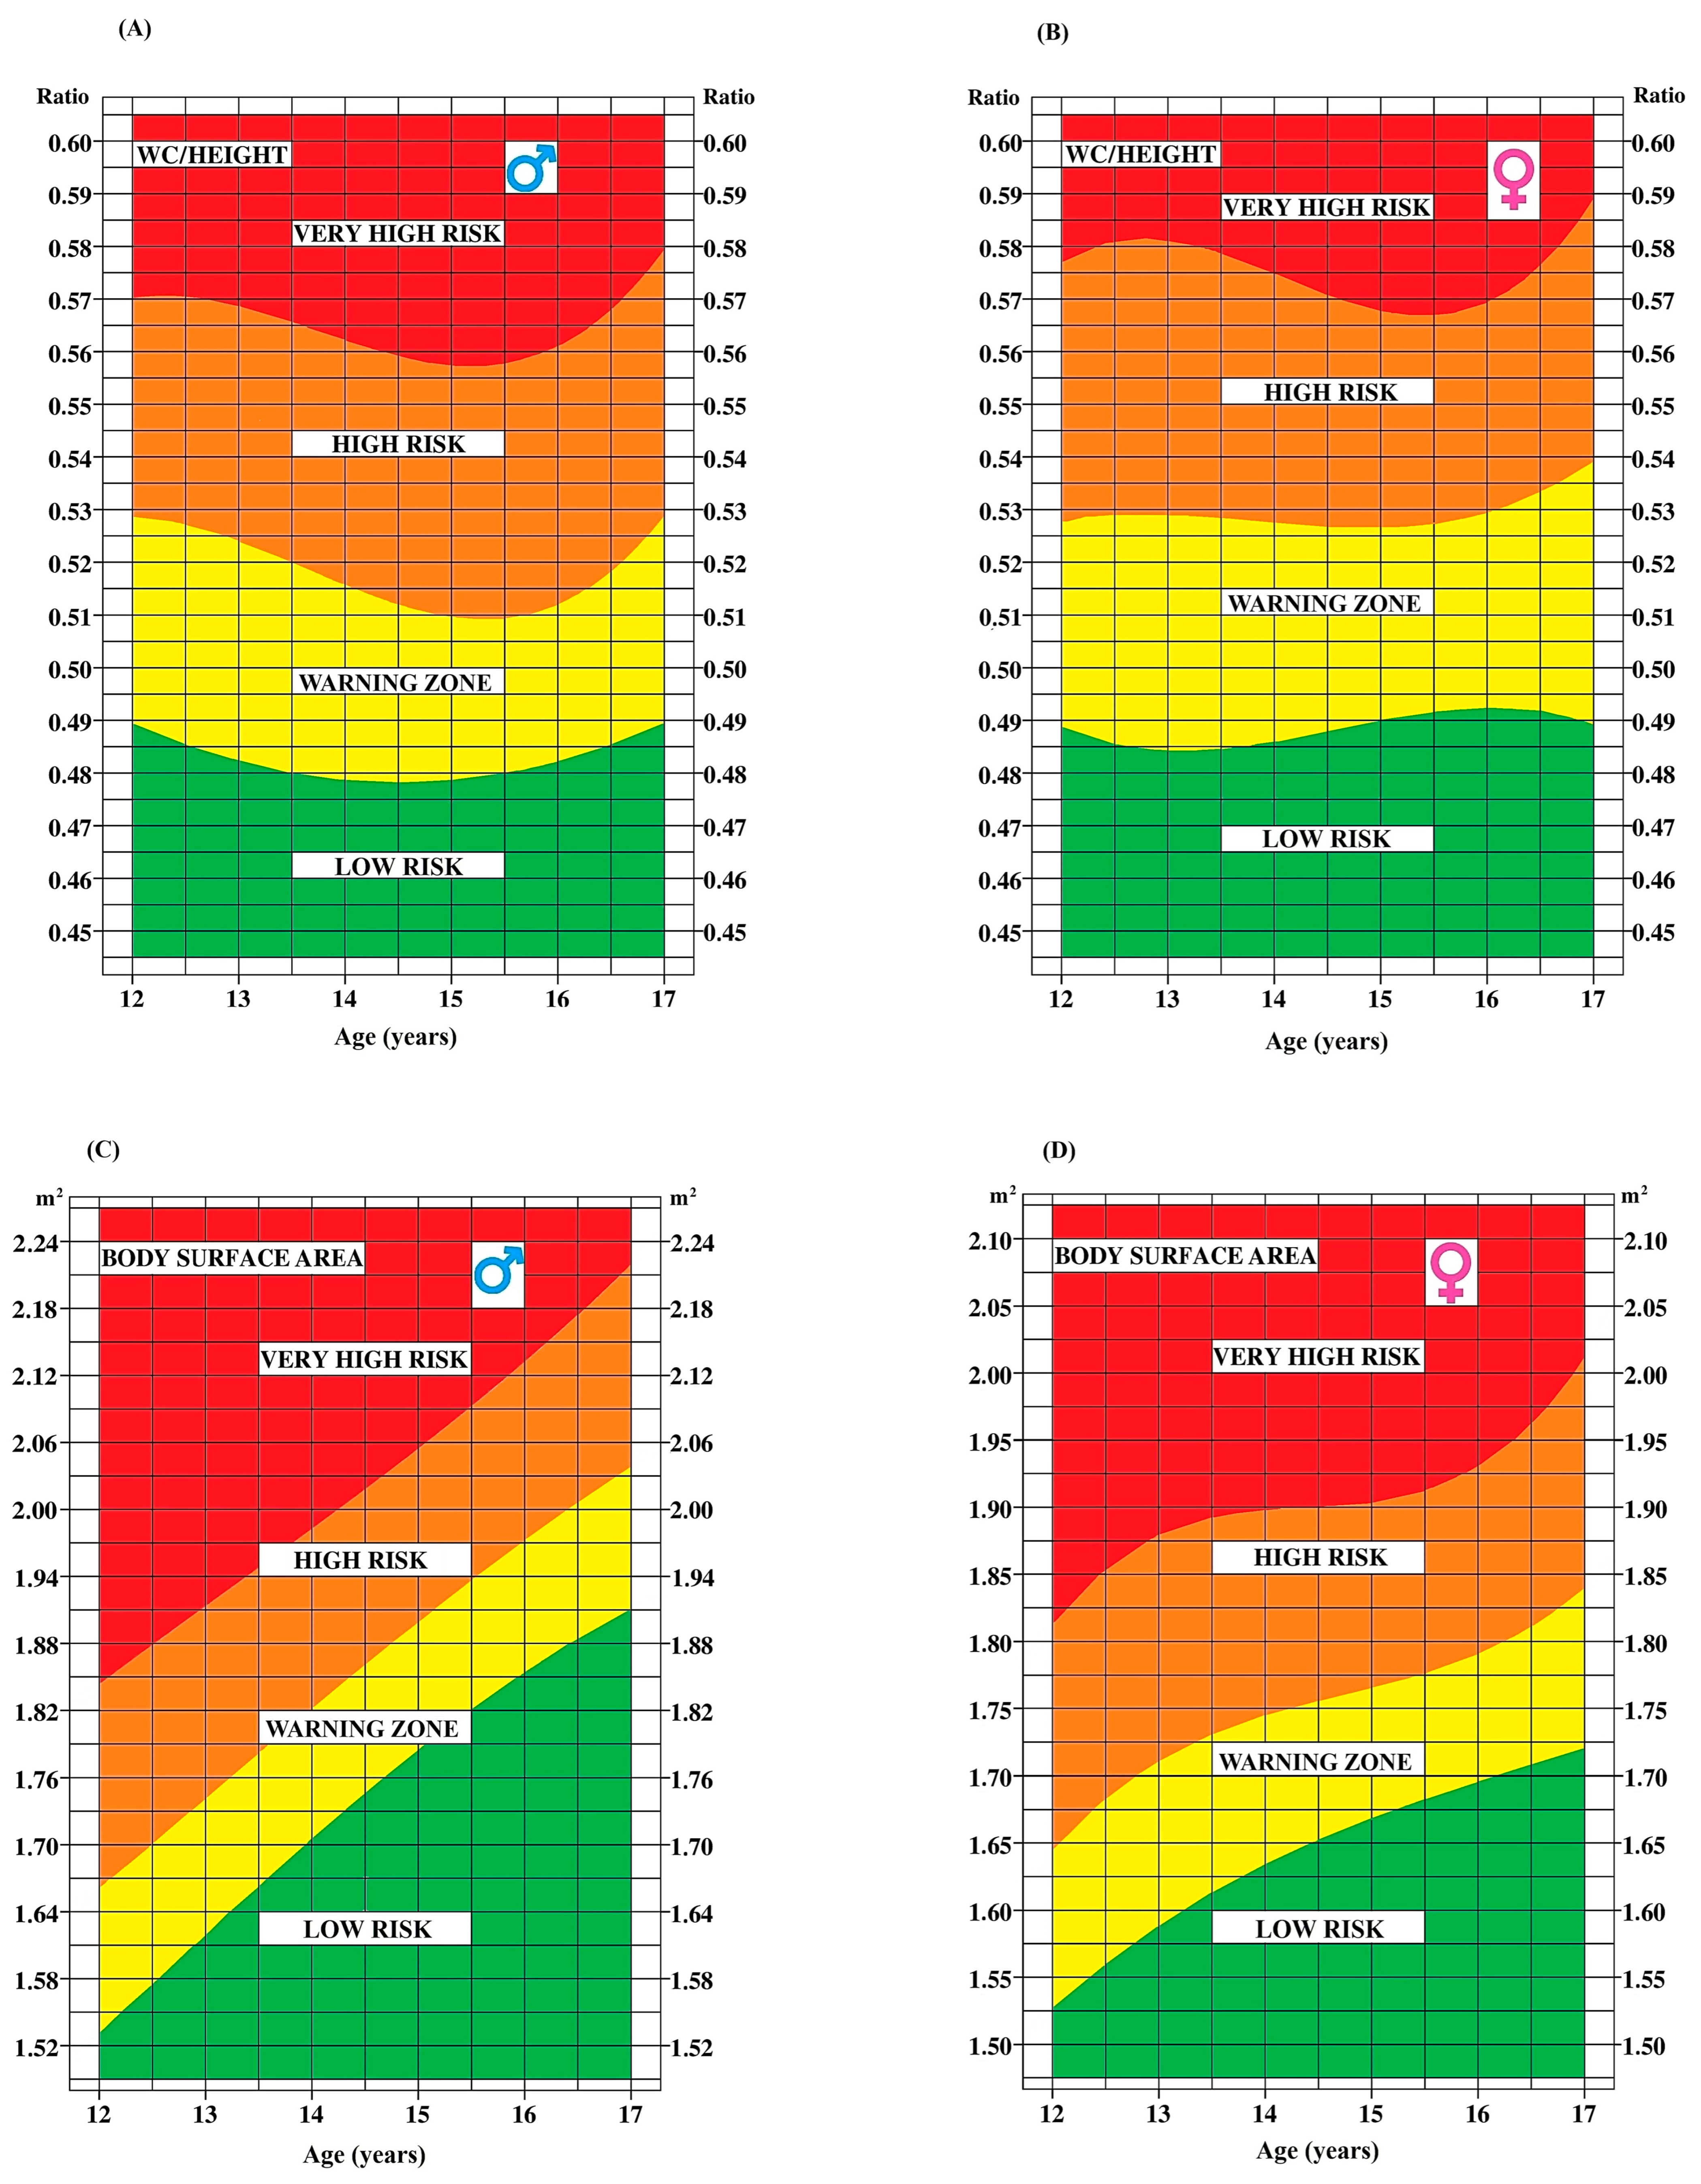
1.2.2. Waist-to-Height Ratio
1.2.3. Body Surface Area
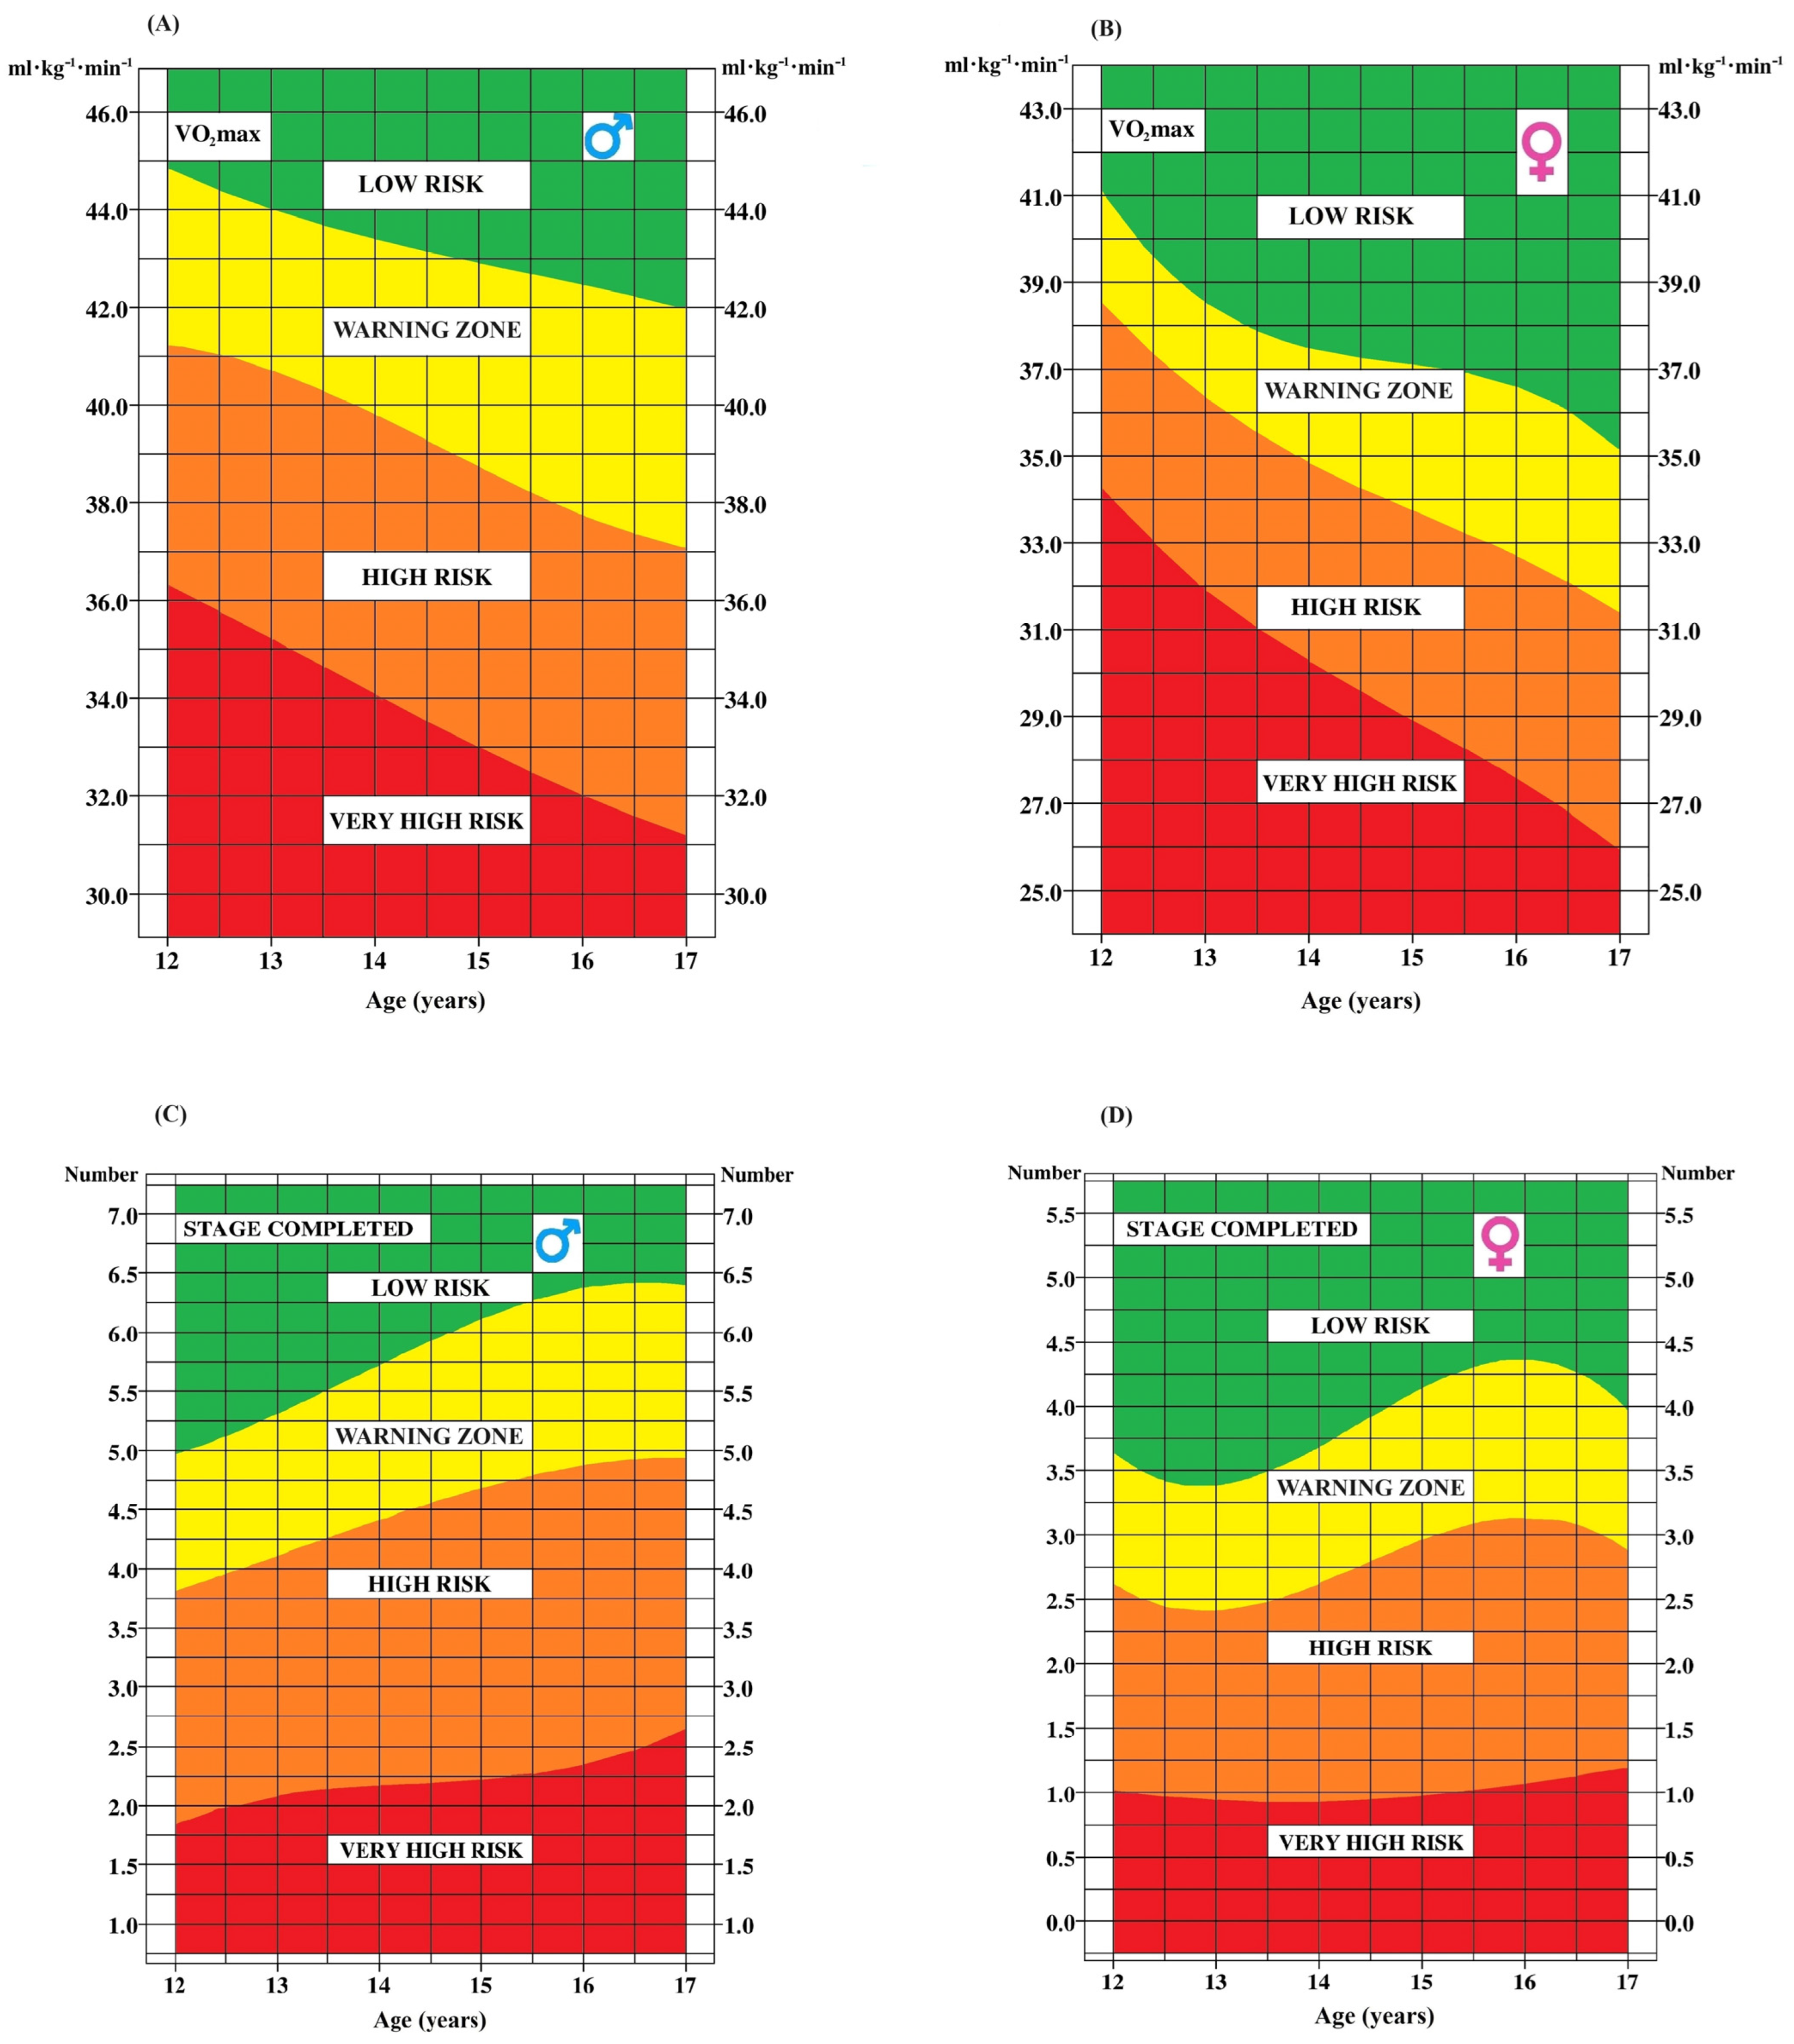
1.3. Cardiorespiratory Fitness
2. Materials and Methods
2.1. Design
2.1.1. Participants
2.1.2. Anthropometric Markers
2.1.3. Cardiorespiratory Fitness Markers
2.1.4. Data Exclusions
2.1.5. Statistical Analysis
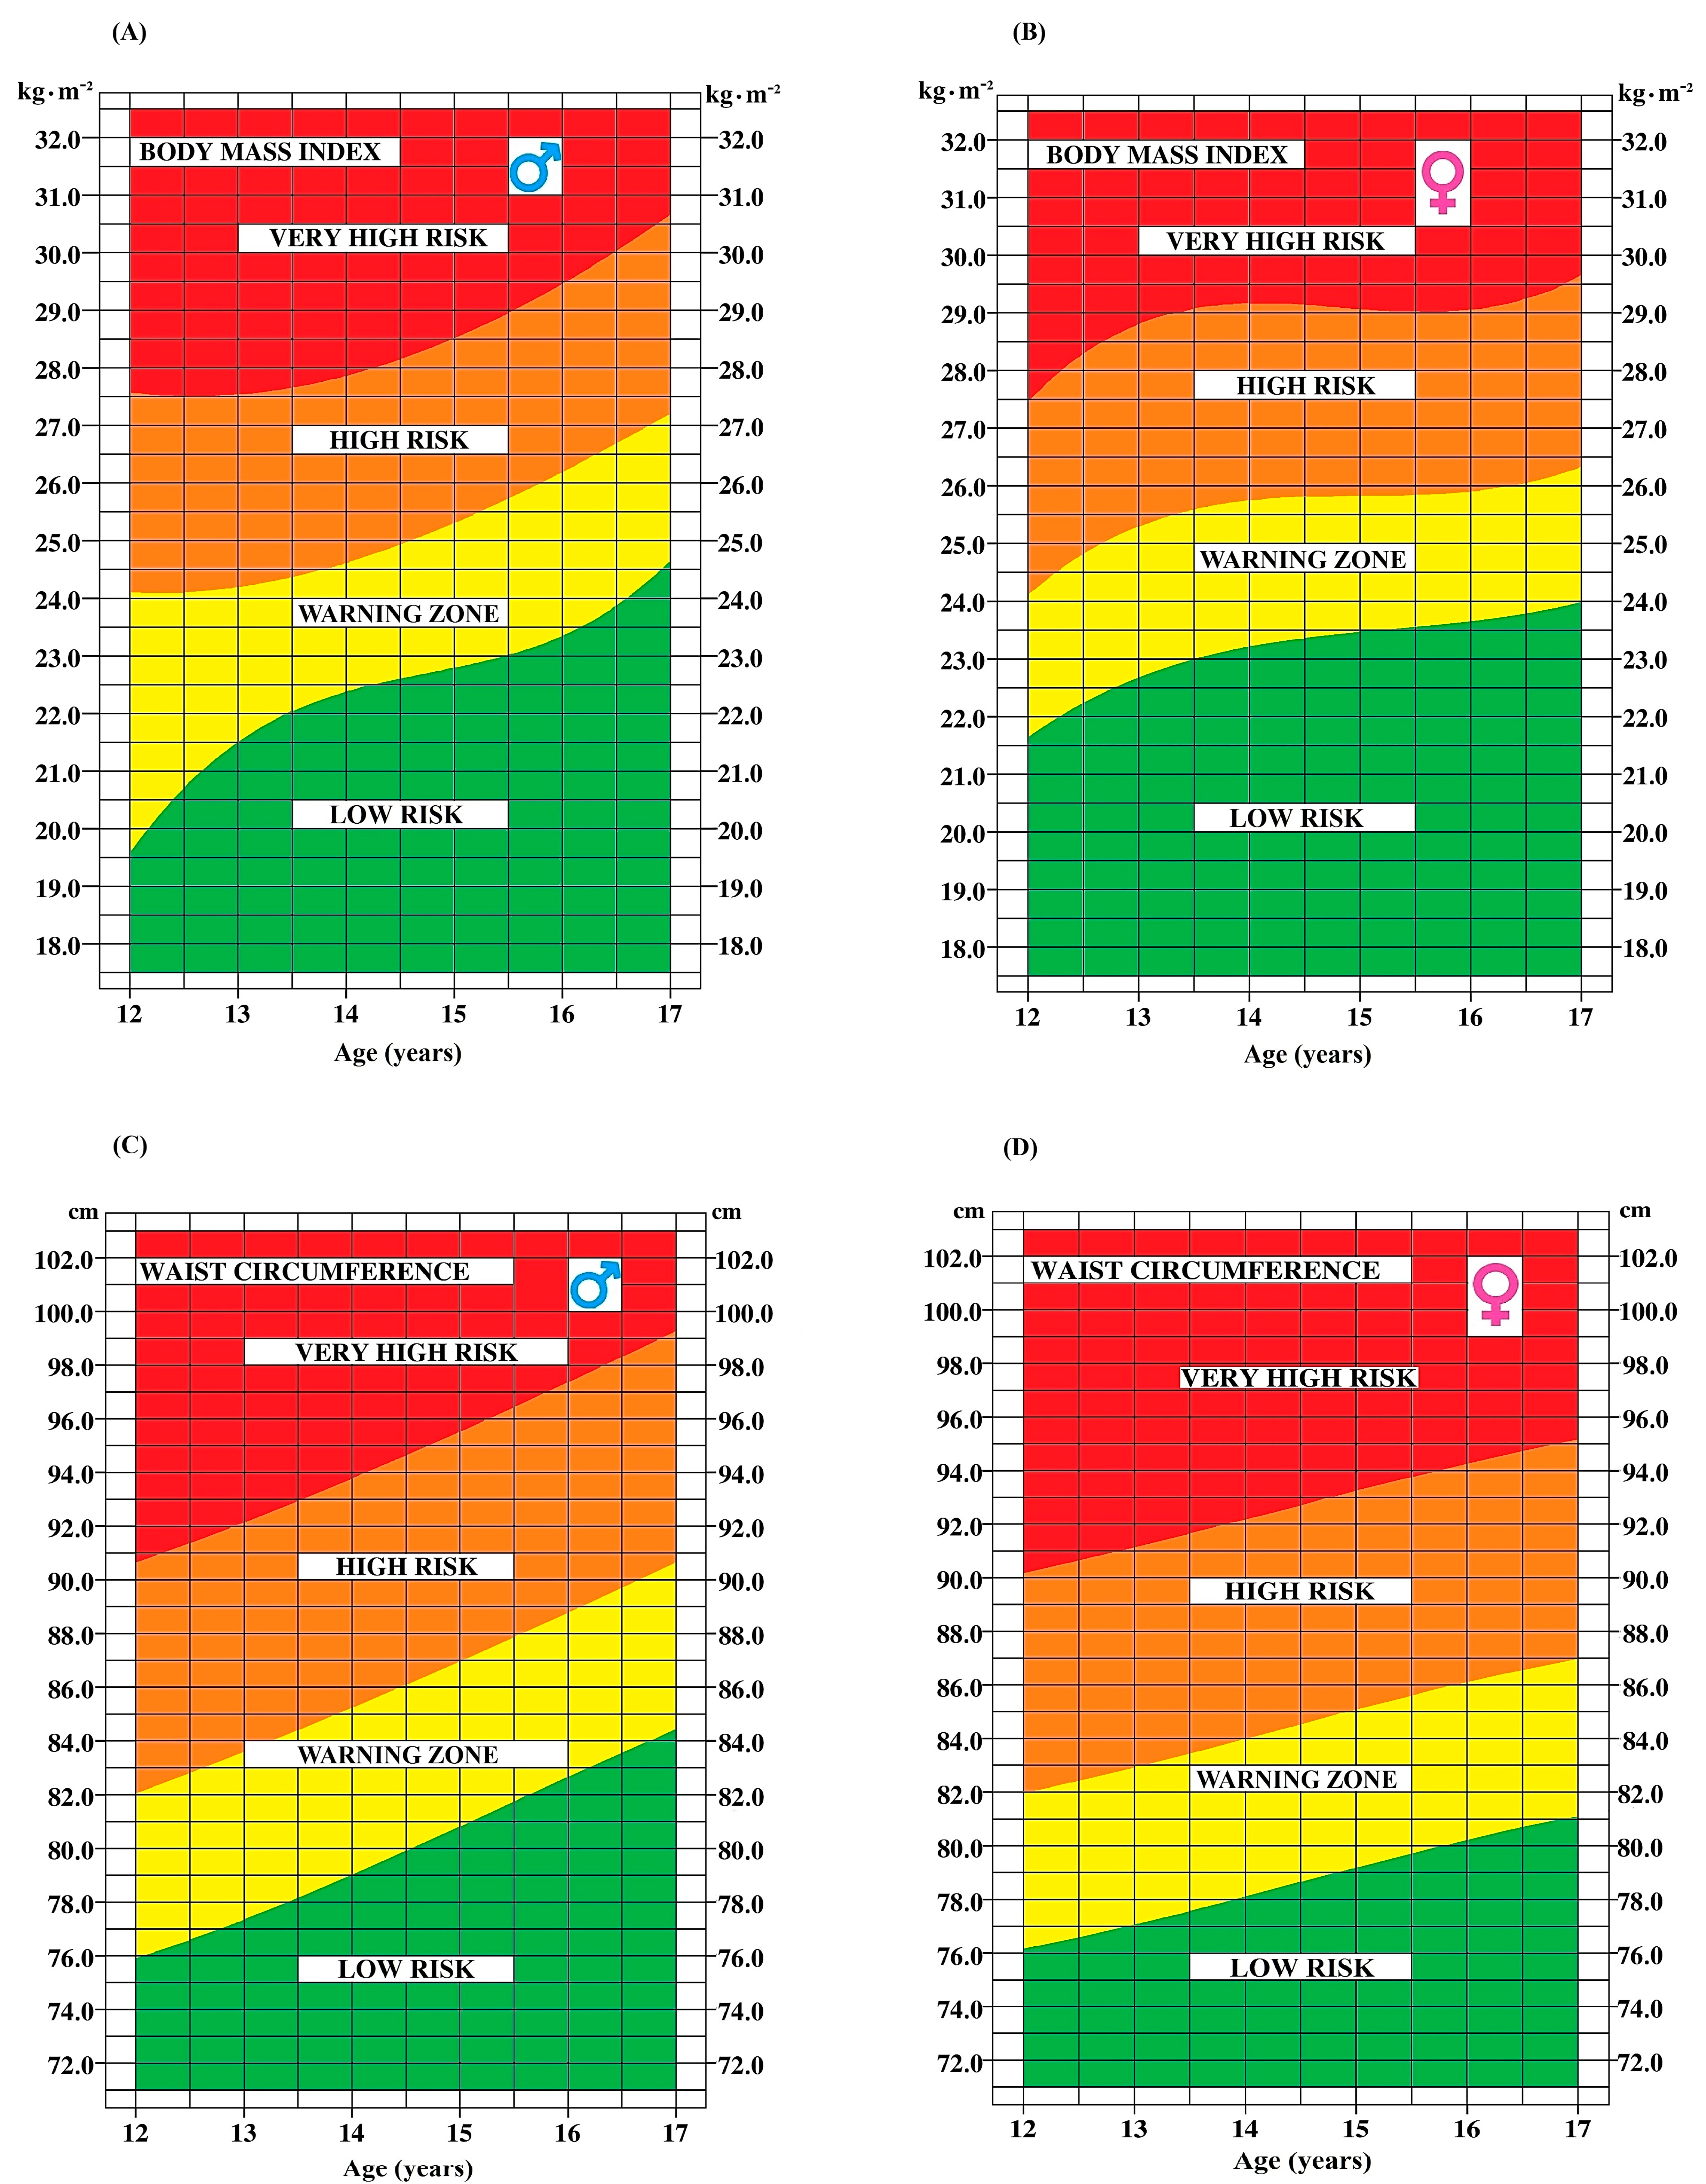
- Low-risk zone < 85th percentile
- High-risk zone = 85th–95th percentile
- Very-high-risk zone > 95th percentile
- Low-risk zone < 80th percentile
- High-risk zone = 80th–95th percentile
- Very-high-risk zone > 95th percentile
- Low-risk zone > 50th percentile
- High-risk zone = 50th–25th percentile
- Very-high-risk zone < 25th percentile
3. Results
Risk Stratification
4. Discussion
4.1. WHtR and BSA as Cardiometabolic Risk Markers
4.2. Inclusion of CRF Markers
4.3. Individual and Composite Scores as Cardiometabolic Risk Markers
4.4. The Relative Contribution of Marker Categories to Cardiometabolic Risk: A Nuanced Analysis
4.5. Limitations and Strengths
5. Conclusions
Supplementary Materials
Author Contributions
Funding
Institutional Review Board Statement
Informed Consent Statement
Data Availability Statement
Acknowledgments
Conflicts of Interest
References
- Cardel, M.I.; Atkinson, M.A.; Taveras, E.M.; Holm, J.C.; Kelly, A.S. Obesity treatment among adolescents: A review of current evidence and future directions. JAMA Pediatr. 2020, 174, 609–617. [Google Scholar] [CrossRef] [PubMed]
- Bailey, D.P.; Boddy, L.M.; Savory, L.A.; Denton, S.J.; Kerr, C.J. Associations between cardiorespiratory fitness, physical activity and clustered cardiometabolic risk in children and adolescents: The HAPPY study. Eur. J. Pediatr. 2012, 171, 1317–1323. [Google Scholar] [CrossRef] [PubMed]
- Bravo, J.; Raimundo, A.M.; Santos, D.A.; Timón, R.; Sardinha, L.B. Abdominal obesity in adolescents: Development of age-specific waist circumference cut-offs linked to adult IDF criteria. Am. J. Hum. Biol. 2017, 29, e23036. [Google Scholar] [CrossRef] [PubMed]
- Cornier, M.-A.; Després, J.-P.; Davis, N.; Grossniklaus, D.A.; Klein, S.; Lamarche, B.; Lopez-Jimenez, F.; Rao, G.; St-Onge, M.-P.; Towfighi, A.; et al. Assessing adiposity: A scientific statement from the American Heart Association. Circulation 2011, 124, 1996–2019. [Google Scholar] [CrossRef] [PubMed]
- Juonala, M.; Magnussen, C.G.; Berenson, G.S.; Venn, A.; Burns, T.L.; Sabin, M.A.; Srinivasan, S.R.; Daniels, S.R.; Davis, P.H.; Chen, W.; et al. Childhood adiposity, adult adiposity, and cardiovascular risk factors. N. Engl. J. Med. 2011, 365, 1876–1885. [Google Scholar] [CrossRef] [PubMed]
- Becque, M.D.; Hattori, K.; Katch, V.L.; Rocchini, A.P. Fat patterning of adolescents: Allometry of fatfolds. Am. J. Hum. Biol. 1992, 4, 521–525. [Google Scholar] [CrossRef] [PubMed]
- Figueroa-Colon, R.; Mayo, M.S.; Treuth, M.S.; Aldridge, R.; Hunter, G.; Berland, L.; Goran, M.; Weinsier, R. Variability of abdominal adipose tissue measurements using computed tomography in prepubertal girls. Int. J. Obes. Relat. Metab. Disord. 1998, 22, 1019–1023. [Google Scholar] [CrossRef] [PubMed]
- Gutin, B.; Barbeau, P.; Owens, S.; Lemmon, C.R.; Bauman, M.; Allison, J.; Kang, H.-S.; Litaker, M.S. Effects of exercise intensity on cardiovascular fitness, total body composition, and visceral adiposity of obese adolescents. Am. J. Clin. Nutr. 2002, 75, 818–826. [Google Scholar] [CrossRef]
- Watts, K.; Jones, T.W.; Davis, E.A.; Green, D. Exercise training in obese children and adolescents: Current concepts. Sports Med. 2005, 35, 375–392. [Google Scholar] [CrossRef]
- Taylor, R.W.; Jones, I.E.; Williams, S.M.; Goulding, A. Evaluation of waist circumference, waist-to-hip ratio, and the conicity index as screening tools for high trunk fat mass, as measured by dual-energy X-ray absorptiometry, in children aged 3–19 y. Am. J. Clin. Nutr. 2000, 72, 490–495. [Google Scholar] [CrossRef]
- Cameron, N. Body mass index cut offs to define thinness in children and adolescents. BMJ 2007, 335, 166–167. [Google Scholar] [CrossRef] [PubMed]
- Chung, S. Body mass index and body composition scaling to height in children and adolescent. Ann. Pediatr. Endocrinol. Metab. 2015, 20, 125–129. [Google Scholar] [CrossRef] [PubMed]
- Karchynskaya, V.; Kopcakova, J.; Klein, D.; Gába, A.; Madarasova-Geckova, A.; van Dijk, J.P.; de Winter, A.F.; Reijneveld, S.A. Is BMI a valid indicator of overweight and obesity for adolescents? Int. J. Environ. Res. Public Health 2020, 17, 4815. [Google Scholar] [CrossRef]
- Cole, T.J.; Bellizzi, M.C.; Flegal, K.M.; Dietz, W.H. Establishing a standard definition for child overweight and obesity worldwide: International survey. BMJ 2000, 320, 1240–1243. [Google Scholar] [CrossRef] [PubMed]
- Dundar, I.; Akinci, A. Prevalence and Predictive Clinical Characteristics of Metabolically Healthy Obesity in Obese Children and Adolescents. Cureus 2023, 15, e35935. [Google Scholar] [CrossRef] [PubMed]
- Franks, P.W.; Hanson, R.L.; Knowler, W.C.; Sievers, M.L.; Bennett, P.H.; Looker, H.C. Childhood obesity, other cardiovascular risk factors, and premature death. N. Engl. J. Med. 2010, 362, 485–493. [Google Scholar] [CrossRef] [PubMed]
- Skinner, A.C.; Perrin, E.M.; Moss, L.A.; Skelton, J.A. Cardiometabolic risks and severity of obesity in children and young adults. N. Engl. J. Med. 2015, 373, 1307–1317. [Google Scholar] [CrossRef] [PubMed]
- Janssen, I.; Shields, M.; Craig, C.L.; Tremblay, M.S. Prevalence and secular changes in abdominal obesity in Canadian adolescents and adults, 1981 to 2007–2009. Obes. Rev. 2011, 12, 397–405. [Google Scholar] [CrossRef]
- Xi, B.; Zong, X.; Kelishadi, R.; Litwin, M.; Hong, Y.M.; Poh, B.K.; Steffen, L.M.; Galcheva, S.V.; Herter-Aeberli, I.; Nawarycz, T.; et al. International Waist Circumference Percentile Cutoffs for Central Obesity in Children and Adolescents Aged 6 to 18 Years. J. Clin. Endocrinol. Metab. 2020, 105, e1569–e1583. [Google Scholar] [CrossRef]
- Kiess, W.; Galler, A.; Reich, A.; Müller, G.; Kapellen, T.; Deutscher, J.; Raile, K.; Kratzsch, J. Clinical aspects of obesity in childhood and adolescence. Obes. Rev. 2001, 2, 29–36. [Google Scholar] [CrossRef]
- Lee, X.; Gao, Y.; Zhang, Y.; Feng, Y.; Gao, L.; Wang, A.; Jiang, Y.; Huang, H. Comparison of 10 obesity-related indices for predicting hypertension based on ROC analysis in Chinese adults. Front. Public Health 2022, 10, 1042236. [Google Scholar] [CrossRef] [PubMed]
- Krakauer, N.Y.; Krakauer, J.C. A new body shape index predicts mortality hazard independently of body mass index. PLoS ONE 2012, 7, e39504. [Google Scholar] [CrossRef] [PubMed]
- Alberti, K.G.; Zimmet, P.; Shaw, J. Metabolic syndrome–a new worldwide definition. A Consensus Statement from the International Diabetes Federation. Diabet. Med. 2006, 23, 469–480. [Google Scholar] [CrossRef] [PubMed]
- Ashwell, M.; Gibson, S. Waist-to-height ratio as an indicator of ‘early health risk’: Simpler and more predictive than using a ‘matrix’ based on BMI and waist circumference. BMJ Open. 2016, 6, e010159. [Google Scholar] [CrossRef] [PubMed]
- Brambilla, P.; Bedogni, G.; Heo, M.; Pietrobelli, A. Waist circumference-to-height ratio predicts adiposity better than body mass index in children and adolescents. Int. J. Obes. 2013, 37, 943–946. [Google Scholar] [CrossRef] [PubMed]
- McCarthy, H.D.; Ashwell, M. A study of central fatness using waist-to-height ratios in UK children and adolescents over two decades supports the simple message--’keep your waist circumference to less than half your height’. Int. J. Obes. 2006, 30, 988–992. [Google Scholar] [CrossRef]
- Lee, C.M.; Huxley, R.R.; Wildman, R.P.; Woodward, M. Indices of abdominal obesity are better discriminators of cardiovascular risk factors than BMI: A meta-analysis. J. Clin. Epidemiol. 2008, 61, 646–653. [Google Scholar] [CrossRef] [PubMed]
- Savva, S.; Tornaritis, M.; Savva, M.; Kourides, Y.; Panagi, A.; Silikiotou, N.; Georgiou, C.; Kafatos, A. Waist circumference and waist-to-height ratio are better predictors of cardiovascular disease risk factors in children than body mass index. Int. J. Obes. Relat. Metab. Disord. 2000, 24, 1453–1458. [Google Scholar] [CrossRef]
- Sharma, A.K.; Metzger, D.L.; Daymont, C.; Hadjiyannakis, S.; Rodd, C.J. LMS tables for waist-circumference and waist-height ratio Z-scores in children aged 5–19 y in NHANES III: Association with cardio-metabolic risks. Pediatr. Res. 2015, 78, 723–729. [Google Scholar] [CrossRef]
- Ashby-Thompson, M.; Ji, Y.; Wang, J.; Yu, W.; Thornton, J.C.; Wolper, C.; Weil, R.; Chambers, E.C.; Laferrère, B.; Pi-Sunyer, F.X.; et al. High-resolution three-dimensional photonic scan-derived equations improve body surface area prediction in diverse populations. Obesity 2020, 28, 706–717. [Google Scholar] [CrossRef]
- Cléro, E.; Leux, C.; Brindel, P.; Truong, T.; Anger, A.; Teinturier, C.; Diallo, I.; Doyon, F.; Guénel, P.; de Vathaire, F. Pooled analysis of two case-control studies in New Caledonia and French Polynesia of body mass index and differentiated thyroid cancer: The importance of body surface area. Thyroid 2010, 20, 1285–1293. [Google Scholar] [CrossRef]
- Sardinha, L.B.; Silva, A.M.; Minderico, C.S.; Teixeira, P.J. Effect of body surface area calculations on body fat estimates in non-obese and obese subjects. Physiol. Meas. 2006, 27, 1197–1209. [Google Scholar] [CrossRef] [PubMed]
- Si, S.; Tewara, M.A.; Ji, X.; Wang, Y.; Liu, Y.; Dai, X.; Wang, Z.; Xue, F. Body surface area, height, and body fat percentage as more sensitive risk factors of cancer and cardiovascular disease. Cancer Med. 2020, 9, 4433–4446. [Google Scholar] [CrossRef]
- Yu, X.H.; Cao, R.R.; Yang, Y.Q.; Deng, F.Y.; Bo, L.; Lei, S.F. Body surface area is a potential obesity index: Its genetic determination and its causality for later-life diseases. Obesity 2023, 31, 256–266. [Google Scholar] [CrossRef]
- Buchan, D.S.; Young, J.D.; Boddy, L.M.; Malina, R.M.; Baker, J.S. Fitness and adiposity are independently associated with cardiometabolic risk in youth. BioMed Res. Int. 2013, 2013, 261698. [Google Scholar] [CrossRef]
- Raghuveer, G.; Hartz, J.; Lubans, D.R.; Takken, T.; Wiltz, J.L.; Mietus-Snyder, M.; Al-Mutairi, M.E. Cardiorespiratory Fitness in Youth: An Important Marker of Health: A Scientific Statement from the American Heart Association. Circulation 2020, 142, e101–e118. [Google Scholar] [CrossRef]
- Ruiz, J.R.; Ortega, F.B.; Rizzo, N.S.; Villa, I.; Hurtig-Wennlöf, A.; Oja, L.; Sjöström, M. High cardiovascular fitness is associated with low metabolic risk score in children: The European Youth Heart Study. Pediatr. Res. 2007, 61, 350–355. [Google Scholar] [CrossRef]
- Ruiz, J.R.; Cavero-Redondo, I.; Ortega, F.B.; Welk, G.J.; Andersen, L.B.; Martinez-Vizcaino, V. Cardiorespiratory fitness cut points to avoid cardiovascular disease risk in children and adolescents; what level of fitness should raise a red flag? A systematic review and meta-analysis. Br. J. Sports Med. 2016, 50, 1451–1458. [Google Scholar] [CrossRef] [PubMed]
- Ross, R.; Blair, S.N.; Arena, R.; Church, T.S.; Despres, J.P.; Franklin, B.A.; Haskell, W.L.; Kaminsky, L.A.; Levine, B.D.; Lavie, C.J.; et al. Importance of assessing cardiorespiratory fitness in clinical practice: A case for fitness as a clinical vital sign: A scientific statement from the American Heart Association. Circulation 2016, 134, e653–e699. [Google Scholar] [CrossRef]
- Léger, L.A.; Mercier, D.; Gadoury, C.; Lambert, J. The multistage 20 metre shuttle run test for aerobic fitness. J. Sports Sci. 1988, 6, 93–101. [Google Scholar] [CrossRef]
- Tomkinson, G.R.; Lang, J.J.; Tremblay, M.S.; Dale, M.; LeBlanc, A.G.; Belanger, K.; Ortega, F.B.; Léger, L. International normative 20 m shuttle run values from 1,142,026 children and youth representing 50 countries. Br. J. Sports Med. 2017, 51, 1545–1554. [Google Scholar] [CrossRef]
- Olds, T.; Tomkinson, G.; Léger, L.; Cazorla, G. Worldwide variation in the performance of children and adolescents: An analysis of 109 studies of the 20-m shuttle run test in 37 countries. J. Sports Sci. 2006, 24, 1025–1038. [Google Scholar] [CrossRef] [PubMed]
- Leone, M.; Levesque, P.; Bourget-Gaudreault, S.; Lemoyne, J.; Kalinova, E.; Comtois, A.S.; Bui, H.T.; Léger, L.; Frémont, P.; Allisse, M. Secular trends of cardiorespiratory fitness in children and adolescents over a 35-year period: Chronicle of a predicted foretold. Front. Public Health 2023, 10, 1056484. [Google Scholar] [CrossRef] [PubMed]
- Kalton, G.; Anderson, D.J. Introduction to Survey Sampling; Sage Publications: Newbury Park, CA, USA, 1986. [Google Scholar]
- Lohman, T.G.; Roche, A.F.; Martorell, R. Anthropometric Standardization Reference Manual; Human Kinetics Books: Champaign, IL, USA, 1988. [Google Scholar]
- Canadian Society for Exercise Physiology (CSEP). The Canadian Physical Activity, Fitness and Lifestyle Approach, 3rd ed.; Canadian Society for Exercise Physiology: Ottawa, ON, Canada, 2003; Available online: https://edisciplinas.usp.br/pluginfile.php/4114941/mod_resource/content/1/THE%20CANADIAN%20PHYSICAL%20ACTIVITY%2C%20FITNESS%20AND%20LIFESTYLE%20APPROACH%20•%20THIRD%20ED.%20SUPPLEMENT.pdf (accessed on 14 June 2023).
- Mosteller, R.D. Simplified calculation of body-surface area. N. Engl. J. Med. 1987, 317, 1098. [Google Scholar] [CrossRef] [PubMed]
- World Health Organization. WHO Child Growth Standards: Length/Height-for-Age, Weight-for-Age, Weight-for-Length, Weight-for-Height and Body Mass Index-for-Age: Methods and Development; World Health Organization: Geneva, Switzerland, 2006. Available online: https://www.who.int/tools/child-growth-standards/standards (accessed on 14 June 2023).
- Hoaglin, D.C.; Iglewicz, B. Fine tuning some resistant rules for outlier labeling. J. Am. Stat. Assoc. 1987, 82, 1147–1149. [Google Scholar] [CrossRef]
- Cole, T.J.; Green, P.J. Smoothing reference centile curves: The LMS method and penalized likelihood. Stat. Med. 1992, 11, 1305–1319. [Google Scholar] [CrossRef] [PubMed]
- Leone, M.; Bui, H.T.; Kalinova, E.; Bourget-Gaudreault, S.; Levesque, P.; Lemoyne, J.; Gagnon, D.; Larivière, G.; Léger, L.; Allisse, M. Updating normative cross-sectional values and secular trends in body mass, body height and body mass index among Québec children and adolescents. Can. J. Public Health 2023, 114, 629–641. [Google Scholar] [CrossRef]
- Kuhle, S.; Maguire, B.; Ata, N.; Hamilton, D. Percentile Curves for Anthropometric Measures for Canadian Children and Youth. PLoS ONE 2015, 15, e0132891. [Google Scholar] [CrossRef] [PubMed]
- Johansson, L.; Putri, R.R.; Danielsson, P.; Hagströmer, M.; Marcus, C. Associations between cardiorespiratory fitness and cardiometabolic risk factors in children and adolescents with obesity. Sci. Rep. 2023, 13, 7289. [Google Scholar] [CrossRef]
- Patry-Parisien, J.; Shields, M.; Bryan, S. Comparison of waist circumference using the World Health Organization and National Institutes of Health protocols. Health Rep. 2012, 23, 53–60. [Google Scholar]
- Katzmarzyk, P.T. Waist circumference percentiles for Canadian youth 11–18 y of age. Eur. J. Clin. Nutr. 2004, 58, 1011–1015. [Google Scholar] [CrossRef] [PubMed]


| Age | N | Body Mass (kg) | CI 95% | Body Height (cm) | CI 95% | VO2max mL·kg−1·min−1 | CI 95% | Stages (Number) | CI 95% |
|---|---|---|---|---|---|---|---|---|---|
| Mean ± SD | Mean ± SD | Mean ± SD | Mean ± SD | ||||||
| Boys | |||||||||
| 12 | 128 | 48.2 ± 9.9 | 46.4–49.9 | 155.1 ± 8.6 | 153.6–156.6 | 44.8 ± 5.3 | 43.8–45.7 | 5.1 ± 2.0 | 4.8–5.5 |
| 13 | 223 | 54.8 ± 13.1 | 53.1–56.5 | 161.3 ± 9.0 | 160.1–162.5 | 43.8 ± 4.9 | 43.2–44.5 | 5.3 ± 1.9 | 5.1–5.5 |
| 14 | 173 | 57.6 ± 10.2 | 56.1–59.2 | 166.5 ± 7.7 | 165.3–167.7 | 44.6 ± 6.8 | 43.6–45.6 | 6.2 ± 2.5 | 5.8–6.5 |
| 15 | 205 | 62.9 ± 11.1 | 61.4–64.5 | 170.6 ± 6.6 | 169.6–171.5 | 43.1 ± 6.9 | 42.1–44.1 | 6.2 ± 2.5 | 5.9–6.5 |
| 16 | 161 | 66.4 ± 11.7 | 64.5–68.3 | 172.7 ± 7.6 | 171.6–173.9 | 42.7 ± 7.2 | 41.6–43.8 | 6.6 ± 2.5 | 6.2–7.0 |
| 17 | 93 | 68.9 ± 11.6 | 66.4–71.4 | 173.5 ± 7.8 | 171.9–175.1 | 40.9 ± 7.2 | 39.4–42.4 | 6.6 ± 2.4 | 6.1–7.0 |
| Girls | |||||||||
| 12 | 161 | 47.9 ± 9.4 | 46.4–49.4 | 154.9 ± 6.3 | 153.9–155.9 | 41.6 ± 4.4 | 40.9–42.3 | 3.7 ± 1.7 | 3.5–4.0 |
| 13 | 211 | 51.6 ± 10.6 | 50.2–53.1 | 157.5 ± 6.1 | 156.7–158.3 | 39.6 ± 4.7 | 38.9–40.2 | 3.7 ± 1.7 | 3.5–3.9 |
| 14 | 143 | 55.3 ± 10.1 | 53.6–57.0 | 158.3 ± 6.2 | 157.2–159.3 | 37.4 ± 4.2 | 36.7–38.1 | 3.5 ± 1.6 | 3.2–3.7 |
| 15 | 117 | 56.9 ± 8.7 | 55.3–58.6 | 161.5 ± 6.7 | 160.3–162.7 | 38.3 ± 5.6 | 37.3–39.4 | 4.6 ± 1.9 | 4.2–4.9 |
| 16 | 128 | 58.8 ± 9.2 | 57.2–60.4 | 163.0 ± 7.0 | 161.8–164.3 | 36.2 ± 5.9 | 35.1–37.2 | 4.3 ± 2.1 | 4.0–4.7 |
| 17 | 71 | 59.7 ± 9.9 | 57.3–62.1 | 162.7 ± 7.8 | 160.8–164.5 | 33.9 ± 5.4 | 32.7–35.2 | 4.1 ± 1.8 | 3.7–4.5 |
| Age (Years) | N | WC (cm) | CI 95% | BMI (kg·m−2) | CI 95% |
|---|---|---|---|---|---|
| Boys | |||||
| 12.0–12.9 | 125 | 73.2 ± 10.6 | 71.4–75.1 | 20.7 ± 4.2 | 19.9–21.4 |
| 13.0–13.9 | 223 | 74.8 ± 10.3 | 73.5–76.2 | 20.9 ± 4.0 | 20.4–21.5 |
| 14.0–14.9 | 170 | 76.4 ± 10.6 | 74.8–78.0 | 21.2 ± 3.9 | 20.6–21.8 |
| 15.0–15.9 | 206 | 78.3 ± 10.3 | 76.9–79.7 | 21.9 ± 4.1 | 21.4–22.5 |
| 16.0–16.9 | 157 | 80.2 ± 10.2 | 78.5–81.8 | 22.5 ± 4.4 | 21.8–23.2 |
| 17.0–17.9 | 92 | 82.3 ± 10.1 | 80.2–84.3 | 23.5 ± 4.4 | 22.6–24.5 |
| Girls | |||||
| 12.0–12.9 | 160 | 73.5 ± 10.1 | 72.0–75.1 | 20.8 ± 4.3 | 20.1–21.4 |
| 13.0–13.9 | 211 | 74.5 ± 10.1 | 73.2–75.9 | 21.1 ± 4.1 | 20.5–21.7 |
| 14.0–14.9 | 144 | 75.7 ± 9.8 | 74.1–77.3 | 23.0 ± 4.8 | 22.2–23.8 |
| 15.0–15.9 | 116 | 76.6 ± 10.1 | 74.8–78.5 | 22.1 ± 3.4 | 21.4–22.7 |
| 16.0–16.9 | 130 | 77.7 ± 10.0 | 76.0–79.4 | 22.8 ± 4.0 | 22.0–23.4 |
| 17.0–17.9 | 72 | 78.6 ± 10.0 | 76.2–81.0 | 23.0 ± 4.1 | 22.0–23.9 |
| Boys | |||||
| Age (Years) | N | WHtR (Ratio) | CI 95% | BSA (m2) | CI 95% |
| 12.0–12.9 | 128 | 0.47 ± 0.06 | 0.46–0.49 | 1.47 ± 0.22 | 1.44–1.51 |
| 13.0–13.9 | 223 | 0.46 ± 0.06 | 0.45–0.47 | 1.57 ± 0.22 | 1.54–1.60 |
| 14.0–14.9 | 172 | 0.46 ± 0.06 | 0.45–0.47 | 1.65 ± 0.19 | 1.62–1.68 |
| 15.0–15.9 | 208 | 0.46 ± 0.06 | 0.45–0.47 | 1.74 ± 0.20 | 1.71–1.77 |
| 16.0–16.9 | 156 | 0.46 ± 0.06 | 0.45–0.47 | 1.79 ± 0.20 | 1.76–1.83 |
| 17.0–17.9 | 93 | 0.48 ± 0.07 | 0.46–0.49 | 1.85 ± 0.22 | 1.81–1.90 |
| Girls | |||||
| 12.0–12.9 | 162 | 0.48 ± 0.06 | 0.47–0.49 | 1.48 ± 0.21 | 1.44–1.51 |
| 13.0–13.9 | 212 | 0.47 ± 0.06 | 0.46–0.48 | 1.52 ± 0.20 | 1.50–1.55 |
| 14.0–14.9 | 144 | 0.48 ± 0.07 | 0.47–0.50 | 1.60 ± 0.21 | 1.57–1.64 |
| 15.0–15.9 | 117 | 0.47 ± 0.06 | 0.46–0.48 | 1.61 ± 0.15 | 1.59–1.64 |
| 16.0–16.9 | 131 | 0.48 ± 0.05 | 0.47–0.49 | 1.66 ± 0.18 | 1.62–1.69 |
| 17.0–17.9 | 72 | 0.49 ± 0.06 | 0.47–0.50 | 1.67 ± 0.21 | 1.62–1.72 |
| BMI (kg·m−2) | Percentiles | ||||||||||||||
|---|---|---|---|---|---|---|---|---|---|---|---|---|---|---|---|
| Age | N | L | M | S | P5 | P10 | P20 | P30 | P40 | P50 | P60 | P70 | P80 | P90 | P95 |
| Boys (N = 983) | |||||||||||||||
| 12.0–12.9 years | 128 | −1.81 | 20.6 | 0.203 | 15.9 | 16.6 | 17.7 | 18.7 | 19.6 | 20.6 | 21.7 | 23.2 | 25.3 | 29.3 | 34.4 |
| 13.0–13.9 years | 223 | −1.12 | 20.5 | 0.191 | 15.7 | 16.5 | 17.7 | 18.6 | 19.6 | 20.5 | 21.5 | 22.8 | 24.5 | 27.3 | 33.0 |
| 14.0–14.9 years | 171 | −1.71 | 21.0 | 0.184 | 16.5 | 17.2 | 18.3 | 19.2 | 20.1 | 21.0 | 22.0 | 23.3 | 25.1 | 28.4 | 32.2 |
| 15.0–15.9 years | 208 | −1.02 | 21.5 | 0.187 | 16.5 | 17.3 | 18.6 | 19.6 | 20.5 | 21.5 | 22.6 | 23.8 | 25.5 | 28.3 | 31.1 |
| 16.0–16.9 years | 161 | −1.85 | 22.5 | 0.196 | 17.5 | 18.3 | 19.5 | 20.5 | 21.5 | 22.5 | 23.7 | 25.2 | 27.4 | 31.5 | 36.7 |
| 17.0–17.9 years | 92 | −2.19 | 23.2 | 0.187 | 18.3 | 19.1 | 20.3 | 21.2 | 22.2 | 23.2 | 24.4 | 25.9 | 28.1 | 32.6 | 38.7 |
| Girls (N = 838) | |||||||||||||||
| 12.0–12.9 years | 162 | −1.51 | 20.3 | 0.207 | 15.4 | 16.2 | 17.4 | 18.4 | 19.3 | 20.3 | 21.4 | 22.9 | 24.9 | 28.5 | 32.7 |
| 13.0–13.9 years | 213 | −1.26 | 20.9 | 0.194 | 16.0 | 16.8 | 18.0 | 19.0 | 19.9 | 20.9 | 22.0 | 23.3 | 25.1 | 28.2 | 31.4 |
| 14.0–14.9 years | 144 | −1.54 | 22.6 | 0.209 | 17.2 | 18.1 | 19.3 | 20.4 | 21.5 | 22.6 | 23.9 | 25.5 | 27.7 | 31.9 | 36.9 |
| 15.0–15.9 years | 117 | −1.32 | 22.0 | 0.154 | 17.7 | 18.5 | 19.5 | 20.4 | 21.2 | 22.0 | 22.9 | 24.0 | 25.4 | 27.7 | 29.9 |
| 16.0–16.9 years | 131 | −2.00 | 22.0 | 0.180 | 17.4 | 18.2 | 19.3 | 20.2 | 21.1 | 22.0 | 23.1 | 24.4 | 26.4 | 30.0 | 34.5 |
| 17.0–17.9 years | 71 | −2.27 | 23.9 | 0.178 | 19.0 | 19.9 | 21.0 | 22.0 | 22.9 | 23.9 | 25.1 | 26.5 | 28.7 | 33.0 | 38.7 |
| WC (cm) | Percentiles | ||||||||||||||
| Age | N | L | M | S | P5 | P10 | P20 | P30 | P40 | P50 | P60 | P70 | P80 | P90 | P95 |
| Boys (N = 976) | |||||||||||||||
| 12.0–12.9 years | 125 | 1.02 | 72.8 | 0.145 | 55.4 | 59.2 | 63.9 | 67.3 | 70.1 | 72.8 | 75.5 | 78.3 | 81.7 | 86.3 | 90.1 |
| 13.0–13.9 years | 224 | 1.04 | 73.3 | 0.141 | 56.2 | 60.0 | 64.6 | 67.9 | 70.7 | 73.3 | 75.9 | 78.7 | 82.0 | 86.5 | 90.2 |
| 14.0–14.9 years | 171 | 0.98 | 75.8 | 0.139 | 58.5 | 62.3 | 66.9 | 70.3 | 73.1 | 75.8 | 78.5 | 81.3 | 84.7 | 89.3 | 93.2 |
| 15.0–15.9 years | 206 | 0.99 | 78.3 | 0.134 | 61.1 | 64.9 | 69.5 | 72.8 | 75.6 | 78.3 | 81.0 | 83.8 | 87.1 | 91.8 | 95.6 |
| 16.0–16.9 years | 157 | 1.01 | 79.2 | 0.132 | 62.0 | 65.8 | 70.4 | 73.7 | 76.6 | 79.2 | 81.8 | 84.7 | 88.0 | 92.6 | 96.4 |
| 17.0–17.9 years | 93 | 0.98 | 82.2 | 0.131 | 64.5 | 68.4 | 73.1 | 76.6 | 79.5 | 82.2 | 84.9 | 87.8 | 91.3 | 96.0 | 99.9 |
| Girls (N = 833) | |||||||||||||||
| 12.0–12.9 years | 160 | 0.50 | 72.9 | 0.137 | 57.4 | 60.7 | 64.7 | 67.8 | 70.4 | 72.9 | 75.4 | 78.2 | 81.6 | 86.3 | 90.3 |
| 13.0–13.9 years | 211 | 0.48 | 74.2 | 0.136 | 58.6 | 61.8 | 66.0 | 69.0 | 71.7 | 74.2 | 76.8 | 79.6 | 83.0 | 87.7 | 91.8 |
| 14.0–14.9 years | 144 | 0.37 | 74.3 | 0.133 | 59.1 | 62.3 | 66.3 | 69.2 | 71.8 | 74.3 | 76.8 | 79.6 | 82.9 | 87.7 | 91.8 |
| 15.0–15.9 years | 116 | 0.61 | 75.6 | 0.132 | 59.9 | 63.2 | 67.4 | 70.4 | 73.1 | 75.6 | 78.1 | 80.9 | 84.2 | 88.8 | 92.7 |
| 16.0–16.9 years | 130 | 0.99 | 76.9 | 0.129 | 60.6 | 64.2 | 68.6 | 71.7 | 74.4 | 76.9 | 79.4 | 82.1 | 85.3 | 89.6 | 93.3 |
| 17.0–17.9 years | 72 | 1.01 | 78.5 | 0.127 | 62.1 | 65.7 | 70.1 | 73.3 | 76.0 | 78.5 | 81.0 | 83.7 | 86.9 | 91.3 | 94.9 |
| BSA (m2) | Percentiles | ||||||||||||||
|---|---|---|---|---|---|---|---|---|---|---|---|---|---|---|---|
| Age | N | L | M | S | P5 | P10 | P20 | P30 | P40 | P50 | P60 | P70 | P80 | P90 | P95 |
| Boys (N = 982) | |||||||||||||||
| 12.0–12.9 years | 128 | −0.60 | 1.48 | 0.150 | 1.18 | 1.23 | 1.31 | 1.37 | 1.43 | 1.48 | 1.54 | 1.60 | 1.69 | 1.82 | 1.93 |
| 13.0–13.9 years | 223 | 0.07 | 1.57 | 0.140 | 1.24 | 1.31 | 1.39 | 1.46 | 1.52 | 1.57 | 1.63 | 1.69 | 1.77 | 1.88 | 1.97 |
| 14.0–14.9 years | 170 | −2.14 | 1.65 | 0.115 | 1.41 | 1.45 | 1.51 | 1.56 | 1.60 | 1.65 | 1.70 | 1.76 | 1.84 | 1.97 | 2.10 |
| 15.0–15.9 years | 208 | −1.17 | 1.72 | 0.115 | 1.45 | 1.50 | 1.57 | 1.62 | 1.67 | 1.72 | 1.77 | 1.83 | 1.91 | 2.02 | 2.13 |
| 16.0–16.9 years | 161 | −1.26 | 1.79 | 0.112 | 1.52 | 1.57 | 1.64 | 1.69 | 1.74 | 1.79 | 1.84 | 1.90 | 1.98 | 2.10 | 2.21 |
| 17.0–17.9 years | 93 | −2.75 | 1.82 | 0.119 | 1.56 | 1.60 | 1.67 | 1.72 | 1.77 | 1.82 | 1.88 | 1.95 | 2.05 | 2.22 | 2.41 |
| Girls (N = 838) | |||||||||||||||
| 12.0–12.9 years | 162 | −1.60 | 1.50 | 0.142 | 1.23 | 1.28 | 1.34 | 1.40 | 1.45 | 1.50 | 1.56 | 1.62 | 1.71 | 1.86 | 2.01 |
| 13.0–13.9 years | 212 | −0.10 | 1.52 | 0.132 | 1.23 | 1.29 | 1.36 | 1.42 | 1.47 | 1.52 | 1.57 | 1.63 | 1.70 | 1.80 | 1.89 |
| 14.0–14.9 years | 144 | −1.99 | 1.59 | 0.131 | 1.33 | 1.38 | 1.44 | 1.49 | 1.54 | 1.59 | 1.65 | 1.71 | 1.80 | 1.95 | 2.11 |
| 15.0–15.9 years | 117 | −1.44 | 1.60 | 0.093 | 1.39 | 1.43 | 1.49 | 1.53 | 1.56 | 1.60 | 1.64 | 1.68 | 1.74 | 1.82 | 1.90 |
| 16.0–16.9 years | 131 | −0.80 | 1.65 | 0.108 | 1.40 | 1.45 | 1.51 | 1.56 | 1.61 | 1.65 | 1.70 | 1.75 | 1.81 | 1.91 | 2.00 |
| 17.0–17.9 years | 71 | −0.78 | 1.66 | 0.126 | 1.37 | 1.43 | 1.50 | 1.56 | 1.61 | 1.66 | 1.71 | 1.78 | 1.85 | 1.97 | 2.08 |
| WHtR (ratio) | Percentiles | ||||||||||||||
| Age | N | L | M | S | P5 | P10 | P20 | P30 | P40 | P50 | P60 | P70 | P80 | P90 | P95 |
| Boys (N = 976) | |||||||||||||||
| 12.0–12.9 years | 125 | 1.01 | 0.45 | 0.128 | 0.36 | 0.38 | 0.40 | 0.42 | 0.44 | 0.45 | 0.46 | 0.48 | 0.50 | 0.52 | 0.54 |
| 13.0–13.9 years | 223 | 0.25 | 0.45 | 0.130 | 0.36 | 0.38 | 0.40 | 0.42 | 0.44 | 0.45 | 0.46 | 0.48 | 0.50 | 0.53 | 0.55 |
| 14.0–14.9 years | 172 | 0.21 | 0.45 | 0.128 | 0.36 | 0.38 | 0.40 | 0.42 | 0.44 | 0.45 | 0.46 | 0.48 | 0.50 | 0.53 | 0.55 |
| 15.0–15.9 years | 206 | 0.70 | 0.46 | 0.128 | 0.37 | 0.39 | 0.41 | 0.43 | 0.45 | 0.46 | 0.47 | 0.49 | 0.51 | 0.54 | 0.56 |
| 16.0–16.9 years | 156 | −0.60 | 0.47 | 0.128 | 0.39 | 0.40 | 0.42 | 0.44 | 0.46 | 0.47 | 0.49 | 0.50 | 0.53 | 0.56 | 0.59 |
| 17.0–17.9 years | 93 | 1.59 | 0.48 | 0.146 | 0.35 | 0.38 | 0.42 | 0.44 | 0.46 | 0.48 | 0.50 | 0.52 | 0.54 | 0.57 | 0.59 |
| Girls (N = 833) | |||||||||||||||
| 12.0–12.9 years | 160 | 0.01 | 0.47 | 0.128 | 0.38 | 0.40 | 0.42 | 0.44 | 0.46 | 0.47 | 0.49 | 0.50 | 0.52 | 0.55 | 0.58 |
| 13.0–13.9 years | 211 | −0.31 | 0.47 | 0.146 | 0.38 | 0.40 | 0.42 | 0.44 | 0.46 | 0.47 | 0.49 | 0.50 | 0.52 | 0.56 | 0.58 |
| 14.0–14.9 years | 144 | 0.71 | 0.48 | 0.128 | 0.37 | 0.39 | 0.42 | 0.44 | 0.46 | 0.48 | 0.50 | 0.52 | 0.54 | 0.57 | 0.60 |
| 15.0–15.9 years | 116 | 1.01 | 0.46 | 0.104 | 0.36 | 0.38 | 0.41 | 0.43 | 0.45 | 0.46 | 0.47 | 0.49 | 0.51 | 0.54 | 0.56 |
| 16.0–16.9 years | 130 | −0.80 | 0.48 | 0.122 | 0.41 | 0.42 | 0.44 | 0.46 | 0.47 | 0.48 | 0.49 | 0.51 | 0.53 | 0.55 | 0.58 |
| 17.0–17.9 years | 72 | 1.01 | 0.48 | 0.128 | 0.38 | 0.40 | 0.43 | 0.45 | 0.47 | 0.48 | 0.49 | 0.51 | 0.53 | 0.56 | 0.58 |
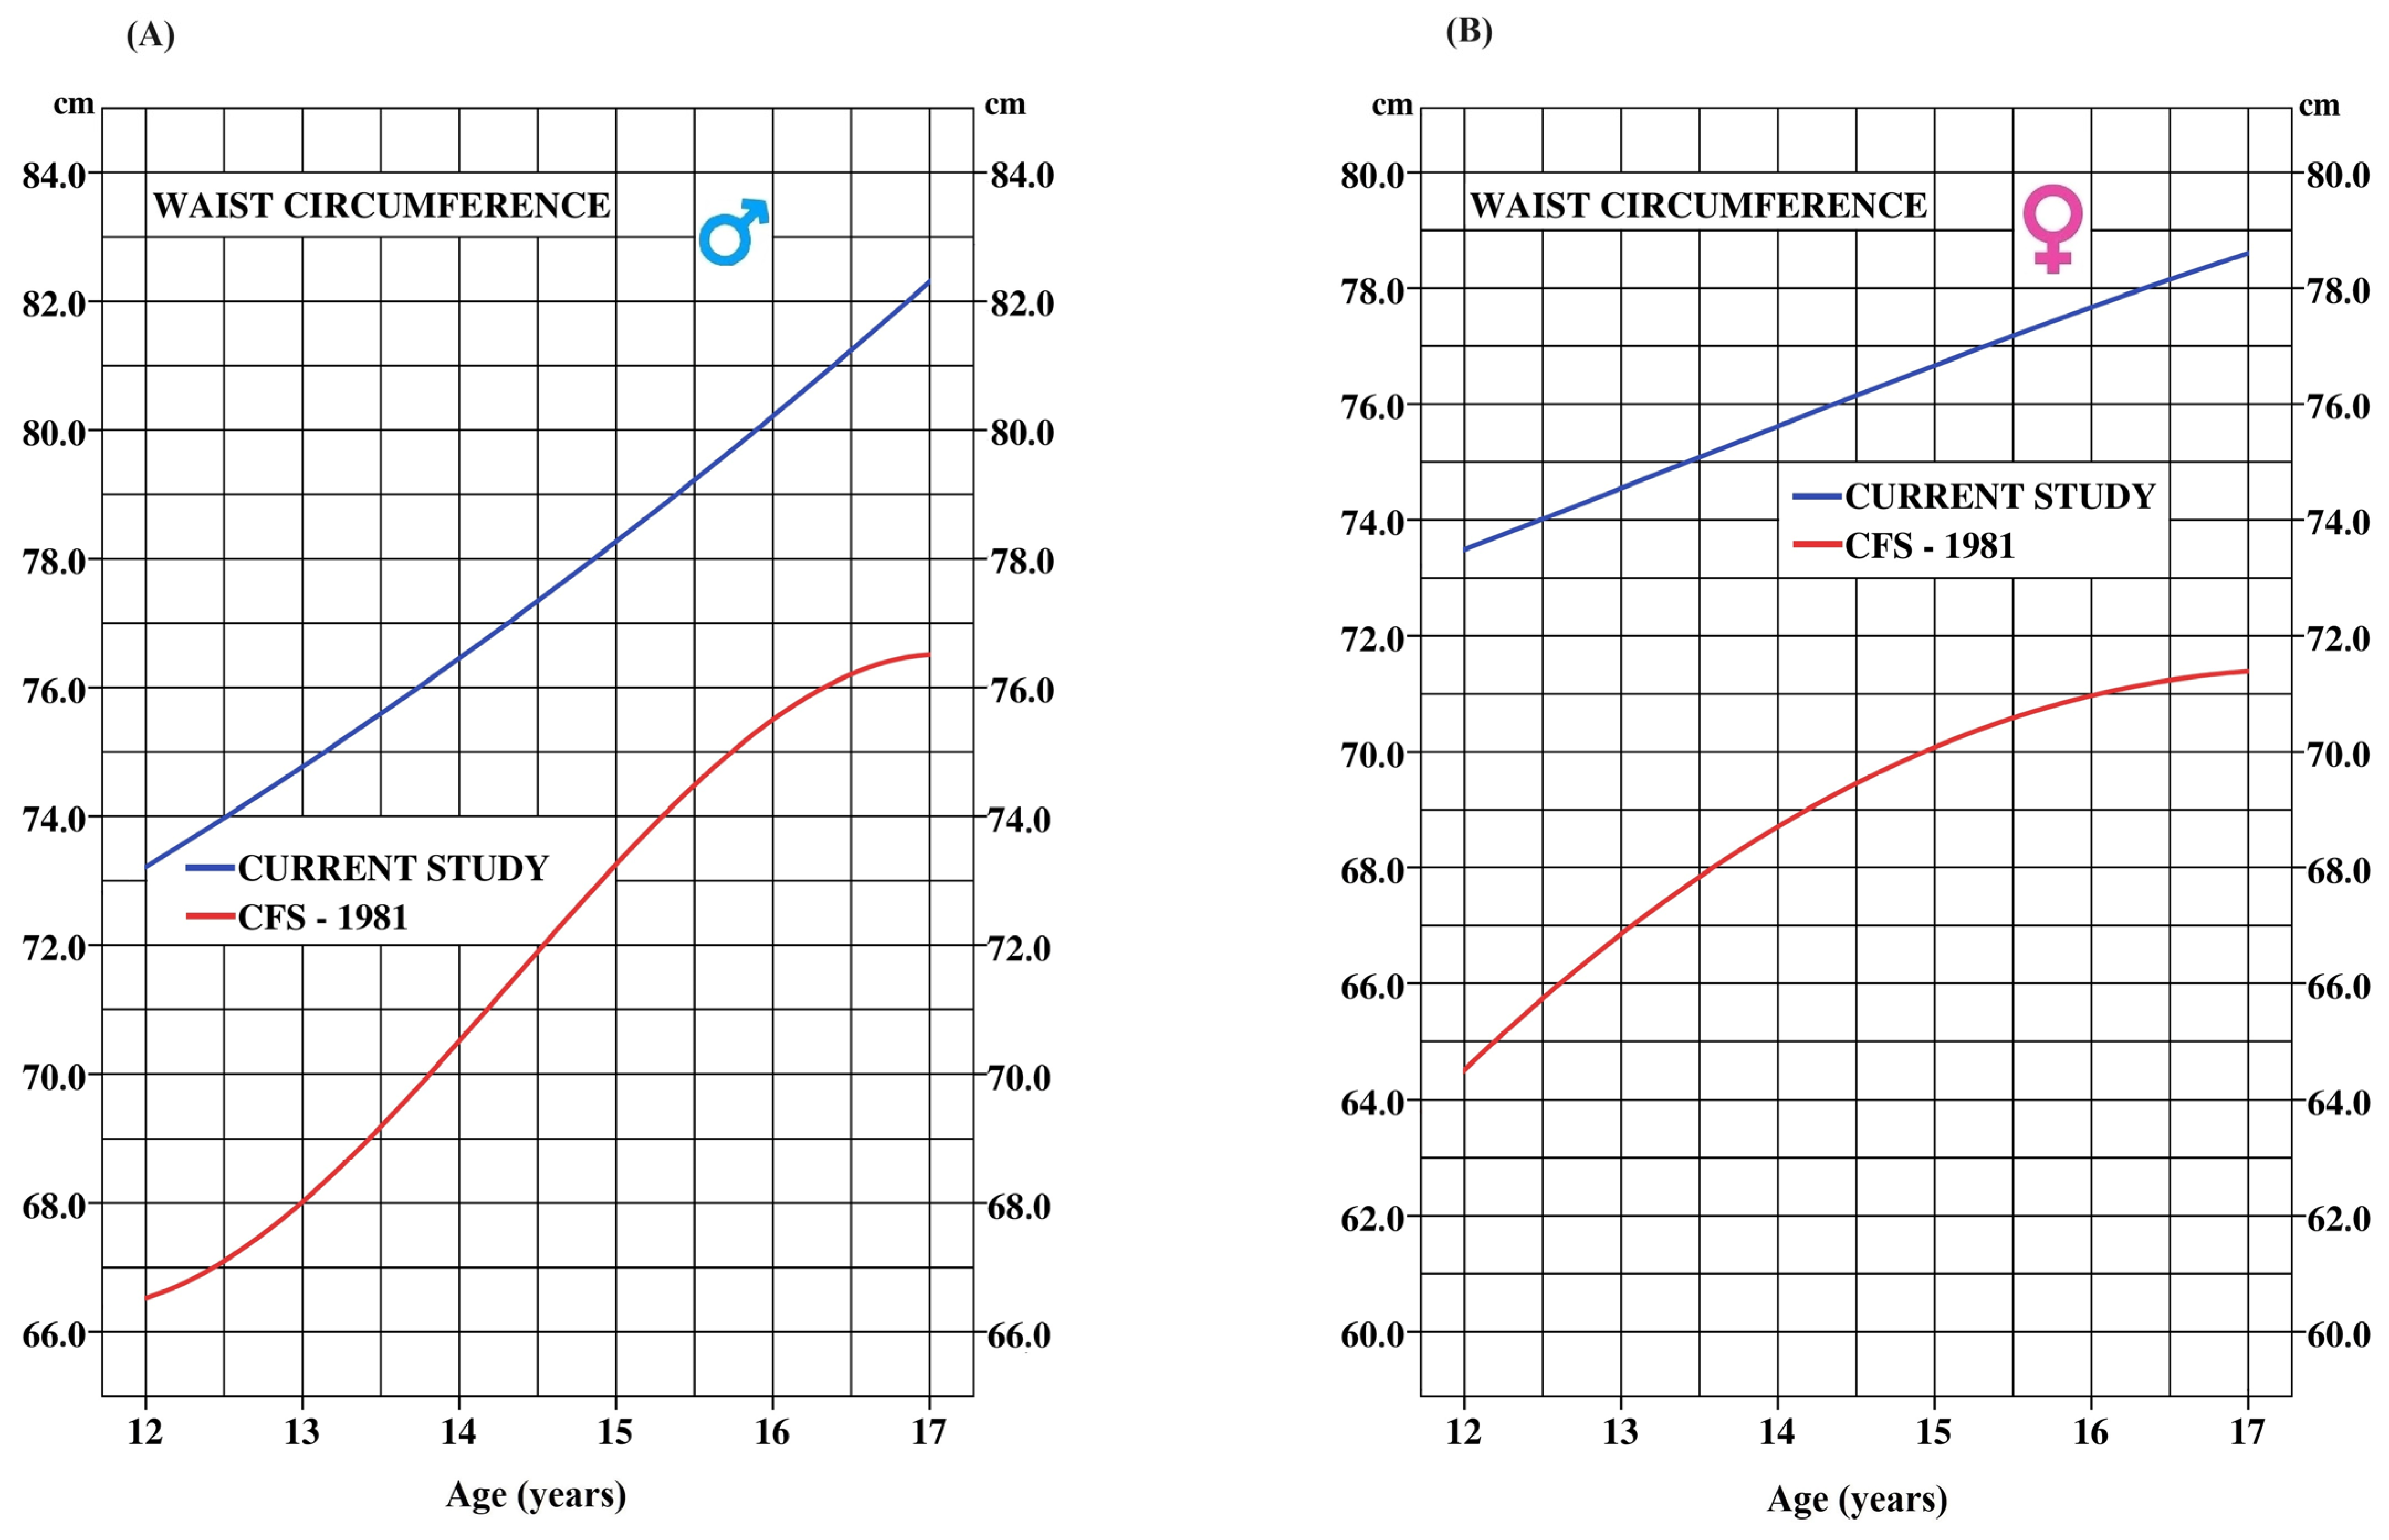
| Age (Years) | N | CFS 1981 (cm) | N | Current Study 2017 (cm) | p Values | Cohen’s d Effect Size | ∆ WC (cm) |
|---|---|---|---|---|---|---|---|
| Boys | |||||||
| 12 | 187 | 66.7 ± 7.1 | 125 | 73.2 ± 10.6 | 0.0001 | 0.75 | 6.5 |
| 13 | 218 | 67.5 ± 5.4 | 223 | 74.8 ± 10.3 | 0.0001 | 0.89 | 7.3 |
| 14 | 189 | 70.8 ± 6.5 | 170 | 76.4 ± 10.6 | 0.0001 | 0.65 | 5.6 |
| 15 | 191 | 73.7 ± 6.6 | 206 | 78.3 ± 10.3 | 0.0001 | 0.55 | 4.6 |
| 16 | 204 | 74.9 ± 6.3 | 157 | 80.2 ± 10.2 | 0.0001 | 0.64 | 5.3 |
| 17 | 187 | 76.7 ± 9.0 | 92 | 82.3 ± 10.1 | 0.0001 | 0.60 | 5.6 |
| Mean | = 5.8 | ||||||
| Girls | |||||||
| 12 | 208 | 64.5 ± 7.9 | 161 | 73.5 ± 10.1 | 0.0001 | 1.01 | 9.0 |
| 13 | 184 | 67.0 ± 6.9 | 211 | 74.5 ± 10.1 | 0.0001 | 0.86 | 7.5 |
| 14 | 181 | 68.2 ± 7.3 | 143 | 75.7 ± 9.8 | 0.0001 | 0.88 | 7.5 |
| 15 | 200 | 70.8 ± 7.7 | 117 | 76.6 ± 10.1 | 0.0001 | 0.67 | 5.8 |
| 16 | 185 | 70.5 ± 7.9 | 128 | 77.7 ± 10.0 | 0.0001 | 0.82 | 7.2 |
| 17 | 195 | 71.5 ± 9.0 | 71 | 78.6 ± 10.0 | 0.0001 | 0.77 | 7.1 |
| Mean | = 7.4 | ||||||
| * BMI (kg·m−2) | ||||||
|---|---|---|---|---|---|---|
| Boys | Girls | |||||
| Age | Low-Risk | High-Risk | Very-High-Risk | Low-Risk | High-Risk | Very-High-Risk |
| 12 | ≤21.5 | 21.6–26.4 | ≥26.5 | ≤22.0 | 22.1–27.2 | ≥27.3 |
| 13 | ≤22.2 | 22.3–27.2 | ≥27.3 | ≤22.9 | 23.0–28.1 | ≥28.2 |
| 14 | ≤22.9 | 23.0–27.9 | ≥28.0 | ≤23.6 | 23.7–28.8 | ≥28.9 |
| 15 | ≤23.5 | 23.6–28.5 | ≥28.6 | ≤24.1 | 24.2–29.2 | ≥29.3 |
| 16 | ≤24.1 | 24.1–29.1 | ≥29.2 | ≤24.5 | 24.6–29.5 | ≥29.6 |
| 17 | ≤24.6 | 24.7–29.6 | ≥29.7 | ≤24.8 | 24.9–29.7 | ≥29.8 |
| WC | ||||||
| 12 | ≤81.6 | 81.7–90.0 | ≥90.1 | ≤81.5 | 81.6–90.2 | ≥90.3 |
| 13 | ≤81.9 | 82.0–90.1 | ≥90.2 | ≤82.9 | 83.0–91.7 | ≥91.8 |
| 14 | ≤84.6 | 84.7–93.1 | ≥93.2 | ≤82.8 | 82.9–91.7 | ≥91.8 |
| 15 | ≤87.0 | 87.1–95.5 | ≥95.6 | ≤84.1 | 84.2–92.6 | ≥92.7 |
| 16 | ≤87.9 | 88.0–96.3 | ≥96.4 | ≤85.2 | 85.3–93.2 | ≥93.3 |
| 17 | ≤91.3 | 91.4–99.8 | ≥99.9 | ≤86.8 | 86.9–94.8 | ≥94.9 |
| WHtR (Ratio) | ||||||
| 12 | ≤0.49 | 0.50–0.53 | ≥0.54 | ≤0.51 | 0.52–0.57 | ≥0.58 |
| 13 | ≤0.49 | 0.50–0.54 | ≥0.55 | ≤0.51 | 0.52–0.57 | ≥0.58 |
| 14 | ≤0.49 | 0.50–0.54 | ≥0.55 | ≤0.53 | 0.54–0.59 | ≥0.60 |
| 15 | ≤0.50 | 0.51–0.55 | ≥0.56 | ≤0.50 | 0.51–0.55 | ≥0.56 |
| 16 | ≤0.52 | 0.53–0.58 | ≥0.59 | ≤0.52 | 0.53–0.57 | ≥0.58 |
| 17 | ≤0.53 | 0.54–0.58 | ≥0.59 | ≤0.52 | 0.53–0.57 | ≥0.58 |
| BSA (m2) | ||||||
| 12 | ≤1.68 | 1.69–1.92 | ≥1.93 | ≤1.70 | 1.71–2.00 | ≥2.01 |
| 13 | ≤1.76 | 1.77–1.96 | ≥1.97 | ≤1.69 | 1.70–1.89 | ≥1.90 |
| 14 | ≤1.84 | 1.85–2.09 | ≥2.10 | ≤1.79 | 1.80–2.10 | ≥2.11 |
| 15 | ≤1.91 | 1.92–2.12 | ≥2.13 | ≤1.73 | 1.74–1.90 | ≥1.91 |
| 16 | ≤1.97 | 1.98–2.20 | ≥2.21 | ≤1.80 | 1.81–2.00 | ≥2.01 |
| 17 | ≤2.04 | 2.05–2.40 | ≥2.41 | ≤1.84 | 1.85–2.07 | ≥2.08 |
| VO2max (ml·kg−1·min−1) | ||||||
| 12 | ≥44.6 | 44.5–36.6 | ≤36.5 | ≥41.4 | 41.3–34.7 | ≤34.6 |
| 13 | ≥43.7 | 43.6–36.3 | ≤36.2 | ≥39.4 | 39.3–32.2 | ≤32.1 |
| 14 | ≥44.3 | 44.2–34.1 | ≤34.0 | ≥37.2 | 37.1–30.7 | ≤30.6 |
| 15 | ≥42.9 | 42.8–32.2 | ≤32.1 | ≥38.2 | 38.1–29.7 | ≤29.6 |
| 16 | ≥42.7 | 42.6–31.5 | ≤31.4 | ≥35.9 | 35.8–26.8 | ≤26.7 |
| 17 | ≥42.0 | 41.9–29.5 | ≤29.4 | ≥34. 7 | 34.6–25.3 | ≤25.2 |
| Stages (number) | ||||||
| 12 | ≥5.1 | 5.0–2.1 | ≤2.0 | ≥3.7 | 3.6–1.1 | ≤1.0 |
| 13 | ≥5.3 | 5.2–2.4 | ≤2.3 | ≥3.7 | 3.6–1.0 | ≤0.9 |
| 14 | ≥6.1 | 6.0–2.4 | ≤2.3 | ≥3.4 | 3.3–1.0 | ≤0.9 |
| 15 | ≥6.1 | 6.0–2.4 | ≤2.3 | ≥4.5 | 4.4–1.5 | ≤1.4 |
| 16 | ≥6.6 | 6.5–2.8 | ≤2.7 | ≥4.3 | 4.2–1.2 | ≤1.1 |
| 17 | ≥6.6 | 6.5–2.8 | ≤2.7 | ≥4.1 | 4.0–1.3 | ≤1.2 |
| N | Mean ± (SD) | CI | SEM | p Value | Cohen’s d | R2 | |
|---|---|---|---|---|---|---|---|
| Percentile Based on Four Markers ∑(BMI, WC, VO2peak, Stages)/4 | |||||||
| Measured composite score (Percentile) | 1791 | 49.8 ± 23.0 | 48.7–50.8 | 0.542 | 0.783 | 0.000 | 0.891 |
| Predicted composite score (Percentile) | 1791 | 49.8 ± 21.8 | 48.8–50.8 | 0.512 | |||
| Percentile based on three markers ∑(BMI, WC, VO2peak)/3 | |||||||
| Measured composite score (Percentile) | 1798 | 49.8 ± 23.3 | 48.7–50.9 | 0.550 | 0.016 | 0.018 | 0.881 |
| Predicted composite score (Percentile) | 1798 | 49.4 ± 21.9 | 48.3–50.4 | 0.515 | |||
| R2 | RMSE | MAE | SEE | Mean VIF | |
|---|---|---|---|---|---|
| Equation (1) Composite score estimation with the average percentile of four markers | |||||
| Composite score = −15.54 + (WC × 0.91) + (BMI × 1.45) + (Stage × −4.62) + (VO2peak × −0.298) | 0.891 | 7.5 | 6.0 | 7.5 | 3.3 Range: 2.5–4.1 |
| Equation (2) Composite score estimation with the average percentile of three markers (without stage) | |||||
| Composite score = −23.26 + (WC × 1.00) + (BMI × 2.09) + (VO2peak × −1.20) | 0.881 | 8.1 | 6.5 | 8.1 | 2.0 Range: 1.1–2.5 |
| Age | BMI | WC | WHtR | BSA | VO2peak | Stages | Composite Score |
|---|---|---|---|---|---|---|---|
| Boys | |||||||
| 12 | 32.8% | 22.4% | 32.0% | 15.6% | 49.2% | 54.7% | 34.5% |
| 13 | 30.5% | 25.9% | 27.8% | 15.7% | 45.8% | 48.4% | 32.4% |
| 14 | 23.3% | 21.1% | 22.8% | 14.0% | 45.3% | 54.1% | 30.1% |
| 15 | 24.5% | 21.4% | 22.3% | 16.7% | 47.0% | 52.1% | 30.7% |
| 16 | 24.9% | 23.6% | 13.4% | 18.6% | 50.3% | 52.8% | 30.6% |
| 17 | 28.3% | 21.5% | 16.1% | 16.1% | 57.3% | 52.1% | 31.9% |
| Mean | 27.4% | 22.7% | 22.4% | 16.1% | 49.2% | 52.4% | 31.7% |
| Girls | |||||||
| 12 | 29.6% | 28.8% | 27.5% | 13.0% | 51.8% | 51.2% | 33.7% |
| 13 | 24.9% | 21.3% | 21.3% | 17.9% | 53.0% | 57.0% | 32.6% |
| 14 | 34.7% | 29.2% | 21.5% | 19.4% | 55.2% | 53.1% | 35.5% |
| 15 | 22.9% | 21.6% | 23.3% | 21.2% | 55.7% | 53.2% | 33.0% |
| 16 | 22.1% | 20.8% | 18.5% | 16.0% | 48.9% | 52.6% | 29.8% |
| 17 | 22.5% | 20.8% | 26.4% | 16.9% | 65.8% | 56.9% | 34.9% |
| Mean | 26.1% | 23.8% | 23.1% | 17.4% | 55.1% | 54.0% | 33.3% |
Disclaimer/Publisher’s Note: The statements, opinions and data contained in all publications are solely those of the individual author(s) and contributor(s) and not of MDPI and/or the editor(s). MDPI and/or the editor(s) disclaim responsibility for any injury to people or property resulting from any ideas, methods, instructions or products referred to in the content. |
© 2024 by the authors. Licensee MDPI, Basel, Switzerland. This article is an open access article distributed under the terms and conditions of the Creative Commons Attribution (CC BY) license (https://creativecommons.org/licenses/by/4.0/).
Share and Cite
Leone, M.; Bui, H.T.; Kalinova, E.; Lemoyne, J.; Gagnon, D.; Léger, L.; Larivière, G.; Allisse, M. Investigation of Underlying Association between Anthropometric and Cardiorespiratory Fitness Markers among Overweight and Obese Adolescents in Canada. Int. J. Environ. Res. Public Health 2024, 21, 408. https://doi.org/10.3390/ijerph21040408
Leone M, Bui HT, Kalinova E, Lemoyne J, Gagnon D, Léger L, Larivière G, Allisse M. Investigation of Underlying Association between Anthropometric and Cardiorespiratory Fitness Markers among Overweight and Obese Adolescents in Canada. International Journal of Environmental Research and Public Health. 2024; 21(4):408. https://doi.org/10.3390/ijerph21040408
Chicago/Turabian StyleLeone, Mario, Hung Tien Bui, Emilia Kalinova, Jean Lemoyne, Dominic Gagnon, Luc Léger, Georges Larivière, and Maxime Allisse. 2024. "Investigation of Underlying Association between Anthropometric and Cardiorespiratory Fitness Markers among Overweight and Obese Adolescents in Canada" International Journal of Environmental Research and Public Health 21, no. 4: 408. https://doi.org/10.3390/ijerph21040408