Article

Evaluation of a Childhood Obesity Program Serving a High-Need Population in Brooklyn, New York Using Survival Analysis

1
Department of Epidemiology and Biostatistics, School of Public Health, SUNY Downstate Health Sciences University, 450 Clarkson Ave, Brooklyn, NY 11203, USA
2
Department of Community Health Sciences, School of Public Health, SUNY Downstate Health Sciences University, 450 Clarkson Ave, Brooklyn, NY 11203, USA
3
Department of Pediatrics, SUNY Downstate Health Sciences University, 450 Clarkson Ave, Brooklyn, NY 11203, USA
*
Author to whom correspondence should be addressed.
Int. J. Environ. Res. Public Health 2023, 20(9), 5723; https://doi.org/10.3390/ijerph20095723
Submission received: 11 March 2023 / Revised: 29 March 2023 / Accepted: 30 April 2023 / Published: 4 May 2023
(This article belongs to the Topic Socio-Environmental Determinants of the Disparities in Health Behaviors among Minority Youth)
(This article belongs to the Section Children's Health)

Abstract

:
In this study, we used survival analysis to evaluate whether contact hours intensity was associated with a reduction in time to improvement of various BMI metrics over a 5-year follow-up period at the Live Light Live Right pediatric obesity program in Brooklyn, New York. This was a single-center retrospective longitudinal study of 406 patients during 2010–2016. Participants were categorized based on hours of exposure to Live Light Live Right’s interventions; high contact hours ( 50 h) vs. low contact hours (<50 h). At baseline, 88% of patients in the high contact hour group had severe obesity and the mean age for this group was 10.0 ± 2.66. High contact hours were independently associated with a shorter time to BMI improvement in the sample. There was also a significant association between high contact hours and a longer duration in the improved state. Survival analysis was successful in evaluating the efficacy of the Live Light Live Right Program and demonstrated a positive association between greater intervention intensity and a healthier metabolic profile. Patients’ active engagement in a robust treatment model exemplified by Live Light Live Right is recommended to address the childhood obesity crisis in central Brooklyn.

1. Introduction

The obesity epidemic in the U.S. is a major public health concern; studies have reported an obesity prevalence of 19.3% in youths, which includes 6.1% with severe obesity [1]. Reports on severe obesity in New York City youth have indicated a disproportionate burden of disease among children of color [2]. Central Brooklyn is an area of concern, as it is comprised of predominantly low-income African American and Afro-Caribbean neighborhoods. It is also one of three New York City Department of Health districts identified as high-need with a disproportionate burden of chronic disease. The obesity rates in kindergarten through 8th grade (K—8) children in the central Brooklyn areas of Brownsville and East New York—some of the most underserved neighborhoods in New York City—of 23% and 25%, respectively, exceed those of the overall Brooklyn and New York City [3,4].
The American Heart Association (AHA) has emphasized that in comparison to youths with low obesity, children with severe obesity have a more adverse cardiovascular risk factor profile and show early signs of vascular dysfunction and subclinical atherosclerosis [5]. Furthermore, studies suggest that severe obesity in childhood may increase the likelihood of obesity in adulthood [6]. Significantly, the lifetime cost of obesity remains a huge burden: obesity-related medical spending in the U.S. in 2014 was an estimated USD 149 billion [7]. Thus, the need for targeted childhood obesity interventions in central Brooklyn becomes evident, if we are to address this epidemic, its associated adverse health outcomes, and economic burden.
It is well-documented that intensive lifestyle modification interventions compared to standard of care lead to a significant and clinically meaningful reduction in weight in children and adolescents [8,9,10,11,12]. Further lifestyle modification in high-risk adults has been shown to delay the onset of obesity-related conditions, including diabetes and cardiovascular risk factors [13,14,15].
International recommendations agree that the core elements of any initiative to address pediatric obesity should involve the whole family and include nutrition education, behavior modification, and promotion of physical activity [8,9,10,11,12]. Of note, the United States Preventive Task Force (USPTF) recommends obesity screening and behavioral interventions in children and adults to promote improvement in weight status [16,17]. The transcreation framework for addressing health disparity in populations recommends engaging community partners in intervention delivery, making these interventions more sustainable, appealing, and culturally sensitive [18]. Additionally, the National Academy of Medicine (NAM) has proposed a framework that integrates clinical and community systems to prevent and manage obesity [19].
Live Light Live Right (LLLR) is an evidence-based childhood obesity program—serving the central Brooklyn area—that takes a sustainable approach to obesity management. It is the only tertiary-care childhood obesity program in Brooklyn, New York, and 85% of the patients seen have severe obesity. Thus, under the transcreation framework [18], it is essential to be able to perform a “real world” assessment of the effectiveness of this intervention program, which could serve as a model for other disproportionately affected areas. Traditionally, pretest-posttest designs have been used to evaluate the effectiveness of disease management intervention programs. However, this approach has been deemed relatively weak—it is prone to loss to attrition and the effect of confounding factors [20]. Similarly, in conventional cohort analyses, loss-to-follow-up reduces the analytical sample and introduces bias [21].
To address some of these shortcomings, this study utilized the method of survival analysis, a robust statistical approach, to evaluate the effectiveness of the LLLR childhood obesity program. Unlike conventional retrospective cohort studies which often suffer from loss-to-follow-up and selection bias, survival analysis permits analysis of loss-to-follow-up by accounting for the time subjects are in the study. In survival analysis, the outcome of interest is the “time to event [22,23],”and using time to event as an outcome can provide more clinical information in lieu of the binary indicator of whether an event occurs [23]. One can assess the efficacy of an intervention based on how quickly it takes to achieve the event, for example. In this study, we use survival analysis to assess the time taken to improve BMIz, BMI%95, and Δ BMI metrics for 12 consecutive months based on contact hours received at LLLR.

2. Materials and Methods

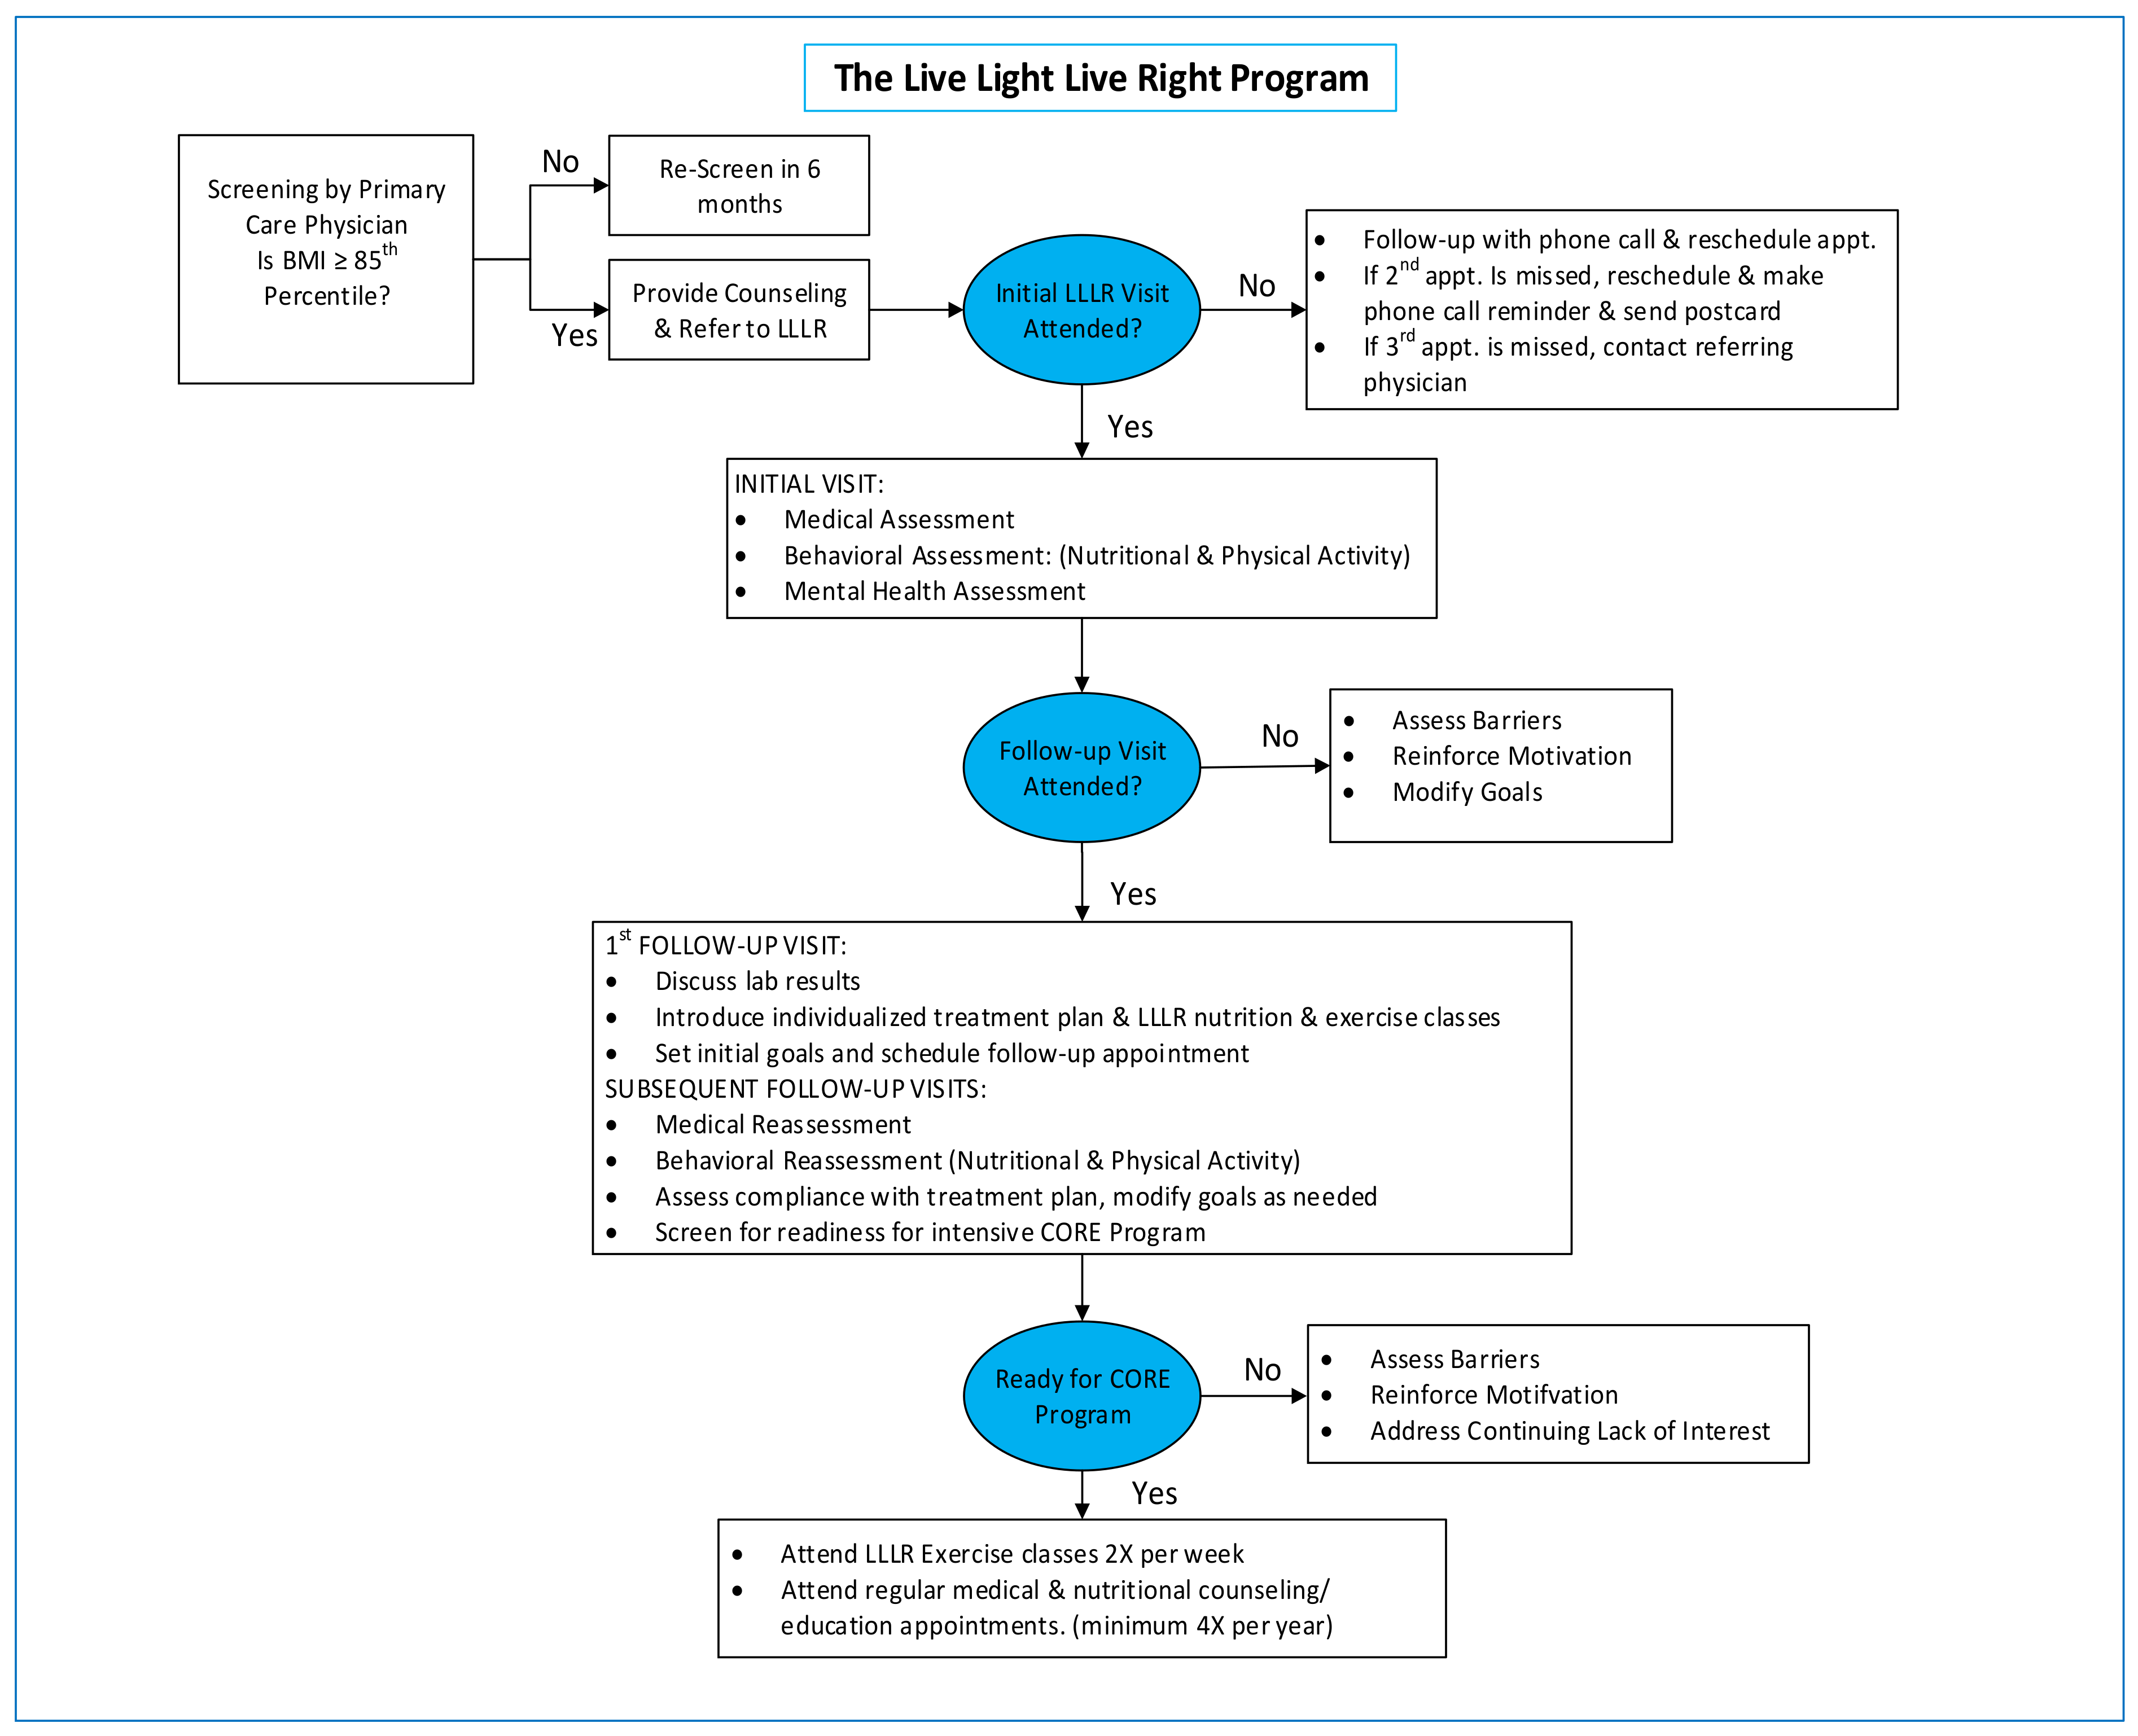
2.1. Intervention Methods

LLLR Individualized Treatment Model

Figure 1 illustrates the schematic of the LLLR treatment program. Children between the ages of 2 and 19 with a body mass index (BMI) ≥85th percentile for age and sex can be referred to the program. LLLR provides individualized obesity treatment plans with three core elements: (1) medical evaluation and treatment of patients at its multi-disciplinary obesity specialty clinic; (2) family nutritional and behavioral counseling and age-appropriate wellness education; and (3) referral to supervised exercise programs at a number of local gyms and community-based organizations. Behavioral treatment of obesity at LLLR incorporates strategies such as goal setting, self-monitoring, stimulus control, and problem-solving [24]. A detailed overview of LLLR’s intervention method can be found in the literature [21].

2.2. Study Methods

Study Design

This was a single-center retrospective longitudinal study; data for this study were obtained from the electronic medical records of patients in the LLLR program. The Institutional Review Board at SUNY Downstate Medical Center approved this study as secondary research which waived the requirement for informed consent.

2.3. Subjects

A total of 406 participants who were enrolled in the LLLR program for a minimum of 1 year between 2010 and 2016 were eligible for the study. Participants not enrolled during this period for a minimum of one year were excluded from the study.

2.3.1. Contact Hour Grouping (Main Predictor)

Contact hours are determined based on clinical visits and participation in LLLR’s exercise program, core components of their individualized treatment model. The initial clinical visit counts for 3 contact hours, and subsequent visits equated to 2 contact hours. Each exercise session accounts for 1 contact hour. This division by contact hours categorized participants into a high contact hour group comprising those receiving 50 or more hours of clinical visits and exercise (150 patients), and a low contact hour group with those receiving less than 50 h of the intervention (256 patients) throughout a 5-year follow-up period. The United States Preventive Task Force (USPTF) found that comprehensive behavioral modifications of a minimum of 26 contact hours over a 2–12-month period result in improvement in weight status [16]. They further noted that “behavioral interventions with 52 contact hours or more demonstrated greater weight loss and improvements in metabolic and cardiovascular risk factors [16]”. The current research used 50 contact hours as a cut-point as an option to round the 52 contact hours. Based on experience, we do not feel that 26 contact hours were enough to show an impact. Furthermore, since the majority of the clinic’s patient population had severe obesity, it was important that they received an intervention that provided an adequate amount of exposure. Additionally, since this is a long-term study with a 5-year follow-up period, 50 contact hours would be more ideal for the high contact hour group than a threshold of 26 contact hours.

2.3.2. Event Endpoint (Primary Outcome)

This was defined as the first recorded time of improving the level of BMIz, BMI%95, and ΔBMI metrics/risk factors below the recorded baseline level and staying in that improved state for at least 12 months. The maximum follow-up time for this study was 60 months after the initial visit.
Secondary Outcomes: Improvement in systolic and diastolic hypertension for 12 consecutive months.
This was defined as the first recorded time of improving systolic and diastolic hypertension (decreasing systolic and diastolic blood pressure) from the baseline measurements of these metrics that is sustained for 12 months.

2.3.3. Censoring

Participants who did not experience the “event” have been right-censored at the time of the last visit from the initial visit, before the 60-month period (loss-to-follow-up censoring). Additionally, participants who made it to the end of the study and did not experience the event were right-censored (end of study censoring).

2.3.4. Measurement of Outcomes

BMI was determined based on patients’ recorded height and weight. It was calculated using the formula: weight (kg)/height (m2). From this, we determined the BMI percentile, which is a child’s BMI relative to that of US children of the same sex and age. [25]. BMI %95 is a child’s BMI percentile relative to the 95th percentile of BMI of US children of the same sex and age. This was calculated using the CDC’s growth charts.
BMI percentiles were used to determine weight statuses. Healthy weight was defined as BMI ranging from the 5th percentile to less than the 85th percentile; overweight: 85th percentile ≤ BMI < 95th percentile; obesity: 95th percentile ≤ BMI < 120% of the 95th percentile; and severe obesity: BMI ≥ 120% of the 95th percentile.
BMIz scores were another BMI indicator used. These are standard deviation scores that may be used to quantify how far BMI values are from population means based on sex and age [26]. BMIz was calculated using the LMS method [26].
The third BMI metric used was ΔBMI. Delta BMI was calculated from patients’ BMI and BMI%95 by subtracting BMI%95 from the BMI values. Since a child’s BMI%95 value is based on age (and sex), it means that this metric can change with a child’s age, even if their BMI stays constant. Thus, delta BMI is a metric that captures the differences in BMI and BMI%95 over time.
BMI z is the most frequently used of these BMI metrics in children, however, it has drawbacks as it results in the mapping of a wide range of very high BMI values to similar z-scores [26,27]. Additionally, there is a limit to the maximum z score that can be obtained at any sex or age [26,27].
The current research used three different BMI metrics to allow for comparisons with other studies, as researchers vary with their choice of BMI metric.
A detailed overview of how the anthropometric measures and health indicators were obtained (and defined) at LLLR can be found in the literature [21].
Additional anthropometric measures and health indicators taken were waist circumference, systolic and diastolic hypertension, lipid levels, total cholesterol, high- and low-density lipoprotein, triglycerides, and fasting glucose.
Reference values from the National Cholesterol Education Program’s Pediatric Panel report were used to determine abnormalities for waist circumference, blood pressure, and lipid levels, as articulated in our prior research [21].
Hypertension was indicated by systolic blood pressure (SBP) or diastolic blood pressure (DBP) ≥ the 90th percentile for age, sex, and height. A waist circumference ≥ 90th percentile for age and sex was defined as abnormal.
Abnormal lipid levels were indicated by: total cholesterol ≥ 160 mg/dL; high-density lipoprotein (HDL) levels 40 mg/dL; low-density lipoprotein (LDL) levels 110 mg/dL; and total triglycerides 110 mg/dL for children aged 12 or older or 90th percentile for age and sex. An elevated glucose level of 110 mg/dL was defined as abnormal. The presence of three or more components of the metabolic syndrome indicated an elevated metabolic risk. The components included: an abnormal waist circumference; systolic hypertension or diastolic hypertension; an abnormally low HDL level; abnormal triglycerides; and elevated fasting glucose levels.
All anthropometric measures and health indicators were collected at baseline, and at the medical reassessment follow-up visit after at least 12 consecutive months of program participation.

2.3.5. Measurement of Covariates

The main covariates are age, sex, and race/ethnicity, and they were self-reported at the initial visit.

2.4. Statistical Analysis

Continuous variables are expressed as means and standard deviations, and categorical variables are expressed as frequencies and percentages. Independent samples t-tests were used for comparing continuous variables, and chi-square tests were used to compare differences in the categorical variables.
We also used independent samples t-tests to compare the average times of staying in the improved state for various risk factors, based on contact hour exposure as this information can be informative in chronic disease management.

2.5. Survival Analysis

2.5.1. Bivariate Analysis

The Kaplan-Meir method was used to estimate the survival function for subgroups by select risk factors. The survival curves for the low and high contact hour groups are based on the records of 406 patients as noted earlier. The log-rank test was used to determine if the curves differed significantly.

2.5.2. Multivariate Analysis

To control for the effect of confounders such as age and sex, we used a Cox Proportional Hazards model; the Breslow method was used to estimate the hazard function. Three separate models were created. The risk factor/BMI metric assessed in the first model was BMI%95. The main predictor was contact hours, a dichotomous variable, with low and high contact hours as the two levels. The covariates used were age, a continuous variable, and sex, coded as male or female. The outcome assessed was “time to event.” The second and third models were identical to the first, with the exception of BMIz score and Δ BMI as the BMI metric/risk factors in these models, respectively. For all analyses, a two-sided p-value of <0.05 was considered statistically significant. All analyses were performed using IBM SPSS software version 27.

3. Results

3.1. Description of Sample

Table 1 shows the baseline characteristics of the 406 patients assessed by contact hours exposure. Of these participants, those receiving high contact hours were younger, with a mean age of 10, compared to a mean age of 11 in the group receiving low contact hours. This difference was statistically significant (p < 0.001). Males accounted for 43% of the sample and 57% were females. Data on race and ethnicity were available for 35% of the sample and, of this group, Black participants were overrepresented for both the low contact hour group (76.9%) and high contact hour group (87.9%). The mean BMIz score was 2.43 for the low contact hour group and 2.41 for the high contact hour group. The mean BMI%95 for the high contact hour group was also lower than that of the low contact hour group (146.8 vs. 148.3). Eighty-six percent (n = 350) of the sample had severe obesity, and 13% had obesity (n = 54).

Distribution of Age in the Sample

The age distribution is presented in Table 2. The age of the participants ranged from 2–19 years, and 9-year-olds accounted for the highest prevalence (n = 55; 13.6%). Overall, the majority of the sample was in the 7–12 age range.

3.2. Bivariate Analyses

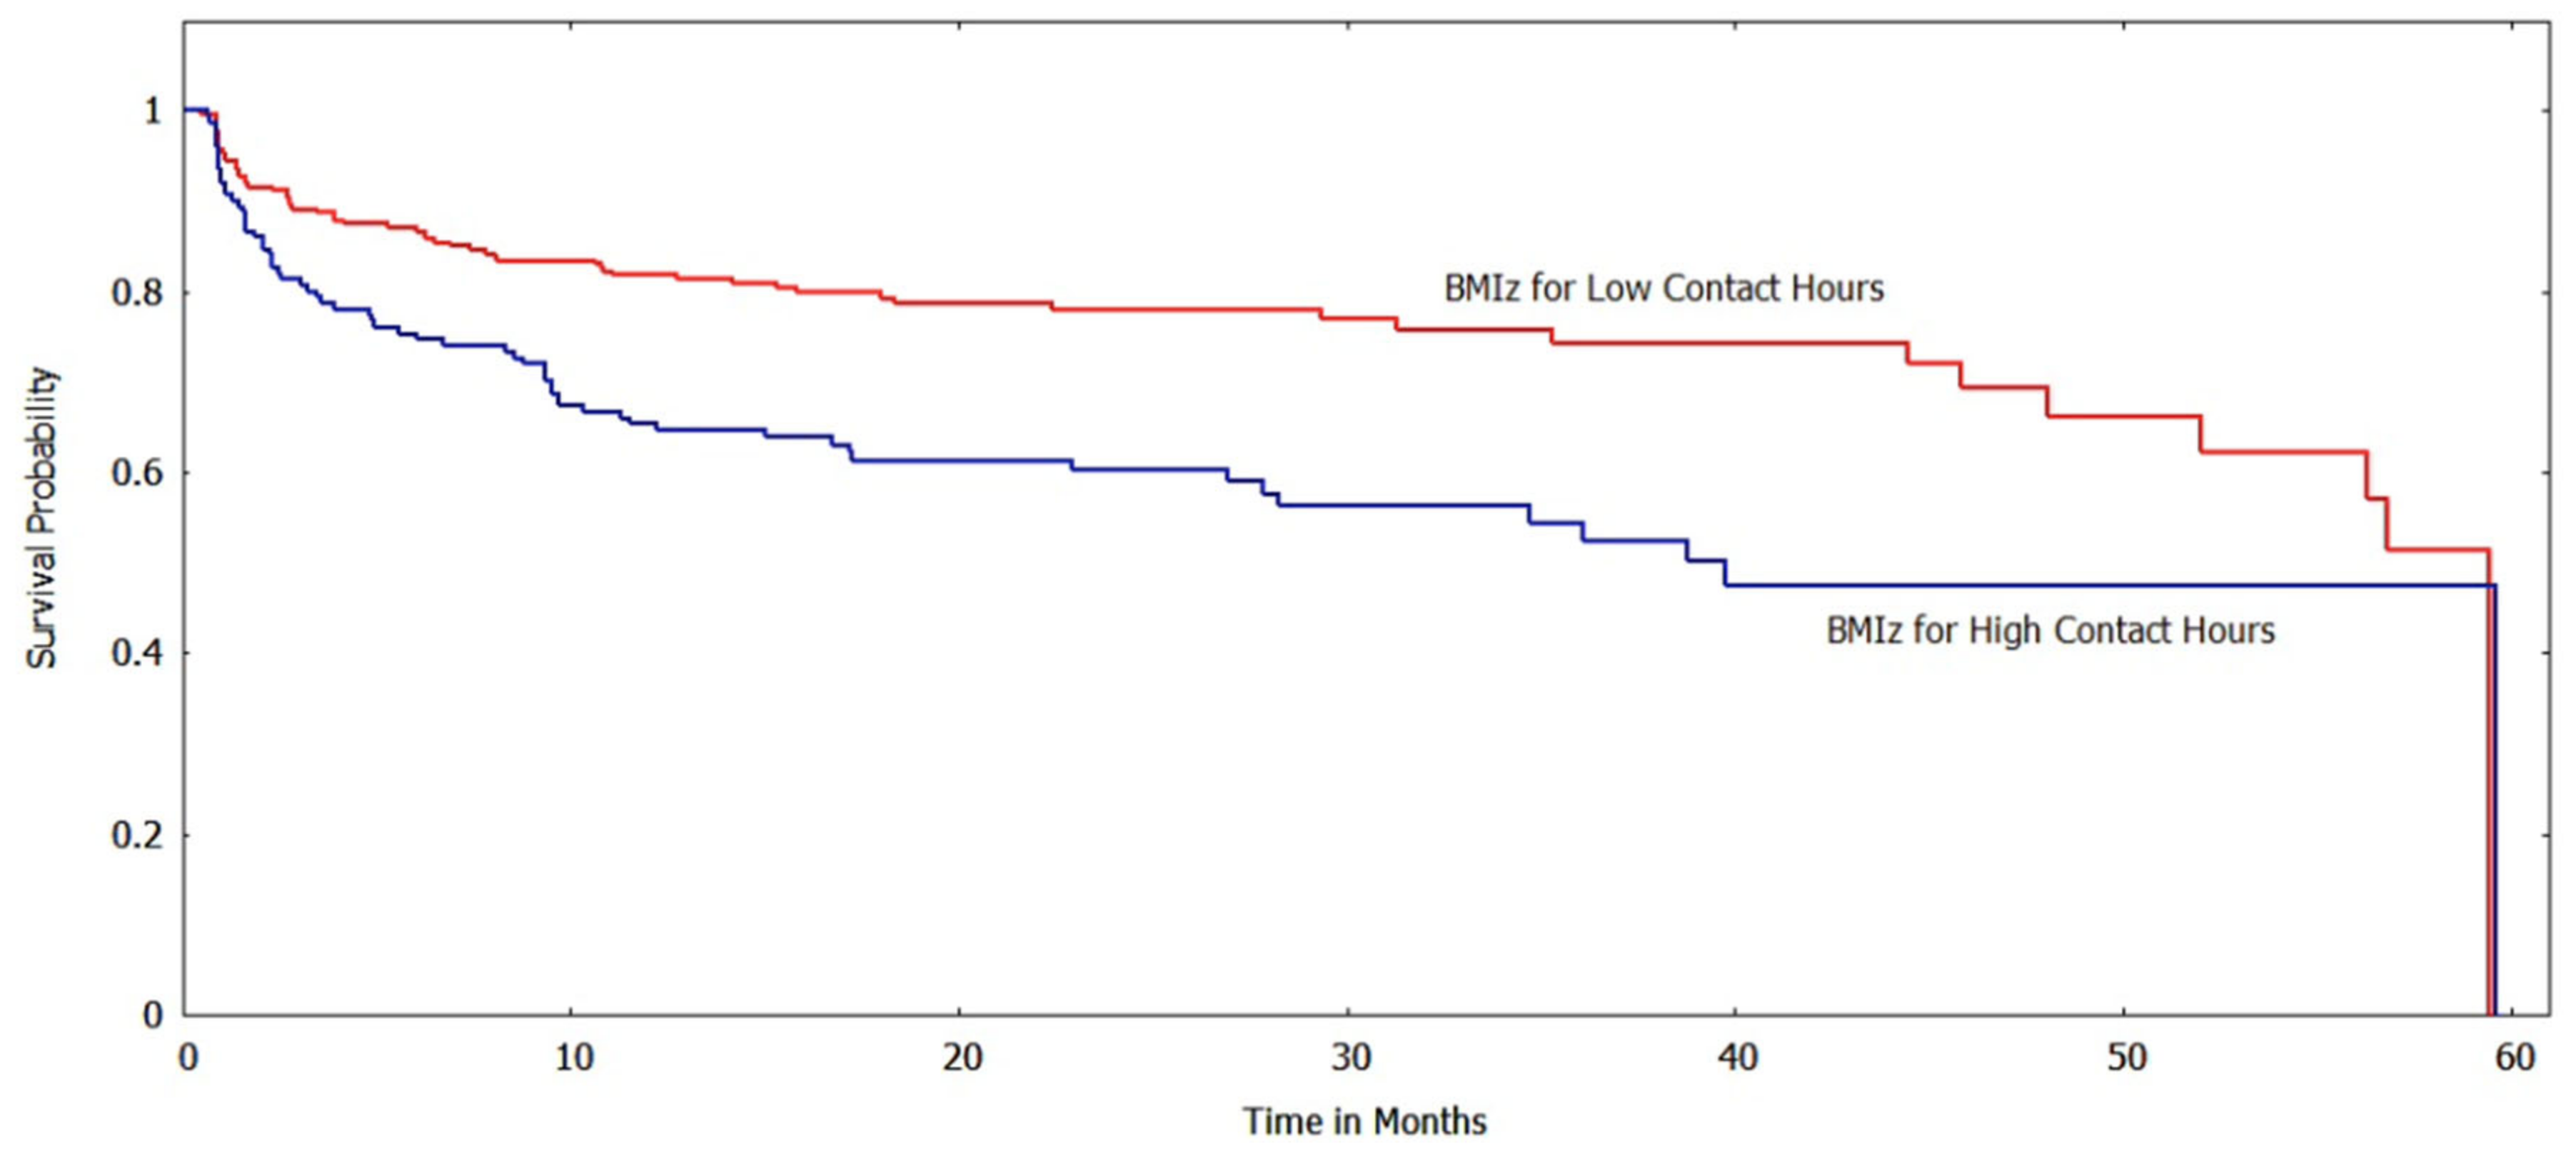
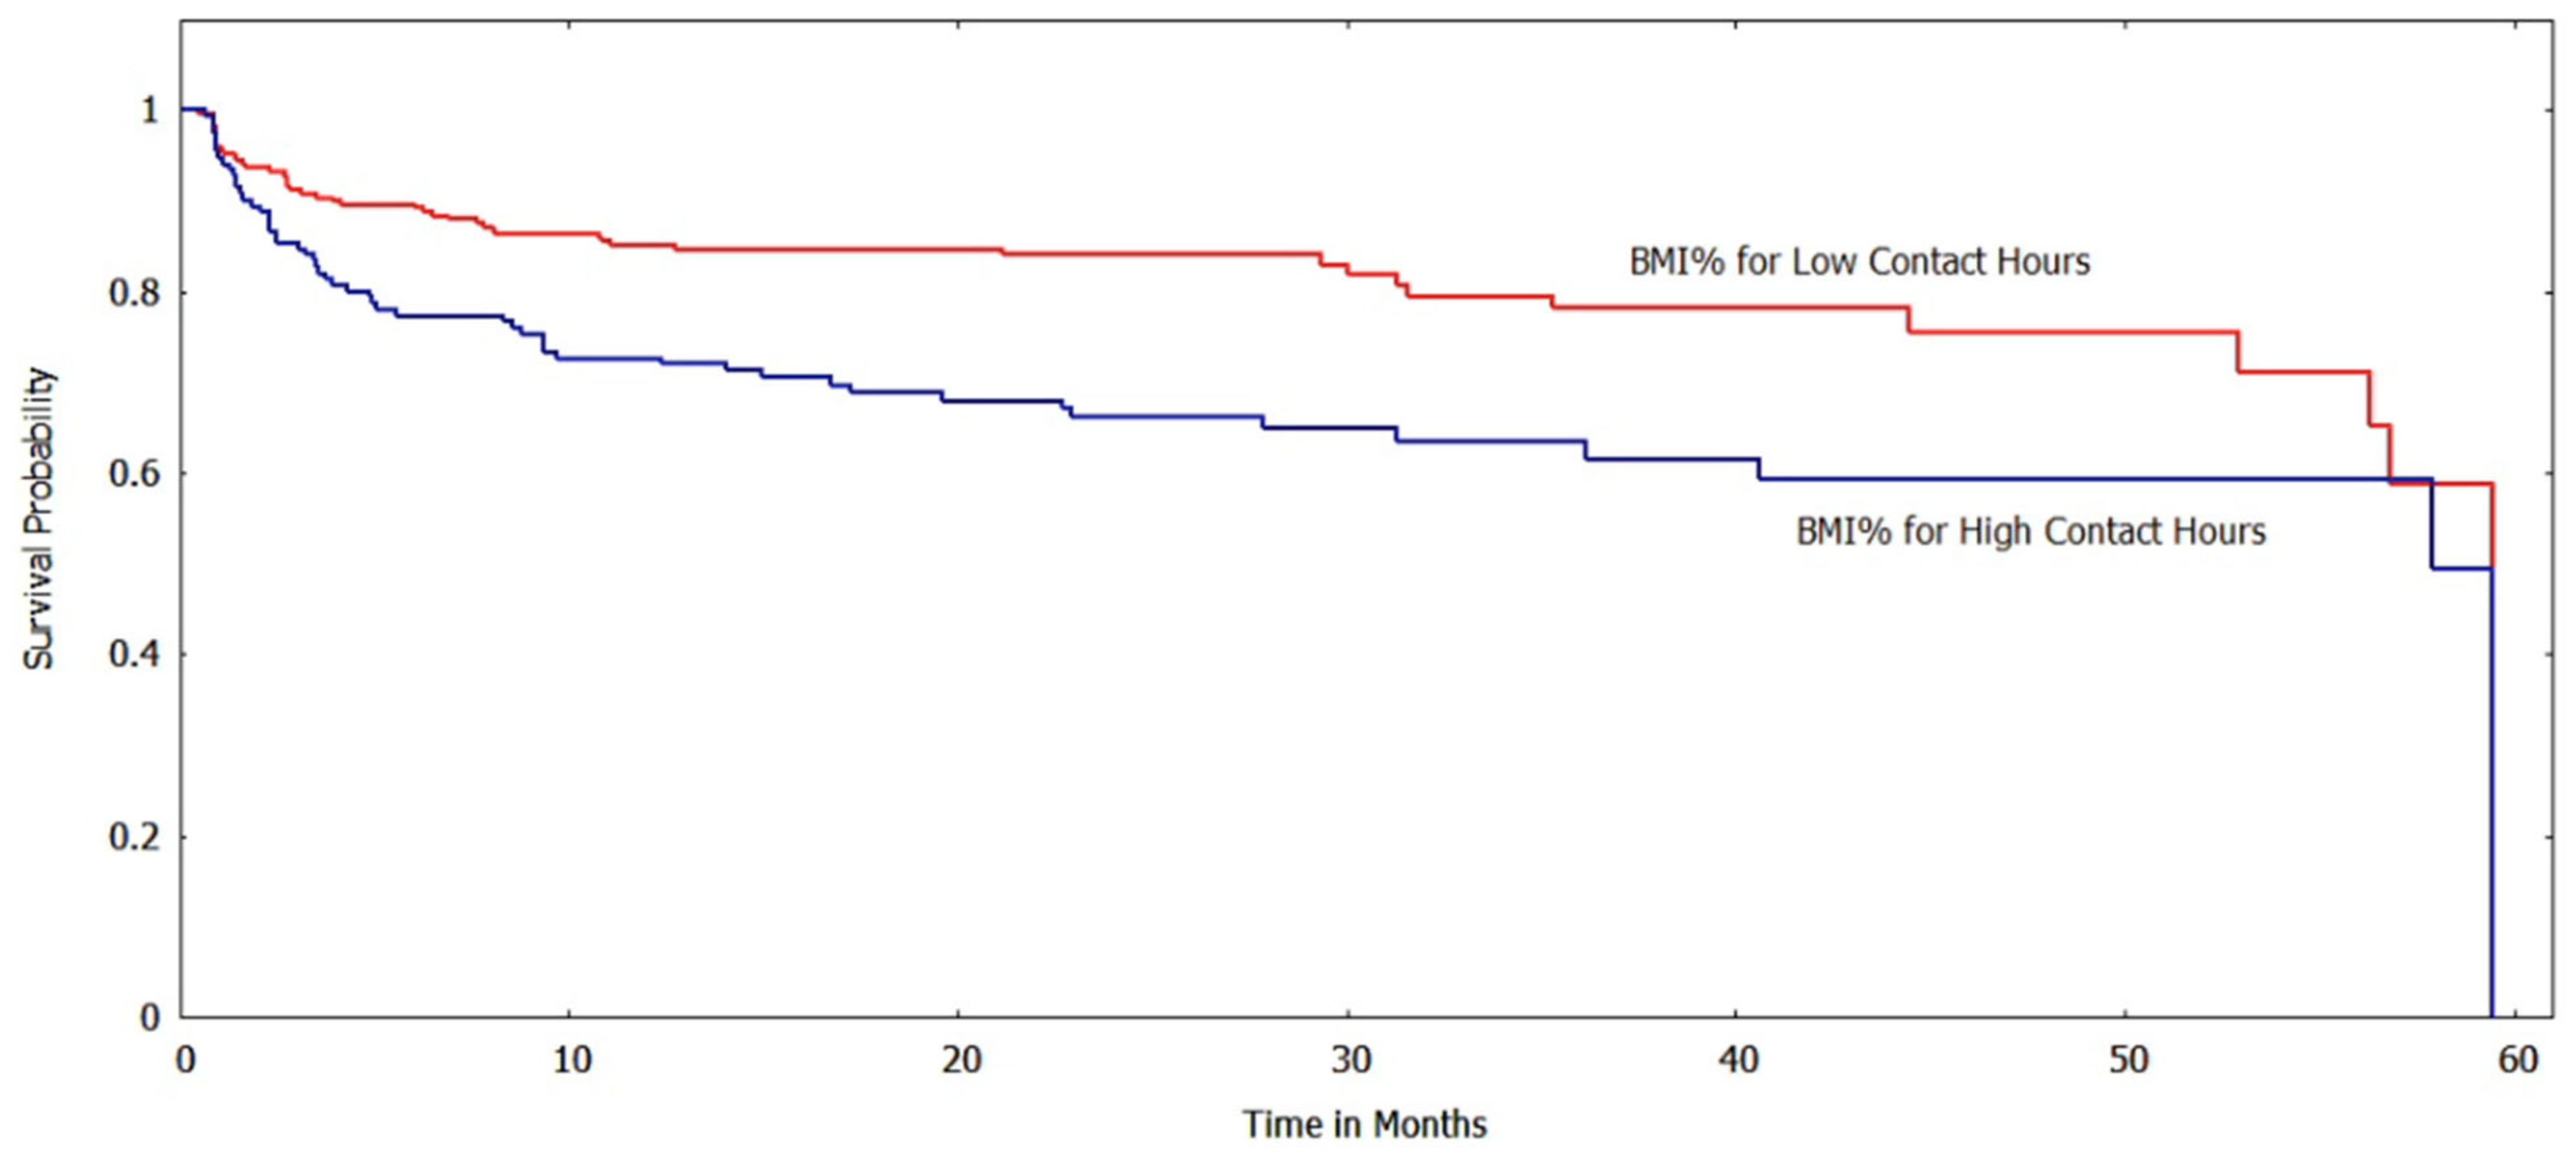
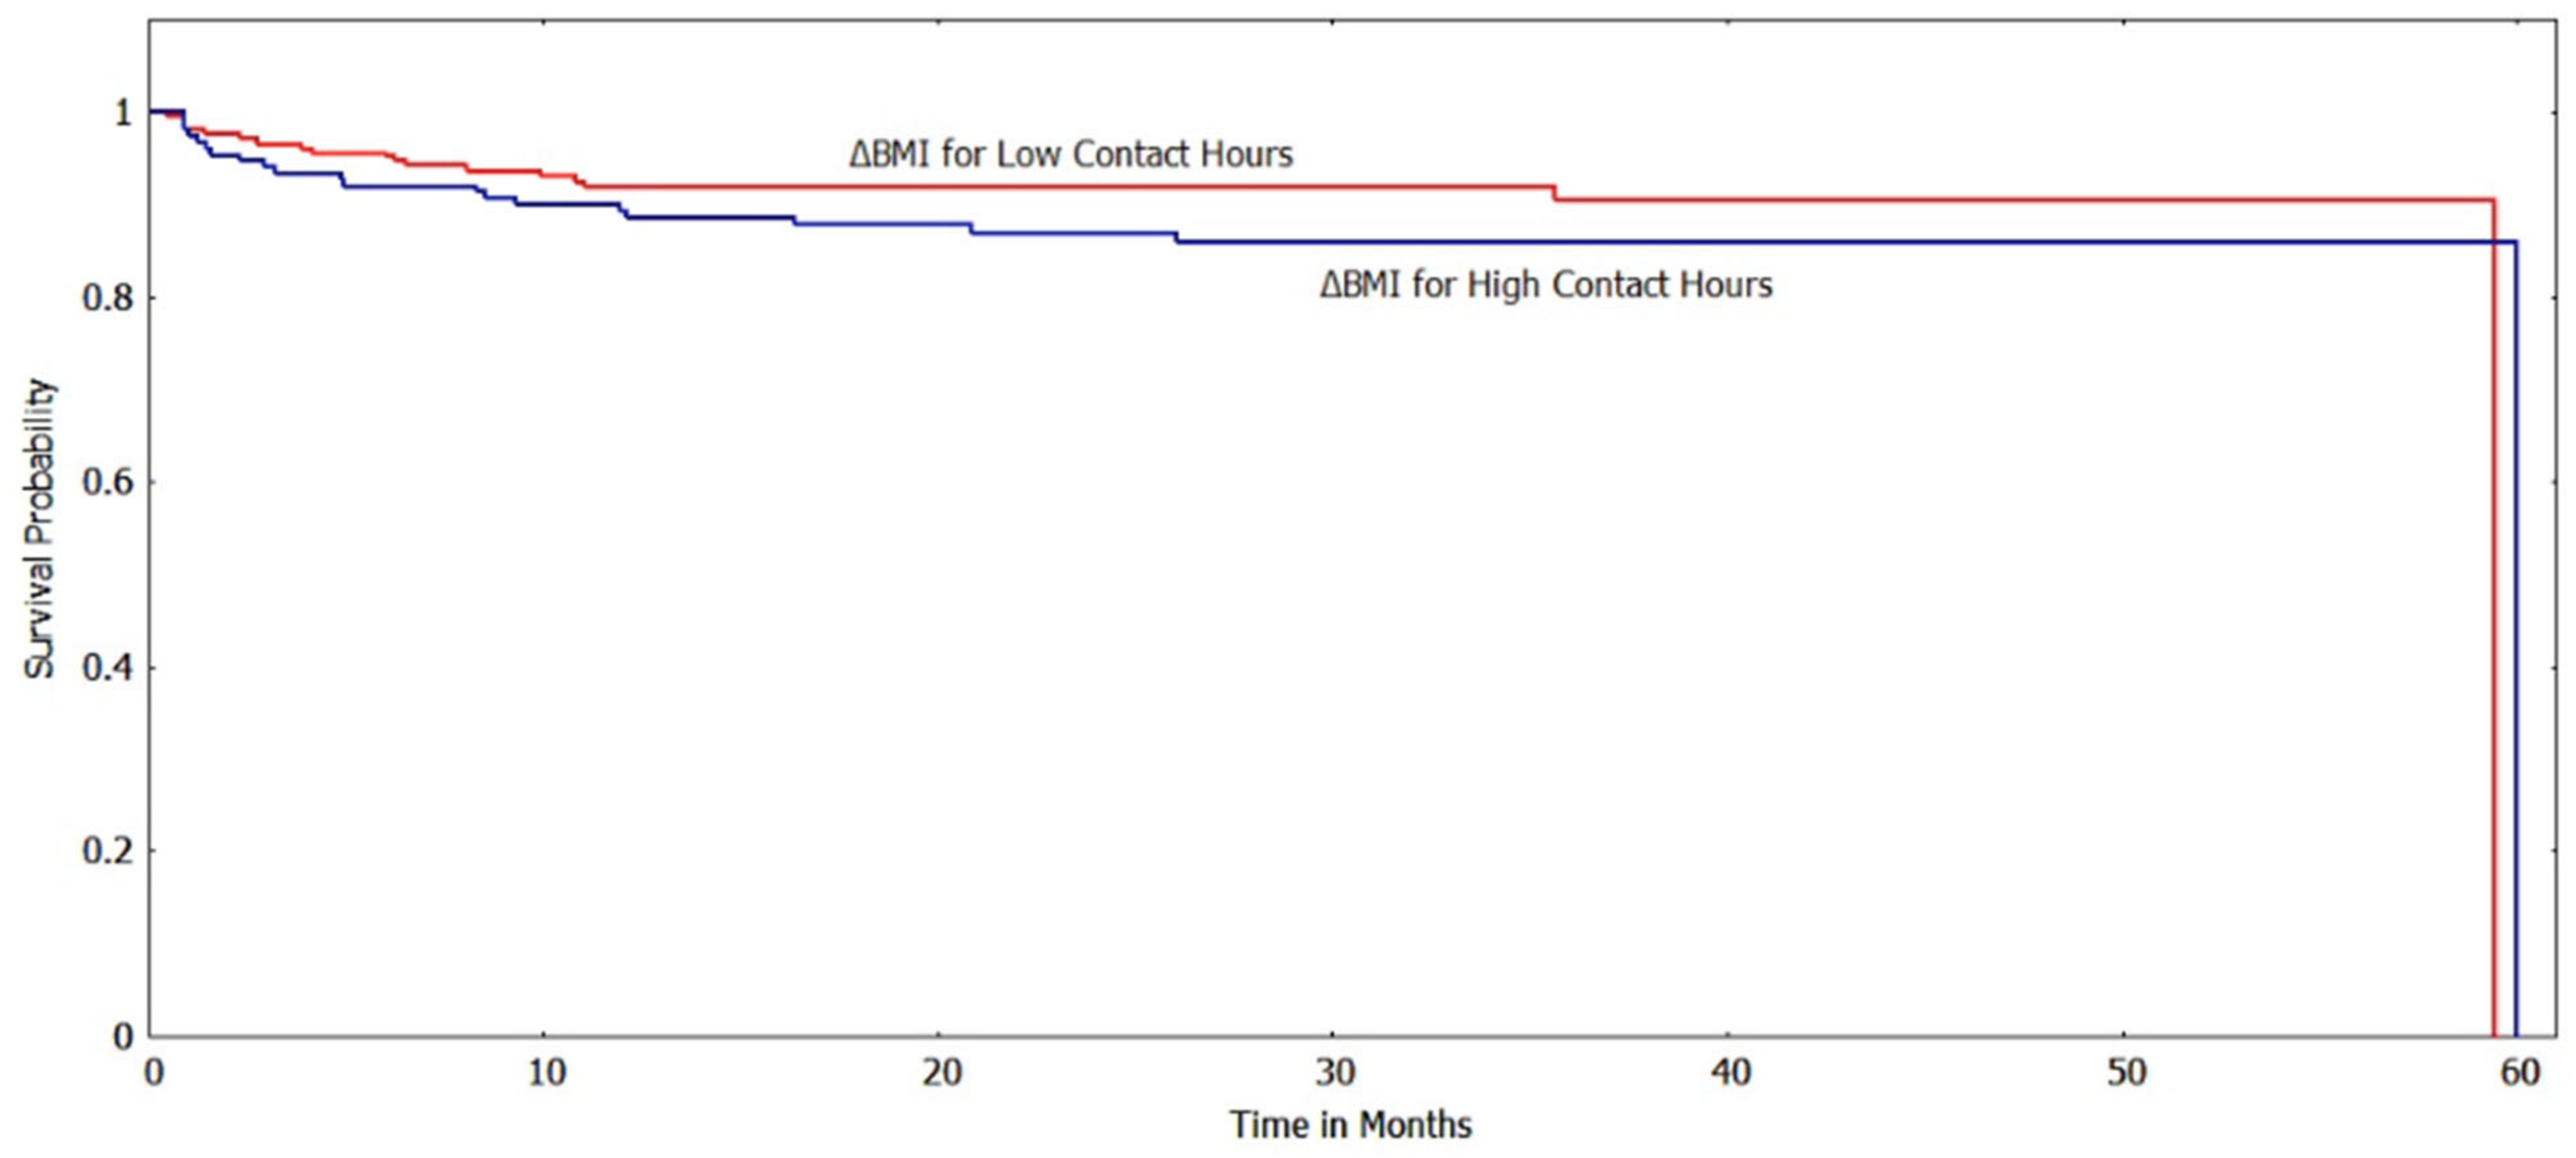
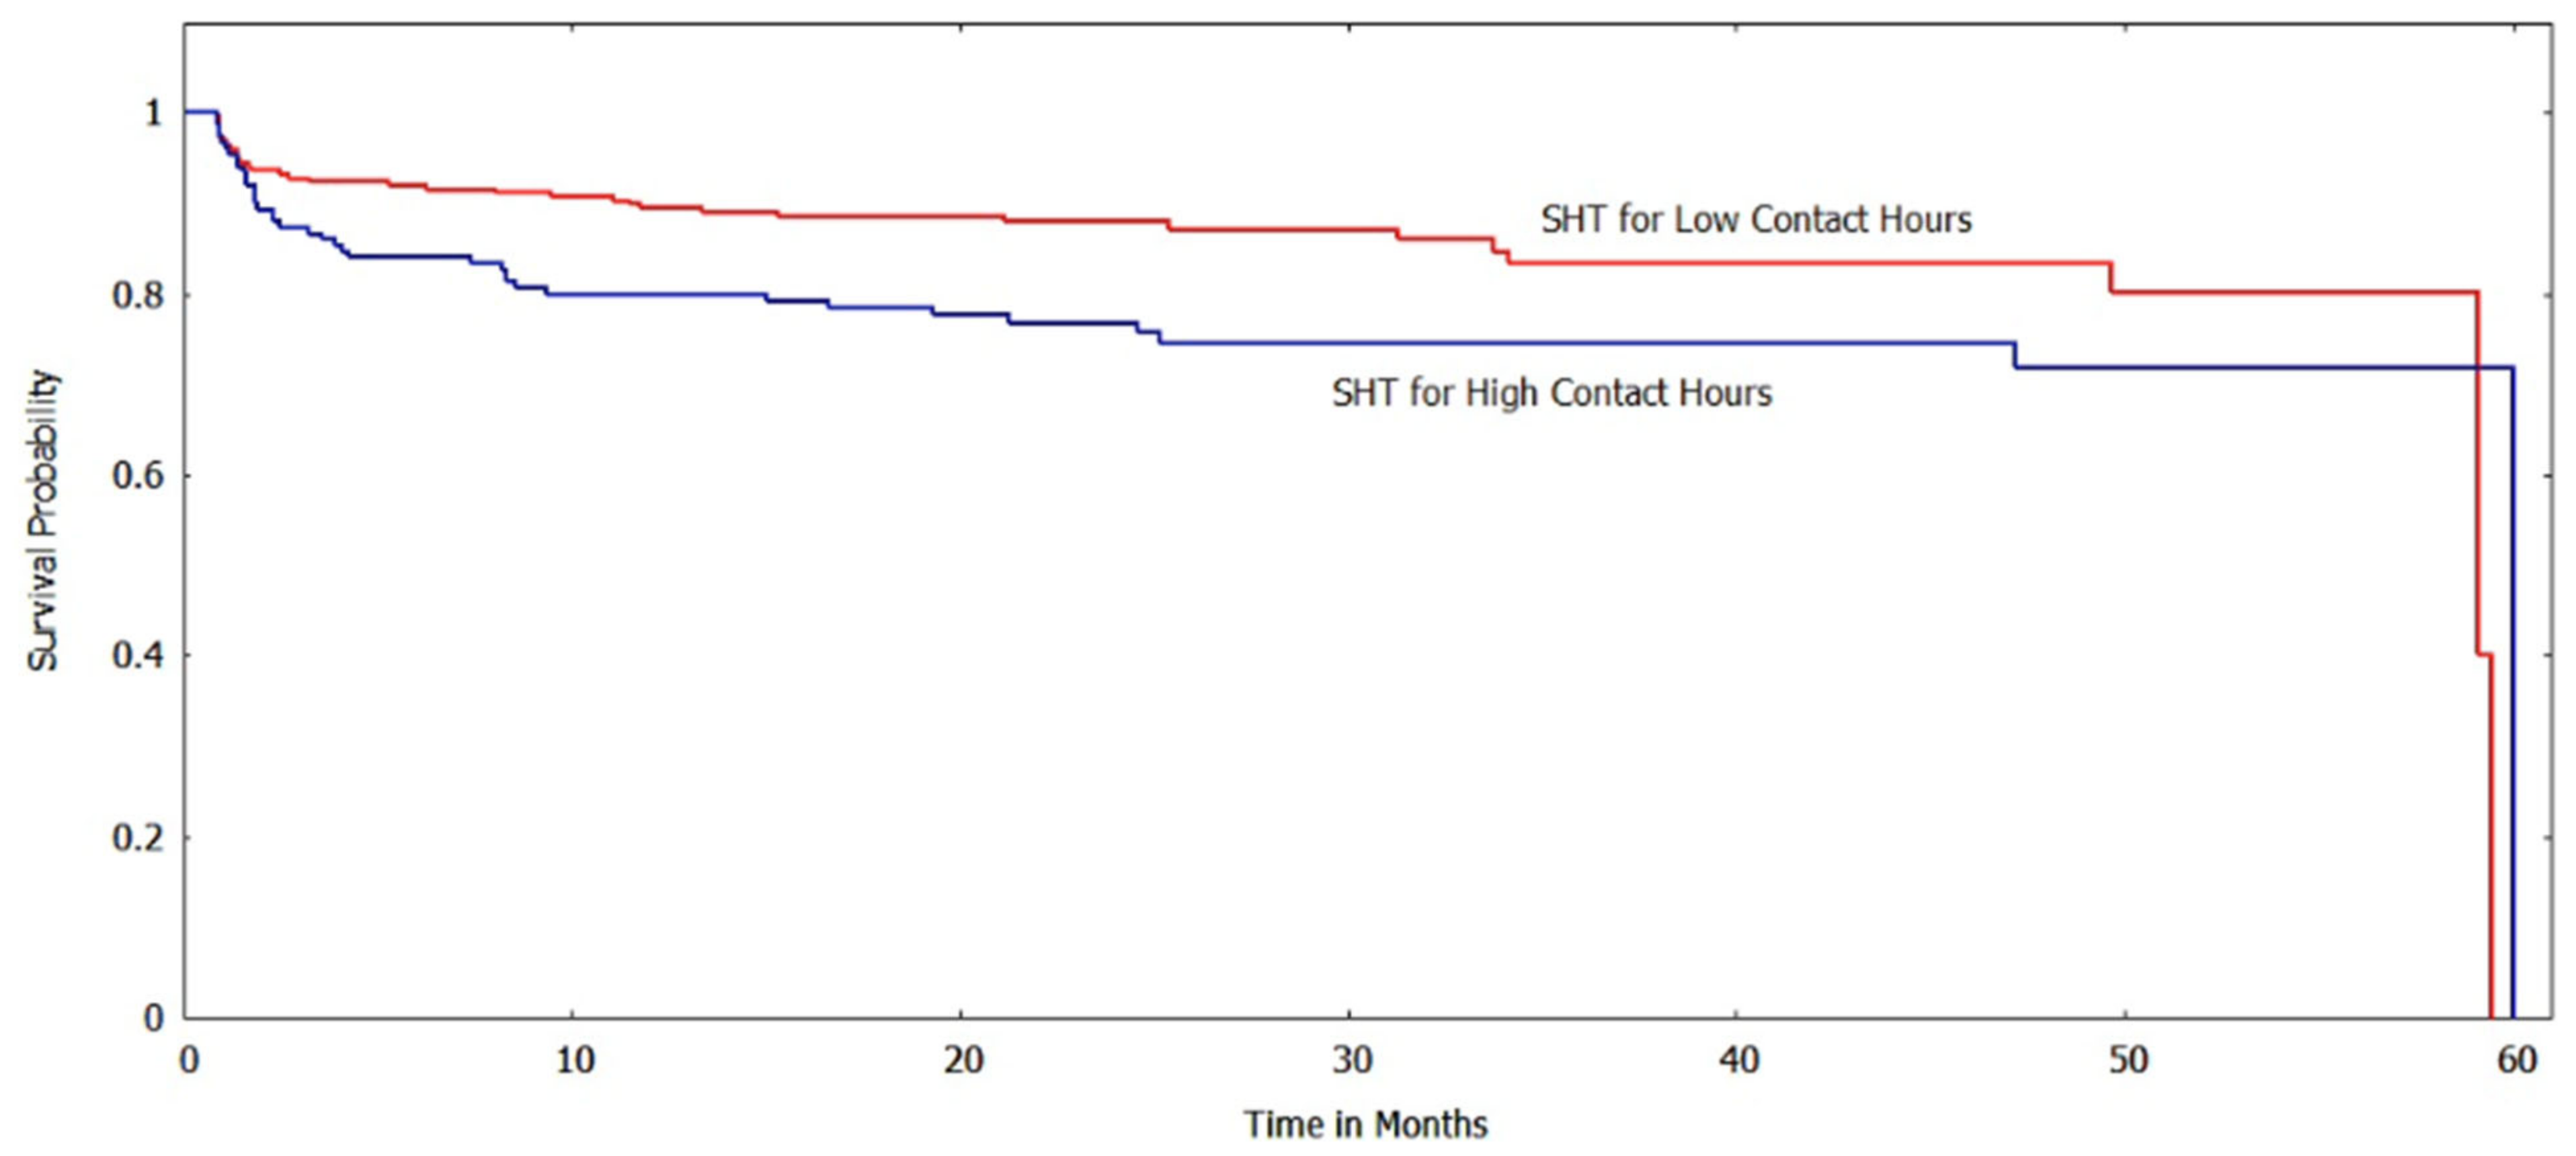
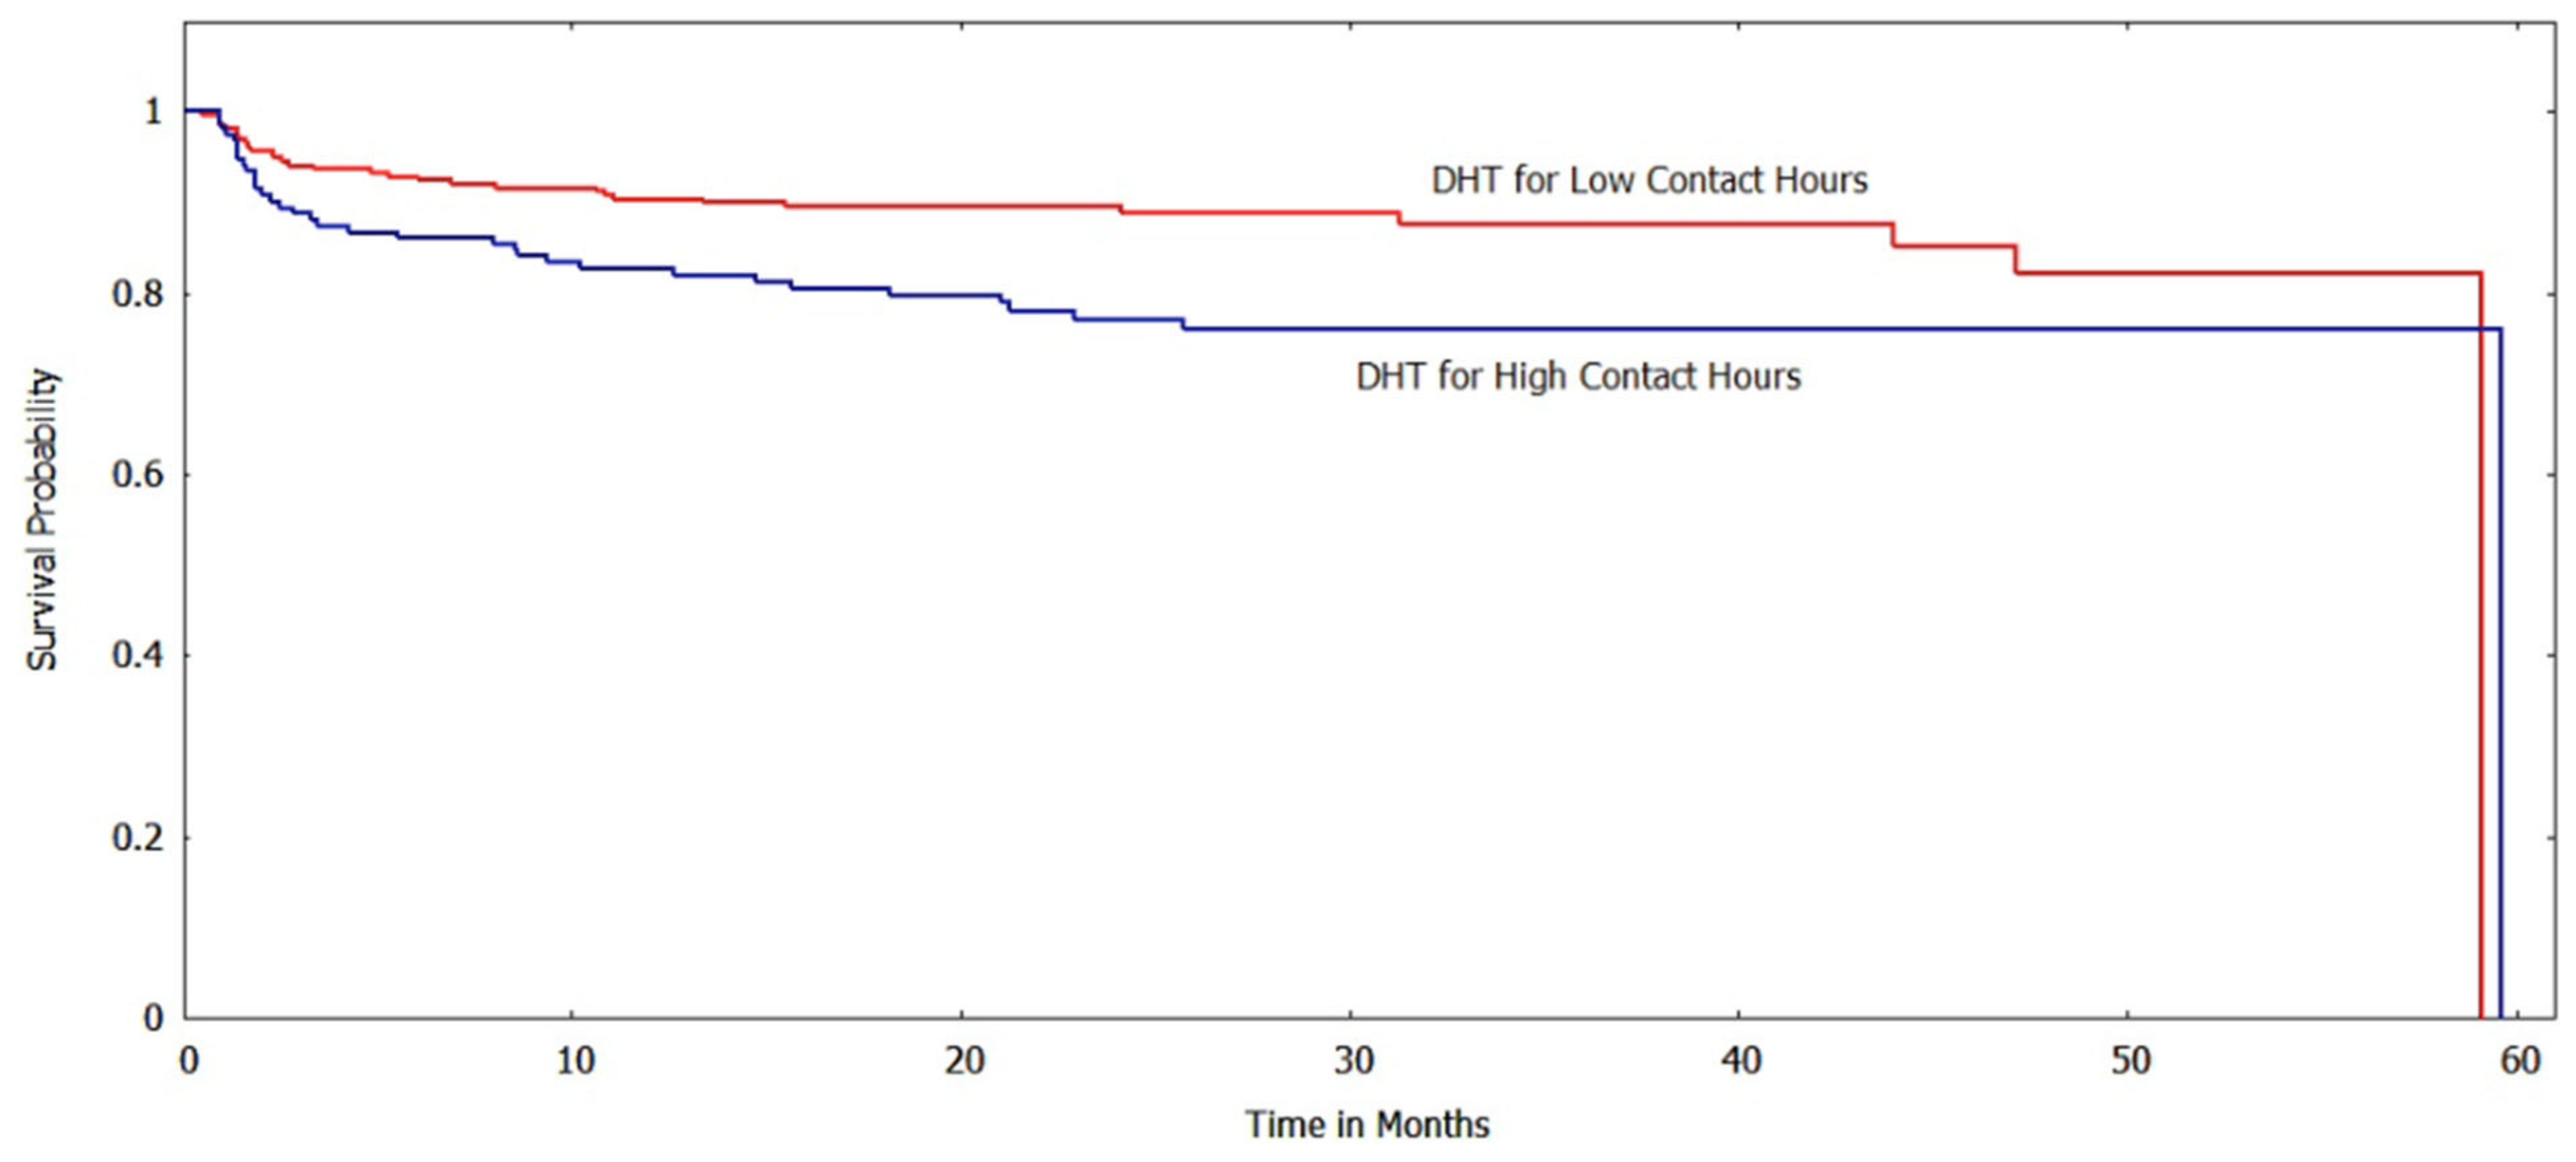
3.2.1. Kaplan-Meir Analyses

The Kaplan-Meir method was used to estimate the survival function of the subgroups based on various risk factors/indicator endpoints. Figure 2 and Figure 3 show the survival curves of the low and high contact hour groups with improvements in BMIz and BMI%95, respectively, as the outcome indicator. For both BMI metrics, the survival function indicates that the low contact hour group had greater survival probabilities (longer times to reach the event endpoint) than the high contact hour group, and a log-rank test found that the survival curves were significantly different (p < 0.001). When Δ BMI was used as a risk factor, unlike with the other BMI metrics, the survival curves of the low and high contact groups were not significantly different (p > 0.05) (Figure 4).
Our study also used survival analysis to examine the association between contact hours and various cardiovascular and metabolic risk factors at the bivariate level. Using improvements in systolic hypertension for 12 consecutive months as an event endpoint, we found that the high contact hour group had lower survival probabilities than the low contact hour group. The survival curves were significantly different (p < 0.05). The survival function for diastolic hypertension based on the contact hour group also showed that the survival probabilities for the high contact hour group were lower, and a log-rank test found that the curves differed significantly (p < 0.01). (Figure 5 and Figure 6).
Figure 7 shows the distribution of censoring times of the patients on the last visit before the end of the study at 60 months (for BMI%95 risk factor) based on contact hour grouping. Overall, we see a greater number of censorings for children with low contact hours (201 patients) vs. high contact hours (96 patients).

3.2.2. Mean Time Spent in the Improved State

We compared the mean time participants spent in the improved state (below the baseline for 12 months) for the subgroups by select risk factors. For all BMI risk factors studied, the low contact hour group spent a shorter time in the improved state. With BMIz as a risk factor, the low contact hour group spent a mean time of 26.2 months, while the high contact hour group had a mean time of 34.8 months. This difference was statistically significant (p < 0.01) (Table 3).

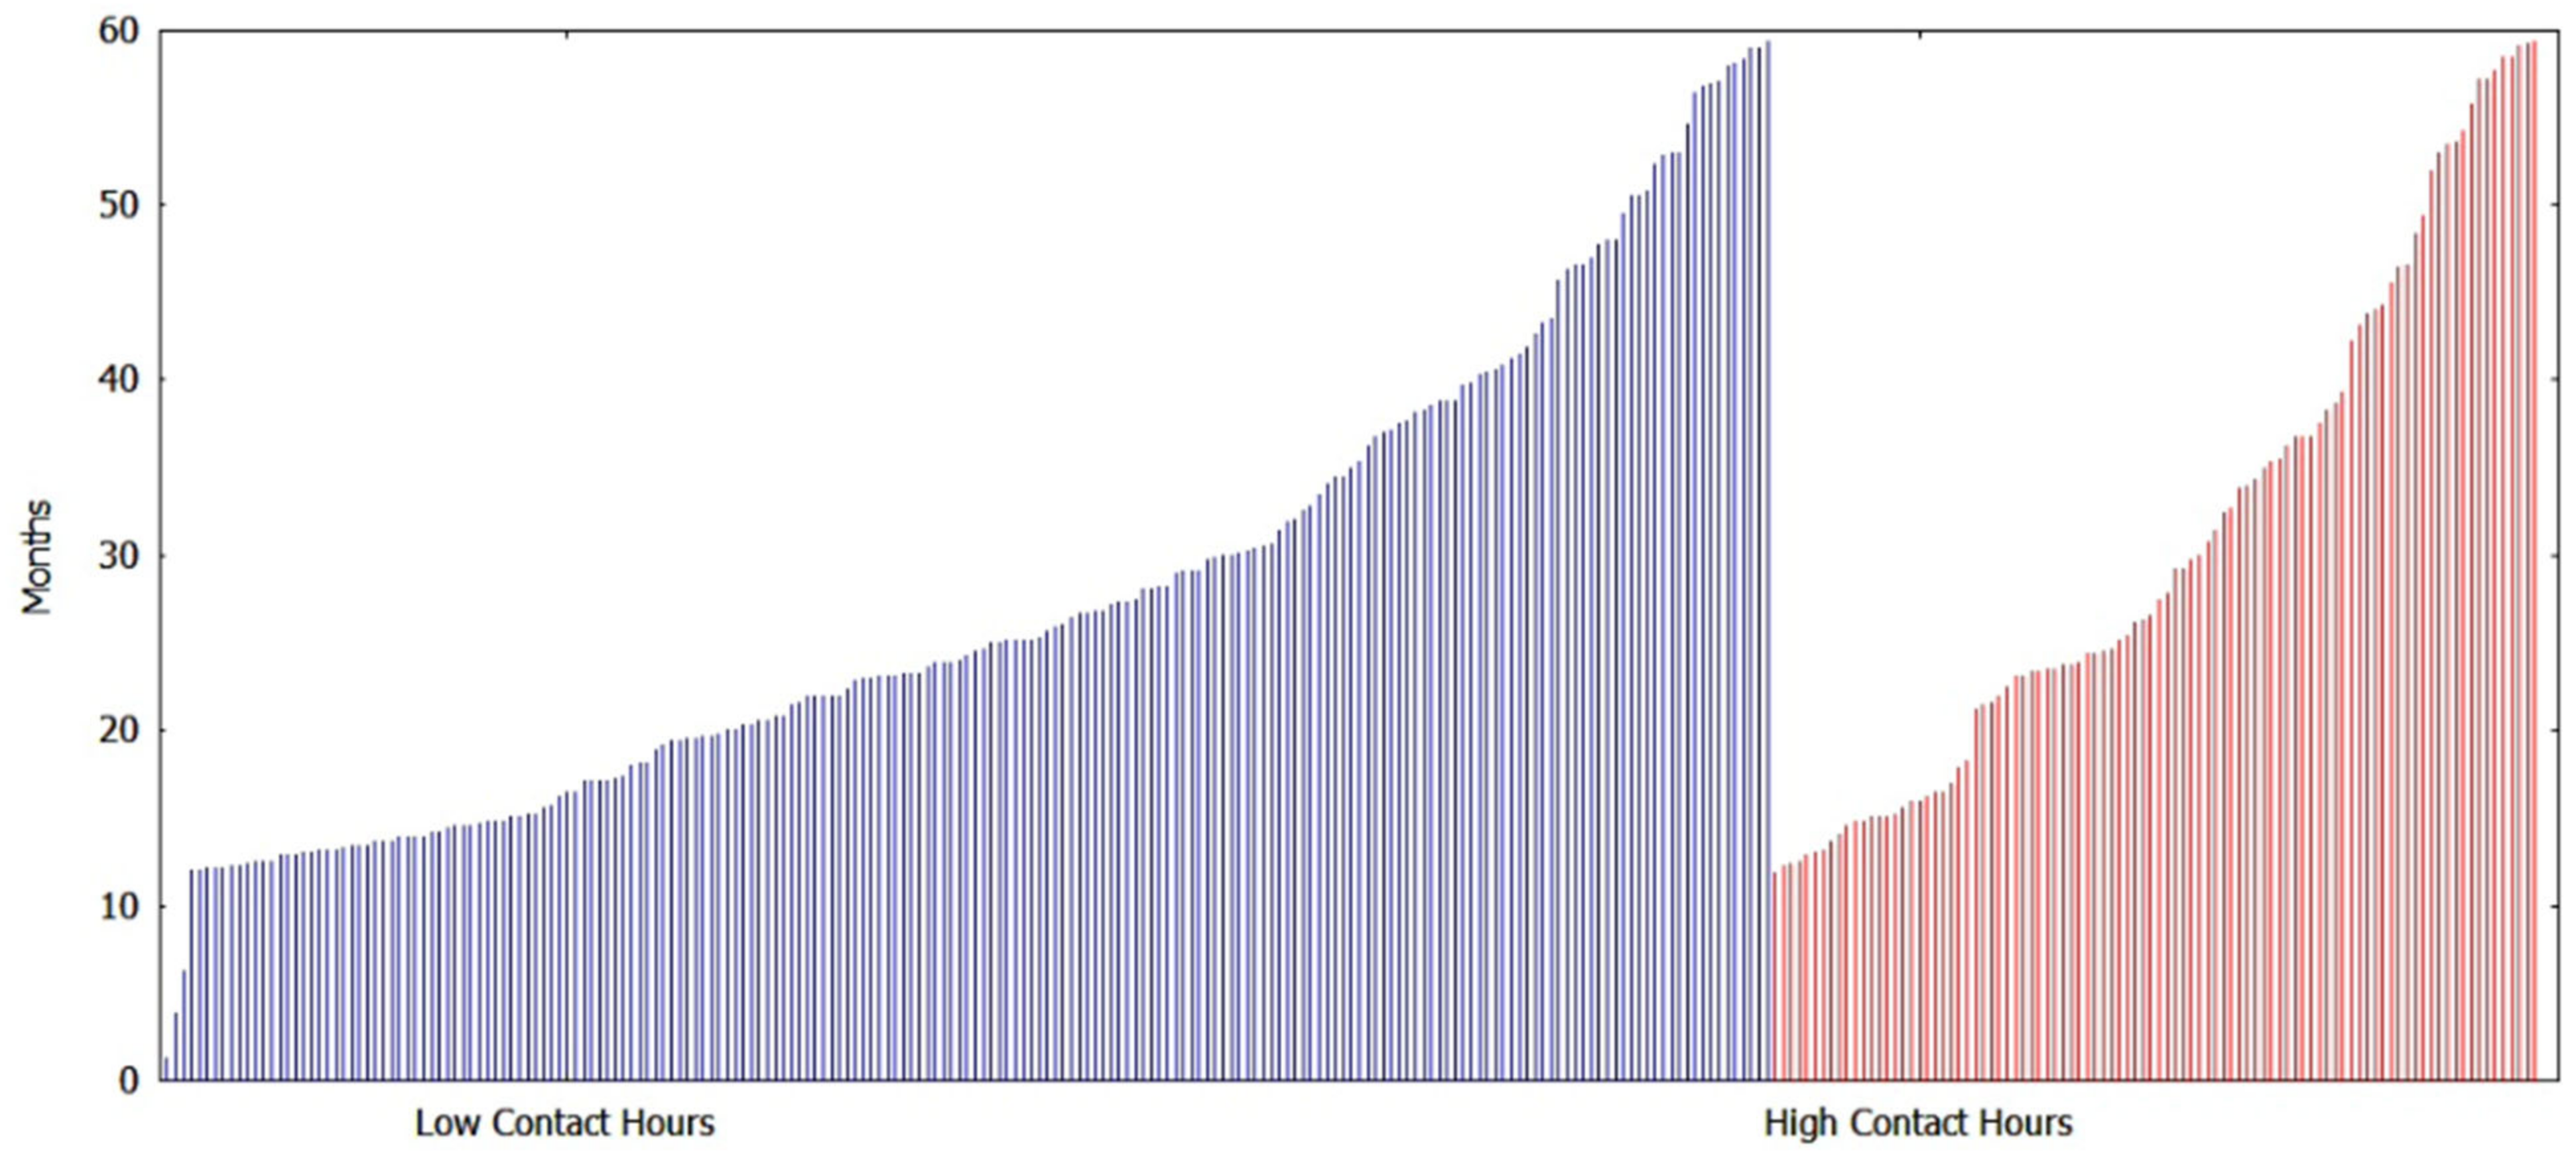
3.2.3. Mean Times Getting to the Event

We also noted the mean times participants took to reach the event. For both BMIz and BMI%95, the high contact hour group took on average shorter times (8.45 vs. 11.2 months, and 8.88 vs. 11.2 months, for BMIz and BMI%95, respectively) (Table 4).

3.2.4. Multivariable Analyses

Cox PH regression was used to evaluate the independent effect of contact hours on the event endpoint (improvement in BMI for 12 consecutive months). We controlled for age as participants in the high contact hour group were significantly younger than those in the low contact hour group (Table 1). We also controlled for sex as prior studies have shown differences in obesity outcomes in children and adolescents based on sex [28,29].
Table 5 shows the models for BMI%95, BMIz score, and Δ BMI. In all three BMI risk factor models, contact hours were independently associated with an increased hazard of improving BMI score for 12 consecutive months. The first model indicates that, when controlling for age and sex, participants exposed to high contact hours had over two times the “hazard” of achieving an improvement in BMI%95 score, compared to low contact hours participants (HR = 2.11, 95%CI (1.41–3.17), p < 0.001). According to this model, age was also an independent predictor of the event endpoint. Each additional year was associated with a 7% increase in the hazard of improving one’s BMI%95 score (HR = 1.07, 95%CI (1.001–1.13, p = 0.047).
While holding age and sex constant, there was an 81% increase in the hazard of improvement of BMIz score for those in the high contact hour group, compared to participants in the low contact hour group (HR: 1.81, 95%CI (1.27–2.58), p = 0.001). The impact of age was reversed for BMIz. A one-year increase in age was associated with a 7% decrease in the hazard of improvement (HR: 0.929, 95%CI (0.875–0.987), p = 0.017) while holding sex and contact hours constant.
In the final model with Δ BMI as the outcome indicator, adjusting for sex and age, there was nearly a 2-fold increase in the hazard of improvement for high contact hour participants compared to those in the low contact hour group (HR: 1.92, 95%CI (1.03–3.60), p = 0.042). Sex was not a significant predictor of the event endpoint in any of the models.

4. Discussion

There is a paucity in the literature on long-term outcomes in childhood obesity in underserved patient populations Optimal strategies for evaluating long-term obesity interventions, as in the current study, have not been well-studied. To our knowledge, no published study has used the method of survival analysis to evaluate a long-term pediatric obesity intervention program. This statistical technique allowed us to model the hazard of improvement in BMI metrics at any given point. The survival analysis model incorporated data from subjects who experienced and did not experience the “event” (censored data) [22,23], and a key feature was that patients were able to enter at different times and followed through the end of the study.
Our study unfolded that contact hours were independently associated with the hazard of improving all three BMI metrics: BMI%95, BMIz, and Δ BMI. Of note, researchers have cautioned against the use of BMIz scores as a metric for children with severe obesity [27,30,31]. Freedman et al. explained that different BMI values can map to the same z-score, which varies by sex and age. They further noted that BMIz has weaker correlations to circumferences, skin fold, and fat mass, compared to BMI%95 or Δ BMI, in children with severe obesity [27].
In terms of the strength of the correlations of the various BMI measures, in the above study where Freedman et al. compared the relations of BMIz and other BMI metrics to circumferences, skinfolds, and fat mass, the researchers found that BMI%95 was strongly correlated with modified BMIz (r = 0.93) and Δ BMI (r = 0.98) [27]. On the other hand, weaker correlations were found for BMIz with BMI%95 (r = 0.81) and Δ BMI (r = 0.87).
However, the current study used BMIz scores as an indicator to evaluate to what extent the findings would deviate from those with BMI%95. Our results indicate that BMIz scores may still be informative, and their use should be examined within the context of the specific study and the variables measured.
Age was also an independent predictor of the hazard of improvement of BMI%95 and BMIz. Our findings suggest that without the influence of contact hours, older participants are more likely to see improvements in BMI%95. We saw a reversal in the impact of the direction of age when BMIz was used as the risk factor, indicating that younger children may have more success in improving their BMIz scores.
Other researchers have investigated the effect of age in obesity intervention programs. Studies suggest that obesity behavioral treatment, applied in childhood, may be more successful than if introduced during adolescence [32,33]. Singer et al. analyzed the outcome of a 1-year lifestyle intervention program in 1291 children at the end of the intervention, and a year later, and have held that children with extreme obesity respond better to lifestyle interventions than extremely overweight adolescents [33]. These researchers found that children with extreme obesity 10 years showed a significantly greater reduction in BMIz score (−0.24 ± 0.38), compared to extremely overweight adolescents (−0.16 ± 0.38), p = 0.021. Our findings suggest a parallel direction of the effect of age on the improvement of BMIz scores.
One possible explanation for these findings is the role of parental involvement. Researchers explain that lifestyle interventions involving parents (typical with younger children) are more effective than interventions with limited parental involvement [33]. The implications of these findings could be applied to pediatric obesity programs in central Brooklyn, New York. Effectively addressing severe obesity in central Brooklyn may necessitate a robust early intervention, while actively incorporating parental involvement. Furthermore, a recent study has found that positive parental perceptions of weight were associated with improved compliance in the LLLR program [34]. These findings reiterate that parental involvement is a core component of pediatric lifestyle modification programs, which is an integral part of program success.
Some scholars have recommended the use of Δ BMI in lieu of BMIz when studying severe childhood obesity. We found that like BMI%95 and BMIz, high contact hours were independently associated with the hazard of improvement of Δ BMI. However, age was not statistically significant when Δ BMI was used as a risk factor. These results suggest that flexibility may be required when determining what BMI metric is optimal for assessing severe obesity, as they can yield different results, in light of the particular study and the variables measured.
When we examined the average durations participants spent in the improved state, at the bivariate level, we found that the low contact hour group spent on average shorter times, compared to the high contact hour group. This finding is informative as it suggests that exposure to high contact hours is not only associated with a quicker attainment of the event endpoint, but also with the possible longevity and maintenance of that improved state.
This research has also unfolded that exposure to high contact hours was significantly associated with lower survival probabilities (shorter survival times) when improvements in systolic and diastolic hypertension were used as event endpoints. As shown in Table 1, patients presenting at LLLR have a range of abnormal cardiovascular and metabolic risk factors. Thus, the LLLR intervention model may be vital in addressing factors beyond BMI metrics.
A core strength of using survival analysis for this study is that it requires a shorter follow-up time to construct a robust sample for an evaluation analysis. Our previous evaluation study required a 14-year time frame (2002–2016) to construct a retrospective pre-post evaluation of 144 children [21]. In this current study, we are able to draw on more recent data in a shorter time span (2010–2016). As discussed earlier, we consider both loss-to-follow-up and end-of-study censoring. An important consideration is that even with considerable loss-to-follow-up censoring, the inclusion of the event times of the loss-to-follow-up subjects allowed enough study power to detect a significant positive association between greater contact hours and shorter times to event. In our previous study, we did not find a significant association between contact hours and metabolic outcomes [21].
Our findings on the efficacy of contact hours are consistent with that in the current literature. In the US Preventive Task Force’s review of 42 trials with 6956 participants, they found that comprehensive intensive behavioral interventions with 26 contact hours over a period of 2–12 months were associated with weight change. That review also found that 52 contact hours resulted in greater weight loss and improvements in cardiovascular and metabolic risk factors [35].
We have presented the outcome of the evaluation of an obesity intervention program in a hard-to-reach and low-adherent patient population in central Brooklyn, New York. Scholars have emphasized that obesity presents a complex problem, involving the broader social, physical, economic, and policy context [36]. Thus, to effectively address the obesity epidemic, resources and efforts should be geared towards these underserved areas to encourage patient compliance and substantial participation in disease management intervention programs.

Limitations

This study is subject to several limitations. Most of the patients seen at LLLR are African American (85%) and Latino (14%), so these results may not be generalizable to all populations. However, these findings may be applied to youths with similar demographics in urban settings. Although age was statistically significant in the multivariate models, our findings on its effect should be interpreted in light of the low increased/reduced hazard of improving BMI metrics. Another limitation is that the study design does not account for recidivism. Further research should determine the relapse (if any) of study participants involved in similar disease management programs. This study is further limited by potential bias from confounding factors that were not controlled for (i.e., change in diet, self-efficacy, or increased physical activity at home or school). Future studies should incorporate this data in their assessment of an obesity management program. Additionally, future research should consider deconstructing obesity intervention programs to better understand the elements that drive program success or failure [37]. Despite these limitations, a major strength of this research is that it was a 5-year longitudinal study that utilized long-term data which is useful in evaluating the efficacy of an obesity treatment program. We assessed the three main BMI metrics in the current study for comparison. Our findings are informative for future research in that results may vary based on the variable measured, which must be considered when determining the optimal choice of BMI metric. Another strength of this study is that it provides vital data on real-world childhood obesity intervention in one of the most underserved locales in New York City, central Brooklyn. Childhood obesity research in these communities is lacking, and this study helps to grow the limited available literature.

5. Conclusions

This research has shown that for all measures of BMI: BMI%95, BMIz, or Δ BMI, contact hours have remained statistically significant in predicting the hazard of improvement. Exposure to high contact hours may also predict maintenance of the improved state (for BMIz), as well as improvement in systolic and diastolic hypertension. Given the immense burden of severe obesity, the AHA has called for novel treatment strategies for changing the health trajectories of youth with severe obesity [5]. Our findings indicate that chronic disease management such as childhood obesity may require a robust treatment model, similar to that employed at LLLR, which provides a structured treatment program that incorporates clinical care and lifestyle interventions while leveraging community resources. Furthermore, patients’ ongoing and substantial participation in a childhood obesity program is critical to their success. Significantly, targeted resources should be allocated to underserved communities like central Brooklyn to address childhood obesity and other health disparities.

Author Contributions

Conceptualization, A.A. and S.D.; Methodology, A.A. and S.D.; Software, A.J.; Validation, A.J. and S.D.; Formal Analysis, A.J. and A.A.; Investigation, A.J., A.A., N.B. and S.D.; Resources, S.D.; Data Curation, A.J., A.A. and S.D.; Writing—Original Draft Preparation, A.J., A.A., N.B. and S.D.; Writing—Review & Editing, A.J., A.A., N.B. and S.D.; Visualization, A.J.; Supervision, S.D.; Project Administration, A.A. and S.D.; Funding and Acquisition, N/A. All authors have read and agreed to the published version of the manuscript.

Funding

This research received no external funding.

Institutional Review Board Statement

The study was conducted in accordance with the Declaration of Helsinki and approved by the Institutional Review Board at SUNY DOWNSTATE HEALTH SCIENCES UNIVERSITY (protocol code 1697776-1, 13 January 2021).

Informed Consent Statement

Patient consent was waived as this study was approved as secondary research using de-identified data.

Data Availability Statement

Data is unavailable. Confidential clinical data were used for this study.

Conflicts of Interest

The authors declare no conflict of interest.

References

  1. Fryar, C.D.; Carroll, M.D.; Afful, J. Prevalence of Overweight, Obesity, and Severe Obesity among Children and Adolescents Aged 2–19 Years: United States, 1963–1965 through 2017–2018. NCHS Health E-Stats. 2020. Available online: https://www.cdc.gov/nchs/data/hestat/obesity-child-17-18/overweight-obesity-child-H.pdf (accessed on 14 March 2021).
  2. Day, S.E.; Konty, K.J.; Leventer-Roberts, M.; Nonas, C.; Harris, T.G. Severe Obesity Among Children in New York City Public Elementary and Middle Schools, School Years 2006–07 Through 2010–11. Prev. Chronic Dis. 2014, 11, E118. [Google Scholar] [CrossRef] [PubMed]
  3. King, L.; Hinterland, K.; Dragan, K.; Driver, C.; Harris, T.; Gwynn, R.; Bassett, M. Community Health Profiles 2018, Brooklyn Community District 16: Brownsville. 2018; 40, pp. 1–20. Available online: https://www.nyc.gov/assets/doh/downloads/pdf/data/2018chp-bk16.pdf (accessed on 4 January 2021).
  4. Hinterland, K.; Naidoo, M.; King, L.; Lewin, V.; Myerson, G.; Noumbissi, B.; Woodward, M.; Gould, L.H.; Gwynn, R.C.; Barbot, O.; et al. Community Health Profiles 2018, Brooklyn Community District 5: East New York and Starrett City. 2018; 29, pp. 1–20. Available online: https://www.nyc.gov/assets/doh/downloads/pdf/data/2018chp-bk5.pdf (accessed on 4 January 2021).
  5. Kelly, A.S.; Barlow, S.E.; Rao, G.; Inge, T.H.; Hayman, L.L.; Steinberger, J.; Urbina, E.M.; Ewing, L.J.; Daniels, S.R. Severe obesity in children and adolescents: Identification, associated health risks, and treatment approaches: A scientific statement from the American Heart Association. Circulation 2013, 128, 1689–1712. [Google Scholar] [CrossRef] [PubMed]
  6. Reilly, J.J.; Methven, E.; McDowell, Z.C.; Hacking, B.; Alexander, D.; Stewart, L.; Kelnar, C.J. Health consequences of obesity. Arch. Dis. Childhood. 2003, 88, 748–752. [Google Scholar] [CrossRef] [PubMed]
  7. Kim, D.D.; Basu, A. Estimating the Medical Care Costs of Obesity in the United States: Systematic Review, Meta-Analysis, and Empirical Analysis. Value Health 2016, 19, 602–613. [Google Scholar] [CrossRef] [PubMed]
  8. Kothandan, S.K. School based interventions versus family based interventions in the treatment of childhood obesity—A systematic review. Arch Public Health 2014, 72, 3. [Google Scholar] [CrossRef]
  9. Luttikhuis, H.O.; Baur, L.; Jansen, H.; Shrewsbury, V.A.; O’Malley, C.; Stolk, R.P.; Summerbell, C.D. Interventions for treating obesity in children. Cochrane Database Syst. Rev. 2019, 3, CD001872. [Google Scholar] [CrossRef]
  10. Summerbell, C.D.; Ashton, V.; Campbell, K.J.; Edmunds, L.; Kelly, S.; Waters, E. Interventions for treating obesity in children. Cochrane Database Syst. Rev. 2003, 3, CD001872. [Google Scholar] [CrossRef]
  11. Waters, E.; De Silva-Sanigorski, A.; Burford, B.J.; Brown, T.; Campbell, K.J.; Gao, Y.; Armstrong, R.; Prosser, L.; Summerbell, C.D. Interventions for preventing obesity in children. Cochrane Database Syst. Rev. 2011, 12, CD001871. [Google Scholar] [CrossRef]
  12. Vine, M.; Hargreaves, M.B.; Briefel, R.R.; Orfield, C. Expanding the role of primary care in the prevention and treatment of childhood obesity: A review of clinic- and community-based recommendations and interventions. J. Obes. 2013, 2013, 172035. [Google Scholar] [CrossRef]
  13. Knowler, W.C.; Barrett-Connor, E.; Fowler, S.E.; Hamman, R.F.; Lachin, J.M.; Walker, E.A.; Nathan, D.M.; Diabetes Prevention Program Research Group. Reduction in the incidence of type 2 diabetes with lifestyle intervention or metformin. N. Engl. J. Med. 2002, 346, 393–403. [Google Scholar] [CrossRef]
  14. Ali, M.K.; Echouffo-Tcheugui, J.; Williamson, D.F. How effective were lifestyle interventions in real-world settings that were modeled on the Diabetes Prevention Program? Health Aff. 2012, 31, 67–75. [Google Scholar] [CrossRef]
  15. Wing, R.R.; Look AHEAD Research Group. Long-term effects of a lifestyle intervention on weight and cardiovascular risk factors in individuals with type 2 diabetes mellitus: Four-year results of the Look AHEAD trial. Arch. Intern. Med. 2010, 170, 1566–1575. [Google Scholar] [CrossRef]
  16. US Preventive Services Task Force. Screening for Obesity in Children and Adolescents: US Preventive Services Task Force Recommendation Statement. JAMA 2017, 317, 2417–2426. [Google Scholar] [CrossRef]
  17. US Preventive Services Task Force. Behavioral Weight Loss Interventions to Prevent Obesity-Related Morbidity and Mortality in Adults: US Preventive Services Task Force Recommendation Statement. JAMA 2018, 320, 1163–1171. [Google Scholar] [CrossRef]
  18. Nápoles, A.M.; Stewart, A.L. Transcreation: An implementation science framework for community-engaged behavioral interventions to reduce health disparities. BMC Health Serv. Res. 2018, 18, 710. [Google Scholar] [CrossRef]
  19. Dietz, W.H.; Belay, B.; Bradley, D.; Kahan, S.; Muth, N.D.; Sanchez, E.; Solomon, L. A Model Framework That Integrates Community and Clinical Systems for the Prevention and Management of Obesity and Other Chronic Diseases; National Academy of Medicine: Washington, DC, USA, 2017. [Google Scholar]
  20. Linden, A.; Adams, J.L.; Roberts, N. An assessment of the total population approach for evaluating disease management program effectiveness. Dis. Manag. 2003, 6, 93–102. [Google Scholar] [CrossRef]
  21. Bayoumi, N.S.; Helzner, E.; Afable, A.; Joseph, M.A.; Dhuper, S. A real-world evaluation of a tertiary care childhood obesity intervention to reduce metabolic risk in a hard-to-reach urban population. BMC Pediatr. 2019, 19, 378. [Google Scholar] [CrossRef]
  22. Linden, A.; Adams, J.L.; Roberts, N. Evaluating disease management program effectiveness: An introduction to survival analysis. Dis. Manag. 2004, 7, 180–190. [Google Scholar] [CrossRef]
  23. George, B.; Seals, S.; Aban, I. Survival analysis and regression models. J. Nucl. Cardiol. 2014, 21, 686–694. [Google Scholar] [CrossRef]
  24. Kelley, C.P.; Sbrocco, G.; Sbrocco, T. Behavioral Modification for the Management of Obesity. Prim. Care 2016, 43, 159–175. [Google Scholar] [CrossRef]
  25. Centers for Disease Control and Prevention. Healthy Weight, Nutrition, and Physical Activity. Available online: https://www.cdc.gov/healthyweight/assessing/bmi/childrens_bmi/about_childrens_bmi.html (accessed on 10 March 2023).
  26. Centers for Disease Control and Prevention. Modified z-Scores in the CDC Growth Charts. Available online: https://www.cdc.gov/nccdphp/dnpa/growthcharts/resources/biv-cutoffs.pdf (accessed on 10 February 2021).
  27. Freedman, D.S.; Butte, N.F.; Taveras, E.M.; Lundeen, E.A.; Blanck, H.M.; Goodman, A.B.; Ogden, C.L. BMI z-Scores are a poor indicator of adiposity among 2- to 19-year-olds with very high BMIs, NHANES 1999–2000 to 2013–2014. Obesity 2017, 25, 739–746. [Google Scholar] [CrossRef] [PubMed]
  28. Zabarsky, G.; Beek, C.; Hagman, E.; Pierpont, B.; Caprio, S.; Weiss, R. Impact of Severe Obesity on Cardiovascular Risk Factors in Youth. J. Pediatr. 2018, 192, 105–114. [Google Scholar] [CrossRef]
  29. Baker, J.L.; Olsen, L.W.; Sørensen, T.I. Childhood body-mass index and the risk of coronary heart disease in adulthood. N. Engl. J. Med. 2007, 357, 2329–2337. [Google Scholar] [CrossRef] [PubMed]
  30. Dietz, W.H. Time to Adopt New Measures of Severe Obesity in Children and Adolescents. Pediatrics 2017, 140, e20172148. [Google Scholar] [CrossRef] [PubMed]
  31. Freedman, D.S.; Berenson, G.S. Tracking of BMI z Scores for Severe Obesity. Pediatrics 2017, 140, e20171072. [Google Scholar] [CrossRef]
  32. Danielsson, P.; Kowalski, J.; Ekblom, Ö.; Marcus, C. Response of severely obese children and adolescents to behavioral treatment. Arch. Pediatr. Adolesc. Med. 2012, 166, 1103–1108. [Google Scholar] [CrossRef]
  33. Knop, C.; Singer, V.; Uysal, Y.; Schaefer, A.; Wolters, B.; Reinehr, T. Extremely obese children respond better than extremely obese adolescents to lifestyle interventions. Pediatr. Obes. 2015, 10, 7–14. [Google Scholar] [CrossRef]
  34. Dhuper, S.; Bayoumi, N.; Dalvi, J.; Panzer, B. The Correlation Between Parental Perceptions and Readiness to Change with Participation in a Pediatric Obesity Program Serving a Predominantly Black Urban Community: A Retrospective Cohort Study. Matern. Child Health J. 2020, 25, 606–612. [Google Scholar] [CrossRef]
  35. O’Connor, E.A.; Evans, C.V.; Burda, B.U.; Walsh, E.S.; Eder, M.; Lozano, P. Screening for Obesity and Intervention for Weight Management in Children and Adolescents: Evidence Report and Systematic Review for the US Preventive Services Task Force. JAMA 2017, 317, 2427–2444. [Google Scholar] [CrossRef]
  36. Huang, T.T.; Glass, T.A. Transforming research strategies for understanding and preventing obesity. JAMA 2008, 300, 1811–1813. [Google Scholar] [CrossRef]
  37. Tate, D.F.; Lytle, L.A.; Sherwood, N.E.; Haire-Joshu, D.; Matheson, D.; Moore, S.M.; Loria, C.M.; Pratt, C.; Ward, D.S.; Belle, S.H.; et al. Deconstructing interventions: Approaches to studying behavior change techniques across obesity interventions. Transl. Behav. Med. 2016, 6, 236–243. [Google Scholar] [CrossRef]
Figure 1. The Live Light Live Right Treatment Model.
Ijerph 20 05723 g001
Figure 2. Survival curves for low vs. high contact hours patients with BMIz as the risk factor (log-rank test: p < 0.001). The y-axis shows the survival probability (chance of experiencing an improved BMI state).
Ijerph 20 05723 g002
Figure 3. Survival curves for low vs. high contact hours patients with BMI%95 as the risk factor (log-rank test: p < 0.001). The y-axis shows the survival probability (chance of experiencing an improved BMI state).
Ijerph 20 05723 g003
Figure 4. Survival curves for low vs. high contact hours patients with Δ BMI as the risk factor (log-rank test: p > 0.05). The y-axis shows the survival probability (chance of experiencing an improved BMI state).
Ijerph 20 05723 g004
Figure 5. Survival curves for low vs. high contact hours patients with systolic hypertension (SHT) as the risk factor (log-rank test: p < 0.05). The y-axis shows the survival probability (chance of experiencing an improvement in systolic hypertension state).
Ijerph 20 05723 g005
Figure 6. Survival curves for low vs. high contact hours patients with diastolic hypertension (DHT) as the risk factor (log-rank test: p < 0.01). The y-axis shows the survival probability (chance of experiencing an improvement in diastolic hypertension state).
Ijerph 20 05723 g006
Figure 7. Censoring times of 201 low contact hour patients and 96 high contact hour patients on the last visit before the end of study at 60 months.
Ijerph 20 05723 g007
Table 1. Baseline characteristics and health indicators of the study population (n = 406).
Low Contact HoursHigh Contact Hours
VariableN (total)Mean ± SD or N (%)N (total)Mean ± SD or N (%)p-Value
Age in years, mean ± SD25611.0 ± 3.4415010.0 ± 2.660.00
Sex256 150
Male 111 (43.4%) 67 (44.7%)0.84
Female 145 (56.6%) 83 (55.3%)
Race78 66
Black 60 (76.9%) 58 (87.9%)
Hispanic 15 (19.2%) 8 (12.1%)
White 0 (0.00%) 0 (0.00%)0.12
Asian 0 (0.00%) 0 (0.00%)
Other/Unknown 3 (3.85%) 0 (0.00%)
BMIz, mean ± SD2562.43 ± 0.441502.41 ± 0.420.72
BMI%95, mean ± SD256148.3 ± 28.4150146.8 ± 26.40.60
Obesity Prevalence 256 150
Healthy weight 0 (0.00%) 1 (0.66%)
Overweight 0 (0.00%) 1 (0.66%)0.19
Obese 38 (14.8%) 16 (10.7%)
Severely obese 218 (85.2%) 132 (88.0%)
Abnormal Waist circumference 210195 (92.9%)133124 (93.2%)0.89
Hypertension
Systolic Hypertension 23770 (29.5%)14548 (33.1%)0.49
Diastolic Hypertension 23740 (16.9%)14419 (13.2%)0.38
Lipid Levels
Abnormal Total cholesterol 19575 (38.5%)12950 (38.8%)0.96
Abnormal High-density lipoprotein18965 (34.4%)12234 (27.9%)0.23
Abnormal Low-density lipoprotein 18556 (30.3%)12133 (27.3%)0.57
Abnormal Triglycerides 18862 (33.0%)12030 (25.0%)0.14
Elevated fasting glucose 17218 (10.5%)1148 (7.02%)0.32
Presence of 3 or more components of the Metabolic syndrome 13536 (26.0%)9624 (25.0%)0.78
Bold means statistically significant at the 5% level
Table 2. Age distribution at baseline (n = 406).
AgeFrequencyPercent
210.25
320.49
492.22
5122.96
6215.17
74210.3
8399.61
95513.6
104711.6
115012.3
12379.11
13276.65
14194.68
15204.93
16153.69
1740.99
1820.49
1940.99
Table 3. Total number of people that experienced the “event” and mean times (in months) of staying in the improved state for the BMI metrics based on contact hour group grouping.
Risk FactorContact Hour GroupNMeanStd. Dev.MinMaxp-Value
BMIzLow6126.215.312.7103.60.00
High6534.817.112.279.3
(Total)12630.616.712.2103.6
BMI%95 Low4828.617.312.7103.60.43
High5431.215.712.285.5
(Total)10230.016.512.2103.6
Δ BMI Low2123.39.2512.243.80.47
High2121.47.4312.844.7
(Total)4222.48.3412.244.7
Table 4. Total number of people that experienced the “event” and mean times (in months) getting to the event for the BMI risk factors based on contact hour grouping.
Risk FactorContact Hour GroupNMeanStd. Dev.MinMaxp-Value
BMIzLow6111.215.30.4756.80.24
High658.4510.10.6739.8
(Total)1269.7812.90.4756.8
BMI%95 Low4811.215.70.4756.80.39
High548.8811.70.0757.9
(Total)10210.013.70.4757.9
ΔBMILow216.417.640.4735.60.88
High216.747.170.9326.0
(Total)426.587.320.4735.6
Table 5. Cox PH Regression for contact hours predicting improvement in BMI (n = 406).
BMI%95BMIz Δ BMI
VariableHR (95% CI) p-valueHR (95% CI)p-valueHR (95% CI)p-value
Contact Hour Group
(Referent—Low)
2.11 (1.41–3.17)<0.0011.81 (1.27–2.58)0.0011.92 (1.03–3.60)0.042
Age1.07 (1.001–1.13)0.0470.929 (0.875–0.987)0.0171.10 (0.994–1.21)0.07
Sex
(Referent—Male)
0.929 (0.625–1.38)0.7141.31 (0.908–1.88)0.1491.26 (0.676–2.35)0.47
Disclaimer/Publisher’s Note: The statements, opinions and data contained in all publications are solely those of the individual author(s) and contributor(s) and not of MDPI and/or the editor(s). MDPI and/or the editor(s) disclaim responsibility for any injury to people or property resulting from any ideas, methods, instructions or products referred to in the content.

