
Cross-Cultural Adaptation and Psychometric Properties of the Arabic Version of the Fall Risk Questionnaire
 , , ,
, , ,  , and
, and
Abstract
:1. Background
2. Methods
2.1. Translation and Cross-Cultural Adaptation
2.1.1. First Stage: Forward Translation
2.1.2. Second Stage: Translation Synthesis
2.1.3. Third Stage: Backward Translation
2.1.4. Fourth Stage: Expert Committee
2.1.5. Fifth Stage: Content Validity and Pilot Testing
2.2. Psychometric Testing
2.3. Measures
2.3.1. Self-Rated FRQ
2.3.2. Berg Balance Scale (BBS)
2.3.3. TUG
2.3.4. 5TSTS
3. Data Analyses
3.1. Validity
3.1.1. Content Validity
3.1.2. Construct (Convergent) Validity
3.1.3. Construct (Known Groups) Validity
3.2. Floor and Ceiling Effects
3.3. Reliability
4. Results
4.1. Floor and Ceiling Effects
4.2. Validity
4.3. Construct Validity
4.4. Reliability
5. Discussion
6. Conclusions
Author Contributions
Funding
Institutional Review Board Statement
Informed Consent Statement
Data Availability Statement
Acknowledgments
Conflicts of Interest
References
- World Health Organization. WHO Global Report on Falls Prevention in Older Age. Available online: https://www.who.int/publications/i/item/9789241563536 (accessed on 20 June 2022).
- Almegbel, F.Y.; Alotaibi, I.M.; Alhusain, F.A.; Masuadi, E.M.; Al Sulami, S.L.; Aloushan, A.F.; Almuqbil, B.I. Period prevalence, risk factors and consequent injuries of falling among the Saudi elderly living in Riyadh, Saudi Arabia: A cross-sectional study. BMJ Open 2018, 8, e019063. [Google Scholar] [CrossRef] [PubMed]
- Ambrose, A.F.; Paul, G.; Hausdorff, J.M. Risk factors for falls among older adults: A review of the literature. Maturitas 2013, 75, 51–61. [Google Scholar] [CrossRef]
- Florence, C.S.; Bergen, G.; Atherly, A.; Burns, E.; Stevens, J.; Drake, C. Medical costs of fatal and nonfatal falls in older adults. J. Am. Geriatr. Soc. 2018, 66, 693–698. [Google Scholar] [CrossRef] [PubMed]
- Iaboni, A.; Flint, A.J. The complex interplay of depression and falls in older adults: A clinical review. Am. J. Geriatr. Psychiatry 2013, 21, 484–492. [Google Scholar] [CrossRef] [PubMed]
- American Family Physician. U.S. Preventive Services Task Force: Interventions to Prevent Falls in Community-Dwelling Older Adults: Recommendation Statement. 2018. Available online: https://www.aafp.org/afp/2018/0815/od1.html./ (accessed on 10 October 2022).
- National Institute for Health and Care Excellence. Falls in Older Adults: Assessing Risk and Prevention; National Institute for Health and Care Excellence: London, UK, 2013. [Google Scholar]
- Phelan, E.A.; Mahoney, J.E.; Voit, J.C.; Stevens, J.A. Assessment and management of fall risk in primary care settings. Med. Clin. N. Am. 2015, 99, 281–293. [Google Scholar] [CrossRef]
- Wang, Z.; Rong, Y.; Gu, L.; Yang, Y.; Du, X.; Zou, M. Reliability and validity of the fall risk self-assessment scale for community-dwelling older adults in China: A pilot study. BMC Geriatr. 2022, 22, 272. [Google Scholar] [CrossRef] [PubMed]
- Regan, E.; Middleton, A.; Stewart, J.C.; Wilcox, S.; Pearson, J.L.; Fritz, S. The six-minute walk test as a fall risk screening tool in community programs for persons with stroke: A cross-sectional analysis. Top Stroke Rehabil. 2020, 27, 118–126. [Google Scholar] [CrossRef]
- Barry, E.; Galvin, R.; Keogh, C.; Horgan, F.; Fahey, T. Is the Timed Up and Go test a useful predictor of risk of falls in community dwelling older adults: A systematic review and meta-analysis. BMC Geriatr. 2014, 14, 14. [Google Scholar] [CrossRef]
- Shankar, K.N.; Taylor, D.; Rizzo, C.T.; Liu, S.W. Exploring older adult ED fall patients’ understanding of their fall: A qualitative atudy. Geriatr. Orthop. Surg Rehabil. 2017, 8, 231–237. [Google Scholar] [CrossRef]
- Rubenstein, L.Z.; Vivrette, R.; Harker, J.O.; Stevens, J.A.; Kramer, B.J. Validating an evidence-based, self-rated fall risk questionnaire (FRQ) for older adults. J. Saf. Res. 2011, 42, 493–499. [Google Scholar] [CrossRef]
- Kitcharanant, N.; Vanitcharoenkul, E.; Unnanuntana, A. Validity and reliability of the self-rated fall risk questionnaire in older adults with osteoporosis. BMC Musculoskelet Disord 2020, 21, 757. [Google Scholar] [CrossRef]
- Sertel, M.; Şimşek, T.T.; Yümin, E.T.; Aras, B. Determination of the validity and reliability of the Turkish version of the self-rated fall risk questionnaire in older individuals. Physiother. Q. 2020, 28, 50–55. [Google Scholar] [CrossRef]
- Beaton, D.E.; Bombardier, C.; Guillemin, F.; Ferraz, M.B. Guidelines for the process of cross-cultural adaptation of self-report measures. Spine 2000, 25, 3186–3191. [Google Scholar] [CrossRef] [PubMed]
- Berg, K.; Wood-Dauphinee, S.; Williams, J.I.; Maki, B. Measuring balance in the elderly: Validation of an instrument. Can. J. Pub. Health 1992, 83 (Suppl. 2), S7–S11. [Google Scholar]
- Lima, C.A.; Ricci, N.A.; Nogueira, E.C.; Perracini, M.R. The Berg Balance Scale as a clinical screening tool to predict fall risk in older adults: A systematic review. Physiotherapy 2018, 104, 383–394. [Google Scholar] [CrossRef] [PubMed]
- Podsiadlo, D.; Richardson, S. The timed “up & go”: A test of basic functional mobility for frail elderly persons. J. Am. Geriatr. Soc. 1991, 39, 142–148. [Google Scholar] [CrossRef] [PubMed]
- Lusardi, M.M.; Fritz, S.; Middleton, A.; Allison, L.; Wingood, M.; Phillips, E.; Criss, M.; Verma, S.; Osborne, J.; Chui, K.K. Determining risk of falls in community dwelling older adults: A systematic review and meta-analysis using posttest probability. J. Geriatr. Phys. Ther. 2017, 40, 1–36. [Google Scholar] [CrossRef] [PubMed]
- Wallmann, H.W.; Evans, N.S.; Day, C.; Neelly, K.R. Interrater reliability of the five-times- sit-to-stand test. Home Health Care Manag. Pract. 2012, 20, 1–5. [Google Scholar] [CrossRef]
- Duncan, R.P.; Leddy, A.L.; Earhart, G.M. Five times sit-to-stand test performance in Parkinson’s disease. Arch. Phys. Med. Rehabil. 2011, 92, 1431–1436. [Google Scholar] [CrossRef] [PubMed]
- Terwee, C.B.; Bot, S.D.; de Boer, M.R.; van der Windt, D.A.; Knol, D.L.; Dekker, J.; Bouter, L.M.; de Vet, H.C. Quality criteria were proposed for measurement properties of health status questionnaires. J. Clin. Epidemiol. 2007, 60, 34–42. [Google Scholar] [CrossRef] [PubMed]
- Polit, D.F.; Beck, C.T.; Owen, S.V. Is the CVI an acceptable indicator of content validity? Appraisal and recommendations. Res. Nurs. Health 2007, 30, 459–467. [Google Scholar] [CrossRef] [PubMed]
- Zamanzadeh, V.; Ghahramanian, A.; Rassouli, M.; Abbaszadeh, A.; Alavi-Majd, H.; Nikanfar, A.R. Design and implementation content validity study: Development of an instrument for measuring patient-centered communication. J. Caring Sci. 2015, 4, 165–178. [Google Scholar] [CrossRef] [PubMed]
- Portney, L.G.; Watkins, M.P. Foundations of Clinical Research: Applications to Practice, 2nd ed.; Prentice Hall Health: Upper Saddle River, NJ, USA, 2000. [Google Scholar]
- Deyo, R.A.; Centor, R.M. Assessing the responsiveness of functional scales to clinical change: An analogy to diagnostic test performance. J. Chronic Dis. 1986, 39, 897–906. [Google Scholar] [CrossRef] [PubMed]
- Cronbach, L.J. Coefficient alpha and the internal structure of tests. Psychometrika 1951, 16, 297–334. [Google Scholar] [CrossRef]
- Koo, T.K.; Li, M.Y. A guideline of selecting and reporting intraclass correlation coefficients for reliability research. J. Chiropr. Med. 2016, 15, 155–163. [Google Scholar] [CrossRef]
- Bland, J.M.; Altman, D.G. Statistical methods for assessing agreement between two methods of clinical measurement. Lancet 1986, 1, 307–310. [Google Scholar] [CrossRef] [PubMed]
- Shaalan, S. Investigating Grammatical Complexity in Gulf Arabic Speaking Children with Specific Language Impairment (SLI). Doctoral Thesis, UCL (University College London), London, UK, 2010. [Google Scholar]
- McHugh, M.L. Interrater reliability: The Kappa Statistic. Biochem. Med. 2012, 22, 276–282. [Google Scholar] [CrossRef]
- Bruton, A.; Conway, J.; Hogate, S. Reliability: What is it, and how is it measured? Physiotherapy 2000, 86, 94–99. [Google Scholar] [CrossRef]


| Floor and Ceiling Effects | ||
|---|---|---|
| Floor effect | >15% of the participants achieve the lowest status score [23] | |
| Ceiling effect | >15% of the participants achieve the highest status score [23] | |
| Validity | ||
| Content validity | I-CVI ≥ 0.78 [24] S-CVI/Ave ≥ 0.90 [24] S-CVI/UA ≥ 0.80 [24] | |
| Instrument/test | Construct measured | Direction and magnitude of the relationships |
| STS | Lower-extremity functional strength | Fair-to-moderate positive relationship (r = 0.39–0.65) [14] |
| TUG | Mobility | Fair-to-moderate positive relationship (r = 0.30–0.63) [14,15] |
| BBS | Balance | Moderate-to-excellent negative relationship (r = −0.66 to −0.76) [14,15] |
| AUC | >0.70 [23] | |
| Reliability | ||
| Internal consistency | Cronbach’s α = 0.70–0.95 [23] | |
| Test-retest | ICC > 0.70 [23] | |
| Tests Scores | ||||||||
|---|---|---|---|---|---|---|---|---|
| Cohort | Validity Cohort | Reliability Cohort | ||||||
| Sample Size | n = 110 | n = 107 | n = 74 | n = 63 | ||||
| Test/Statistics | M ± SD | Min–Max | M ± SD | Min–Max | M ± SD | Min–Max | M ± SD | Min–Max |
| FRQ (baseline) | 7.3 ± 3.6 | 0–14 | 7.2 ± 3.6 | 0–14 | 6.0 ± 3.2 | 0–13 | 7.2 ± 3.6 | - |
| BBS | 37.5 ± 11.8 | 14–55 | - | - | - | - | - | - |
| TUG | - | - | 21.6 ± 8.6 | 10–50 | - | - | - | - |
| STS | - | - | - | - | 26.3 ± 7.5 | 13–54 | - | - |
| FRQ (retest) | - | - | - | - | - | - | 7.4 ± 3.6 | 0–14 |
| Demographic Characteristics a | ||||||||
| Age: 65–69 70–74 75–79 ≥80 | 49 (44.5) 28 (25.5) 16 (14.5) 17 (15.5) | 49 (45.8) 28 (26.2) 14 (13.1) 16 (15) | 43 (58.1) 23 (31.1) 5 (6.8) 3 (4.1) | 31 (49.2) 16 (25.4) 6 (9.5) 10 (15.9) | ||||
| Sex: Male Female | 72 (65.5) 38 (34.5) | 70 (65.4) 37 (34.6) | 47 (63.5) 27 (36.5) | 41 (65.1) 22 (34.9) | ||||
| Marital status: Married Divorced Widow | 89 (80.9) 1 (0.9) 20 (18.2) | 87 (81.3) 1 (0.9) 19 (17.8) | 65 (87.8) 1 (1.4) 8 (10.8) | 53 (84.1) 1 (1.6) 9 (14.3) | ||||
| Education: Illiterate Primary Middle High University | 28 (25.5) 11 (10) 14 (12.7) 20 (18.2) 37 (33.6) | 27 (25.2) 11 (10.3) 13 (12.1) 20 (18.7) 36 (33.6) | 11 (14.9) 9 (12.2) 10 (13.5) 15 (20.3) 29 (39.2) | 19 (30.2) 7 (11.1) 6 (9.5) 10 (15.9) 21 (33.3) | ||||
| Chronic disease: Yes No | 81 (73.6) 29 (26.4) | 78 (72.9) 29 (27.1) | 48 (64.9) 26 (35.1) | 50 (79.4) 13 (20.6) | ||||
| History of fall: Yes No | 57 (51.8) 53 (48.2) | 55 (51.4) 52 (48.6) | 32 (43.2) 42 (56.8) | 32 (50.8) 31 (49.2) | ||||
| Weight M ± SD (kg) | 73.4 ± 15.8 | 73.4 ± 16 | 73.6 ± 12.5 | 73.6 ± 18.6 | ||||
| Height M ± SD (cm) | 164.1 ± 12.7 | 164 ± 12.8 | 165 ± 8.2 | 162.6 ± 14.7 | ||||
| Variable | Clarity Component | Relevance Component |
|---|---|---|
| Number of items with I-CVI ≥ 0.70 | 12 | 12 |
| Number of items with I-CVI < 0.70 | 0 | 0 |
| Minimum–maximum I-CVI | 0.92–1.00 | 0.75–1.00 |
| S-CVI/Ave | 0.99 | 0.96 |
| S-CVI/UA | 0.92 | 0.75 |
| Psychometric Property | Baseline | At 7 Days | n | |
|---|---|---|---|---|
| Construct validity | STS | r = 0.46 * | - | 74 |
| TUG | r = 0.59 * | - | 107 | |
| BBS | r = −0.72 * | - | 110 | |
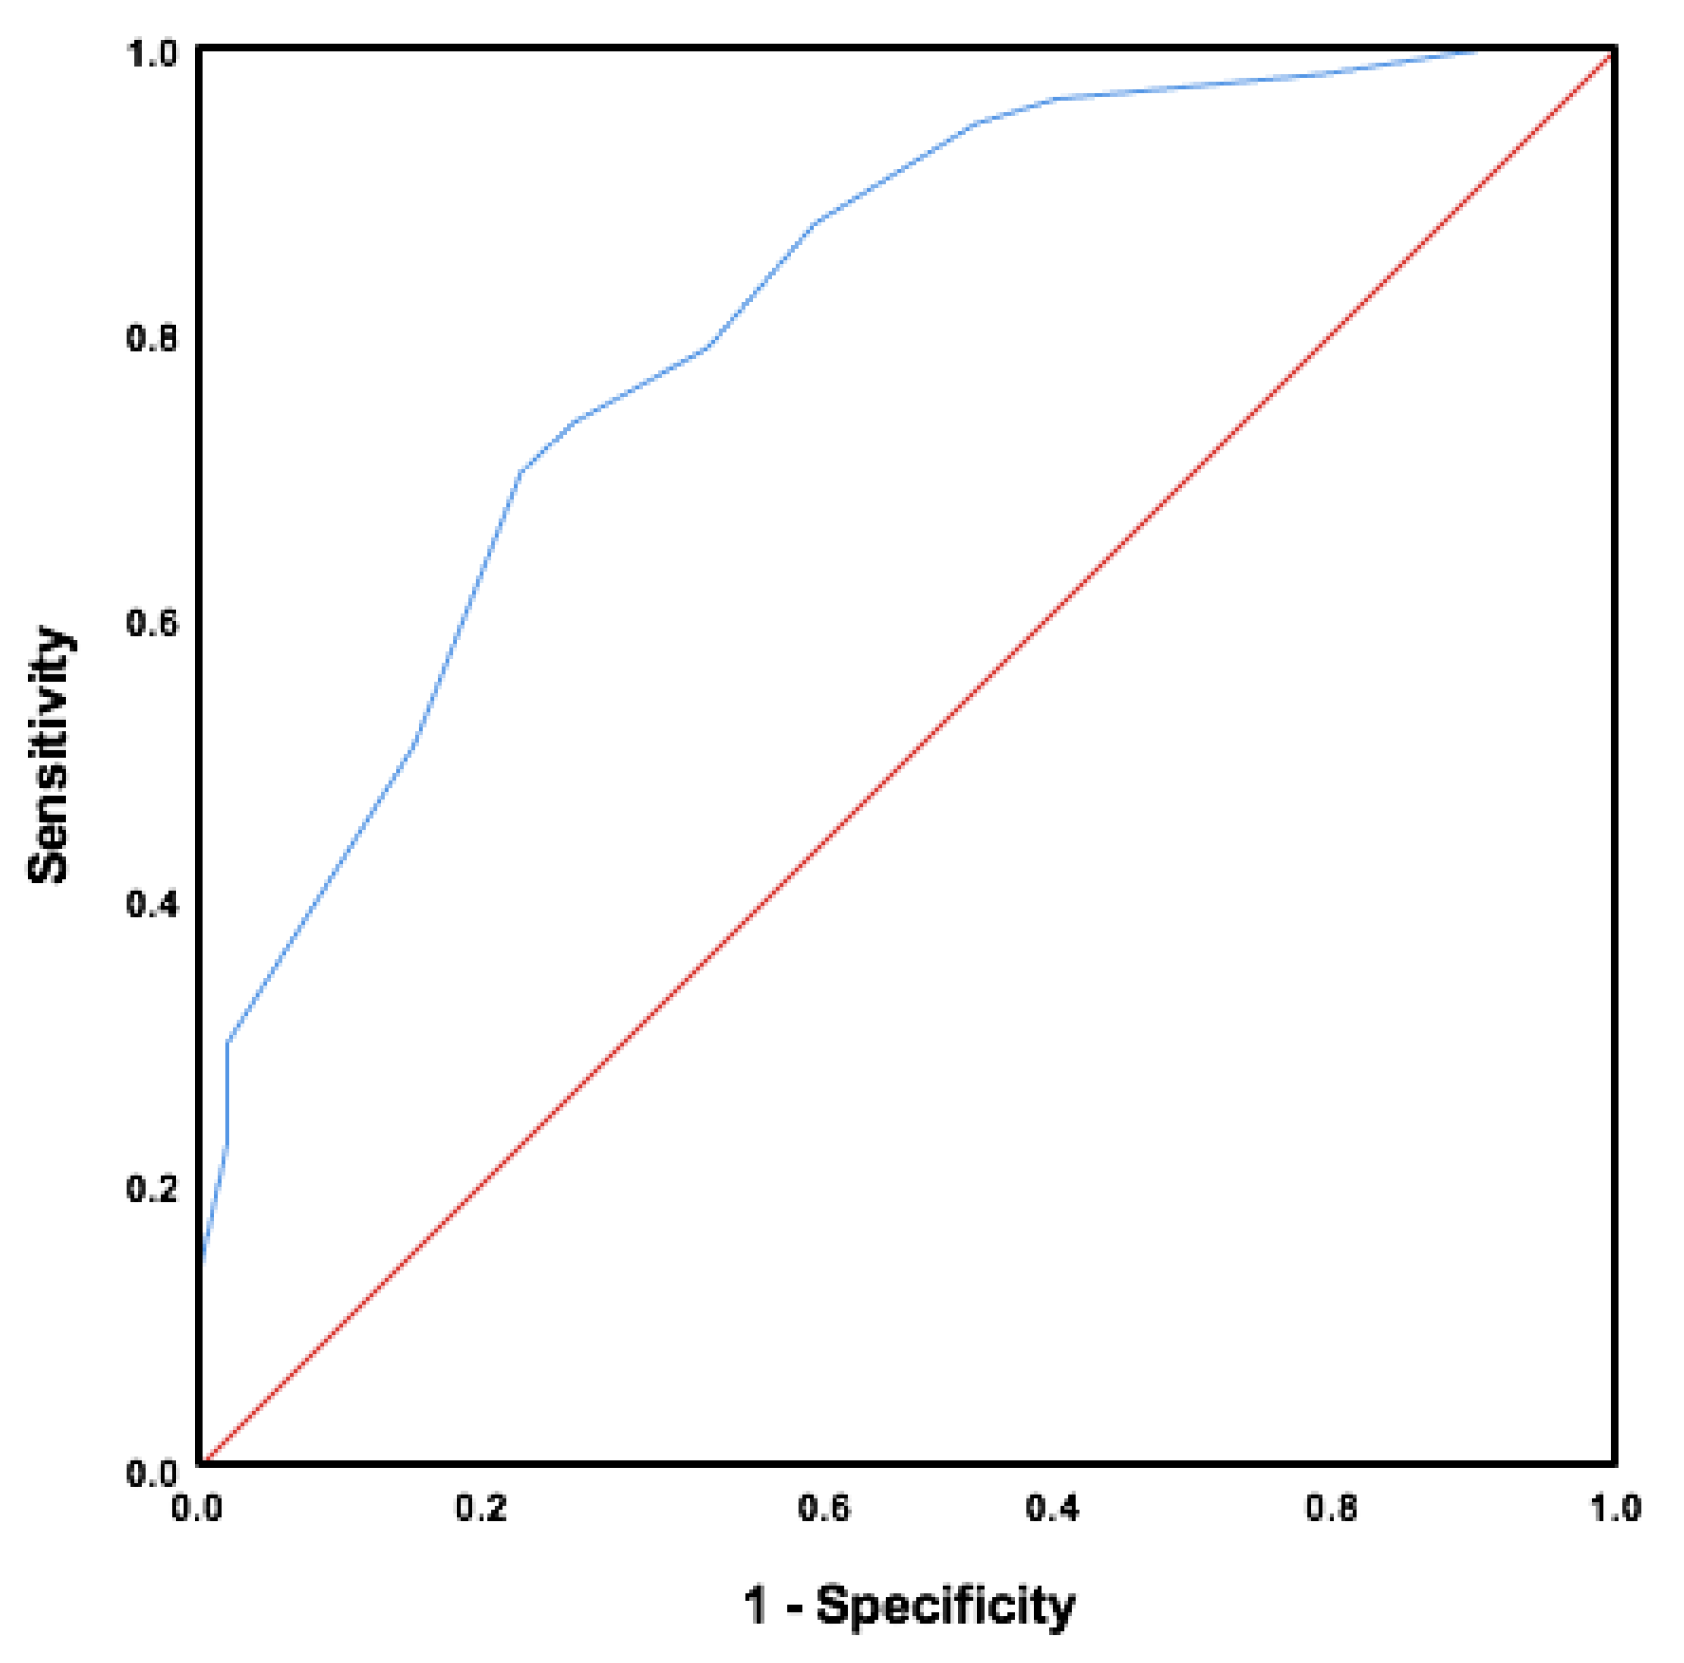
| AUC | 0.81 * (95% CI = 0.73–0.89) | - | ||
| Cutoff score (sensitivity–specificity) | 7.5 (73.7–73.6%) | - | ||
| Reliability | Internal consistency | Cronbach’s α = 0.77 | - | |
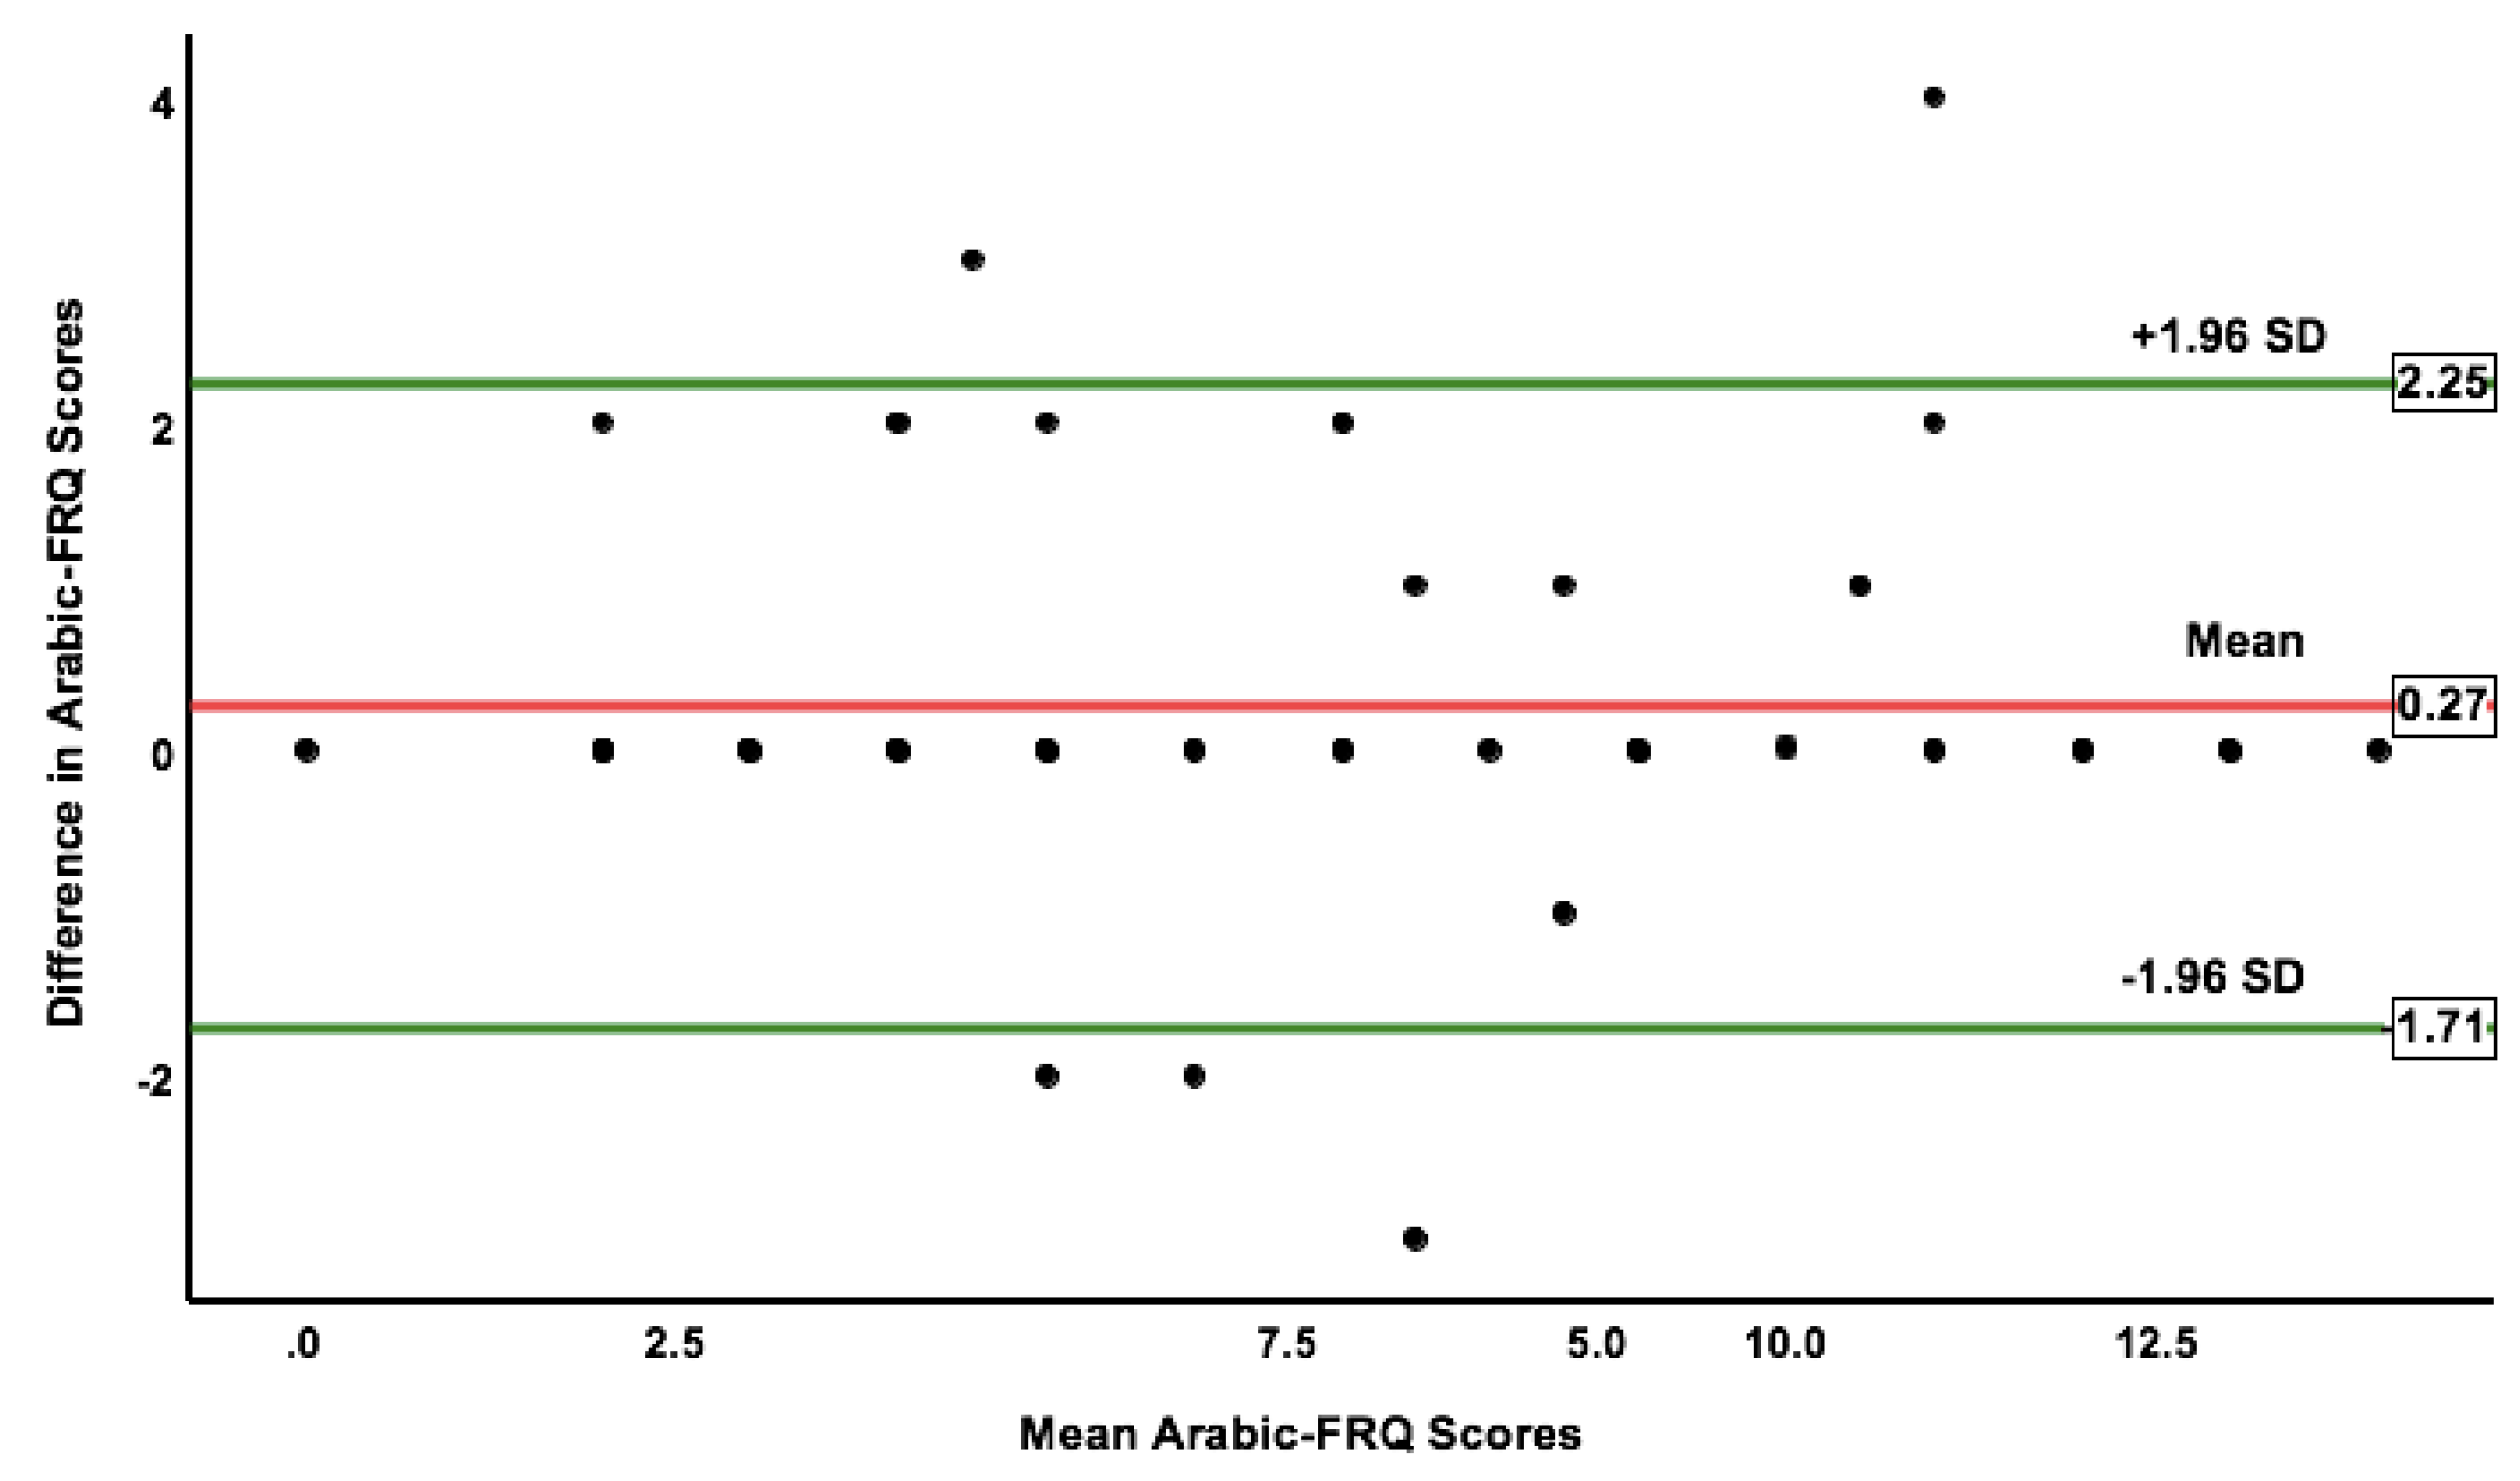
| Test-retest | - | ICC = 0.95 ** (95% CI: 0.92–0.97) | 63 | |
| SEM | - | 0.77 | ||
| MDC95% | - | 2.15 | ||
| Mean difference (95% LOA) | - | 0.27 (−1.71–2.25) | ||
| Item | Cronbach’s α if Item Removed |
|---|---|
| 1 | 0.78 |
| 2 | 0.74 |
| 3 | 0.73 |
| 4 | 0.73 |
| 5 | 0.74 |
| 6 | 0.75 |
| 7 | 0.74 |
| 8 | 0.77 |
| 9 | 0.74 |
| 10 | 0.75 |
| 11 | 0.76 |
| 12 | 0.75 |
Disclaimer/Publisher’s Note: The statements, opinions and data contained in all publications are solely those of the individual author(s) and contributor(s) and not of MDPI and/or the editor(s). MDPI and/or the editor(s) disclaim responsibility for any injury to people or property resulting from any ideas, methods, instructions or products referred to in the content. |
© 2023 by the authors. Licensee MDPI, Basel, Switzerland. This article is an open access article distributed under the terms and conditions of the Creative Commons Attribution (CC BY) license (https://creativecommons.org/licenses/by/4.0/).
Share and Cite
Alharbi, A.A.; Al Amer, H.S.; Albalwi, A.A.; Muthaffar, M.Y.; Alshehre, Y.M.; Albalawi, H.F.; Alshaikhi, T.E. Cross-Cultural Adaptation and Psychometric Properties of the Arabic Version of the Fall Risk Questionnaire. Int. J. Environ. Res. Public Health 2023, 20, 5606. https://doi.org/10.3390/ijerph20085606
Alharbi AA, Al Amer HS, Albalwi AA, Muthaffar MY, Alshehre YM, Albalawi HF, Alshaikhi TE. Cross-Cultural Adaptation and Psychometric Properties of the Arabic Version of the Fall Risk Questionnaire. International Journal of Environmental Research and Public Health. 2023; 20(8):5606. https://doi.org/10.3390/ijerph20085606
Chicago/Turabian StyleAlharbi, Ahmad A., Hamad S. Al Amer, Abdulaziz A. Albalwi, Majed Y. Muthaffar, Yousef M. Alshehre, Hani F. Albalawi, and Turky E. Alshaikhi. 2023. "Cross-Cultural Adaptation and Psychometric Properties of the Arabic Version of the Fall Risk Questionnaire" International Journal of Environmental Research and Public Health 20, no. 8: 5606. https://doi.org/10.3390/ijerph20085606