
Is Gender an Antecedent to Workplace Stressors? A Systematic Review and an Empirical Study Using a Person-Centred Approach

 , , , ,
Abstract
:1. Introduction
1.1. Stress and Gender
1.2. Theorising Exposure to Work Stressors According to Gender
2. Study 1: Systematic Review
2.1. Study 1 Methods
2.1.1. Search Terms and Inclusion/Exclusion Criteria
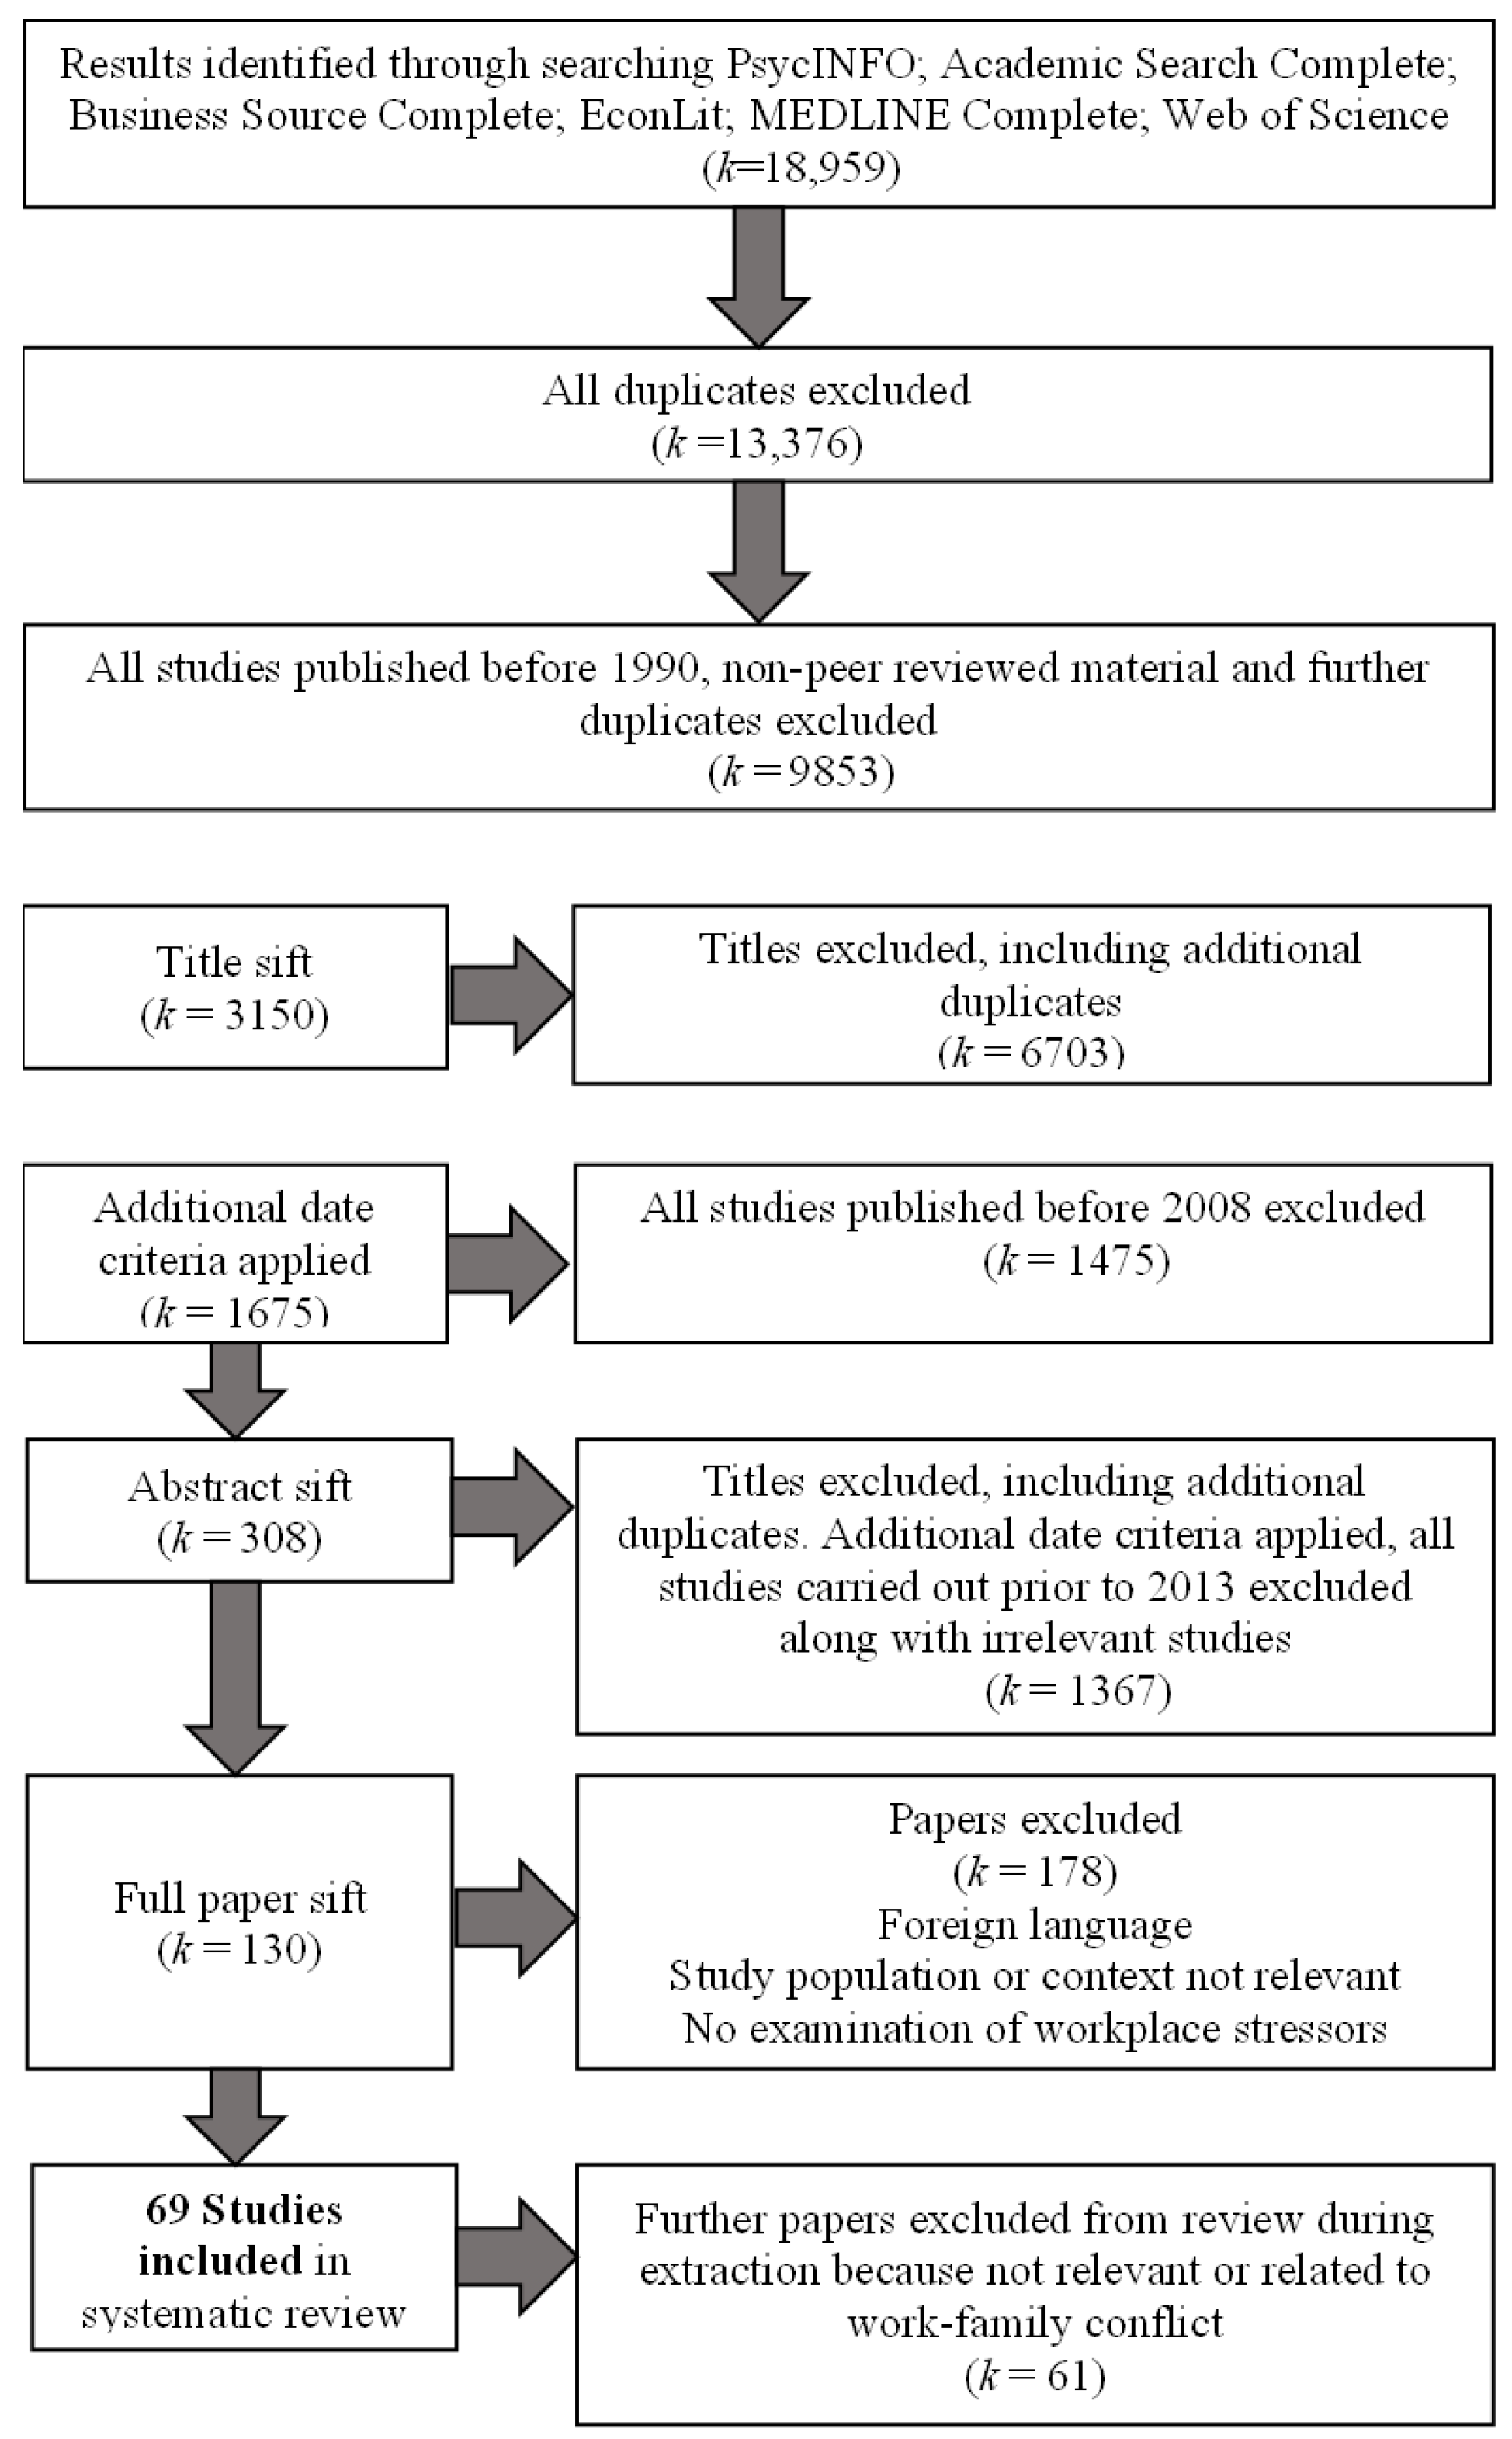
2.1.2. Study Selection
2.1.3. Data Extraction and Evidence Quality
2.2. Study 1 Results
2.2.1. Job Demands and Rewards
2.2.2. Relationships at Work: From Positive Collaboration to Harassment and Violence
2.2.3. Role Stressors
2.2.4. Support
2.2.5. Control
2.3. Study 1: Discussion
3. Study 2: Empirical Study in Public Administrations
3.1. Study 2 Methods
3.1.1. Participants
3.1.2. Measures
3.1.3. Analytic Approach
3.2. Study 2 Results
3.2.1. Preliminary Analysis
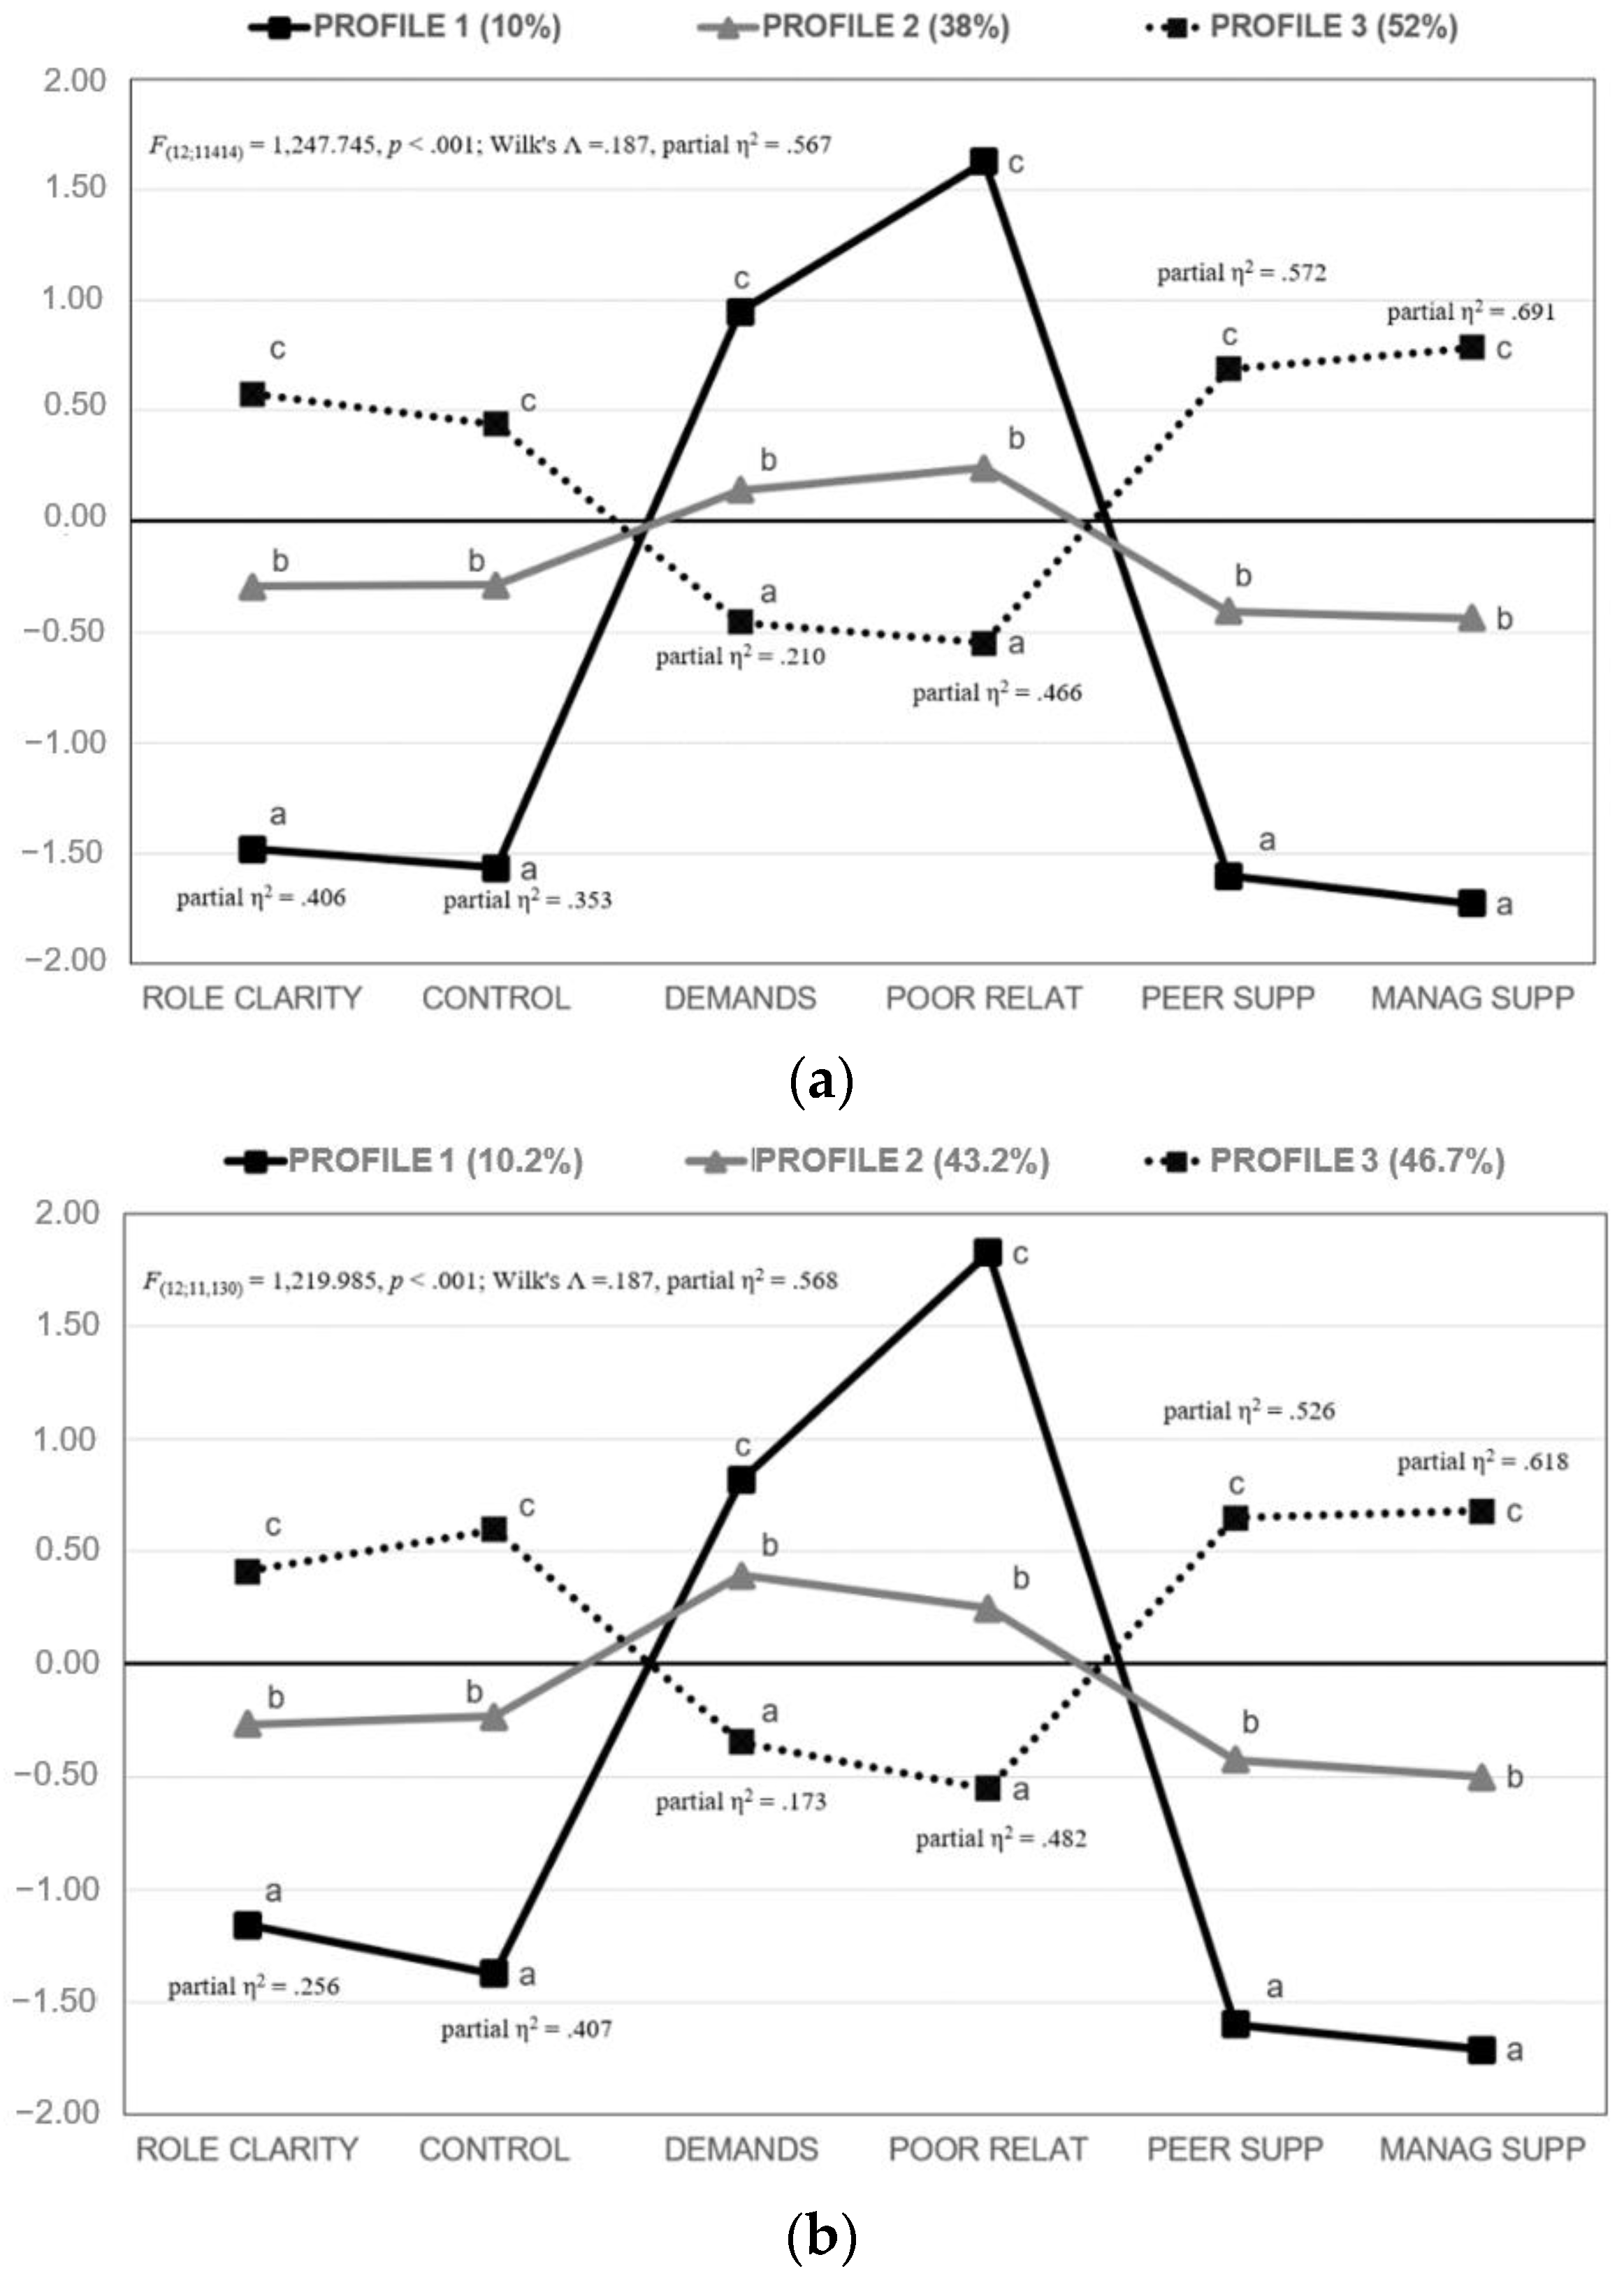
3.2.2. Gender Profiles in Psychosocial Risk Factors: Results of Latent Profile Analysis
3.3. Study 2: Discussion
4. General Discussion and Conclusions
Supplementary Materials
Author Contributions
Funding
Institutional Review Board Statement
Informed Consent Statement
Data Availability Statement
Acknowledgments
Conflicts of Interest
Appendix A

| ID | Sample | Q | S | Job Demands and Rewards | Relationships at Work | ||||||
|---|---|---|---|---|---|---|---|---|---|---|---|
| Workload Psych & Physical | Emotional | Rewards | Bullying | Harass Violence | Third Party | Interp. Conflict | Other | ||||
| [48] | Europe. 5th European Working Condition Survey (EWCS) (2010). 33,907 employees. 46% women | H | L | Cognitive demands (1 item) M > W | (2 items) W > M | (3 items) W > M | Bullying (1 item) Abuse (3 item) W = M | Sexual violence (1 item) Physical violence (1 item) W = M | |||
| Psychological demands (4 items) M > W | Discrimination (1 item) W > M | ||||||||||
| [49] | USA. 2010 Health and Retirement Study (HRS). 2292 individuals. 56% women | H | M | (6 items) W > M | |||||||
| [50] | Europe. 4th European Working Conditions Survey (EWCS). 16,141 individuals. 51% women | H | L | Psychological demands (2 items) M > W | |||||||
| [51] | Germany iCEPT study. 381 Physicians. 79% women | M | S | Time pressure, workload, physical demands (6 items) W > M | (3 items) M > W | Collaboration (2 items) W = M | |||||
| [52] | Spain. 506 public and private full time professional. 63% women | H | S | Psychological demands (9 items) M = W | |||||||
| Physical workload (3 items) W = M | |||||||||||
| [53] | UK, Royal forces employees 2007 Work Well-Being. 2516 participants. 54% women in the junior rates, 28% women in the senior rates, 41% women officers | H | M | Physical demand (1 item) W = M; W senior rates > M senior rates | (1 item) W = M; W junior rates > M junior rates | Interpersonal relationships (4 items) W = M | |||||
| [54] | Germany. 1384 health care professionals. 70% women | H | M | Work burden (1 item) M > W | |||||||
| [55] | UK. 7 NHS organisations. 2950 staff. 72% women | M | M | Negative acts (22 items) M > W | |||||||
| [56] | Belgium. 3821 workers. 60% women | H | M | ||||||||
| [57] | Poland. 1313 transportation company employees. 27% women | H | M | Bullying (32 items: 12 from colleagues; 20 from supervisor) Overall and colleagues W > M; | |||||||
| Supervisor W = M | |||||||||||
| [58] | China, Hong Kong, New Zealand and Australia. 2183. 76% women | H | M | ||||||||
| [59] | Norway. 1613 employees. 54% women | H | M | Negative acts (22 items) W = M | |||||||
| [60] | France. 8058 rail employees 85% women | H | M | Time pressure and demanding workload (number of items not specified) W > M | Physical aggression (1 item) Psychological aggression (1 items) W = M | Conflicting situations (1 item) W > M | |||||
| Level of responsibilities (number of items not specified) M > W | |||||||||||
| [61] | Sweden. 200 physicians. 47% women | H | S | Job challenge (3 items) W = M | |||||||
| [62] | New Zealand. 197 veterinary. 60% women | M | VS | Negative acts (22 items) W > M; Cyber bullying (20 items) W = M | |||||||
| [63] | Finland. 3230 physicians. 61.5% women | H | L | Time pressure (5 items) W > M | Patient related stress (3 items) W = M | Team relationships (4 items) W > M | |||||
| [64] | USA. 624 participants. 46% women | H | S | Job Demands (7 items) W = M | Training opportunities (12 items), career opportunities (10 items), fairness of rewards (8 items) W = M | ||||||
| developmental opportunities (5 items) W > M | |||||||||||
| [65] | USA 1st release of 2014 General Social Survey. 1084 workers. 48% women | M | M | Overwork (1 item) W = M | Respectful work environment (1 item), Good relationship between workers and managers (1 item), Team work (1 item) W = M | ||||||
| [66] | Japan. 2989 employees. 27% women | H | L | ||||||||
| [67] | Korea. 512 police officers. 13% women | H | S | Police job characteristics (3 items) W = M | Community relationships (4 items) W = M | ||||||
| [68] | South Korea Hospital Health. 56,581 individuals. 17% women | L | L | Job demands (8 items) W = M | Improper rewards (6 items) W = M | Relationships (4 items) W = M | |||||
| [69] | US and Canada. 533. 53% women | H | S | Work overload (4 items) W > M | |||||||
| [70] | Japan. 3053 civil servants. 32% women | H | M | Job Demands (NA) W > M | |||||||
| [71] | Italy. 611 workers. 40% women | H | S | Job Demands (NA) W > M | |||||||
| [27] | USA. 501 Prison officers. 54% women | H | S | ||||||||
| [72] | Australia. 13,182 participants. 47% women | H | L | ||||||||
| [73] | Spain. 565 police agents. 13% women | L | S | Job Demands (NA) W = M | (NA) W = M | ||||||
| [74] | USA. Pew Internet and American Life Project data, 2002. 998 participants. 47% women | H | S | Email stress W = M | |||||||
| [16] | Canada. 1935 workers. 49% women | H | M | Psychological demands (9 items) W = M, Physical demands (1 item) M > W | Recognition (6 items), Career perspective (4 items) W = M | Abusive supervision (15 items) W = M | Interpersonal conflicts (5 items) W = M | ||||
| [75] | Italy. 6378 workers. 34% women | H | M | Job demands (8 items) W = M | Quality of relationships at work (4 items) M > W | ||||||
| [76] | Canada. 2840 police officers. 23% women | H | L | Overtime demands W = M excessive admin duties M > W, Too much computer work M > W, Risk of being injured on the job M > W | Negative comments from public (1 item) W = M | ||||||
| [77] | Spain. 201 participants. 23% women | M | S | Work content W = M | |||||||
| [78] | Sweden (SLOSH) 2010 survey. 9132 participants. 52% women | H | L | Quantitative demands (1 item), conflicting demands (1 item) W = M | Emotional demands (1 item) W > M | Effort rewards balance (10 items) W = M | Conflicts with superiors (1 item) M > W, conflicts with co-workers questions (1 item) W = M | ||||
| [79] | USA. 693 participants. 58% women | H | S | Mental Labour W > M, Job-specific Mental Labour M > W | |||||||
| [80] | USA. 213 employees. 49% women | H | S | Illegitimate tasks (8 items) W = M | Effort reward balance (13 items) W = M | ||||||
| [81] | Sweden. 856 patrolling police officers. 51% women | H | S | Psychological demands (5 items) W = M | |||||||
| [82] | USA. 117 university faculty. 31% women | M | Vs | Interpersonal conflict (7 items) W = M | Scholarly isolation (5 items) W = M | ||||||
| [83] | Germany. 3340 participants. 53% women | H | M | Effort reward balance (11 items) M > W | |||||||
| [14] | Spain. 7512 participants. 37% women | H | L | Quantitative and qualitative demands (3 items) M > W | (1 item) W > M | ||||||
| [84] | Italy. 283 participants. 48% women | H | S | ||||||||
| [85] | Finland. 4392 participants. 54% women | H | L | (1 item) W > M | |||||||
| [86] | Spain. 427 participants. 51% women | H | S | ||||||||
| [87] | Europe. 5th European Working Conditions Survey (2010). 33,443 employees. 51% women | H | L | ||||||||
| [88] | Europe. 5th European Working Conditions Survey (2010). 33,443 employees. 51% women | H | L | Quantitative demands (1 item), demands for responsibility (1 item) M > W | Emotional demands (1 item), demands for hiding emotions (1 item) W > M | Possibility for development (3 items) W = M | Bullying (1 item) Discrimination (7 items) W > M | Sexual harassment (1 item) W > M, Physical violence (1 item) W = M | Sense of community (1 item) W = M | ||
| [89] | Europe. 5th European Working Conditions Survey (2010). 33,443 employees. 51% women | H | L | ||||||||
| [90] | Greece. 231 adults. 59% women | M | S | Interpersonal Conflict at work (4 items) M > W | |||||||
| [91] | Japan. 5878 workers. 38% women | H | L | Job demand (7 items) W = M | Interpersonal Conflict at work (6 items) M > W | ||||||
| [92] | Australia. 277 construction professionals. 40% women | H | S | Job demands (4 items) W = M | (1 item) W = M | (1 item) W > M | Sexual harassment at work (1 item) W > M, Violence at work (1 item) W = M | Conflicts with co-workers or colleagues (1 item), Poor relationships with superiors (1 item) W = M | Social or physical isolation from others (1 item) W = M | ||
| [93] | Sweden 2005 STAGE survey. 11,916 twins. 49% women | H | L | Job demands W = M | |||||||
| [94] | Japan. 1642 healthcare employees. 77% women | H | M | Personal related bullying (6 items) M > W, Work related bullying (3 items) W = M | Sexual harassment (3 items) M > W | ||||||
| [95] | France. 200 nurses. 55% women | M | S | Job demands (9 items) W = M | |||||||
| [96] | Japan. 244 psychiatric nurses. 65% women | M | S | Negative emotion from patients (6 items), Communication with patients (2 items) W = M | |||||||
| [97] | USA. 1023 general surgery residents. 28% women | H | S | ||||||||
| [98] | Sweden. STAGE survey, 2005. 14,516 twins. 56% women | H | L | Job demands W = M | |||||||
| [99] | Italy. 8992 workers. 46% women | M | L | (38 items) W = M | |||||||
| [100] | Italy. 107 office workers. 31% women | M | Vs | Job demands M > W | Quality of relationships W = M | ||||||
| [101] | Italy. 843 call centre workers. 59% women | H | S | Job demands (7 items) W > M | Emotional dissonance (4 items) W > M | Customer aggression (4 items) W > M | |||||
| [102] | Germany. 261 oncologists. 30% women | H | S | Stress by compassion (13 items) W > M | Disagreeable patients (8 items) W = M | Problems with colleagues (6 items) W > M | |||||
| [103] | France. 7709 workers. 51% women | H | L | Psychological demands (3 items) M > W | (1 item) W > M | (1 item) W = M | |||||
| [104] | Europe. 4th European Working Conditions Survey 2005. 29,680 participants. 50% women | H | L | Psychological demands (5 items) W > M | Bullying (1 item), Discriminations (7 items) W > M | Sexual harassment (1 item) W > M, Physical violence (3 items) W = M | |||||
| [105] | USA Wisconsin Longitudinal Study. 2809 participants. 54% women | H | M | Working under pressure (1 item), Hours doing the same task (1 item) W = M | |||||||
| [13] | Sweden SLOSH waves 2008 and 2010. 6177 workers. 56% women | H | L | Job demands (5 items) W > M | |||||||
| [106] | Sweden. Malmo Shoulder and Neck Study (MSNS). 6540 participants. 51% women | H | L | Psychological demands M > W | |||||||
| [107] | Japan. 538 call centre workers. 68% women | H | S | Job demands (3 items) M > W | |||||||
| [108] | Turkey. 221 Physical Education teachers. 44% women | M | S | ||||||||
| [109] | Sweden. 940 workers. 54% women | H | S | Job demands (3 items) Effort (NA) W = M | Reward (NA) Effort reward balance (NA) M > W | ||||||
| ID | Sample | Q | S | Role Stressors | Support | Autonomy and Control | |||
|---|---|---|---|---|---|---|---|---|---|
| Broad Social Support | Co-Worker | Supervisor | Other | ||||||
| [48] | Europe. 5th European Working Condition Survey (EWCS) (2010). 33,907 employees. 46% women | H | L | (1 item) W = M | (6 items) W = M | Decision authority (7 items) Skill discretions (5 items) W > M | |||
| [49] | USA. 2010 Health and Retirement Study (HRS). 2292 individuals. 56% women | H | M | (4 items) M > W | |||||
| [50] | Europe. 4th European Working Conditions Survey (EWCS). 16,141 individuals. 51% women | H | L | 1 item Scandinavia and Netherlands: M > W; Rest of Europe: W = M | Personal control over work activity (10 items), Scandinavia and Netherlands: M > W; Rest of Europe: M = W | ||||
| [51] | Germany iCEPT study. 381 Physicians. 79% women | M | S | (1 item) W = M | (1 item) W = M | Control (4 items) W > M | |||
| [53] | Spain. 506 public and private full-time professionals. 63% women | H | S | Decision latitude (9 items) W = M | |||||
| [53] | UK, Royal forces employees 2007 Work Well-Being. 2516 participants. 54% women in the junior rates, 28% women in the senior rates, 41% women officers | H | M | Autonomy and control (5 items) W = M | |||||
| [54] | Germany. 1384 health care professionals. 70% women | H | M | ||||||
| [55] | UK. 7 NHS organisations. 2950 staff. 72% women | M | M | ||||||
| [56] | Belgium. 3821 workers. 60% women | H | M | (8 items) W = M | Social support outside work (4 items) W = M | ||||
| [57] | Poland. 1313 transportation company employees. 27% women | H | M | ||||||
| [58] | China, Hong Kong, New Zealand and Australia. 2183. 76% women | H | M | (4 items) W = M | Family support (4 items) W > M | ||||
| [59] | Norway. 1613 employees. 54% women | H | M | ||||||
| [60] | France. 8058 rail employees. 85% women | H | M | ||||||
| [61] | Sweden. 200 physicians. 47% women | H | S | Role overload (3 items), Role conflict (5 items), Role ambiguity (4 items) W = M | Cohesiveness (2 items), Cooperation (2 items) M > W | Autonomy (4 items), knowledge of results (5 items) W = M | |||
| [62] | New Zealand. 197 veterinary. 60% women | M | VS | ||||||
| [63] | Finland. 3230 physicians. 61.5% women | H | L | Decision authority (3 items) M > W | |||||
| [64] | USA. 624 participants. 46% women | H | S | Role ambiguity (4 items) W = M | (4 items) W = M | (4 items) M > W | Decision latitude (4 items) W = M | ||
| [65] | USA 1st release of 2014 General Social Survey. 1084 workers. 48% women | M | M | ||||||
| [66] | Japan. 2989 employees. 27% women | H | L | Role Ambiguity (6 items) W > M | |||||
| [67] | Korea. 512 police officers. 13% women | H | S | Job feedback (1 item) M > W | Autonomy (1 item) M > W | ||||
| [68] | South Korea Hospital Health. 56,581 individuals. 17% women | L | L | Job autonomy (5 items) W = M | |||||
| [69] | US and Canada. 533. 53% women | H | S | ||||||
| [70] | Japan. 3053 civil servants. 32% women | H | M | (NA) W > M | Decision latitude (NA) M > W | ||||
| [71] | Italy. 611 workers. 40% women | H | S | Decision latitude (NA) W > M | |||||
| [27] | USA. 501 Prison officers. 54% women | H | S | Role problems (5 items) M > W | (5 items) M > W | (5 items) W = M | (5 items) W = M | ||
| [72] | Australia. 13,182 participants. 47% women | H | L | Job control (5 items) M > W | |||||
| [73] | Spain. 565 police agents. 13% women | L | S | Organisational Support (NA) W = M | Control (NA) W = M | ||||
| [74] | USA. Pew Internet and American Life Project data, 2002. 998 participants. 47% women | H | S | ||||||
| [16] | Canada. 1935 workers. 49% women | H | M | (4 items) W = M | (4 items) W = M | Social support outside work (4 items) W > M | Decision latitude (3 items) M > W | ||
| [75] | Italy. 6378 workers. 34% women | H | M | (5 items) W = M | (4 items) M > W | (5 items) W = M | Control (6 items) W = M | ||
| [76] | Canada. 2840 police officers. 23% women | H | L | Dealing with supervisors, Inconsistent leadership style W = M | Lack of understanding from family and friends about your work W = M | ||||
| [77] | Spain. 201 participants. 23% women | M | S | Role definition W = M | Personal relations (self-esteem, social support and perceived integration) W = M | ||||
| [78] | Sweden (SLOSH) 2010 survey. 9132 participants. 52% women | H | L | (1 item) W > M | Poor leadership (10 items) W = M | Influence at work (1 item) M > W | |||
| [79] | USA. 693 participants. 58% women | H | S | ||||||
| [80] | USA. 213 employees. 49% women | H | S | ||||||
| [81] | Sweden. 856 patrolling police officers. 51% women | H | S | (6 items) W = M | Decision latitude (6 items) W = M | ||||
| [82] | USA. 117 university faculty. 31% women | M | Vs | Co-worker social support (5 items) W = M | |||||
| [83] | Germany—3340 participants. 53% women | H | M | ||||||
| [14] | Spain. 7512 participants. 37% women | H | L | (1 item) W = M | (1 item) W = M | Control (4 items) W = M | |||
| [84] | Italy. 283 participants. 48% women | H | S | Decision making (4 items) W = M | |||||
| [85] | Finland. 4392 participants. 54% women | H | L | ||||||
| [86] | Spain. 427 participants. 51% women | H | S | Family support (8 items) M > W | |||||
| [87] | Europe. 5th European Working Conditions Survey (2010). 33,443 employees. 51% women | H | L | ||||||
| [88] | Europe. 5th European Working Conditions Survey (2010). 33,443 employees. 51% women | H | L | Role clarity (1 item) W > M | Help and support from colleagues (1 item) W > M | Quality of Leadership (5 items) M > W | Degree of freedom (3 items) M > W | ||
| Role conflict (2 items) W = M | |||||||||
| [89] | Europe. 5th European Working Conditions Survey (2010). 33,443 employees. 51% women | H | L | ||||||
| [90] | Greece. 231 adults. 59% women | M | S | ||||||
| [91] | Japan. 5878 workers. 38% women | H | L | Job control (3 items) W = M | |||||
| [91] | Australia. 277 construction professionals. 40% women | H | S | Role ambiguity (1 item) W = M | Support at home (1 item), Support for problem solving (1 item) W = M | Job autonomy (1 item) W = M | |||
| [93] | Sweden 2005 STAGE survey. 11,916 twins. 49% women | H | L | W = M | Decision latitude W = M | ||||
| [94] | Japan. 1642 healthcare employees. 77% women | H | M | ||||||
| [95] | France. 200 nurses. 55% women | M | S | (8 items) M > W | Decision latitude (9 items) W = M | ||||
| [96] | Japan. 244 psychiatric nurses. 65% women | M | S | ||||||
| [97] | USA. 1023 general surgery residents. 28% women | H | S | Control At Work (3 items) M > W | |||||
| [98] | Sweden. STAGE survey, 2005. 14,516 twins. 56% women | H | L | M > W | Decision latitude M > W | ||||
| [99] | Italy. 8992 workers. 46% women | M | L | ||||||
| [100] | Italy. 107 office workers. 31% women | M | Vs | Role stressor W = M | Support among colleague W = M | Support from managers W = M | Control W = M | ||
| [101] | Italy. 843 call centre workers. 59% women | H | S | (4 items) W = M | (4 items) W = M | Decision latitude (7 items) W = M | |||
| [102] | Germany. 261 oncologists. 30% women | H | S | ||||||
| [103] | France. 7709 workers. 51% women | H | L | Role conflict (1 item) W > M | Good relationships with colleagues (1 item) W = M | Decision latitude (2 items) W = M | |||
| [104] | Europe. 4th European Working Conditions Survey 2005. 29,680 participants. 50% women | H | L | Social support (4 items) W > M | Decision latitude (4 items) M > W | ||||
| [105] | USA Wisconsin Longitudinal Study. 2809 participants. 54% women | H | M | Job authority (2 items) M > W | |||||
| [13] | Sweden SLOSH waves 2008 and 2010. 6177 workers. 56% women | H | L | Decision latitude (2 items) M > W | |||||
| [106] | Sweden. Malmo Shoulder and Neck Study (MSNS). 6540 participants. 51% women | H | L | (6 items) W > M | Decision latitude M > W | ||||
| [107] | Japan. 538 call centre workers. 68% women | H | S | (3 items) W = M | (3 items) M > W | Decision latitude (3 items) M > W | |||
| [108] | Turkey. 221 Physical Education teachers. 44% women | M | S | (6 items) W > M | |||||
| [109] | Sweden. 940 workers. 54% women | H | S | Decision latitude (3 items) M > W | |||||
References
- United Nations. 17 Goals to Transform Our World. Available online: https://www.un.org/sustainabledevelopment/ (accessed on 15 August 2022).
- Jarman, J.; Blackburn, R.M.; Racko, G. The Dimensions of Occupational Gender Segregation in Industrial Countries. Sociology 2012, 46, 1003–1019. [Google Scholar] [CrossRef]
- Bishu, S.G.; Alkadry, M.G. A Systematic Review of the Gender Pay Gap and Factors That Predict It. Adm. Soc. 2017, 49, 65–104. [Google Scholar] [CrossRef]
- Durbin, S.; Fleetwood, S. Gender Inequality in Employment: Editors’ Introduction. In Equality, Diversity and Inclusion; Emerald Publishing: Bingley, UK, 2010. [Google Scholar]
- Wilson, F.M. Women in Management in the United Kingdom. In Women in Management Worldwide; Taylor Francis Group: Gower, UK, 2016; pp. 109–120. [Google Scholar]
- Gyllensten, K.; Palmer, S. The Role of Gender in Workplace Stress: A Critical Literature Review. Health Educ. J. 2005, 64, 271–288. [Google Scholar] [CrossRef]
- Evans, O.; Steptoe, A. The Contribution of Gender-Role Orientation, Work Factors and Home Stressors to Psychological Well-Being and Sickness Absence in Male-and Female-Dominated Occupational Groups. Soc. Sci. Med. 2002, 54, 481–492. [Google Scholar] [CrossRef]
- Purvanova, R.K.; Muros, J.P. Gender Differences in Burnout: A Meta-Analysis. J. Vocat. Behav. 2010, 77, 168–185. [Google Scholar] [CrossRef]
- Platt, J.; Prins, S.; Bates, L.; Keyes, K. Unequal Depression for Equal Work? How the Wage Gap Explains Gendered Disparities in Mood Disorders. Soc. Sci. Med. 2016, 149, 1–8. [Google Scholar] [CrossRef]
- Silva-Costa, A.; Rotenberg, L.; Nobre, A.A.; Schmidt, M.I.; Chor, D.; Griep, R.H. Gender-Specific Association between Night-Work Exposure and Type-2 Diabetes: Results from Longitudinal Study of Adult Health, ELSA-Brasil. Scand. J. Work Envrion. Health 2015, 41, 569–578. [Google Scholar] [CrossRef]
- Stansfeld, S.; Candy, B. Psychosocial Work Environment and Mental Health—A Meta-Analytic Review. Scand. J. Work Envrion. Health 2006, 32, 443–462. [Google Scholar] [CrossRef]
- López-López, I.M.; Gómez-Urquiza, J.L.; Cañadas, G.R.; De la Fuente, E.I.; Albendín-García, L.; Cañadas-De la Fuente, G. Prevalence of Burnout in Mental Health Nurses and Related Factors: A Systematic Review and Meta-analysis. Int. J. Ment. Health Nurs. 2019, 28, 1035–1044. [Google Scholar] [CrossRef]
- Theorell, T.; Hammarström, A.; Gustafsson, P.E.; Hanson, L.M.; Janlert, U.; Westerlund, H. Job Strain and Depressive Symptoms in Men and Women: A Prospective Study of the Working Population in Sweden. J. Epidemiol. Community Health 2014, 68, 78–82. [Google Scholar] [CrossRef]
- Rivera-Torres, P.; Araque-Padilla, R.A.; Montero-Simó, M.J. Job Stress across Gender: The Importance of Emotional and Intellectual Demands and Social Support in Women. Int. J. Envrion. Res. Public Health 2013, 10, 375–389. [Google Scholar] [CrossRef]
- Abubakar, A.M.; Foroutan, T.; Megdadi, K.J. An Integrative Review: High-Performance Work Systems, Psychological Capital and Future Time Perspective. Int. J. Organ. Anal. 2019, 27, 1093–1110. [Google Scholar] [CrossRef]
- Marchand, A.; Bilodeau, J.; Demers, A.; Beauregard, N.; Durand, P.; Haines, V.Y., III. Gendered Depression: Vulnerability or Exposure to Work and Family Stressors? Soc. Sci. Med. 2016, 166, 160–168. [Google Scholar] [CrossRef]
- Artazcoz, L.; Borrell, C.; Cortàs, I.; Escribà-Agüir, V.; Cascant, L. Occupational Epidemiology and Work Related Inequalities in Health: A Gender Perspective for Two Complementary Approaches to Work and Health Research. J. Epidemiol. Community Health 2007, 61 (Suppl. S2), ii39–ii45. [Google Scholar] [CrossRef]
- Leka, S.; Cox, T.; Zwetsloot, G. The European Framework for Psychosocial Risk Management (PRIMA-EF); Leka, S., Cox, T., Eds.; World Health Organization: Geneva, Switzerland, 2008; pp. 1–16. [Google Scholar]
- Bauer, D.J.; Shanahan, M.J. Modeling Complex Interactions: Person-Centered and Variable-Centered Approaches. Model. Context. Eff. Longitud. Stud. 2007, 21, 255–283. [Google Scholar]
- Shockley, K.M.; Shen, W.; DeNunzio, M.M.; Arvan, M.L.; Knudsen, E.A. Disentangling the Relationship between Gender and Work–Family Conflict: An Integration of Theoretical Perspectives Using Meta-Analytic Methods. J. Appl. Psychol. 2017, 102, 1601. [Google Scholar] [CrossRef]
- Cousins, R.; Mackay, C.J.; Clarke, S.D.; Kelly, C.; Kelly, P.J.; McCaig, R.H. ‘Management Standards’ Work-Related Stress in the UK: Practical Development. Work Stress 2004, 18, 113–136. [Google Scholar] [CrossRef]
- Health and Safety Executive. Tackling Work-Related Stress: A Managers’ Guide to Improving and Maintaining Employee Health and Well-Being; HSE Books: Sudbury, UK, 2001. [Google Scholar]
- Booth, A. Clear and Present Questions: Formulating Questions for Evidence Based Practice. Libr. Hi Tech 2006, 24, 355–368. [Google Scholar] [CrossRef]
- Sarkis-Onofre, R.; Catalá-López, F.; Aromataris, E.; Lockwood, C. How to Properly Use the PRISMA Statement. Syst. Rev. 2021, 10, 117. [Google Scholar] [CrossRef]
- Snape, L.; Atkinson, C. The Evidence for Student-Focused Motivational Interviewing in Educational Settings: A Review of the Literature. Adv. Sch. Ment. Health Promot. 2016, 9, 119–139. [Google Scholar] [CrossRef]
- Higgins, J.P.T.; Green, S.; Scholten, R. Maintaining Reviews: Updates, Amendments and Feedback. In Cochrane Handbook for Systematic Reviews of Interventions; Wiley: Hoboken, NJ, USA, 2008; pp. 31–49. [Google Scholar]
- Lambert, E.G.; Kim, B.; Keena, L.D.; Cheeseman, K. Testing a Gendered Models of Job Satisfaction and Work Stress among Correctional Officers. J. Crime Justice 2017, 40, 188–203. [Google Scholar] [CrossRef]
- Acker, J. Hierarchies, Jobs, Bodies: A Theory of Gendered Organizations. Gend. Soc. 1990, 4, 139–158. [Google Scholar] [CrossRef]
- Gascoigne, C.; Parry, E.; Buchanan, D. Extreme Work, Gendered Work? How Extreme Jobs and the Discourse of ‘Personal Choice’Perpetuate Gender Inequality. Organization 2015, 22, 457–475. [Google Scholar] [CrossRef]
- OECD. Gender Equality in Public Sector Employment. In Government at a Glance 2019; OECD Publishing, Ed.; OECD Publishing: Washington, DC, USA, 2019. [Google Scholar] [CrossRef]
- Guy, M. Mom Work versus Dad Work in Local Government. Adm Soc 2017, 49, 48–64. [Google Scholar] [CrossRef]
- Connell, R. Glass Ceilings or Gendered Institutions? Mapping the Gender Regimes of Public Sector Worksites. Public Adm Rev 2006, 66, 837–849. [Google Scholar] [CrossRef]
- di Tecco, C.; Ghelli, M.; Iavicoli, S.; Persechino, B.; Ronchetti, M. The Methodology for The Assessment and Management of Work-Related Stress Risk. 2018. Available online: https://www.inail.it/cs/internet/docs/alg-the-methodology-for-the-assessment.pdf (accessed on 17 December 2022).
- Istituto Nazionale di Statistica (ISTAT). Censimento Permanente Delle Istituzioni Pubbliche 2017: I Principali Risultati. 2017. Available online: https://www.istat.it/it/files//2019/12/Report_CENSIMENTO-ISTITUZIONI-PUBBLICHE-_2017.pdf (accessed on 20 April 2021).
- Rondinone, B.M.; Persechino, B.; Castaldi, T.; Valenti, A.; Ferrante, P.; Ronchetti, M.; Iavicoli, S. Work-Related Stress Risk Assessment in Italy: The Validation Study of Health Safety and Executive Indicator Tool. G. Ital. Di Med. Del Lav. Ed Ergon. 2012, 34, 392–399. [Google Scholar]
- Wood, S.; Ghezzi, V.; Barbaranelli, C.; di Tecco, C.; Fida, R.; Farnese, M.L.; Ronchetti, M.; Iavicoli, S. Assessing the Risk of Stress in Organizations: Getting the Measure of Organizational-Level Stressors. Front. Psychol. 2019, 10, 2776. [Google Scholar] [CrossRef]
- Morin, A.J.S.; Bujacz, A.; Gagné, M. Person-Centered Methodologies in the Organizational Sciences: Introduction to the Feature Topic; Sage Publications Sage CA: Los Angeles, CA, USA, 2018. [Google Scholar]
- Morin, A.J.S.; Boudrias, J.-S.; Marsh, H.W.; Madore, I.; Desrumaux, P. Further Reflections on Disentangling Shape and Level Effects in Person-Centered Analyses: An Illustration Exploring the Dimensionality of Psychological Health. Struct. Equ. Model. 2016, 23, 438–454. [Google Scholar] [CrossRef]
- Muthén, L.K.; Muthén, B.O. Mplus User’s Guide, 8th ed.; Muthén & Muthén: Los Angeles, CA, USA, 2017. [Google Scholar]
- Stapleton, L.M. An Assessment of Practical Solutions for Structural Equation Modeling with Complex Sample Data. Struct. Equ. Model. 2006, 13, 28–58. [Google Scholar] [CrossRef]
- Millsap, R.E. Statistical Approaches to Measurement Invariance; Routledge: Abingdon, UK, 2012. [Google Scholar]
- McNeish, D. Thanks Coefficient Alpha, We’ll Take It from Here. Psychol. Methods 2018, 23, 412. [Google Scholar] [CrossRef]
- Morin, A.J.S.; Maiano, C.; Nagengast, B.; Marsh, H.W.; Morizot, J.; Janosz, M. General Growth Mixture Analysis of Adolescents’ Developmental Trajectories of Anxiety: The Impact of Untested Invariance Assumptions on Substantive Interpretations. Struct. Equ. Model. 2011, 18, 613–648. [Google Scholar] [CrossRef]
- Morin, A.J.S.; Arens, A.K.; Marsh, H.W. A Bifactor Exploratory Structural Equation Modeling Framework for the Identification of Distinct Sources of Construct-Relevant Psychometric Multidimensionality. Struct. Equ. Model. 2016, 23, 116–139. [Google Scholar] [CrossRef]
- Simon, R.W. Gender, Multiple Roles, Role Meaning, and Mental Health. J. Health Soc. Behav. 1995, 36, 182–194. [Google Scholar] [CrossRef]
- Baruch, G.K.; Biener, L.; Barnett, R.C. Women and Gender in Research on Work and Family Stress. Am. Psychol. 1987, 42, 130. [Google Scholar] [CrossRef]
- Ahrendt, D.; Cabrita, J.; Clerici, E.; Hurley, J.; Leončikas, T.; Mascherini, M.; Riso, S.; Sándor, E. Living, Working and COVID-19. 2020. Available online: https://www.eurofound.europa.eu/publications/report/2020/living-working-and-covid-19 (accessed on 17 December 2022).
- Ardito, C.; d’Errico, A.; Leombruni, R. Exposure to Psychosocial Factors at Work and Mental Well-Being in Europe. Med. Lav. 2014, 105, 85–99. [Google Scholar]
- Attell, B.K.; Brown, K.K.; Treiber, L.A. Workplace Bullying, Perceived Job Stressors, and Psychological Distress: Gender and Race Differences in the Stress Process. Soc. Sci. Res. 2017, 65, 210–221. [Google Scholar] [CrossRef]
- Bartoll, X.; Cortès, I.; Artazcoz, L. Full-and Part-Time Work: Gender and Welfare-Type Differences in European Working Conditions, Job Satisfaction, Health Status, and Psychosocial Issues. Scand. J. Work Environ. Health 2014, 40, 370–379. [Google Scholar] [CrossRef]
- Bauer, J.; Groneberg, D.A.; Brueggmann, D. Gender-Based Workplace Assessment in Gynecology and Obstetrics in Germany: Results from the ICEPT Study. Arch. Gynecol. Obs. 2016, 294, 317–326. [Google Scholar] [CrossRef]
- Blanch, A.; Aluja, A. Psychosocial Work Dimensions, Personality, and Body Mass Index: Sex Differences. Int. J. Occup. Med. Environ. Health 2013, 26, 572–580. [Google Scholar] [CrossRef]
- Bridger, R.S.; Day, A.J.; Morton, K. Occupational Stress and Employee Turnover. Ergonomics 2013, 56, 1629–1639. [Google Scholar] [CrossRef]
- Büssing, A.; Falkenberg, Z.; Schoppe, C.; Recchia, D.R.; Poier, D. Work Stress Associated Cool down Reactions among Nurses and Hospital Physicians and Their Relation to Burnout Symptoms. BMC Health Serv. Res. 2017, 17, 1–13. [Google Scholar] [CrossRef]
- Carter, M.; Thompson, N.; Crampton, P.; Morrow, G.; Burford, B.; Gray, C.; Illing, J. Workplace Bullying in the UK NHS: A Questionnaire and Interview Study on Prevalence, Impact and Barriers to Reporting. BMJ Open 2013, 3, e002628. [Google Scholar] [CrossRef]
- Casini, A.; Godin, I.; Clays, E.; Kittel, F. Gender Difference in Sickness Absence from Work: A Multiple Mediation Analysis of Psychosocial Factors. Eur. J. Public Health 2013, 23, 635–642. [Google Scholar] [CrossRef]
- Drabek, M.; Merecz, D. Job Stress, Occupational Position and Gender as Factors Differentiating Workplace Bullying Experience. Med. Pract. 2013, 64, 283–296. [Google Scholar] [CrossRef]
- Drummond, S.; O’Driscoll, M.P.; Brough, P.; Kalliath, T.; Siu, O.-L.; Timms, C.; Riley, D.; Sit, C.; Lo, D. The Relationship of Social Support with Well-Being Outcomes via Work–Family Conflict: Moderating Effects of Gender, Dependants and Nationality. Hum. Relat. 2017, 70, 544–565. [Google Scholar] [CrossRef]
- Einarsen, S.; Nielsen, M.B. Workplace Bullying as an Antecedent of Mental Health Problems: A Five-Year Prospective and Representative Study. Int. Arch. Occup. Environ. Health 2015, 88, 131–142. [Google Scholar] [CrossRef]
- Evans, D.; Mallet, L.; Flahault, A.; Cothereau, C.; Velazquez, S.; Capron, L.; Lejoyeux, M. The Importance of Both Workplace and Private Life Factors in Psychological Distress: A Large Cross-Sectional Survey of French Railway Company Employees. Soc. Psychiatry Psychiatr. Epidemiol. 2013, 48, 1211–1224. [Google Scholar] [CrossRef]
- Falkenberg, H.; Näswall, K.; Lindfors, P.; Sverke, M. Working in the Same Sector, in the Same Organization and in the Same Occupation: Similarities and Differences between Women and Men Physicians’ Work Climate and Health Complaints. Nord. J. Work. Life Stud. 2015, 5, 67–84. [Google Scholar] [CrossRef]
- Gardner, D.H.; Rasmussen, W. Workplace Bullying and Relationships with Health and Performance among a Sample of New Zealand Veterinarians. N. Z. Vet. J. 2018, 66, 57–63. [Google Scholar] [CrossRef]
- Heponiemi, T.; Aalto, A.-M.; Pekkarinen, L.; Siuvatti, E.; Elovainio, M. Are There High-Risk Groups among Physicians That Are More Vulnerable to on-Call Work? Am. J. Emerg. Med. 2015, 33, 614–619. [Google Scholar] [CrossRef]
- Hoonakker, P.; Carayon, P.; Korunka, C. Using the Job-Demands-Resources Model to Predict Turnover in the Information Technology Workforce–General Effects and Gender Differences. Horiz. Psychol. 2013, 22, 51–65. [Google Scholar]
- Humpert, S. What Workers Want: Job Satisfaction in the US. Manag. Res. Pract. 2016, 8, 39–45. [Google Scholar]
- Inoue, A.; Kawakami, N.; Eguchi, H.; Tsutsumi, A. Interaction Effect of Job Insecurity and Role Ambiguity on Psychological Distress in Japanese Employees: A Cross-Sectional Study. Int. Arch. Occup. Environ. Health 2018, 91, 391–402. [Google Scholar] [CrossRef]
- Kim, J.L.; Wells, W.; Vardalis, J.J.; Johnson, S.K.; Lim, H. Gender Difference in Occupational Stress: A Study of the South Korean National Police Agency. Int. J. Law Crime Justice 2016, 44, 163–182. [Google Scholar] [CrossRef]
- Kim, K.; Lee, S.; Choi, Y.H. Relationship between Occupational Stress and Depressive Mood among Interns and Residents in a Tertiary Hospital, Seoul, Korea. Clin. Exp. Emerg. Med. 2015, 2, 117. [Google Scholar] [CrossRef]
- Korabik, K.; van Rhijn, T.; Ayman, R.; Lero, D.S.; Hammer, L.B. Gender, Polychronicity, and the Work–Family Interface: Is a Preference for Multitasking Beneficial? Community Work Fam 2017, 20, 307–326. [Google Scholar] [CrossRef]
- Koura, U.; Sekine, M.; Yamada, M.; Tatsuse, T. Work, Family, and Personal Characteristics Explain Occupational and Gender Differences in Work–Family Conflict among Japanese Civil Servants. Public Health 2017, 153, 78–90. [Google Scholar] [CrossRef]
- la Torre, G.; Sestili, C.; Mannocci, A.; Sinopoli, A.; de Paolis, M.; de Francesco, S.; Rapaccini, L.; Barone, M.; Iodice, V.; Lojodice, B. Association between Work Related Stress and Health Related Quality of Life: The Impact of Socio-Demographic Variables. A Cross Sectional Study in a Region of Central Italy. Int. J. Envrion. Res. Public Health 2018, 15, 159. [Google Scholar] [CrossRef]
- LaMontagne, A.D.; Krnjacki, L.; Kavanagh, A.M.; Bentley, R. Psychosocial Working Conditions in a Representative Sample of Working Australians 2001–2008: An Analysis of Changes in Inequalities over Time. Occup. Environ. Med. 2013, 70, 639–647. [Google Scholar] [CrossRef]
- Luceño Moreno, L.; García Albuerne, Y.; Talavera Velasco, B.; Martín García, J. Stress in Spanish Police Force Depending on Occupational Rank, Sex, Age and Work-Shift. Psicothema 2016, 28, 389–393. [Google Scholar]
- Mano, R.S. Gender Effects on Managerial Communication and Work Performance. Int. J. Cyber Behav. Psychol. Learn. (IJCBPL) 2013, 3, 34–46. [Google Scholar] [CrossRef]
- Marinaccio, A.; Ferrante, P.; Corfiati, M.; di Tecco, C.; Rondinone, B.M.; Bonafede, M.; Ronchetti, M.; Persechino, B.; Iavicoli, S. The Relevance of Socio-Demographic and Occupational Variables for the Assessment of Work-Related Stress Risk. BMC Public Health 2013, 13, 1–9. [Google Scholar] [CrossRef] [PubMed]
- McCreary, D.R.; Fong, I.; Groll, D.L. Measuring Policing Stress Meaningfully: Establishing Norms and Cut-off Values for the Operational and Organizational Police Stress Questionnaires. Police Pract. Res. 2017, 18, 612–623. [Google Scholar] [CrossRef]
- Navarro Moya, P.; González Carrasco, M.; Villar Hoz, E. Psychosocial Risk and Protective Factors for the Health and Well-Being of Professionals Working in Emergency and Non-Emergency Medical Transport Services, Identified via Questionnaires. Scand. J. Trauma Resusc. Emerg. Med. 2017, 25, 1–11. [Google Scholar] [CrossRef]
- Nyberg, A.; Leineweber, C.; Magnusson Hanson, L. Gender Differences in Psychosocial Work Factors, Work–Personal Life Interface, and Well-Being among Swedish Managers and Non-Managers. Int. Arch. Occup. Environ. Health 2015, 88, 1149–1164. [Google Scholar] [CrossRef]
- Offer, S. The Costs of Thinking about Work and Family: Mental Labor, Work–Family Spillover, and Gender Inequality among Parents in Dual-Earner Families. In Sociological Forum; Wiley Online Library: Hoboken, NJ, USA, 2014; Volume 29, pp. 916–936. [Google Scholar]
- Omansky, R.; Eatough, E.M.; Fila, M.J. Illegitimate Tasks as an Impediment to Job Satisfaction and Intrinsic Motivation: Moderated Mediation Effects of Gender and Effort-Reward Imbalance. Front. Psychol. 2016, 7, 1818. [Google Scholar] [CrossRef]
- Padyab, M.; Backteman-Erlanson, S.; Brulin, C. Burnout, Coping, Stress of Conscience and Psychosocial Work Environment among Patrolling Police Officers. J. Police Crim Psychol. 2016, 31, 229–237. [Google Scholar] [CrossRef]
- Pedersen, D.E.; Minnotte, K.L. Workplace Climate and STEM Faculty Women’s Job Burnout. J. Fem. Fam. Ther. 2017, 29, 45–65. [Google Scholar] [CrossRef]
- Peter, R.; March, S.; du Prel, J.-B. Are Status Inconsistency, Work Stress and Work-Family Conflict Associated with Depressive Symptoms? Testing Prospective Evidence in the LidA Study. Soc. Sci. Med. 2016, 151, 100–109. [Google Scholar] [CrossRef]
- Rollero, C.; Fedi, A.; de Piccoli, N. Gender or Occupational Status: What Counts More for Well-Being at Work? Soc. Indic. Res. 2016, 128, 467–480. [Google Scholar] [CrossRef]
- Salin, D. Risk Factors of Workplace Bullying for Men and Women: The Role of the Psychosocial and Physical Work Environment. Scand. J. Psychol. 2015, 56, 69–77. [Google Scholar] [CrossRef]
- Segado Sánchez-Cabezudo, S.; Lopez Pelaez, A. Social Work with Middle-class Spanish Families: The Challenge of the Work–Family Conflict. Int. J. Soc. Welf. 2014, 23, 100–111. [Google Scholar] [CrossRef]
- Schütte, S.; Chastang, J.-F.; Malard, L.; Parent-Thirion, A.; Vermeylen, G.; Niedhammer, I. Psychosocial Working Conditions and Psychological Well-Being among Employees in 34 European Countries. Int. Arch. Occup. Environ. Health 2014, 87, 897–907. [Google Scholar] [CrossRef]
- Schütte, S.; Chastang, J.-F.; Parent-Thirion, A.; Vermeylen, G.; Niedhammer, I. Psychosocial Work Exposures among European Employees: Explanations for Occupational Inequalities in Mental Health. J. Public Health (Bangk.) 2015, 37, 373–388. [Google Scholar] [CrossRef]
- Slany, C.; Schütte, S.; Chastang, J.-F.; Parent-Thirion, A.; Vermeylen, G.; Niedhammer, I. Psychosocial Work Factors and Long Sickness Absence in Europe. Int. J. Occup. Environ. Health 2014, 20, 16–25. [Google Scholar] [CrossRef]
- Stafyla, A.; Kaltsidou, G.; Spyridis, N. Gender Differences in Work Stress, Related to Organizational Conflicts and Organizational Constrains: An Empirical Research. Int. J. Econ. Sci. Appl. Res. 2013, 6, 91. [Google Scholar]
- Sugawara, N.; Yasui-Furukori, N.; Sasaki, G.; Tanaka, O.; Umeda, T.; Takahashi, I.; Danjo, K.; Matsuzaka, M.; Kaneko, S.; Nakaji, S. Gender Differences in Factors Associated with Suicidal Ideation and Depressive Symptoms among Middle-Aged Workers in Japan. Ind. Health 2013, 51, 202–213. [Google Scholar] [CrossRef]
- Sunindijo, R.Y.; Kamardeen, I. Work Stress Is a Threat to Gender Diversity in the Construction Industry. J. Constr. Eng. Manag. 2017, 143, 4017073. [Google Scholar] [CrossRef]
- Svedberg, P.; Mather, L.; Bergström, G.; Lindfors, P.; Blom, V. Work-Home Interference, Perceived Total Workload, and the Risk of Future Sickness Absence Due to Stress-Related Mental Diagnoses among Women and Men: A Prospective Twin Study. Int. J. Behav. Med. 2018, 25, 103–111. [Google Scholar] [CrossRef]
- Takaki, J.; Taniguchi, T.; Hirokawa, K. Associations of Workplace Bullying and Harassment with Pain. Int. J. Envrion. Res. Public Health 2013, 10, 4560–4570. [Google Scholar] [CrossRef]
- Trousselard, M.; Dutheil, F.; Naughton, G.; Cosserant, S.; Amadon, S.; Dualé, C.; Schoeffler, P. Stress among Nurses Working in Emergency, Anesthesiology and Intensive Care Units Depends on Qualification: A Job Demand-Control Survey. Int. Arch. Occup. Environ. Health 2016, 89, 221–229. [Google Scholar] [CrossRef] [PubMed]
- Yada, H.; Abe, H.; Omori, H.; Matsuo, H.; Masaki, O.; Ishida, Y.; Katoh, T. Differences in Job Stress Experienced by Female and Male J Apanese Psychiatric Nurses. Int. J. Ment. Health Nurs. 2014, 23, 468–476. [Google Scholar] [CrossRef] [PubMed]
- Zubair, M.H.; Hussain, L.R.; Williams, K.N.; Grannan, K.J. Work-Related Quality of Life of US General Surgery Residents: Is It Really so Bad? J. Surg. Educ. 2017, 74, e138–e146. [Google Scholar] [CrossRef] [PubMed]
- Blom, V.; Bodin, L.; Bergström, G.; Hallsten, L.; Svedberg, P. The Importance of Genetic and Shared Environmental Factors for the Associations between Job Demands, Control, Support and Burnout. PLoS ONE 2013, 8, e75387. [Google Scholar] [CrossRef]
- Campanini, P.; Conway, P.M.; Neri, L.; Punzi, S.; Camerino, D.; Costa, G. Workplace Bullying and Sickness Absenteeism. Epidemiol. Prev. 2013, 37, 8–16. [Google Scholar]
- de Sio, S.; Cedrone, F.; Sanità, D.; Ricci, P.; Corbosiero, P.; di Traglia, M.; Greco, E.; Stansfeld, S. Quality of Life in Workers and Stress: Gender Differences in Exposure to Psychosocial Risks and Perceived Well-Being. Biomed. Res. Int. 2017, 2017, 7340781. [Google Scholar] [CrossRef]
- Emanuel, F.; Molino, M.; Cortese, C.G.; Ghislieri, C. From Work Demands to Work Resources in Order to Overcome Work-Family Conflict in Call Centres: Gender Differences. Couns. G. Ital. Di Ric. Appl. 2014, 7, 293–305. [Google Scholar]
- Hipp, M.; Pilz, L.; Al-Batran, S.E.; Hautmann, M.G.; Hofheinz, R.-D. Workload and Quality of Life of Medical Doctors in the Field of Oncology in Germany-a Survey of the Working Group Quality of Life of the AIO for the Study Group of Internal Oncology. Oncol. Res. Treat 2015, 38, 154–159. [Google Scholar] [CrossRef]
- Murcia, M.; Chastang, J.-F.; Niedhammer, I. Psychosocial Work Factors, Major Depressive and Generalised Anxiety Disorders: Results from the French National SIP Study. J. Affect. Disord. 2013, 146, 319–327. [Google Scholar] [CrossRef]
- Niedhammer, I.; Chastang, J.-F.; Sultan-Taïeb, H.; Vermeylen, G.; Parent-Thirion, A. Psychosocial Work Factors and Sickness Absence in 31 Countries in Europe. Eur. J. Public Health 2013, 23, 622–629. [Google Scholar] [CrossRef]
- Pudrovska, T.; Karraker, A. Gender, Job Authority, and Depression. J. Health Soc. Behav. 2014, 55, 424–441. [Google Scholar] [CrossRef]
- Canivet, C.; Choi, B.; Karasek, R.; Moghaddassi, M.; Staland-Nyman, C.; Östergren, P.-O. Can High Psychological Job Demands, Low Decision Latitude, and High Job Strain Predict Disability Pensions? A 12-Year Follow-up of Middle-Aged Swedish Workers. Int. Arch. Occup. Environ. Health 2013, 86, 307–319. [Google Scholar] [CrossRef]
- Enoki, M.; Maeda, E.; Iwata, T.; Murata, K. The Association between Work-Related Stress and Autonomic Imbalance among Call Center Employees in Japan. Tohoku J. Exp. Med. 2017, 243, 321–328. [Google Scholar] [CrossRef]
- Kiremitci, O.; Gençer, R.T. The Relationship between Organizational Health Perceptions and Work-Related Behaviors of Physical Education Teachers: An Investigation of Gender Differences. Egit. Ve Bilim 2014, 39, 174. [Google Scholar] [CrossRef]
- Söderberg, M.; Härenstam, A.; Rosengren, A.; Schiöler, L.; Olin, A.-C.; Lissner, L.; Waern, M.; Torén, K. Psychosocial Work Environment, Job Mobility and Gender Differences in Turnover Behaviour: A Prospective Study among the Swedish General Population. BMC Public Health 2014, 14, 605. [Google Scholar] [CrossRef]


| Means, SDs, Factor Correlations and Reliability Coefficients (Men) | ||||||||
|---|---|---|---|---|---|---|---|---|
| M | SD | 1. | 2. | 3. | 4. | 5. | 6. | |
| 1. Role Clarity | 0.001 | 0.829 | 0.84/0.80 | |||||
| 2. Control | −0.054 | 0.871 | 0.43 | 0.80/0.82 | ||||
| 3. Demands | −0.053 | 0.876 | −0.22 | −0.26 | 0.84/0.84 | |||
| 4. Poor Relationships | −0.006 | 0.808 | −0.30 | −0.39 | 0.37 | 0.70/0.75 | ||
| 5. Peer Support | −0.006 | 0.750 | 0.46 | 0.42 | −0.35 | −0.44 | 0.84/0.83 | |
| 6. Management Support | 0.003 | 0.727 | 0.51 | 0.43 | −0.32 | −0.52 | 0.65 | 0.83/0.89 |
| Means, SDs, Factor Correlations and Reliability Coefficients (Women) | ||||||||
| M | SD | 1. | 2. | 3. | 4. | 5. | 6. | |
| 1. Role Clarity | −0.001 | 0.847 | 0.81/0.79 | |||||
| 2. Control | 0.055 | 0.827 | 0.35 | 0.79/0.80 | ||||
| 3. Demands | 0.055 | 0.925 | −0.15 | −0.31 | 0.84/0.85 | |||
| 4. Poor Relationships | 0.007 | 0.845 | −0.19 | −0.35 | 0.22 | 0.73/0.77 | ||
| 5. Peer Support | 0.006 | 0.834 | 0.29 | 0.41 | −0.26 | −0.46 | 0.83/0.83 | |
| 6. Management Support | −0.003 | 0.774 | 0.42 | 0.44 | −0.28 | −0.48 | 0.55 | 0.86/0.89 |
| k | #Par | Men (n = 5716) | Women (n = 5573) | ||||||||
|---|---|---|---|---|---|---|---|---|---|---|---|
| LL | AIC | BIC | SABIC | Entropy | LL | AIC | BIC | SABIC | Entropy | ||
| 1 | 12 | −46,102 | 92,228 | 92,308 | 92,308 | - | −45,023 | 90,069 | 90,149 | 90,111 | - |
| 2 | 19 | −41,372 | 82,782 | 82,909 | 82,848 | 0.870 | −41,420 | 82,878 | 83,004 | 82,944 | 0.815 |
| 3 | 26 | −39,952 | 79,956 | 80,129 | 80,047 | 0.824 | −40,299 | 80,650 | 80,822 | 80,739 | 0.785 |
| 4 | 33 | −39,471 | 79,007 | 79,227 | 79,122 | 0.766 | −39,908 | 79,883 | 80,101 | 79,996 | 0.790 |
| 5 | 40 | −39,049 | 78,178 | 78,444 | 78,317 | 0.815 | −39,499 | 79,078 | 79,343 | 79,216 | 0.766 |
| 6 | 47 | −38,740 | 77,575 | 77,887 | 77,738 | 0.799 | −39,299 | 78,693 | 79,004 | 78,855 | 0.780 |
| 7 | 54 | −38,458 | 77,023 | 77,382 | 77,211 | 0.790 | −39,096 | 78,301 | 78,658 | 78,487 | 0.791 |
| 8 | 61 | −38,260 | 76,641 | 77,047 | 76,853 | 0.7900 | −38,933 | 77,989 | 78,393 | 78,199 | 0.792 |
| Men | Women | |||
|---|---|---|---|---|
| % | Standardised Residuals | % | Standardised Residuals | |
| Profile 1 (At-Risk) | 5.1 | −0.2 | 5 | 0.2 |
| Profile 2 (Average) | 19.2 | −3.1 | 21.3 | 3.1 |
| Profile 3 (Virtuous) | 26.4 | 2.9 | 23 | −2.9 |
| Factor | Variable | df1 | df1 (df2 = 11,283) | F | p | Partial η2 |
|---|---|---|---|---|---|---|
| Profile Membership | Role Clarity | 2 | 11,283 | 2778.470 | <0.001 | 0.330 |
| Control | 2 | 11,283 | 3424.436 | <0.001 | 0.378 | |
| Demands | 2 | 11,283 | 1304.807 | <0.001 | 0.188 | |
| Poor Relationships | 2 | 11,283 | 5088.531 | <0.001 | 0.474 | |
| Peer Support | 2 | 11,283 | 6852.763 | <0.001 | 0.548 | |
| Management Support | 2 | 11,283 | 10,688.022 | <0.001 | 0.655 | |
| Gender | Role Clarity | 1 | 11,283 | 9.906 | 0.002 | 0.001 |
| Control | 1 | 11,283 | 51.896 | <0.001 | 0.005 | |
| Demands | 1 | 11,283 | 13.591 | <0.001 | 0.001 | |
| Poor Relationships | 1 | 11,283 | 15.561 | <0.001 | 0.001 | |
| Peer Support | 1 | 11,283 | 1.228 | 0.268 | 0 | |
| Management Support | 1 | 11,283 | 13.021 | <0.001 | 0.001 | |
| Profile Membership X Gender(Interaction) | Role Clarity | 2 | 11,283 | 48.137 | 0.000 | 0.008 |
| Control | 2 | 11,283 | 6.824 | 0.001 | 0.001 | |
| Demands | 2 | 11,283 | 22.671 | 0.000 | 0.004 | |
| Poor Relationships | 2 | 11,283 | 9.678 | 0.000 | 0.002 | |
| Peer Support | 2 | 11,283 | 0.646 | 0.524 | 0 | |
| Management Support | 2 | 11,283 | 5.608 | 0.004 | 0.001 |
Disclaimer/Publisher’s Note: The statements, opinions and data contained in all publications are solely those of the individual author(s) and contributor(s) and not of MDPI and/or the editor(s). MDPI and/or the editor(s) disclaim responsibility for any injury to people or property resulting from any ideas, methods, instructions or products referred to in the content. |
© 2023 by the authors. Licensee MDPI, Basel, Switzerland. This article is an open access article distributed under the terms and conditions of the Creative Commons Attribution (CC BY) license (https://creativecommons.org/licenses/by/4.0/).
Share and Cite
Fida, R.; Watson, D.; Ghezzi, V.; Barbaranelli, C.; Ronchetti, M.; Di Tecco, C. Is Gender an Antecedent to Workplace Stressors? A Systematic Review and an Empirical Study Using a Person-Centred Approach. Int. J. Environ. Res. Public Health 2023, 20, 5541. https://doi.org/10.3390/ijerph20085541
Fida R, Watson D, Ghezzi V, Barbaranelli C, Ronchetti M, Di Tecco C. Is Gender an Antecedent to Workplace Stressors? A Systematic Review and an Empirical Study Using a Person-Centred Approach. International Journal of Environmental Research and Public Health. 2023; 20(8):5541. https://doi.org/10.3390/ijerph20085541
Chicago/Turabian StyleFida, Roberta, David Watson, Valerio Ghezzi, Claudio Barbaranelli, Matteo Ronchetti, and Cristina Di Tecco. 2023. "Is Gender an Antecedent to Workplace Stressors? A Systematic Review and an Empirical Study Using a Person-Centred Approach" International Journal of Environmental Research and Public Health 20, no. 8: 5541. https://doi.org/10.3390/ijerph20085541