
Lead Exposure Can Affect Early Childhood Development and Could Be Aggravated by Stunted Growth: Perspectives from Mexico
 , , , and
Abstract
:1. Introduction
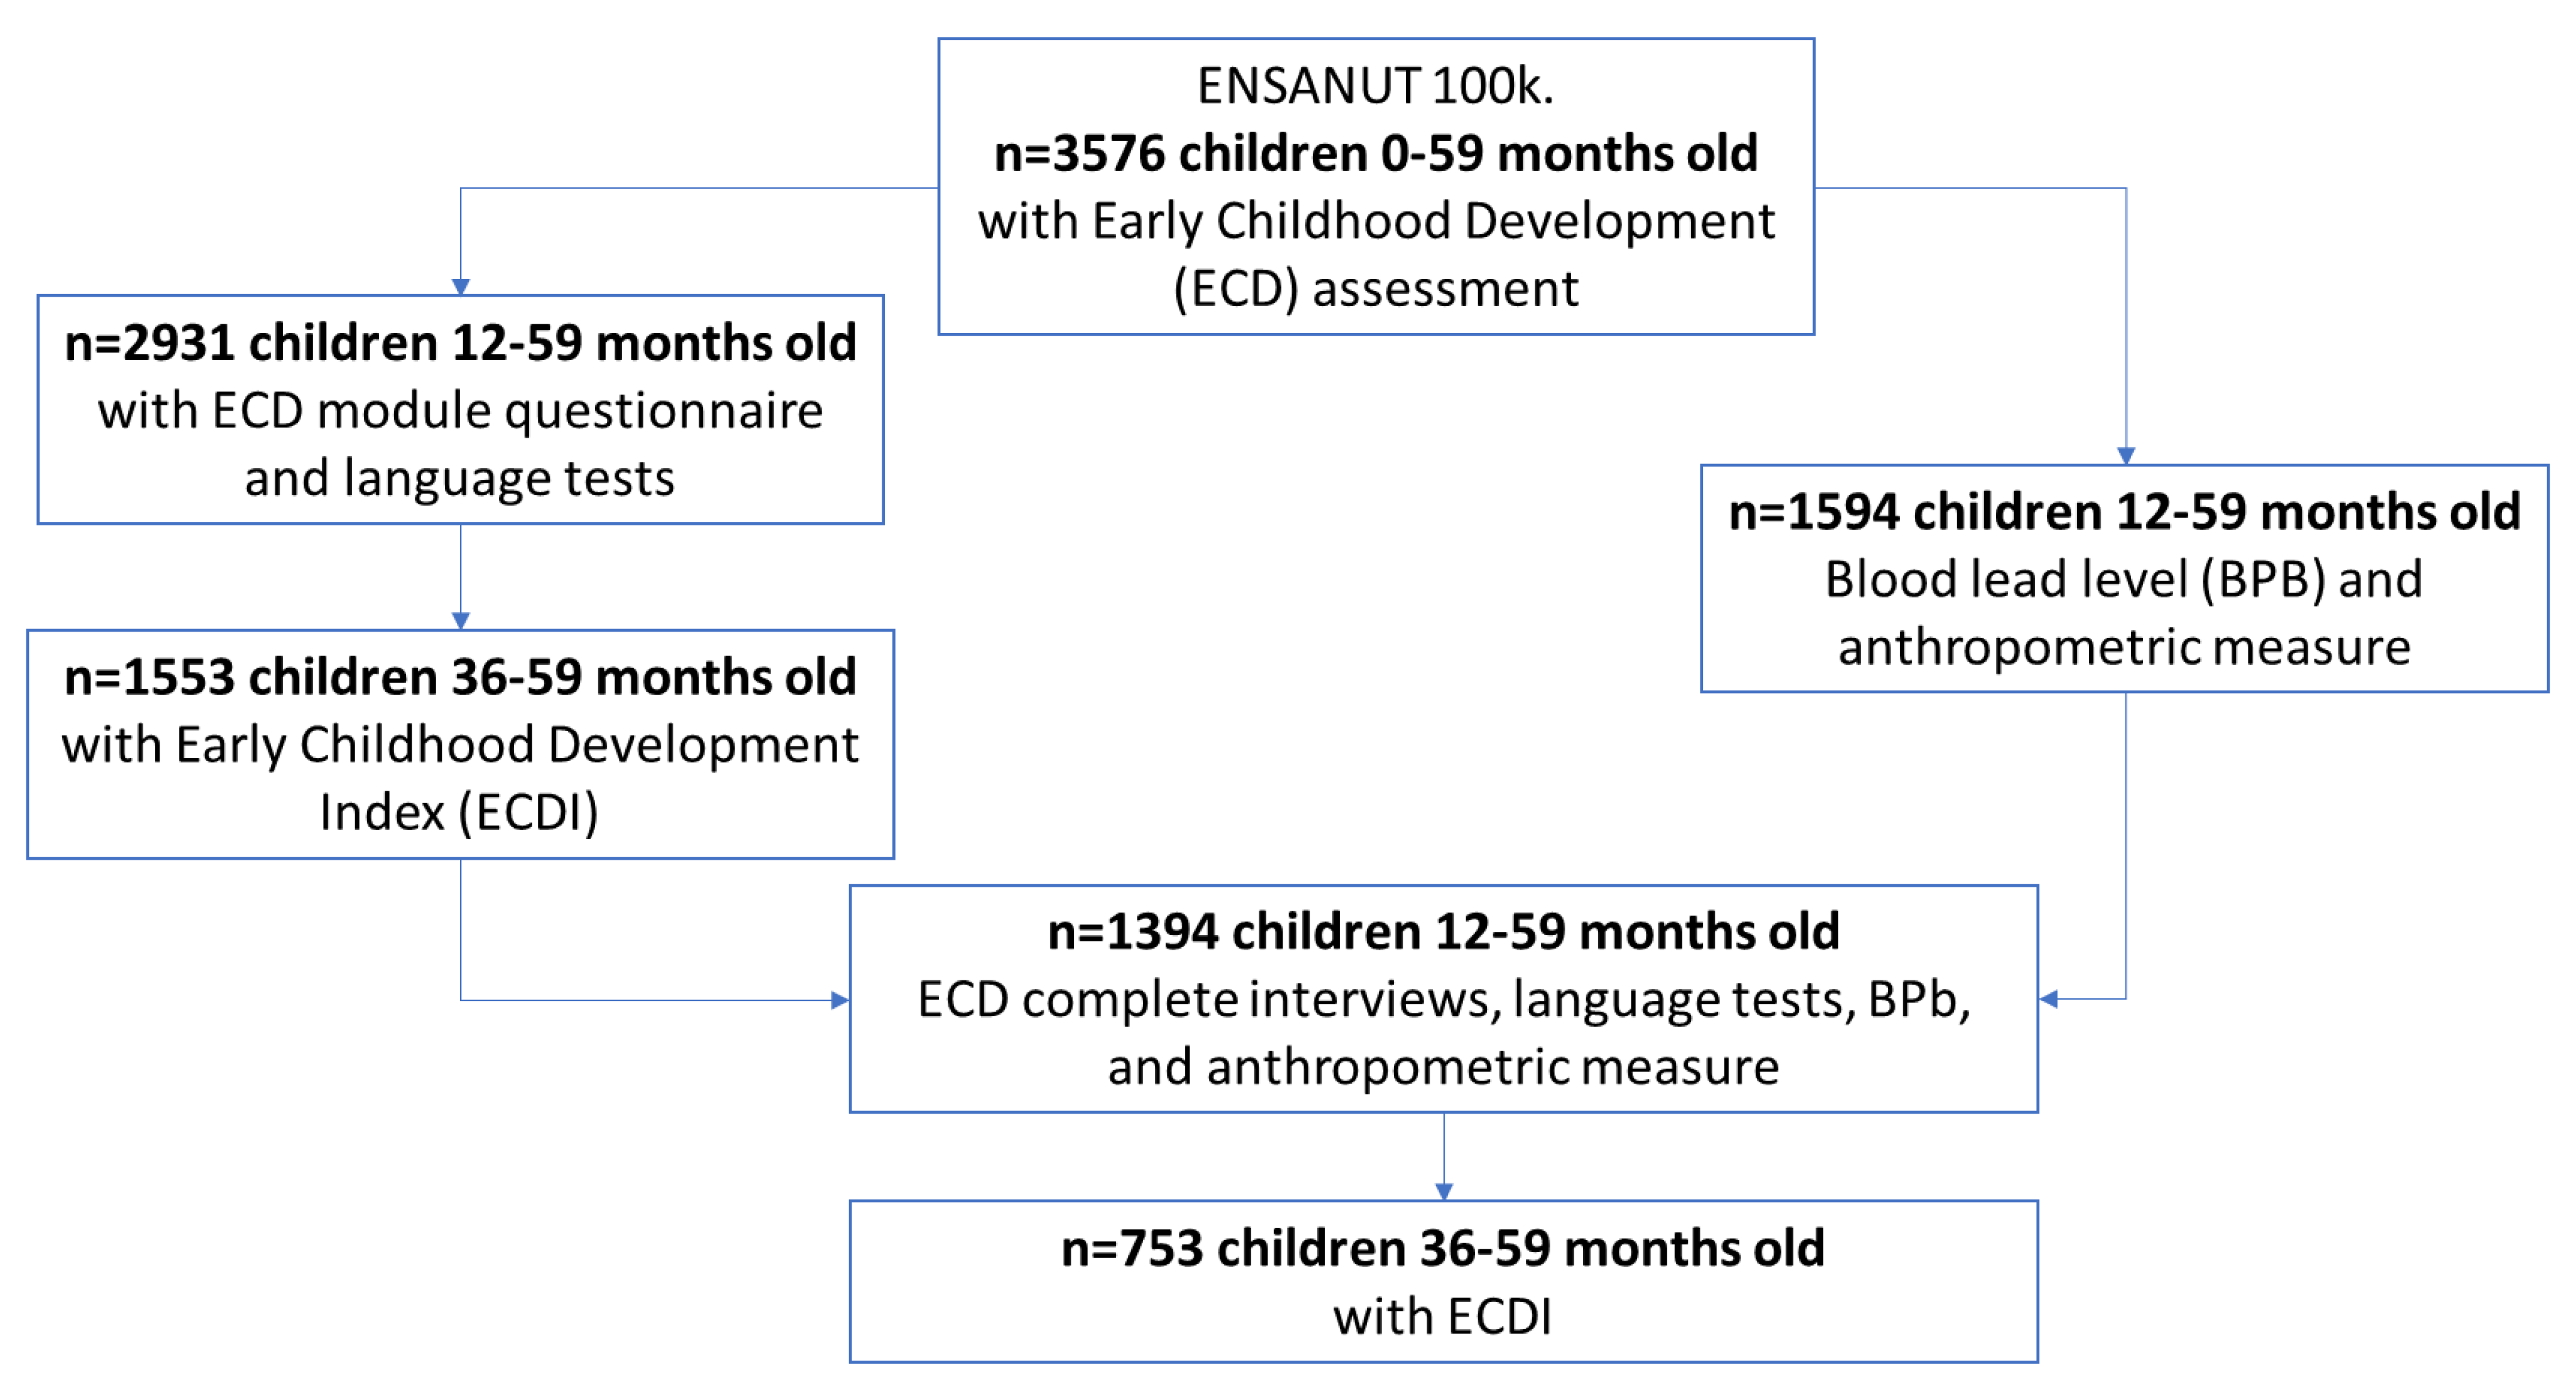
2. Methods
2.1. Language Assessment
2.2. Early Childhood Development Index (ECDI)
2.3. Blood Lead Measurements
2.4. Anthropometric Measurements
2.5. Covariates
2.6. Statistical Analysis
3. Results
4. Discussion
5. Conclusions
Supplementary Materials
Author Contributions
Funding
Institutional Review Board Statement
Informed Consent Statement
Data Availability Statement
Acknowledgments
Conflicts of Interest
References
- Shonkoff, J.; Phillips, D. From Neurons to Neighborhoods: The Science of Early Childhood Development; National Academy Press: Washington, DC, USA, 2000; 610p. [Google Scholar]
- Leech, T.G.J.; Adams, E.A.; Weathers, T.D.; Staten, L.K.; Filippelli, G.M. Inequitable chronic lead exposure: A dual legacy of social and environmental injustice. Fam. Community Health 2016, 39, 151–159. [Google Scholar] [CrossRef] [PubMed]
- Rees, N.; Fuller, R. The Toxic Truth: Children’ s Exposure to Lead Pollution Undermines a Generation of Future Potential. 2020. Available online: https://www.unicef.org/reports/toxic-truth-childrens-exposure-to-lead-pollution-2020 (accessed on 1 January 2021).
- Erdenebayar, E.; Santos, K.D.; Edwards, A.; Dugersuren, N.O.; Ochir, C.; Nriagu, J. Environmental injustice and childhood lead exposure in peri-urban (ger) areas of Darkhan and Erdenet, Mongolia. BMC Public Health 2019, 19, 163. [Google Scholar] [CrossRef] [PubMed] [Green Version]
- Bornstein, M.; Rebello Brito, P.; Nonoyama-Tarumi, Y.; Ota, Y.; Petrovic, O.; Putnic, D. Child Development in Developing Countries: Introduction and Methods. Child Dev. 2012, 83, 16–31. [Google Scholar] [CrossRef] [PubMed] [Green Version]
- Siddiqi, A.; Irwin, L.G.; Hertzman, C. Early Child Development: A Powerful Equalizer: Final Report for the World Health Organization’s Commission on the Social Determinants of Health; Human Early Learning Partnership: Vancouver, DC, Canada, 2007; 67p. [Google Scholar]
- Organización Mundial de la Salud (OMS). Intoxicación por plomo y salud (Lead Poisoning). 2018. Available online: https://www.who.int/es/news-room/fact-sheets/detail/lead-poisoning-and-health (accessed on 1 March 2019).
- World Health Organization. The World Health Report 2002: Reducing Risks, Promoting Healthy Life; World Health Organization: Geneva, Switzerland, 2002. [Google Scholar]
- World Health Organization. UNICEF/WHO/The World Bank Group Joint Child Malnutrition Estimates: Levels and Trends in Child Malnutrition: Key Findings of the 2020 Edition; World Health Organization: Geneva, Switzerland, 2020. [Google Scholar]
- Goyer, R. Nutrition and metal toxicity. Am. J. Clin. Nutr. 1995, 61, 646S–650S. [Google Scholar] [CrossRef]
- Ahamed, M.; Siddiqui, M.K.J. Environmental lead toxicity and nutritional factors. Clin. Nutr. 2007, 26, 400–408. [Google Scholar] [CrossRef]
- Rubio-Codina, M.; Araujo, M.C.; Attanasio, O.; Muñoz, P.; Grantham-McGregor, S. Concurrent validity and feasibility of short tests currently used to measure early childhood development in large scale studies. PLoS ONE 2016, 11, e0160962. [Google Scholar] [CrossRef] [Green Version]
- Hamadani, J.D.; Baker-Henningham, H.; Tofail, F.; Mehrin, F.; Huda, S.N.; Grantham-McGregor, S.M. Validity and reliability of mothers’ reports of language development in 1-year-old children in a large-scale survey in Bangladesh. Food Nutr. Bull. 2010, 31, 198–206. [Google Scholar] [CrossRef]
- Catts, H.W.; Fey, M.E.; Tomblin, J.B.; Zhang, X. A longitudinal investigation of with language impairments. J. Speech Lang. Hear. Res. 2002, 45, 1142–1157. [Google Scholar] [CrossRef] [Green Version]
- Stevenson, J. Behaviour Problems and Language Abilities at Three. Psychology 1985, 26, 215–230. [Google Scholar]
- Lewis, B.A.; Minnes, S.; Min, M.O.; Short, E.J.; Wu, M.; Lang, A.; Weishampel, P.; Singer, L.T. Blood lead levels and longitudinal language outcomes in children from 4 to 12 years. J. Commun. Disord. 2018, 71, 85–96. [Google Scholar] [CrossRef]
- Yuan, W.; Holland, S.K.; Cecil, K.M.; Dietrich, K.N.; Wessel, S.D.; Altaye, M.; Hornung, R.W.; Ris, M.D.; Egelhoff, J.C.; Lanphear, B.P. The impact of early childhood lead exposure on brain organization: A functional magnetic resonance imaging study of language function. Pediatrics 2006, 118, 971–977. [Google Scholar] [CrossRef] [Green Version]
- Pérez-Escamilla, R.; Rizzoli-Córdoba, A.; Alonso-Cuevas, A.; Reyes-Morales, H. Avances en el desarrollo infantil temprano: Desde neuronas hasta programas a gran escala (Advances in early childhood development: From neurons to large-scale programs). Bol. Med. Hosp. Infant. Mex. 2017, 74, 86–97. Available online: http://linkinghub.elsevier.com/retrieve/pii/S1665114616301617 (accessed on 1 July 2019). [PubMed]
- Téllez-Rojo, M.M.; Bellinger, D.C.; Arroyo-Quiroz, C.; Lamadrid-Figueroa, H.; Mercado-Garcia, A.; Schnaas-Arrieta, L.; Wright, R.O.; Hernandez-Avila, M.; Hu, H. Longitudinal Associations Between Blood Lead Concentrations Lower Than 10 g/dL and Neurobehavioral Development in Environmentally Exposed Children in Mexico City. Pediatrics 2006, 118, e323–e330. Available online: http://pediatrics.aappublications.org/cgi/doi/10.1542/peds.2005-3123 (accessed on 1 July 2019). [CrossRef] [PubMed]
- Braun, J.M.; Hoffman, E.; Schwartz, J.; Sanchez, B.; Schnaas, L.; Mercado-Garcia, A.; Solano-Gonzalez, M.; Bellinger, D.C.; Lanphear, B.P.; Hu, H.; et al. Assessing windows of susceptibility to lead-induced cognitive deficits in Mexican children. Neurotoxicology 2012, 33, 1040–1047. [Google Scholar] [CrossRef] [Green Version]
- Azcona-Cruz, M.I.; Rothenberg, S.J.; Schnaas-Arrieta, L.; Romero-Placeres, M.; Perroni-Hernández, E. Niveles de plomo en sangre en niños de 8 a 10 años y su relación con la alteración en el sistema visomotor y del equilibrio (Blood lead levels in children from 8 to to 10 years of age and their relationship with alterations in the visuomotor and balance syst. Salud Publica Mex. 2000, 42, 279–287. [Google Scholar]
- Claus Henn, B.; Schnaas, L.; Ettinger, A.S.; Schwartz, J.; Lamadrid-Figueroa, H.; Hernández-Avila, M.; Amarasiriwardena, C.; Hu, H.; Bellinger, D.C.; Wright, R.O.; et al. Associations of early childhood manganese and lead coexposure with neurodevelopment. Environ. Health Perspect. 2012, 120, 126–131. [Google Scholar] [CrossRef] [PubMed] [Green Version]
- Estrada-Sánchez, D.; Ericson, B.; Juárez-Pérez, C.; Aguilar-Madrid, G.; Hernández, L.; Gualtero, S.; Caravanos, J. Pérdida de coeficiente intelectual en hijos de alfareros mexicanos (Loss of intelligence quotient in children of Mexican potters). Rev. Med. Inst. Mex. Seguro Soc. 2017, 55, 292–299. Available online: http://revistamedica.imss.gob.mx/editorial/index.php/revista_medica/article/view/313/2040 (accessed on 1 July 2019).
- Pilsner, J.; Hu, H.; Wright, R.; Kordas, K.; Ettinger, A.; Sanchez, B.; Cantonwine, D.; Lazarus, A.; Cantoral, A.; Schnaas, L.; et al. Maternal MTHFR genotype and haplotype predict deficits in early cognitive development in a lead-exposed birth cohort in Mexico. Am. J. Clin. Nutr. 2010, 92, 226–234. [Google Scholar] [CrossRef] [Green Version]
- Diaz-Ruiz, A.; Tristán-López, L.A.; Medrano-Gómez, K.I.; Torres-Domínguez, J.A.; Ríos, C.; Montes, S. Glazed clay pottery and lead exposure in Mexico: Current experimental evidence. Nutr. Neurosci. 2017, 20, 513–518. [Google Scholar] [CrossRef]
- Domínguez-Cortinas, G.; Díaz-Barriga, F.; Martínez-Salinas, R.I.; Cossío, P.; Pérez-Maldonado, I.N. Exposure to chemical mixtures in Mexican children: High-risk scenarios. Environ. Sci. Pollut. Res. 2013, 20, 351–357. [Google Scholar] [CrossRef]
- Kordas, K.; Casavantes, K.M.; Mendoza, C.; Lopez, P.; Ronquillo, D.; Rosado, J.L.; Vargas, G.G.; Stoltzfus, R.J. The association between lead and micronutrient status, and children’s sleep, classroom behavior, and activity. Arch. Environ. Occup. Health 2007, 62, 105–112. [Google Scholar] [CrossRef] [PubMed]
- Terrazas-Meraz, M.A.; Hernández-Cadena, L.; Rueda-Hernández, G.E.; Romano-Riquer, S.P.; Shamah-Levy, T.; Villalpando-Hernández, S.; Téllez Rojo Solís, M.M.; Hernández-Ávila, M. Uso de cerámica vidriada como fuente de exposición a plomo en niños indígenas de zonas marginadas de Oaxaca, México (Use of glazed ceramics as a source of lead exposure in indigenous children from marginalized areas of Oaxaca, Mexico). Salud Publica Mex. 2017, 57, 260. [Google Scholar] [CrossRef] [Green Version]
- Kordas, K.; Canfield, R.L.; López, P.; Rosado, J.L.; Vargas, G.G.; Cebrián, M.E.; Rico, J.A.; Ronquillo, D.; Stoltzfus, R.J. Deficits in cognitive function and achievement in Mexican first-graders with low blood lead concentrations. Environ. Res. 2006, 100, 371–386. [Google Scholar] [CrossRef]
- Tamayo y Ortiz, M.; Téllez-Rojo, M.M.; Trejo-Valdivia, B.; Schnaas, L.; Osorio-Valencia, E.; Coull, B.; Bellinger, D.; Wright, R.J.; Wright, R.O. Maternal stress modifies the effect of exposure to lead during pregnancy and 24-month old children’s neurodevelopment. Environ. Int. 2017, 98, 191–197. [Google Scholar] [CrossRef] [Green Version]
- Secretaría de Gobernación. Modificación de la Norma Oficial Mexicana NOM-199-SSA1-2000. Niveles de Plomo en Sangre y Acciones Como Criterios para Proteger la Salud de la Población (Norm Modification: Blood Lead Levels and Actions as Criteria to Protect the Health of the Population). 18 October 2002. Available online: http://dof.gob.mx/nota_detalle.php?codigo=5495551&fec%0Aha=30/08/2017 (accessed on 1 October 2020).
- Cuevas-Nasu, L.; Gaona-Pineda, E.B.; Rodríguez-Ramírez, S.; Morales-Ruán, M.d.C.; González-Castell, L.D.; García-Feregrino, R.; Gómez-Acosta, L.M.; Ávila-Arcos, M.A.; Shamah-Levy, T.; Rivera-Dommarco, J. Desnutrición crónica en población infantil de localidades con menos de 100,000 habitantes en México (Chronic malnutrition in child population of localities with less than 100,000 inhabitants in Mexico). Salud Publica Mex. 2019, 61, 833–840. [Google Scholar] [CrossRef] [PubMed]
- Romero-Martínez, M.; Shamah-Levy, T.; Cuevas-Nasu, L.; Gaona Pineda, E.; Gómez Acosta, L.; Méndez-Humaran, I.; Rivera, J. Metodología de la Encuesta Nacional de Salud y Nutrición (ENSANUT- 100K), para localidades con menos de 100 mil habitantes (Methodology of the National Health and Nutrition Survey (ENSANUT-100K), for localities with less than 100,000 inhabitants). Salud Publica Mex. 2019, 61, 678–684. [Google Scholar] [CrossRef] [Green Version]
- Téllez-Rojo, M.M.; Bautista-Arredondo, L.F.; Trejo-Valdivia, B.; Cantoral, A.; Estrada-Sánchez, D.; Kraiem, R.; Pantic, I.; Rosa-Parra, A.; Gómez-Acosta, L.M.; Romero-Martínez, M.; et al. National report of blood lead levels and lead-glazed ceramics use in vulnerable children. Salud Pública México 2019, 61, 787–797. [Google Scholar] [CrossRef]
- Center for Disease Control and Prevention (CDC). Childhood Lead Poisoning Prevention. 2021. Available online: https://www.cdc.gov/nceh/lead/data/blood-lead-reference-value.htm (accessed on 1 July 2021).
- Instituto Nacional de Salud Pública (INSP); Instituto Nacional de Estadística y Geografía (INEGI). Encuesta Nacional de Salud y Nutrición Diseño Conceptual (National Health and Nutrition Survey Conceptual Design); Instituto Nacional de Salud Pública (INSP): Cuernavaca, Mexico; Instituto Nacional de Estadística y Geografía (INEGI): Aguascalientes, Mexico, 2019; pp. 58–62. [Google Scholar]
- Daelmans, B.; Darmstadt, G.L.; Lombardi, J.; Black, M.M.; Britto, P.R.; Lye, S.; Dua, T.; Bhutta, Z.A.; Richter, L.M. Early childhood development: The foundation of sustainable development. Lancet 2016, 389, 9–11. [Google Scholar] [CrossRef]
- Attanasio, O.P. The determinants of human capital formation during the early years of life: Theory, measurement, and policies. J. Eur. Econ. Assoc. 2015, 13, 949–997. [Google Scholar] [CrossRef] [Green Version]
- Heckman, J.; Pinto, R.; Savelyev, P. Understanding the Mechanisms Through Which an Influential Early Childhood Program Boosted Adult Outcomes. Am. Econ. Rev. 2013, 103, 2052–2086. [Google Scholar] [CrossRef] [Green Version]
- De Castro, F.; Vázquez-Salas, R.A.; Villalobos, A.; Rubio-Codina, M.; Prado, E.; Sánchez-Ferrer, J.C.; Romero, M.; Shamah-Levy, T. Contexto y resultados del desarrollo infantil temprano en niños y niñas de 12 a 59 meses en México (Context and results of early childhood development in boys and girls from 12 to 59 months in Mexico). Salud Publica Mex. 2019, 61, 775. [Google Scholar] [CrossRef] [PubMed] [Green Version]
- Dunn, L.; Dunn, L.; Arribas, D. PPVT-III PEABODY: Test de Vocabulario en Imágenes. (Image Language Test), 2nd ed.; Tea Ediciones: Madrid, Spain, 2010. [Google Scholar]
- Fenson, L.; Marchman, V.A.; Thal, D.; Dale, P.; Reznick, J.; Bates, E. The MacArthur Communicative Development Inventories: User’s Guide and Technical Manual; Singular Publishing Group: San Diego, CA, USA, 1993. [Google Scholar]
- de Castro, F.; Rojas-Martínez, R.; Villalobos, A.; Shamah, T.; Vázquez-Salas, R.A.; Armendares, N.; Allen-Leigh, B.; Escamilla, A.; Romero, M. Bases metodológicas de la medición de desarrollo infantil temprano en la Ensanut 100k (Methodological bases of the measurement of early childhood development in the Ensanut 100k). Salud Publica Mex. 2020, 62, 1–8. [Google Scholar] [CrossRef] [PubMed]
- UNICEF. Development of The Early Childhood Development Index In MICS Surveys Division of Data, Research and Policy. 2017. Available online: https://scholar.google.com/scholar?hl=id&as_sdt=0%2C5&q=Development+of+The+Early+Childhood+Development+Index+In+MICS+Surveys+Division+of+Data%2C+Research+and+Policy&btnG= (accessed on 1 July 2020).
- Instituto Nacional de Salud Pública (INSP); Fondo de las Naciones Unidas para la Infancia (UNICEF). Encuesta Nacional de Niños, Niñas y Mujeres 2015—Encuesta de Indicadores Múltiples por Conglomerados 2015, Informe Final (National Survey of Boys, Girls and Women 2015—Multiple Indicator Cluster Survey 2015, Final Report); Instituto Nacional de Salud Pública y UNICEF Mexico: Ciudad de México, Mexico, 2016. [Google Scholar]
- McCloskey, L.J.; Bordash, F.R.; Ubben, K.J.; Landmark, J.D.; Stickle, D.F. Decreasing the cutoff for elevated blood lead (ebl) can decrease the screening sensitivity for EBL. Am. J. Clin. Pathol. 2013, 139, 360–367. [Google Scholar] [CrossRef] [PubMed]
- Center for Disease Control and Prevention (CDC). Childhood Lead Poisoning Prevention. Laboratory Considerations. Available online: https://www.cdc.gov/nceh/lead/lab/default.htm?CDC_AA_refVal=https%3A%2F%2Fwww.cdc.gov%2Fnceh%2Flead%2Ftraining%2Fblood_lead_samples.htm (accessed on 1 July 2021).
- Sobin, C.; Parisi, N.; Schaub, T.; Riva, E.D. A Bland—Altman Comparison of the Lead Care ® System and Inductively Coupled Plasma Mass Spectrometry for Detecting Low-Level Lead in Child Whole Blood Samples. J. Med. Toxicol. 2011, 7, 24–32. [Google Scholar] [CrossRef] [PubMed] [Green Version]
- de Onis, M.; Onyango, A.W.; Borghi, E.; Siyam, A.; Nishida, C.; Siekmann, J. Development of a WHO growth reference for school-aged children and adolescents. Bull. World Health Organ. 2007, 85, 660–667. [Google Scholar] [CrossRef]
- StataCorp. Stata Statistical Software: Release 15.0; StataCorp: College Station, TX, USA, 2017. [Google Scholar]
- Gleason, K.M.; Valeri, L.; Shankar, A.H.; Obrycki, J.F.; Ibne Hasan, M.O.S.; Mostofa, G.; Quamruzzaman, Q.; Wright, R.O.; Christiani, D.C.; Bellinger, D.C.; et al. Stunting and lead: Using causal mediation analysis to better understand how environmental lead exposure affects cognitive outcomes in children. J. Neurodev. Disord. 2020, 12, 39. [Google Scholar] [CrossRef]
- Lutter, C.; Chaparro, C. Malnutrition in Infants and Young Children in Latin America and the Caribbean: Achieving the Millennium Development Goals; Pan American Health Organization: Washington, DC, USA, 2008. [Google Scholar]
- Cantoral, A.; Téllez-Rojo, M.M.; Levy, T.S.; Hernández-Ávila, M.; Schnaas, L.; Hu, H.; Peterson, K.E.; Ettinger, A.S. Differential association of lead on length by zinc status in two-year old Mexican children. Environ. Health A Glob. Access Sci. Source 2015, 14, 95. [Google Scholar] [CrossRef] [PubMed] [Green Version]
- Gleason, K.M.; Valeri, L.; Shankar, A.H.; Hasan, M.O.S.I.; Quamruzzaman, Q.; Rodrigues, E.G.; Christiani, D.C.; Wright, R.O.; Bellinger, D.C.; Mazumdar, M. Stunting is associated with blood lead concentration among Bangladeshi children aged 2–3 years. Environ. Health A Glob. Access Sci. Source 2016, 15, 103. [Google Scholar] [CrossRef] [Green Version]
- Raihan, M.J.; Briskin, E.; Mahfuz, M.; Islam, M.M.; Mondal, D.; Hossain, M.I.; Ahmed, A.M.S.; Haque, R.; Ahmed, T. Examining the relationship between blood lead level and stunting, wasting and underweight—A cross-sectional study of children under 2 years-of-age in a Bangladeshi slum. PLoS ONE 2018, 13, e0197856. Available online: https://pubmed.ncbi.nlm.nih.gov/29795643/ (accessed on 1 July 2021). [CrossRef] [PubMed] [Green Version]
- Kaji, M.; Nishi, Y. Lead and growth. Clin. Pediatr. Endocrinol. 2006, 15, 123–128. Available online: https://pubmed.ncbi.nlm.nih.gov/24790332/ (accessed on 1 July 2021). [CrossRef] [Green Version]
- Kordas, K.; Lönnerdal, B.; Stolzfus, R. Interactions between nutrition and environmental exposures: Effects on health outcomes in women and children. J. Nutr. 2007, 137, 2794–2797. [Google Scholar]
- Dzwilewski, K.; Schantz, S. Prenatal Chemical Exposures and Child Language Development. J. Commun. Disord. 2015, 41–65. [Google Scholar] [CrossRef] [Green Version]
- Nazif-Muñoz, J.I.; Spengler, J.D.; Arku, R.E.; Oulhote, Y. Solid fuel use and early child development disparities in Ghana: Analyses by gender and urbanicity. J. Expo. Sci. Environ. Epidemiol. 2020, 30, 698–706. [Google Scholar] [CrossRef]
- Allel, K.; Jaoude, G.A.; Poupakis, S.; Batura, N.; Skordis, J.; Haghparast-Bidgoli, H. Exploring the associations between early childhood development outcomes and ecological country-level factors across low-and middle-income countries. Int. J. Environ. Res. Public Health 2021, 18, 3340. [Google Scholar] [CrossRef]
- Gao, Y.; Zhang, L.; Kc, A.; Wang, Y.; Zou, S.; Chen, C.; Huang, Y.; Mi, X.; Zhou, H. Housing environment and early childhood development in sub-Saharan Africa: A cross-sectional analysis. PLoS Med. 2021, 18, e1003578. [Google Scholar] [CrossRef] [PubMed]
- Jeong, J.; McCoy, D.C.; Yousafzai, A.K.; Salhi, C.; Fink, G. Paternal stimulation and early child development in low-and middle-income countries. Pediatrics 2016, 138, e20161357. [Google Scholar] [CrossRef] [PubMed] [Green Version]
- Miller, A.C.; Garchitorena, A.; Rabemananjara, F.; Cordier, L.; Randriamanambintsoa, M.; Rabeza, V.; Razanadrakoto, H.T.R.; Rakoto Ramakasoa, R.; Ramahefarisontiana, O.; Ratsimbazafy, B.N.; et al. Factors associated with risk of developmental delay in preschool children in a setting with high rates of malnutrition: A cross-sectional analysis of data from the IHOPE study, Madagascar. BMC Pediatr. 2020, 20, 108. [Google Scholar] [CrossRef] [Green Version]
- Vázquez-Salas, A.; Hubert, C.; Villalobos, A.; Sánchez-Ferrer, J.; Ortega-Olvera, C.; Romero, M.; Barrientos-Gutiérrez, T. Características infantiles y contextuales asociadas con el desarrollo infantil temprano en la niñez mexicana (Infant and contextual characteristics associated with early childhood development in Mexican childhood). Salud Publica Mex. 2020, 62, 714–724. [Google Scholar] [CrossRef] [PubMed]
- Cuevas-Nasu, L.; Shamah-levy, T.; Hernández-cordero, S.L.; González-castell, L.D.; Gómez-humarán, I.M.; Ávila-arcos, M.A.; Rivera-dommarco, J.A. Tendencias de la mala nutrición en menores de cinco años en México, 1988–2016: Análisis de cinco encuestas nacionales (Malnutrition trends in children under five years of age in Mexico, 1988–2016: Analysis of five national surveys). Salud Publica Mex. 2018, 60, 283–290. [Google Scholar] [PubMed]
- SCNM; INEGI. Producto Interno Bruto por Entidad Federativa 2006–2010. Año Base 2003 (Gross Domestic Product by State 2006–2010. Base Year 2003). 2011. 186p. Available online: https://www.inegi.org.mx/app/tabulados/default.aspx?pr=17&vr=6&in=2&tp=20&wr=1 (accessed on 9 May 2022).
- Nakata, H.; Nakayama, S.M.M.; Yabe, J.; Muzandu, K.; Toyomaki, H.; Beyene, Y.; Kataba, A.; Zyambo, G.; Ikenaka, Y.; Choongo, K.; et al. Chemosphere Assessment of LeadCare® II analysis for testing of a wide range of blood lead levels in comparison with ICP e MS analysis. Chemosphere 2021, 271, 129832. [Google Scholar] [CrossRef]
- Gump, B.B.; Dykas, M.J.; MacKenzie, J.A.; Dumas, A.K.; Hruska, B.; Ewart, C.K.; Parsons, P.J.; Palmer, C.D.; Bendinskas, K. Background lead and mercury exposures: Psychological and behavioral problems in children. Environ. Res. 2017, 158, 576–582. [Google Scholar] [CrossRef] [PubMed]
- Geier, D.A.; Kern, J.K.; Geier, M.R. Blood lead levels and learning disabilities: A cross-sectional study of the 2003-2004 national health and nutrition examination survey (NHANES). Int. J. Environ. Res. Public Health 2017, 14, 1202. [Google Scholar] [CrossRef] [PubMed] [Green Version]


| Total n Sample = 1394 n = 2,415,000 (%) | 95% CI | Stunting Conditionc | p-Value | ||||
|---|---|---|---|---|---|---|---|
| Children with Stunting | Children without Stunting | ||||||
| n Sample = 256 N = 437,500 (15.3%) | 95% CI | n Sample = 1138 n = 1,945,000 (84.7%) | 95% CI | ||||
| Child characteristics | |||||||
| Mean language z-score (SE) | −0.08 (0.07) | −0.15, −0.05 | −0.02 (0.15) | −0.32, 0.28 | −0.09 (0.07) | −0.24, 0.05 | 0.67 d |
| Blood lead level | |||||||
| Non-detectable (< 3.3 μg/dL) | 806 (50.0) | 39.3, 60.8 | 162 (48.7) | 32.2, 65.4 | 644 (50.3) | 38.1, 62.4 | 0.88 e |
| Detectable (≥ 3.3 μg/dL) | 588 (50.0) | 39.2, 60.7 | 94 (52.3) | 34.5, 67.7 | 494 (49.7) | 37.6, 61.9 | |
| Age (months) | |||||||
| 12–23 | 289 (28.7) | 18.7, 41.3 | 43 (23.8) | 12.9, 39.6 | 246 (29.6) | 18.3, 41.3 | 0.78 e |
| 24–35 | 352 (22.0) | 16.6, 28.5 | 53 (22.5) | 11.8, 38.6 | 299 (21.9) | 16.6, 28.5 | |
| 36–47 | 377 (28.3) | 22.4, 35.0 | 87 (26.8) | 16.4, 40.6 | 290 (28.6) | 22.4, 35.0 | |
| 48–59 | 376 (20.0) | 15.7, 27.4 | 73 (26.9) | 13.4, 46.6 | 303 (19.9) | 15.7, 27.4 | |
| Sex | |||||||
| Girl | 669 (52.7) | 44.9, 60.4 | 126 (42,5) | 26.8, 59.9 | 543 (54.5) | 46.1, 62.6 | 0.22 e |
| Boy | 725 (47.3) | 39.6, 55.1 | 130 (57.5) | 40.1, 73.1 | 595 (45.5) | 37.4, 53.8 | |
| Maternal characteristics | |||||||
| Maternal schooling (%)a | |||||||
| Middle school or higher | 876 (76.7) | 69.8, 82.5 | 127 (64.5) | 47.1, 78.8 | 749 (78.9) | 71.9, 84.5 | 0.06 e |
| Elementary school | 436 (23.3) | 17.5, 30.2 | 114 (35.5) | 21.2, 52.9 | 322 (20.1) | 15.4, 28.1 | |
| Household characteristics | |||||||
| SES (%) b | |||||||
| Lower | 954 (62.1) | 52.0, 71.2 | 209 (60.8) | 45.0, 85.1 | 745 (60.9) | 46.5, 71.1 | 0.05 e |
| Middle | 342 (27.3) | 20.2, 35.9 | 37 (11.6) | 6.7, 19.4 | 305 (30.2) | 21.5, 40.5 | |
| Higher | 92 (10.6) | 6.5, 16.7 | 8 (19.6) | 6.4, 46.5 | 84 (8.9) | 6.0, 13.0 | |
| Locality type | |||||||
| Urban | 218 (45.6) | 34.3, 57.5 | 21 (26.9) | 12.5, 48.7 | 197 (49.0) | 36.4, 61.8 | 0.08 e |
| Rural | 1176 (54.4) | 42.5, 65.7 | 235 (73.1) | 36.4, 61.8 | 941 (51.0) | 38.2, 63.6 | |
| Country region | |||||||
| North | 238 (15.4) | 10.5, 22.0 | 19 (15.8) | 6.9, 32.1 | 219 (15.3) | 10.3, 22.1 | 0.13 e |
| Center | 427 (32.3) | 25.0, 40.6 | 51 (18.7) | 10.5, 31.2 | 376 (34.8) | 25.9, 44.9 | |
| South | 702 (52.3) | 41.6, 62.7 | 182 (65.5) | 49.3, 78.8 | 520 (49.9) | 37.2, 62.5 | |
| Family care characteristics | |||||||
| Preschool education | |||||||
| Yes | 426 (21.8) | 18.4, 25.5 | 89 (17.1) | 11.0, 25.5 | 337 (22.6) | 18.9, 26.9 | 0.21 e |
| No | 968 (78.2) | 74.5, 81.5 | 167 (82.9) | 74.5, 88.0 | 801 (77.4) | 73.1, 81.1 | |
| Percentage of children with learning support (%) | |||||||
| Yes | 907 (75.5) | 68.7, 81.3 | 143 (59.6) | 42.0, 75.0 | 764 (78.4) | 71.5, 84.0 | 0.02 e |
| No | 487 (24.5) | 18.7, 31.3 | 113 (40.4) | 24.0, 58.0 | 374 (21.6) | 15.0, 28.5 | |
| Percentage of children with at least three books (%) | |||||||
| ≥3 | 235 (21.1) | 15.5, 28.0 | 18 (22.4) | 8.6, 46.9 | 217 (20.9) | 15.1, 28.1 | 0.88 e |
| <3 | 1159 (78.9) | 71.0, 84.5 | 238 (77.6) | 53.1, 91.4 | 921 (79.1) | 71.9, 84.9 | |
| Percentage of children with two or more toy types (%) | |||||||
| ≥2 | 1348 (96.6) | 93.5, 98.2 | 243 (97.8) | 95.4, 99.0 | 1105 (96.4) | 92.7, 98.2 | 0.30 e |
| <2 | 46 (3.4) | 1.7, 6.5 | 13 (2.1) | 1.0, 4.6 | 33 (3.6) | 1.8, 7.3 | |
| Children disciplined with violent methods (%) | |||||||
| Yes | 774 (58.0) | 48.4, 67.1 | 129 (57.3) | 40.2, 72.7 | 645 (58.2) | 47.4, 68.2 | 0.92 e |
| No | 620 (42.0) | 32.9, 51.5 | 127 (42.7) | 27.2, 59.8 | 493 (41.8) | 31.8, 52.5 | |
| Total n Sample = 753 n = 1,300,000 (%) | 95% CI | On-Track n Sample = 569 n = 982,000 (75.6%) | 95% CI | Not On-Track n Sample = 184 n = 318,000 (24.4%) | 95% CI | p-Value d | |
|---|---|---|---|---|---|---|---|
| Child characteristics | |||||||
| Blood lead level | |||||||
| Non-detectable (< 3.3 μg/dL) | 426 (55.0) | 46.6, 63.0 | 321 (77.8) | 68.8, 84.7 | 105 (22.2) | 15.1, 31.2 | 0.47 |
| Detectable (≥ 3.3 ug/dL) | 327 (45.0) | 36.9, 53.3 | 248 (72.6) | 59.2, 82.8 | 79 (27.4) | 17.1, 40.7 | |
| Stunting conditiona | |||||||
| No stunting | 593 (83.3) | 74.4, 89.6 | 451 (75.6) | 67.2, 82.4 | 142 (24.4) | 17.6, 32.8 | 0.93 |
| Stunting | 160 (16.7) | 10.4, 25.6 | 118 (74.7) | 51.6, 89.1 | 42 (25.3) | 10.9, 48.4 | |
| Age (months) | |||||||
| 36–47 | 377 (57.4) | 49.3, 65.2 | 262 (71.1) | 58.6, 81.0 | 115 (28.9) | 18.9, 41.3 | 0.12 |
| 48–59 | 376 (42.6) | 34.8, 50.7 | 307 (81.3) | 73.6, 87.1 | 69 (18.7) | 12.9, 26.4 | |
| Sex | |||||||
| Girl | 357 (52.1) | 42.6, 61.4 | 279 (77.1) | 67.1, 84.7 | 78 (22.9) | 15.3, 33.0 | 0.64 |
| Boy | 396 (47.9) | 38.6, 57.4 | 290 (73.6) | 60.8, 83.4 | 106 (26.3) | 16.3, 38.5 | |
| Maternal characteristics | |||||||
| Maternal schooling (%)b | |||||||
| Middle school or higher | 449 (75.0) | 66.6, 81.8 | 347 (74.9) | 65.1, 82.8 | 102 (25.1) | 17.2, 34.9 | 0.87 |
| Elementary school | 249 (25.0) | 18.2, 33.4 | 181 (73.7) | 58.3, 84.8 | 68 (26.3) | 15.1, 41.7 | |
| Household characteristics | |||||||
| SES (%)c | |||||||
| Lower | 511 (53.2) | 43.1, 63.0 | 373 (65.5) | 54.9, 74.7 | 138 (34.5) | 25.3, 45.1 | <0.001 |
| Middle | 183 (33.7) | 23.7, 45.5 | 145 (85.6) | 76.8, 91.4 | 38 (14.4) | 8.6, 23.2 | |
| Higher | 53 (13.1) | 7.2, 22.7 | 47 (91.2) | 88.6, 93.1 | 6 (8.8) | 6.8, 11.4 | |
| Locality type | |||||||
| Urban | 112 (44.3) | 34.7, 54.2 | 87 (76.6) | 61.7, 86.9 | 25 (23.4) | 13.0, 38.3 | 0.77 |
| Rural | 641 (55.7) | 45.8, 65.2 | 482 (74.5) | 66.7, 80.9 | 159 (25.5) | 19.0, 33.3 | |
| Country region | |||||||
| North | 124 (17.1) | 10.8, 25.9 | 100 (85.9) | 76.0, 92.1 | 24 (14.1) | 7.8, 23.9 | 0.06 |
| Center | 234 (33.1) | 26.3, 40.5 | 181 (79.2) | 70.5, 85.8 | 53 (20.8) | 14.2, 29.4 | |
| South | 379 (49.8) | 40.6, 58.9 | 273 (69.1) | 55.3, 80.1 | 106 (30.9) | 19.9, 44.6 | |
| Family care characteristics | |||||||
| Preschool education | |||||||
| Yes | 382 (39.4) | 31.7, 47.6 | 311 (75.0) | 60.6, 85.4 | 71 (25.0) | 14.6, 39.4 | 0.92 |
| No | 371 (60.6) | 52.4, 68.3 | 258 (75.7) | 67.1, 82.6 | 113 (24.3) | 17.3, 32.8 | |
| Percentage of children with learning support (%) | |||||||
| Yes | 473 (75.5) | 68.4, 81.4 | 377 (77.1) | 67.8, 84.4 | 96 (22.9) | 15.6, 31.1 | 0.32 |
| No | 280 (24.5) | 18.5, 31.5 | 192 (70.2) | 57.7, 80.2 | 88 (29.8) | 19.7, 42.3 | |
| Percentage of children with at least three books (%) | |||||||
| ≥3 | 141 (26.1) | 18.6, 35.2 | 116 (72.5) | 58.6, 83.0 | 25 (27.5) | 17.0, 41.4 | 0.60 |
| <3 | 612 (73.9) | 64.8, 81.3 | 453 (76.5) | 66.9, 84.0 | 159 (23.5) | 16.0, 33.1 | |
| Percentage of children with two or more toy types (%) | |||||||
| ≥2 | 738 (99.4) | 98.6, 99.7 | 562 (75.6) | 67.9, 81.9 | 176 (24.4) | 18.2, 32.0 | 0.02 |
| <2 | 15 (0.6) | 0.3, 1.3 | 7 (47.2) | 23.9, 71.7 | 8 (52.8) | 28.3, 76.1 | |
| Children disciplined with violent methods(%) | |||||||
| Yes | 452 (59.9) | 50.8, 68.4 | 319 (66.1) | 55.7, 75.1 | 133 (33.9) | 24.9, 44.3 | < 0.001 |
| No | 301 (40.1) | 31.6, 49.2 | 250 (89.5) | 83.3, 93.5 | 51 (10.5) | 6.5, 16.7 | |
| Not Stratified Analysis | Stratified Analysis | |||||
|---|---|---|---|---|---|---|
| Complete Sample | Stunted Children | Not Stunted Children | ||||
| n Sample = 1394 n = 2,415,000 | n Sample = 256 n = 437,500 | n Sample = 1138 n = 1,945,000 | ||||
| β | 95% CI | β | 95% CI | β | 95% CI | |
| Child characteristics | ||||||
| Blood lead level Non-detectable (< 3.3 μg/dL) Detectable (≥ 3.3 μg/dL) | −0.08 | −0.53, 0.36 | −0.40 | −0.71, −0.10 | −0.15 | −0.36, 0.06 |
| Stunting condition a Stunting No stunting | −0.16 | −0.50, 0.18 | ||||
| Blood lead level * Stunting condition Detectable vs. No stunting | −0.05 | −0.55, 0.44 | ||||
| Sex Girl Boy | 0.07 | −0.15, 0.29 | −0.40 | −0.67, −0.13 | 0.10 | −0.13, 0.34 |
| Maternal characteristics | ||||||
| Maternal schooling b Middle school or higher Elementary | −0.05 | −0.26, 0.16 | −0.01 | −0.35, 0.35 | −0.05 | −0.29, 0.18 |
| Household characteristics | ||||||
| SES c Lower Middle Higher | −0.06 −0.11 | −0.47, 0.34 −0.43, 0.20 | −0.47 −0.46 | −1.10, 0.14 −1.00, 0.07 | 0.13 0.10 | −0.20, 0.48 −0.21, 0.42 |
| Locality type Urban Rural | −0.19 | −0.41, 0.03 | 0.94 | 0.64, 1.23 | −0.07 | −0.31, 0.17 |
| Country region North Center South | −0.15 −0.30 | −0.51, 0.20 −0.66, 0.05 | 0.04 −0.23 | −0.57, 0.66 −0.71, 0.24 | −0.17 −0.33 | −0.64, 0.28 −0.81, 0.14 |
| Family care characteristics | ||||||
| Preschool education Yes No | −0.10 | −0.28, 0.07 | 0.03 | −0.28, 0.34 | −0.13 | −0.33, 0.06 |
| Percentage of children with learning support Yes No | −0.18 | −0.37, 0.01 | −0.26 | −0.58, 0.06 | −0.23 | −0.46, −0.005 |
| Percentage of children with at least three books ≥3 <3 | −0.30 | −0.58, −0.02 | −0.57 | −1.28, 0.12 | −0.26 | −0.55, 0.03 |
| Percentage of children with two or more toy types ≥2 <2 | −0.12 | −0.73, 0.48 | −0.31 | −0.91, 0.29 | −0.05 | −0.73, 0.62 |
| Children disciplined with violent methods Yes No | −0.10 | −0.30, 0.10 | 0.14 | −0.13, 0.42 | −0.17 | −0.38, 0.04 |
| n Sample = 753 n = 1,300,000 | |||
|---|---|---|---|
| OR | 95% IC | p-Value | |
| Child characteristics | |||
| Blood lead level Non-detectable (< 3.3 μg/dL) Detectable (≥ 3.3 ug/dL) | 1.00 1.09 | 0.57, 2.07 | 0.783 |
| Stunting condition a Stunting No stunting | 1.00 0.76 | 0.30, 1.89 | 0.563 |
| Age (months) | 0.91 | 0.86, 0.96 | 0.003 |
| Sex Girl Boy | 1.00 1.02 | 0.51, 2.01 | 0.954 |
| Maternal characteristics | |||
| Maternal schooling b Middle school or higher Elementary | 1.00 0.79 | 0.38, 1.64 | 0.532 |
| Household characteristics | |||
| SES c Lower Middle Higher | 1.00 4.28 12.7 | 2.27, 8.05 6.21, 25.7 | <0.001 <0.001 |
| Locality type Urban Rural | 1.00 0.68 | 0.34, 1.36 | 0.276 |
| Country region North Center South | 1.00 2.73 3.24 | 1.09, 6.80 1.32, 7.94 | 0.031 0.011 |
| Family care characteristics | |||
| Preschool education Yes No | 1.00 1.03 | 0.46, 2.34 | 0.925 |
| Percentage of children with learning support Yes No | 1.00 0.91 | 0.43, 1.95 | 0.827 |
| Percentage of children with at least three books ≥3 <3 | 1.00 0.60 | 0.29, 1.23 | 0.165 |
| Percentage of children with two or more toy types ≥2 <2 | 1.00 1.96 | 0.49, 7.86 | 0.336 |
| Children disciplined with violent methods Yes No | 1.00 0.13 | 0.06, 0.28 | < 0.001 |
Disclaimer/Publisher’s Note: The statements, opinions and data contained in all publications are solely those of the individual author(s) and contributor(s) and not of MDPI and/or the editor(s). MDPI and/or the editor(s) disclaim responsibility for any injury to people or property resulting from any ideas, methods, instructions or products referred to in the content. |
© 2023 by the authors. Licensee MDPI, Basel, Switzerland. This article is an open access article distributed under the terms and conditions of the Creative Commons Attribution (CC BY) license (https://creativecommons.org/licenses/by/4.0/).
Share and Cite
Córdoba-Gamboa, L.; Vázquez-Salas, R.A.; Romero-Martínez, M.; Cantoral, A.; Riojas-Rodríguez, H.; Bautista-Arredondo, S.; Bautista-Arredondo, L.F.; de Castro, F.; Tamayo-Ortiz, M.; Téllez-Rojo, M.M. Lead Exposure Can Affect Early Childhood Development and Could Be Aggravated by Stunted Growth: Perspectives from Mexico. Int. J. Environ. Res. Public Health 2023, 20, 5174. https://doi.org/10.3390/ijerph20065174
Córdoba-Gamboa L, Vázquez-Salas RA, Romero-Martínez M, Cantoral A, Riojas-Rodríguez H, Bautista-Arredondo S, Bautista-Arredondo LF, de Castro F, Tamayo-Ortiz M, Téllez-Rojo MM. Lead Exposure Can Affect Early Childhood Development and Could Be Aggravated by Stunted Growth: Perspectives from Mexico. International Journal of Environmental Research and Public Health. 2023; 20(6):5174. https://doi.org/10.3390/ijerph20065174
Chicago/Turabian StyleCórdoba-Gamboa, Leonel, Ruth Argelia Vázquez-Salas, Martin Romero-Martínez, Alejandra Cantoral, Horacio Riojas-Rodríguez, Sergio Bautista-Arredondo, Luis F. Bautista-Arredondo, Filipa de Castro, Marcela Tamayo-Ortiz, and Martha María Téllez-Rojo. 2023. "Lead Exposure Can Affect Early Childhood Development and Could Be Aggravated by Stunted Growth: Perspectives from Mexico" International Journal of Environmental Research and Public Health 20, no. 6: 5174. https://doi.org/10.3390/ijerph20065174