

Quantitative Assessment of Water Quality Improvement by Reducing External Loadings at Lake Erhai, Southwest China
 ,
,
Abstract
:1. Introduction
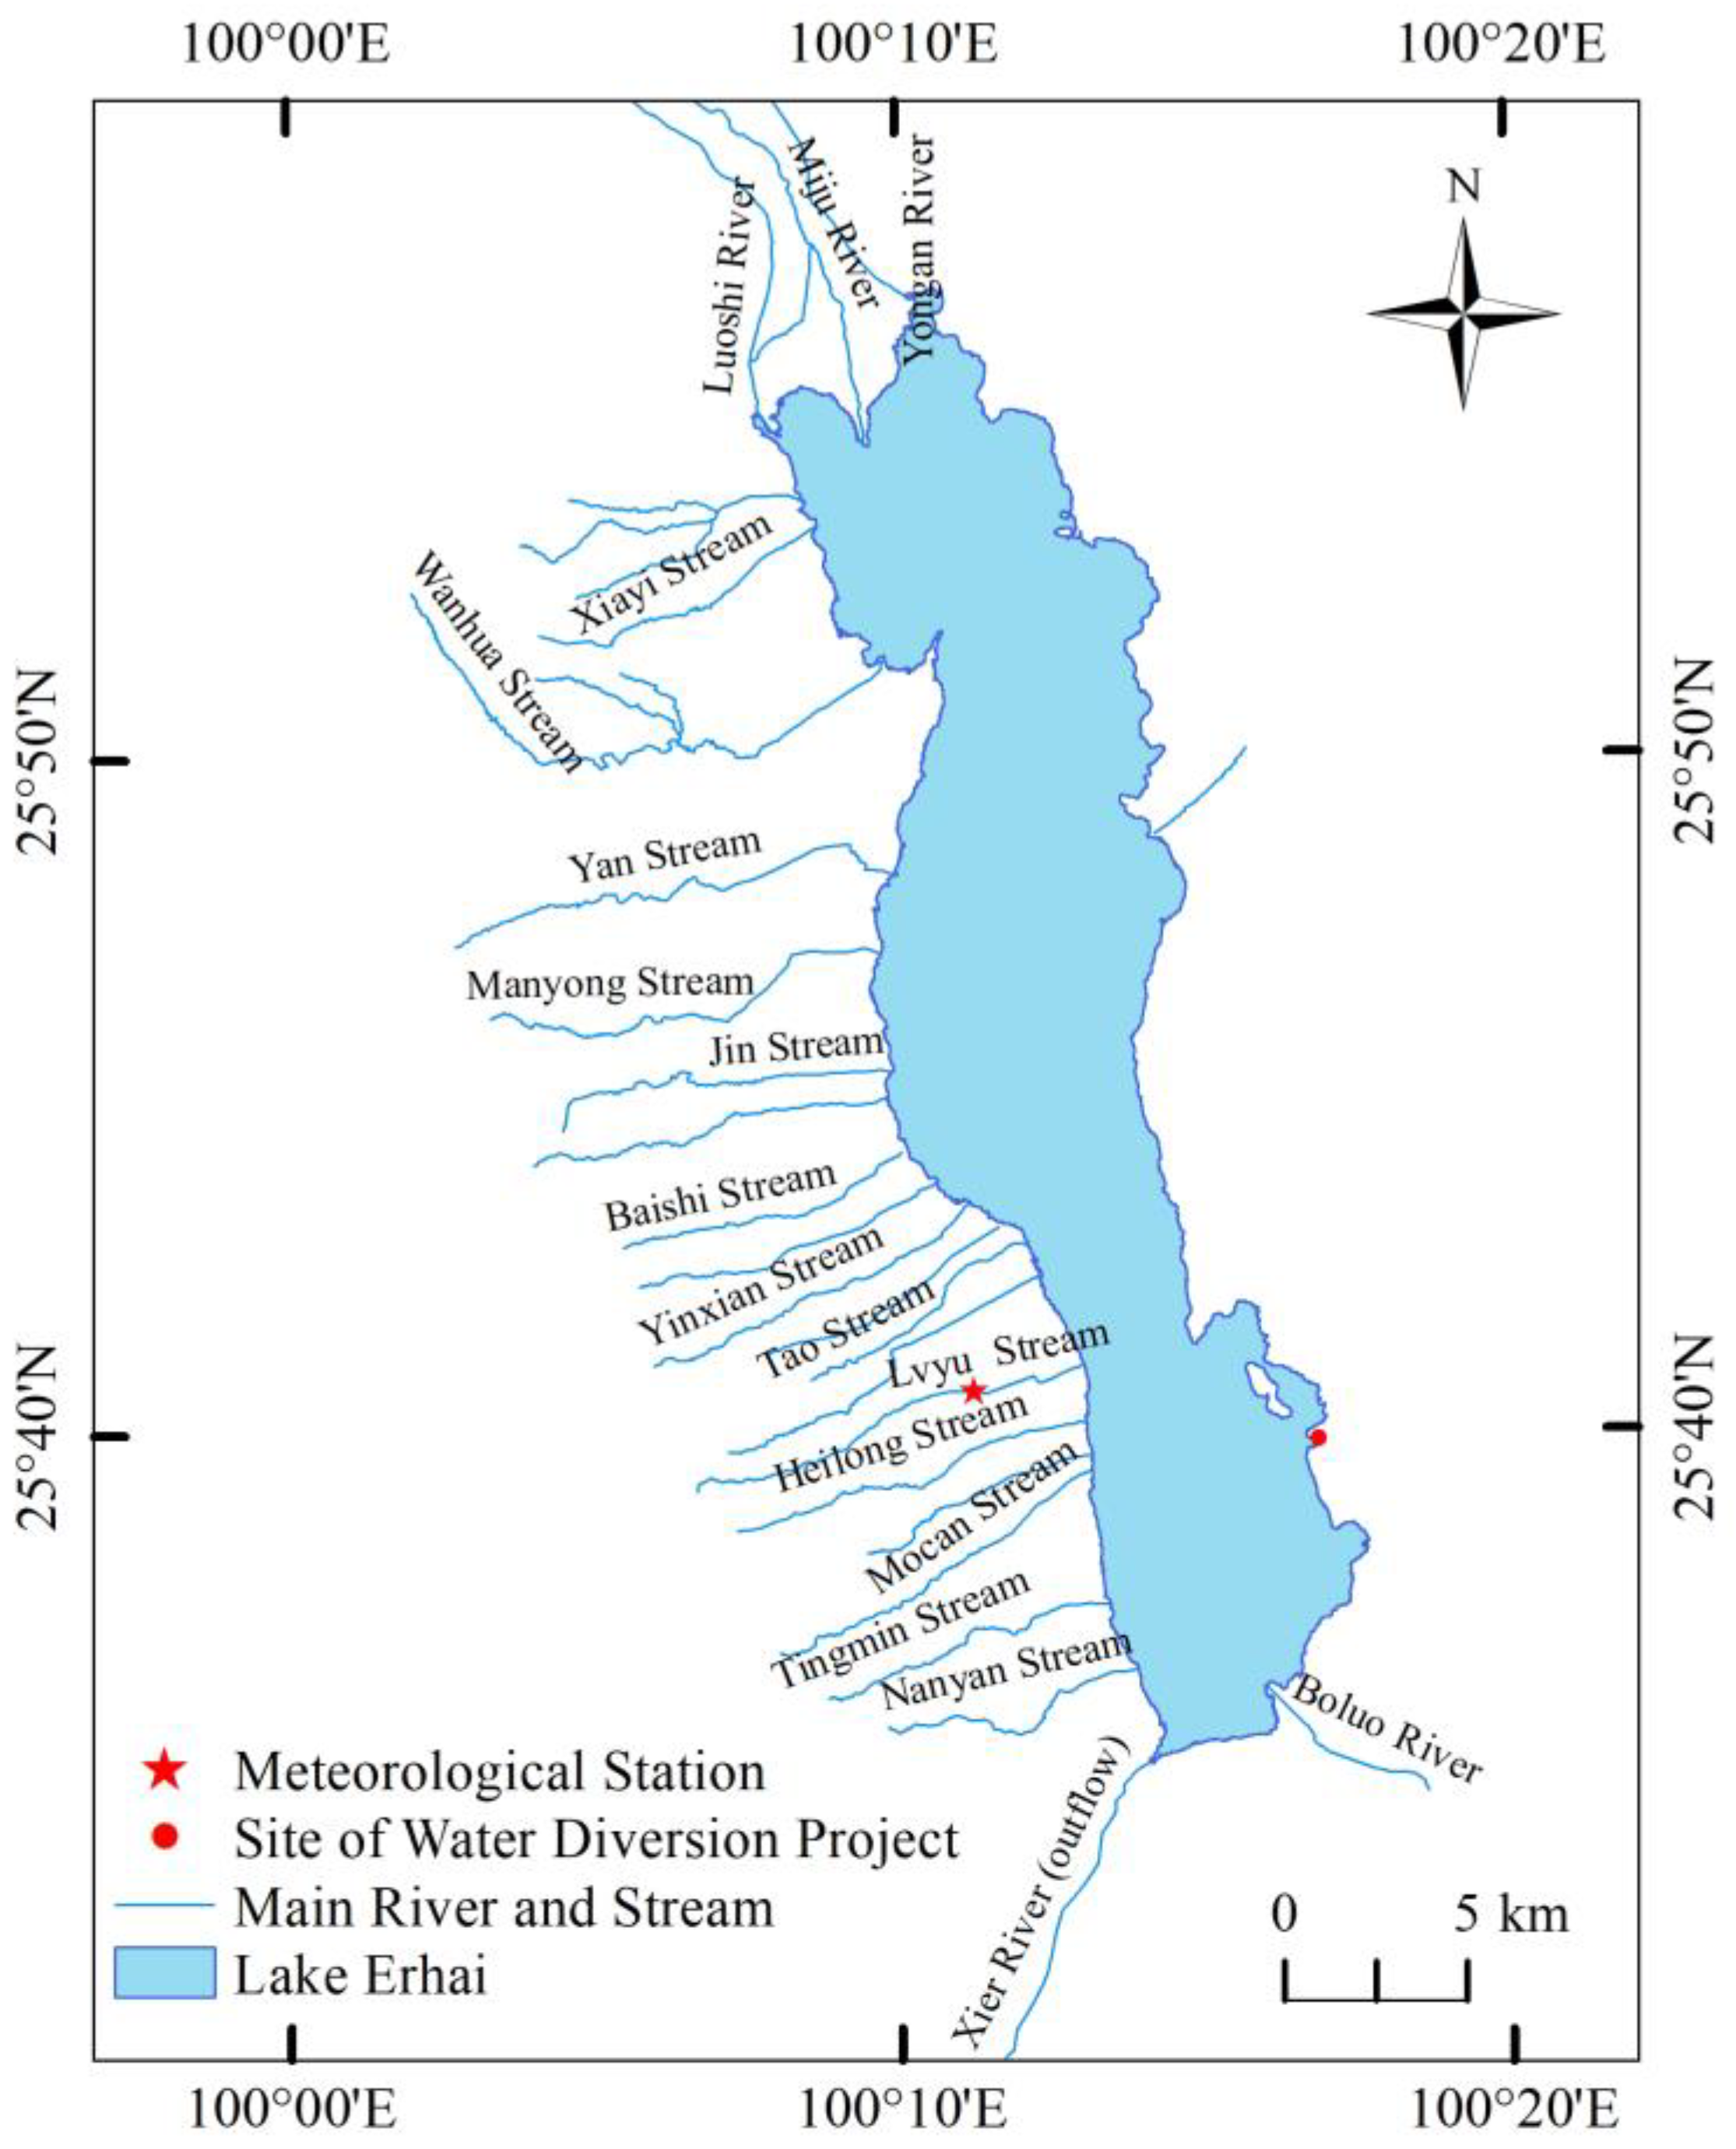
2. Study Site
3. Materials and Methods
3.1. Methods
3.1.1. DYRESM–CAEDYM
3.1.2. DYRESM–Based Water Balancing Method (DWBM)
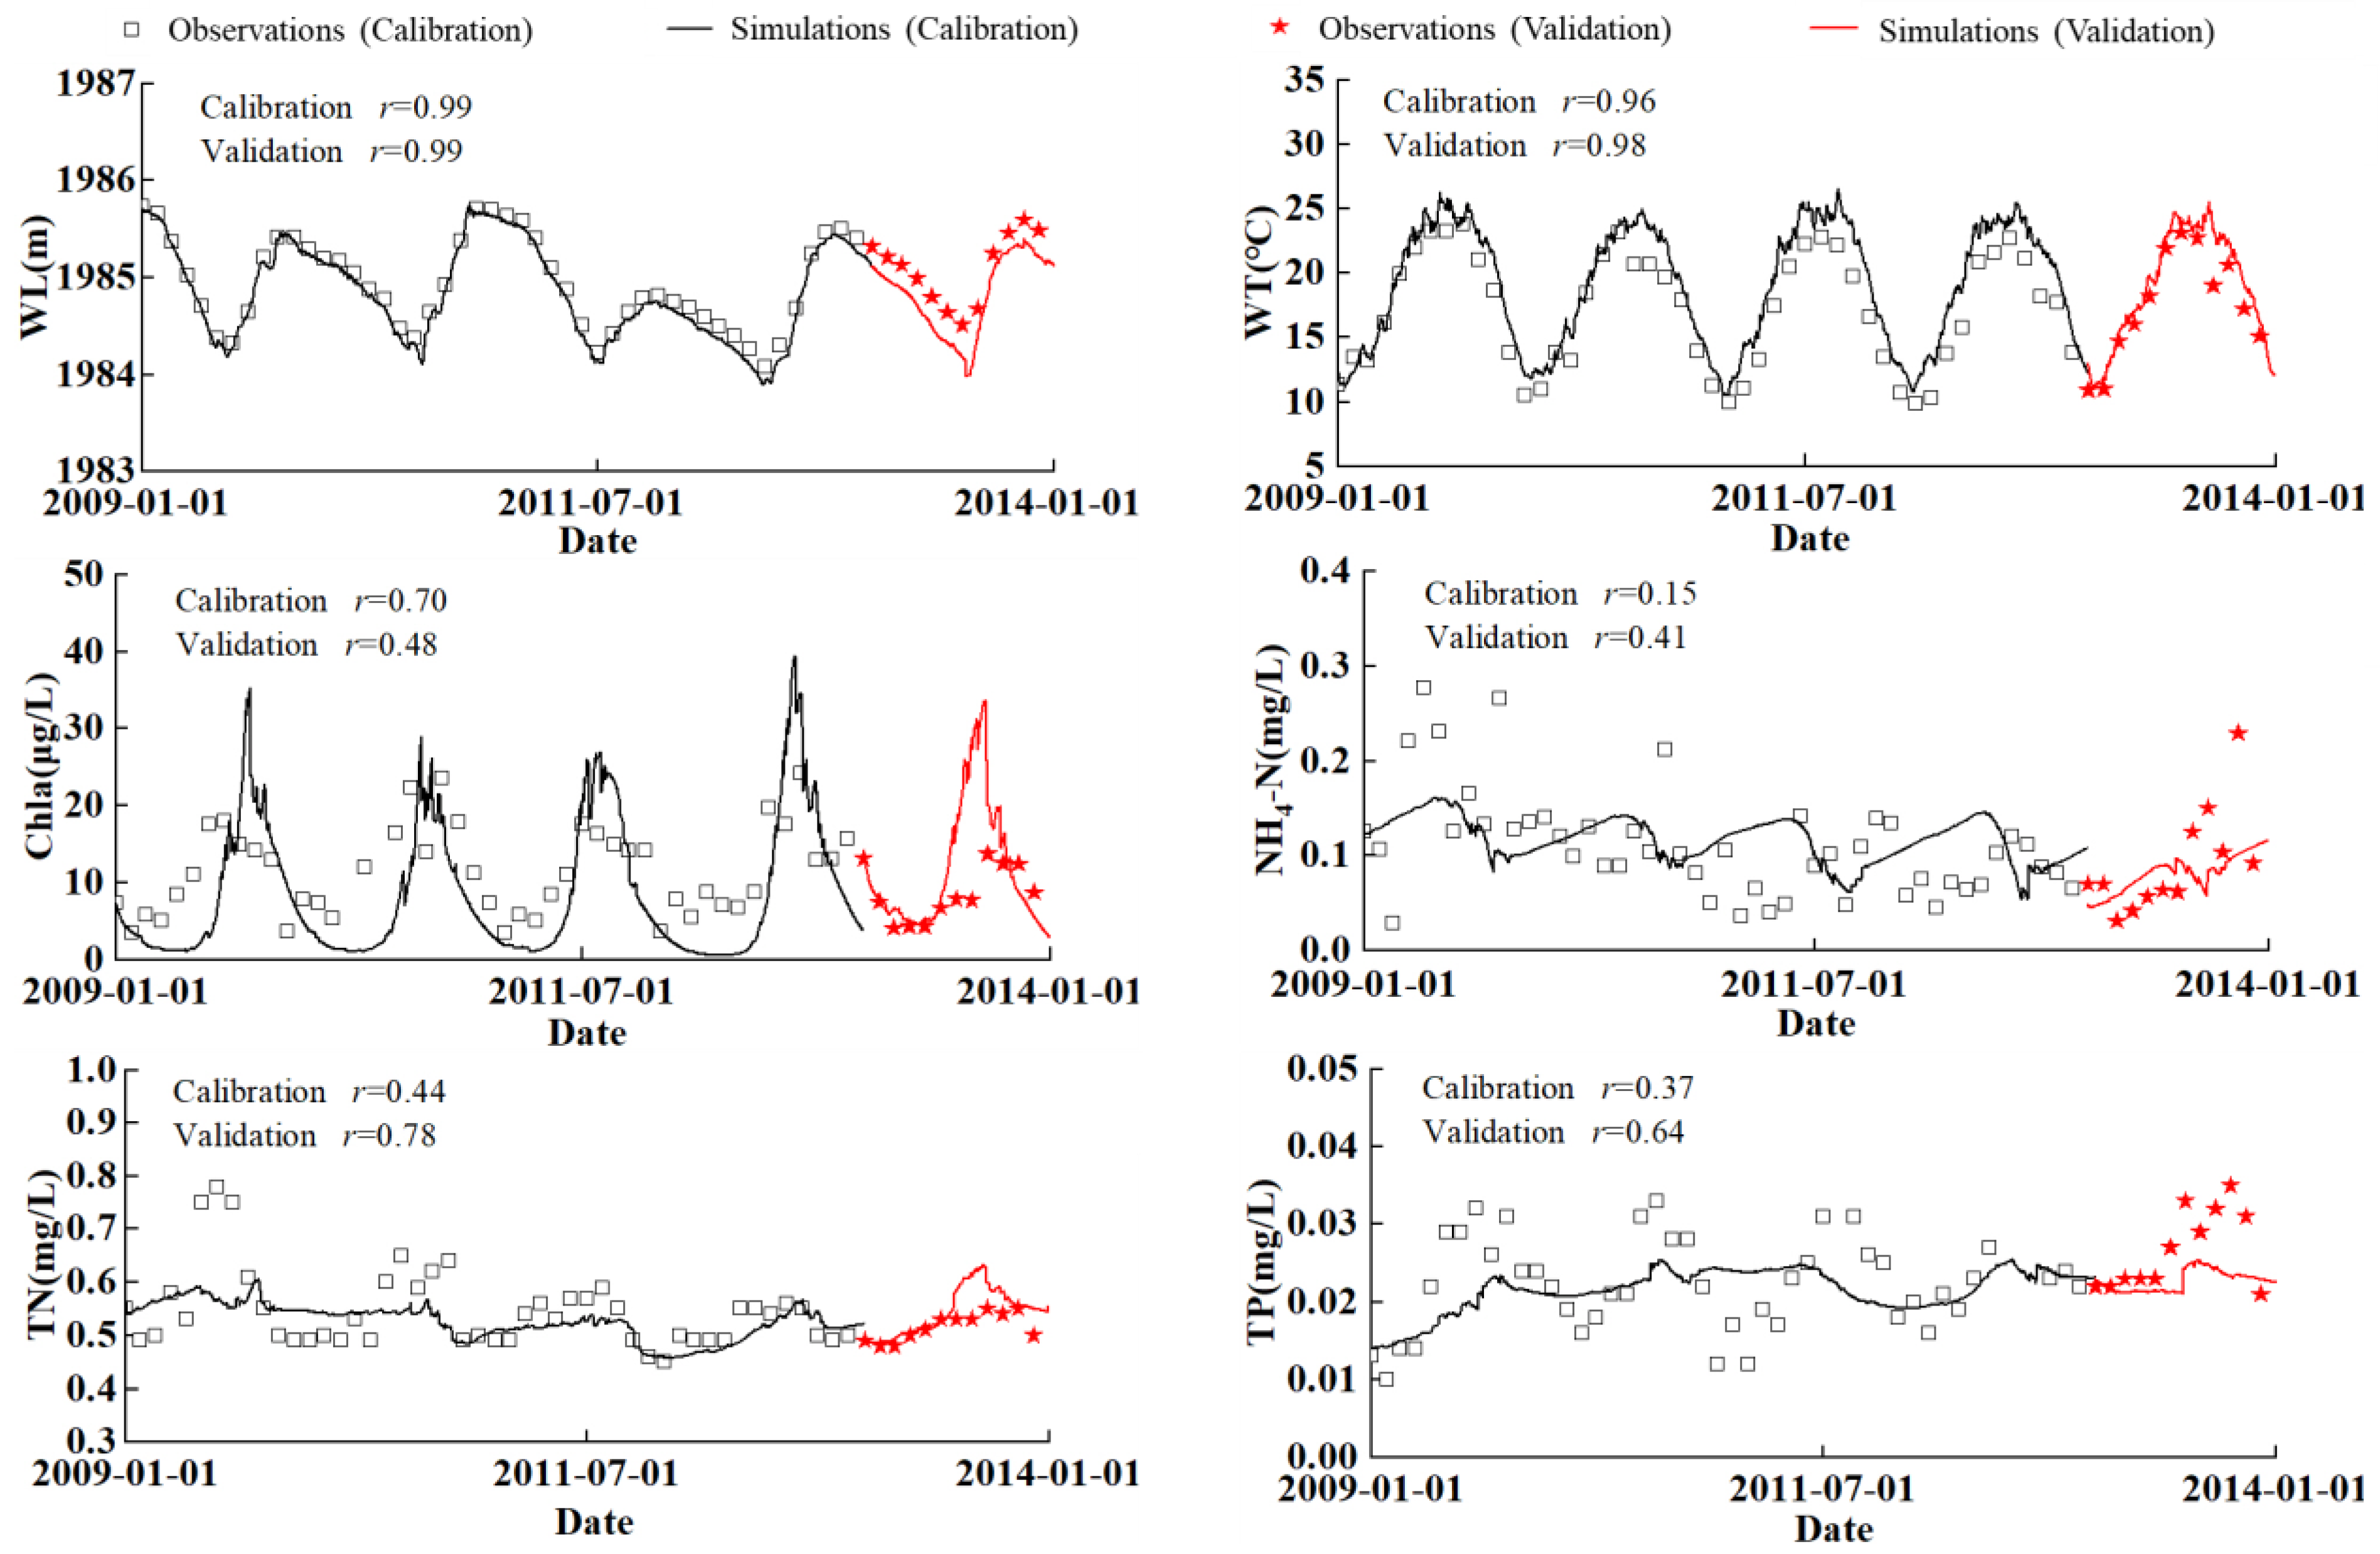
3.1.3. Calibration and Validation
3.1.4. Estimation of External Loadings
3.2. Data Source
4. Results
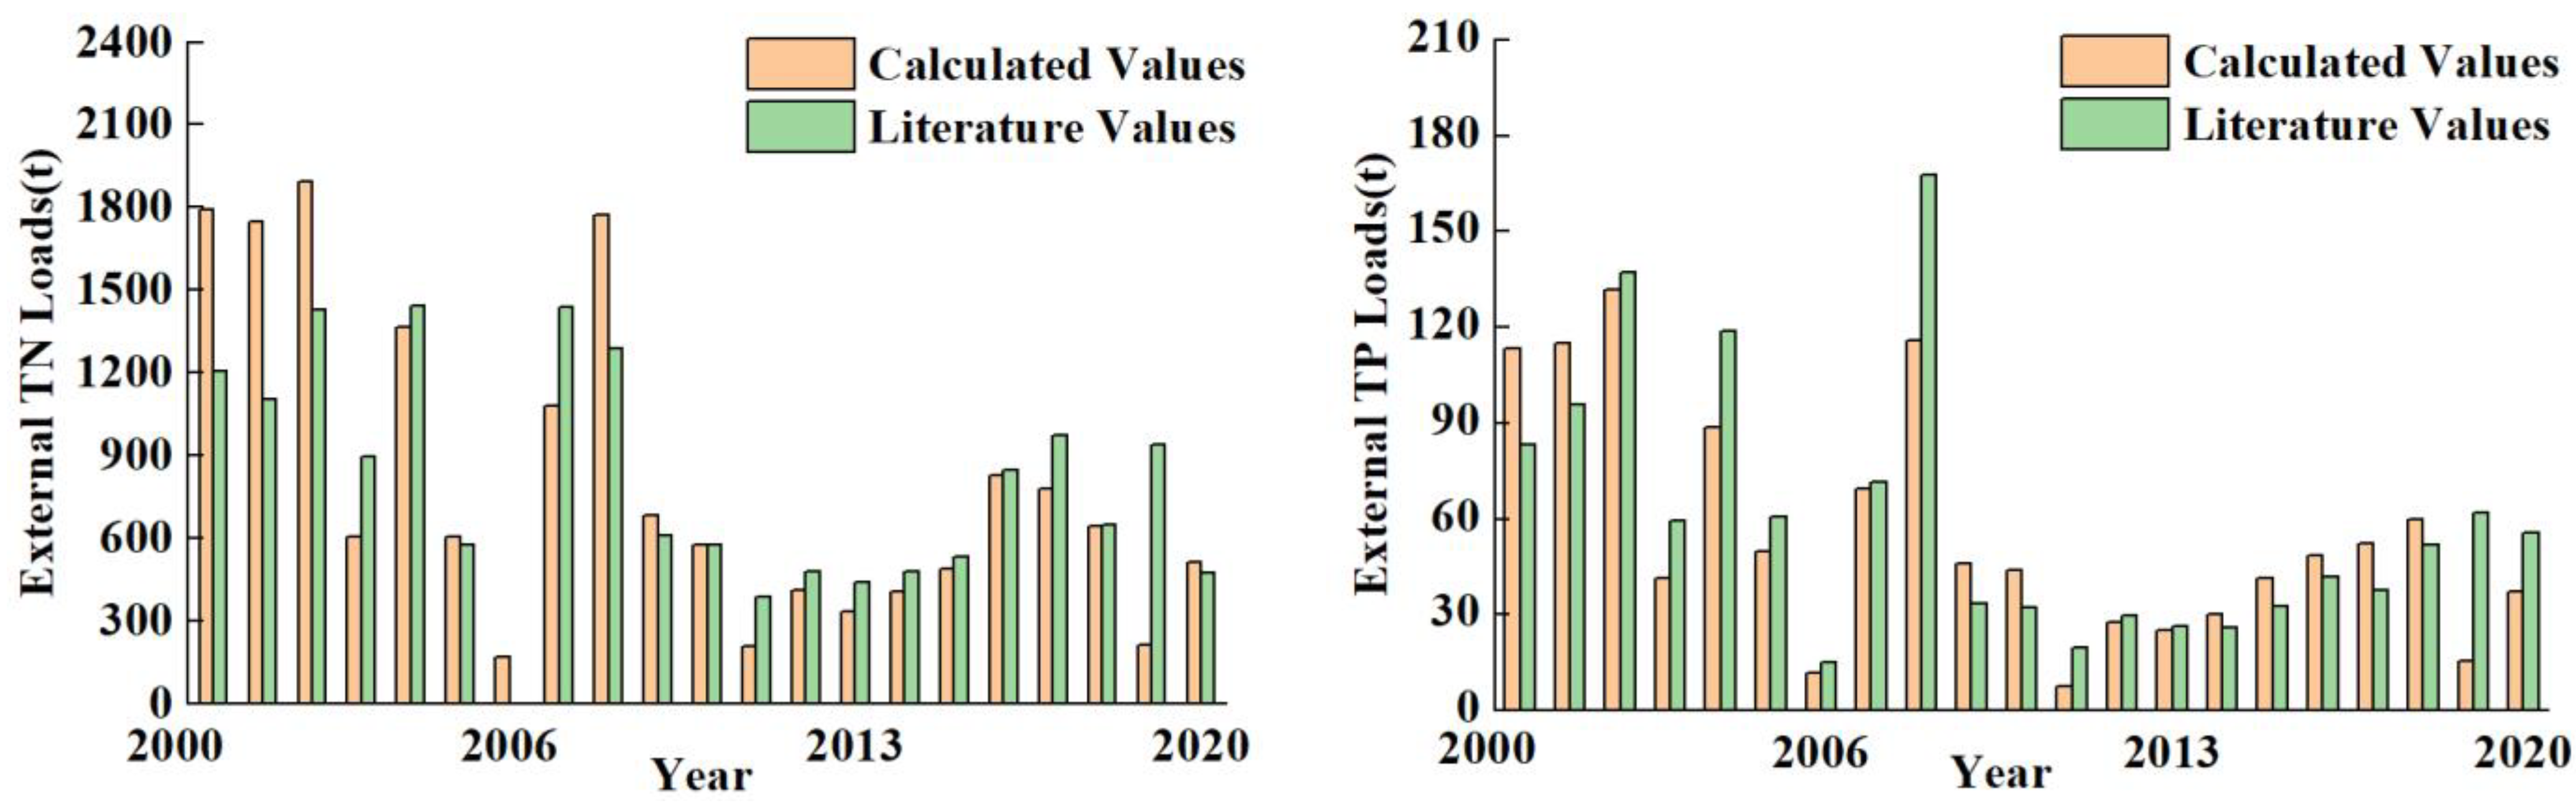
4.1. Estimation of External Loads
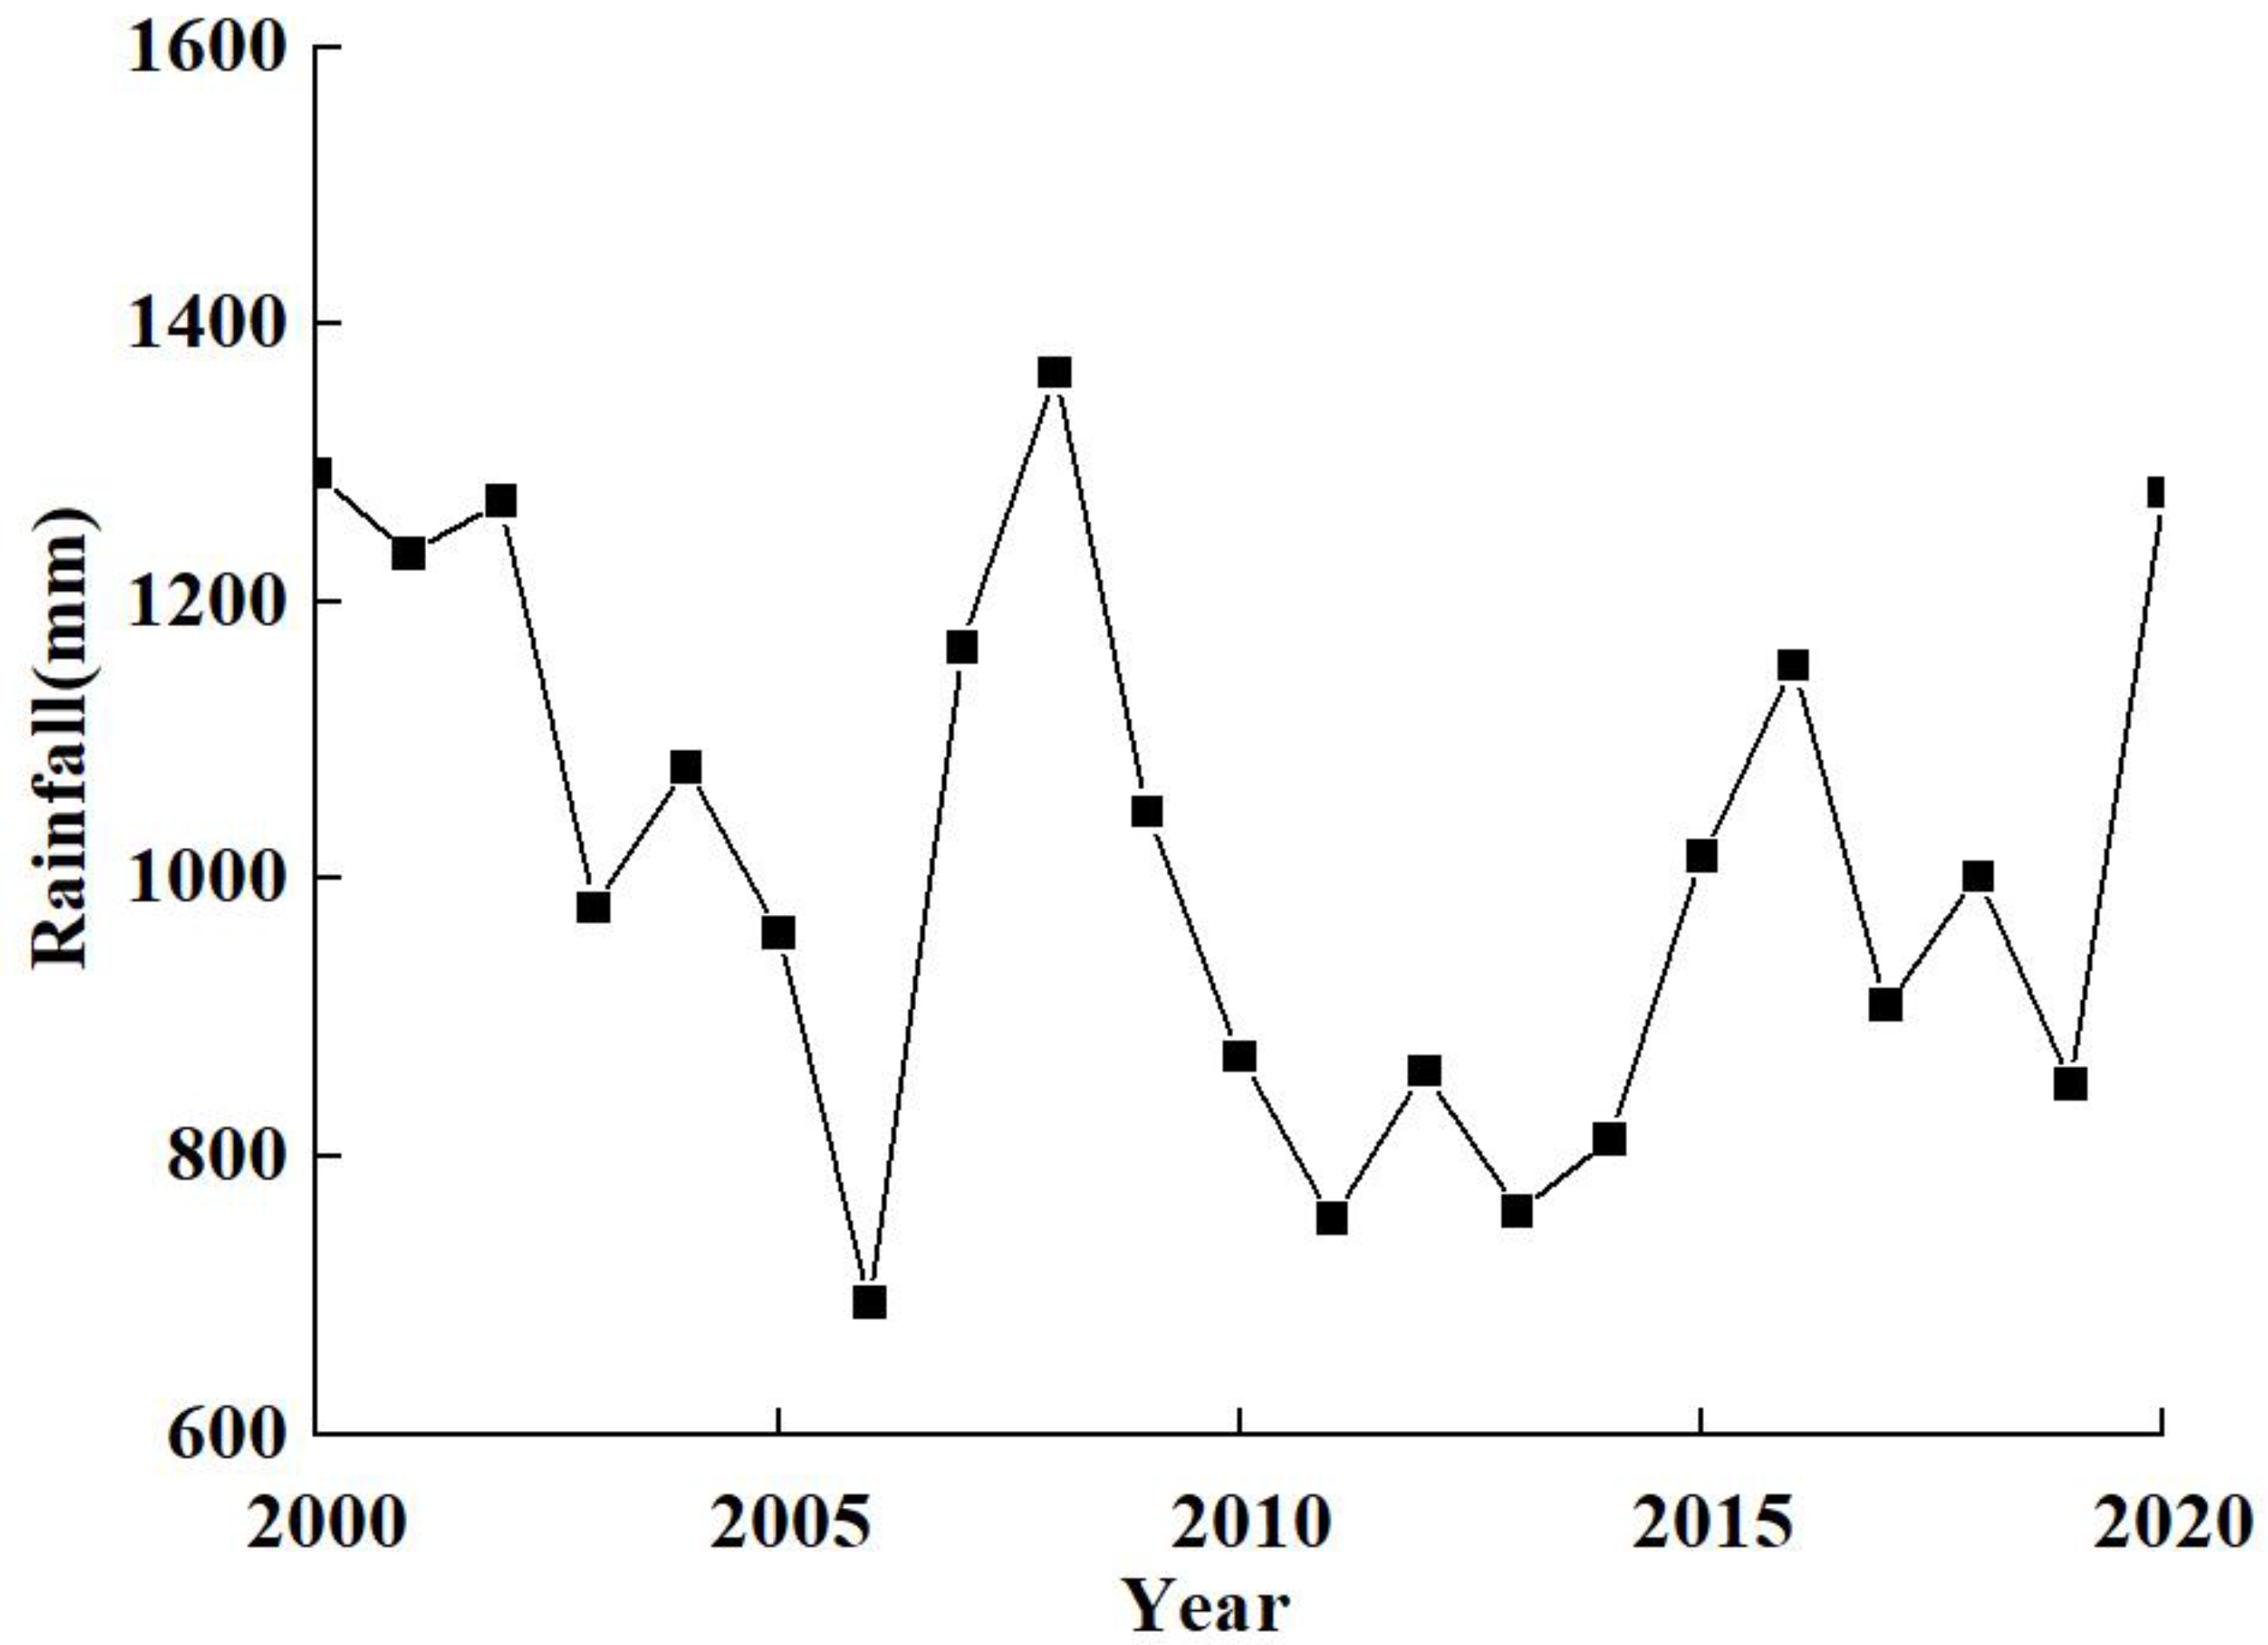
4.2. Interannual Variation of External Loadings and Its Relationship with Rainfall
4.3. Scenario
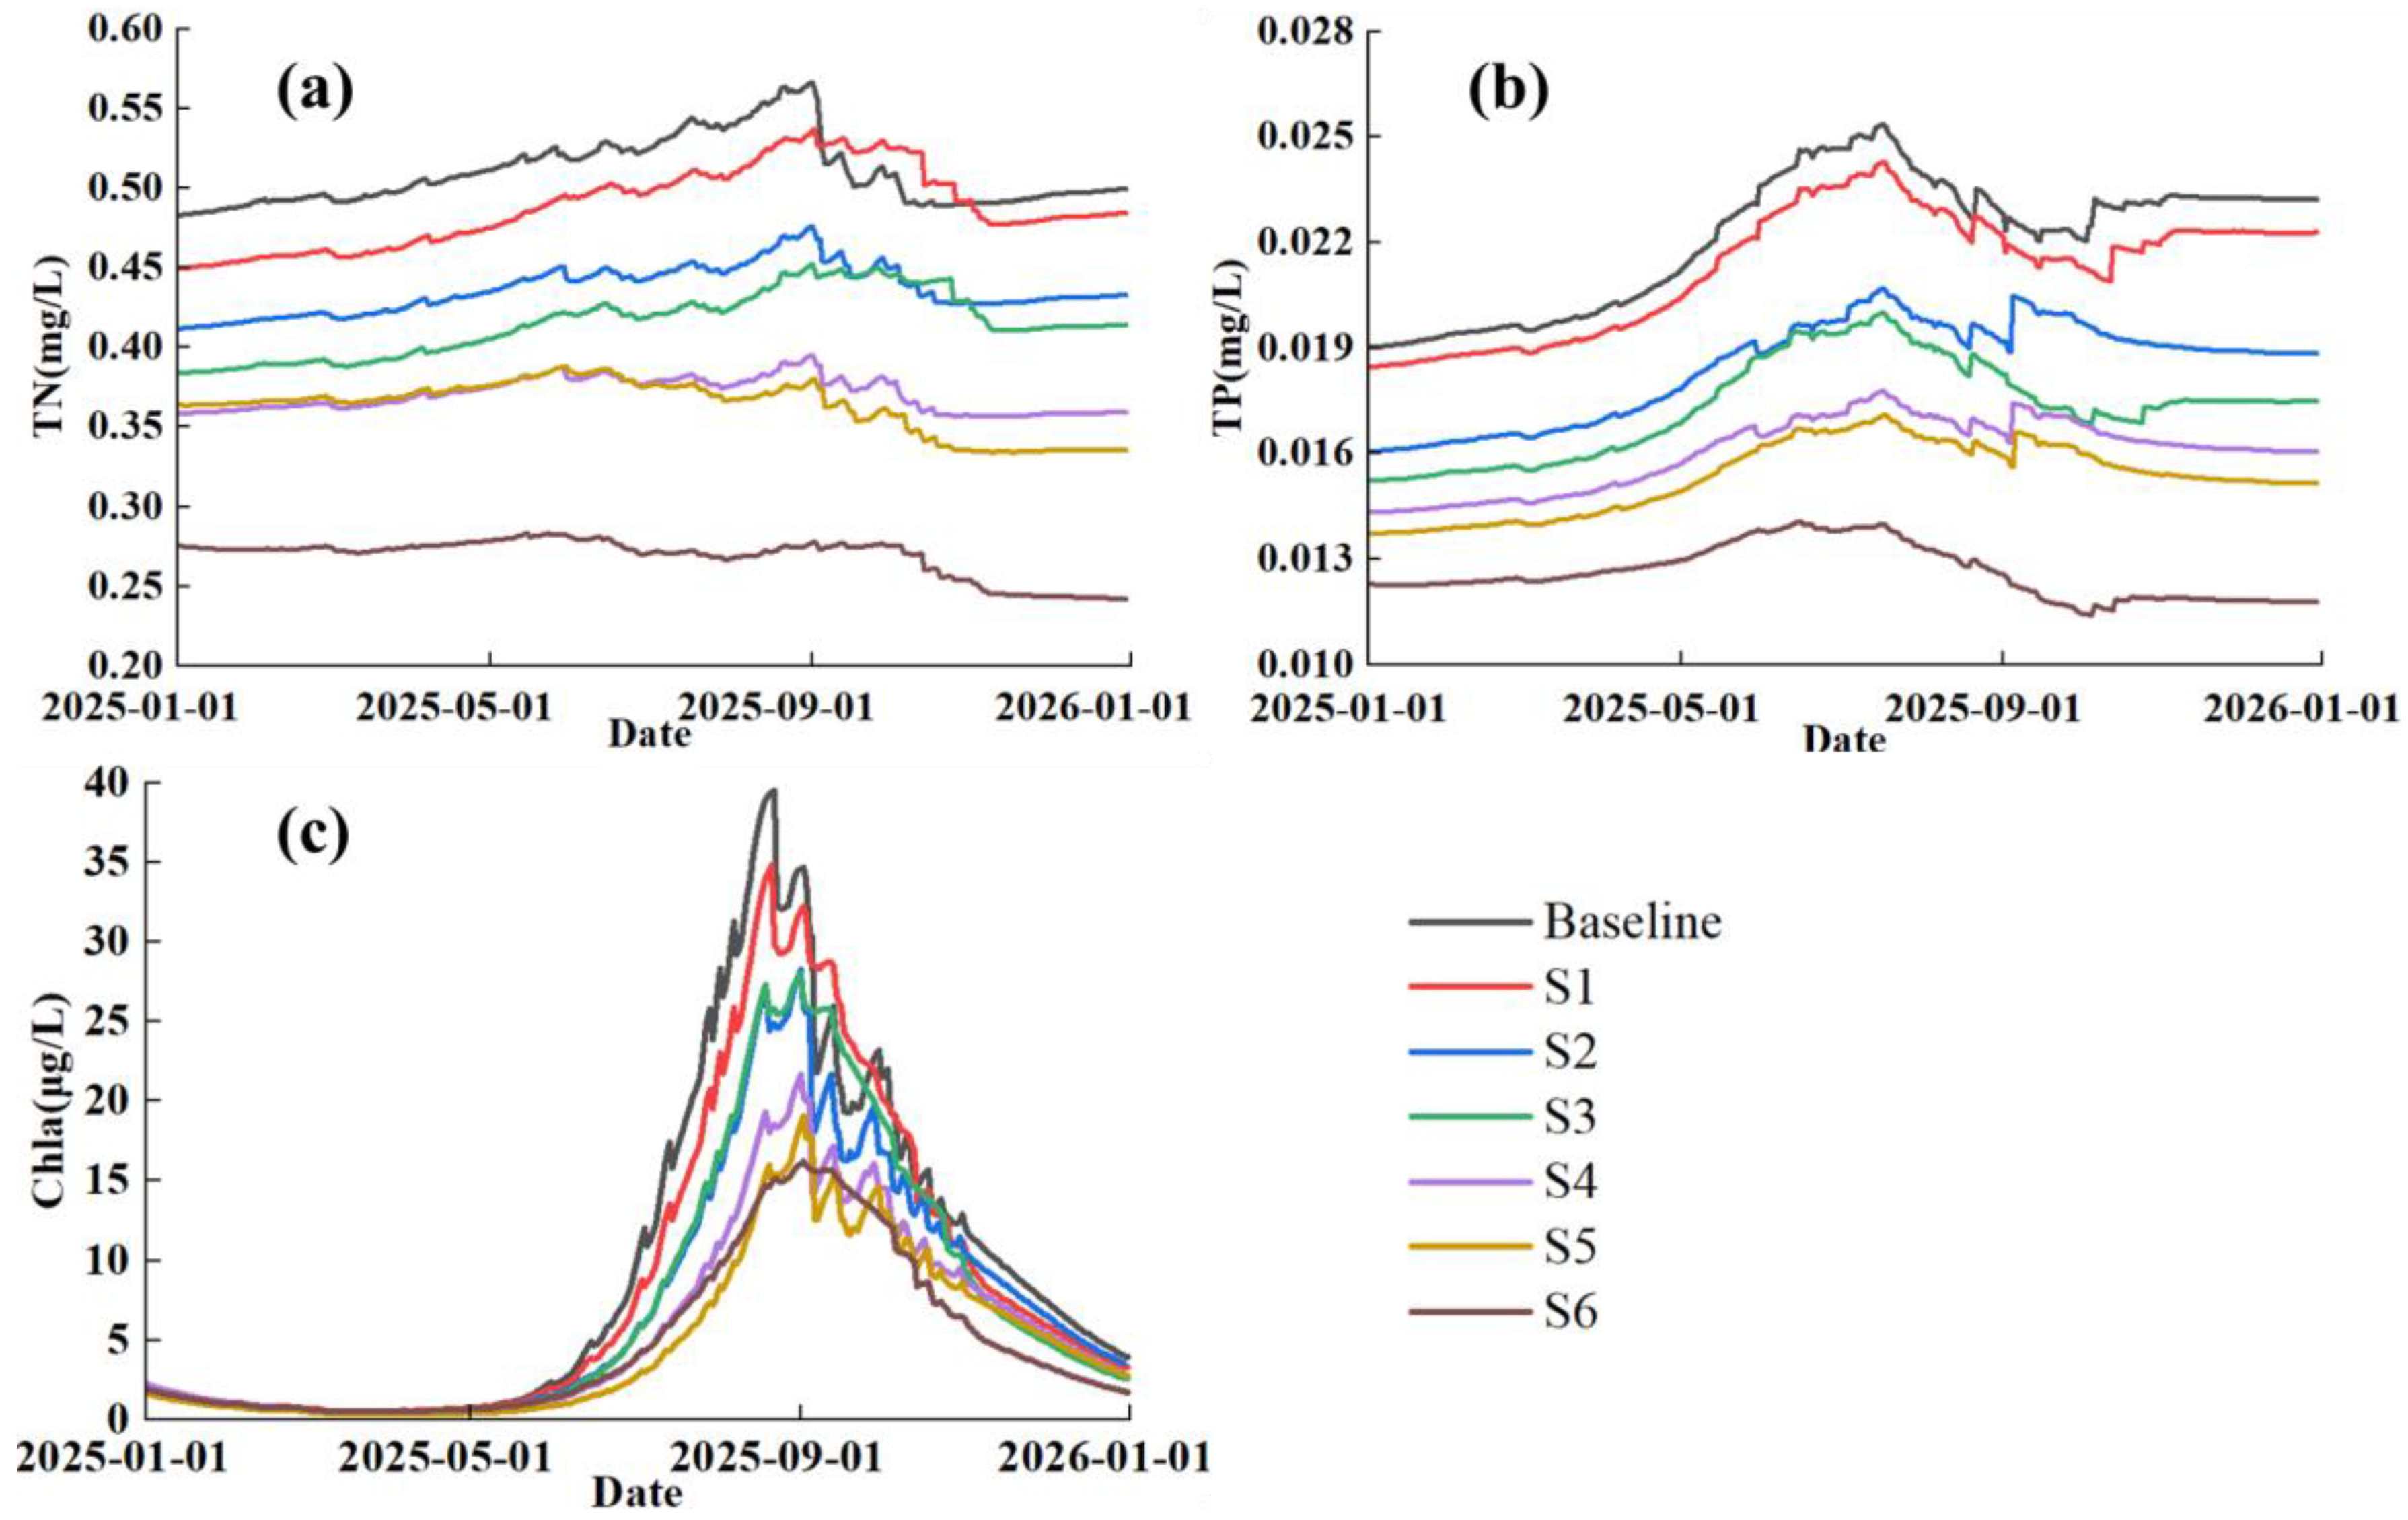
4.4. Water Quality Responses to External Loading Reductions
4.5. Comparison of Simulation Results
5. Discussion
6. Conclusions
Author Contributions
Funding
Institutional Review Board Statement
Informed Consent Statement
Data Availability Statement
Conflicts of Interest
References
- Liu, Y.; Jiang, Q.S.; Liang, Z.Y.; Wu, Z.; Liu, X.Y.; Feng, Q.Y.; Zou, R.; Guo, H.C. Lake Eutrophication Responses Modeling and Watershed Management Optimization Algorithm: A review. J. Lake Sci. 2021, 33, 49–63. (In Chinese) [Google Scholar]
- Elçi, Ş. Effects of Thermal Stratification and Mixing on Reservoir Water Quality. Limnology 2008, 9, 135–142. [Google Scholar] [CrossRef] [Green Version]
- Yin, H.B.; Zhang, M.; Yin, P.; Li, J.Y. Characterization of Internal Phosphorus Loading in the Sediment of a Large Eutrophic Lake (Lake Taihu, China). Water Res. 2022, 225, 119125. [Google Scholar] [CrossRef]
- Wu, S.F.; Liang, Z.Y.; Liu, Y. Exploring Recovery Time of Eutrophic Lakes with a Minimal Phosphorus Recycling Model. Acta Sci. Nat. Univ. Pekin. 2018, 54, 1095–1102. (In Chinese) [Google Scholar]
- Li, B.; Yang, G.; Wan, R. Multidecadal Water Quality Deterioration in the Largest Freshwater Lake in China (Poyang Lake): Implications On Eutrophication Management. Environ. Pollut. 2020, 260, 114033. [Google Scholar] [CrossRef]
- He, J.; Wu, X.; Zhang, Y.; Zheng, B.H.; Meng, D.; Zhou, H.B.; Lu, L.; Deng, W.M.; Shao, Z.; Qin, Y.H. Management of Water Quality Targets Based on River-Lake Water Quality Response Relationships for Lake Basins–A Case Study of Lake Dianchi. Environ. Res. 2020, 186, 109479. [Google Scholar] [CrossRef]
- Wang, J.; Fu, Z.; Qiao, H.X.; Liu, F.X. Assessment of Eutrophication and Water Quality in the Estuarine Area of Lake Wuli, Lake Taihu, China. Sci. Total Environ. 2019, 650, 1392–1402. [Google Scholar] [CrossRef]
- Zhao, H.C.; Wang, S.R.; Jiao, L.X.; Huang, D. Characteristics of Temporal and Spatial Distribution of Nitrogen Loading in Lake Erhai in 2010. Res. Environ. Sci. 2013, 26, 389–395. (In Chinese) [Google Scholar]
- He, X.Y.; Yan, W.M.; Wu, T.F.; Yang, T.T.; Hu, R.T. Interception Experiment of Nutrient-Laden Cohesive Sediment Imported from River Channel into Lake Taihu. China Environ. Sci. 2022, 42, 1854–1860. (In Chinese) [Google Scholar]
- Zhao, L.; Li, Y.Z.; Zou, R.; He, B.; Zhu, X.; Liu, Y.; Wang, J.S.; Zhu, Y.G. A Three-Dimensional Water Quality Modeling Approach for Exploring the Eutrophication Responses to Load Reduction Scenarios in Lake Yilong (China). Environ. Pollut. 2013, 177, 13–21. (In Chinese) [Google Scholar] [CrossRef]
- Purandara, B.K.; Varadarajan, N.; Venkatesh, B.; Choubey, V.K. Surface Water Quality Evaluation and Modeling of Ghataprabha River, Karnataka, India. Environ. Monit. Assess. 2012, 184, 1371–1378. [Google Scholar] [CrossRef]
- Li, H.Y.; Wang, Y.C.; Shan, L.; Luo, L.L.; Zhu, G.W.; Xu, H.; Shi, P.C. Effect of Rainstorm Runoff on Total Phosphorus Load in Xin’anjiang. Res. Environ. Sci. 2022, 35, 887–895. (In Chinese) [Google Scholar]
- Chen, L.M.; Qian, X.; Yang, J.; Zhang, Y.C.; Qian, Y. Water-Temperature Simulation of Taihu Lake Based on DYRESM Model And Its Application in The Fore-Warning of Cyanobacteria-Bloom. Environ. Prot. Sci. 2009, 35, 18–21. (In Chinese) [Google Scholar]
- Xie, X.Y.; Qian, X.; Zhang, Y.C.; Qian, Y.; Tian, F. Effect on Chaohu Lake Water Environment of Water Transfer from Yangtze River to Chaohu Lake. Res. Environ. Sci. 2009, 22, 897–901. (In Chinese) [Google Scholar]
- Trolle, D.; Skovgaard, H.; Jeppesen, E. The Water Framework Directive: Setting the phosphorus loading target for a deep lake in Denmark using the 1D lake ecosystem model DYRESM–CAEDYM. Ecol. Model. 2008, 219, 138–152. [Google Scholar] [CrossRef]
- Luo, L.C.; Hamilton, D.; Lan, J.; Mcbride, C.; Trolle, D. Autocalibration of a One-Dimensional Hydrodynamic-Ecological Model (DYRESM 4.0-CAEDYM 3.1) Using a Monte Carlo Approach: Simulations of Hypoxic Events in a Polymictic Lake. Geosci. Model Dev. 2018, 11, 903–913. [Google Scholar] [CrossRef] [Green Version]
- Chen, X.H.; Qian, X.Y.; Li, X.P.; Wei, Z.H.; Hu, S.Q. Long-Term Trend of Eutrophication State of Lake Erhai in 1988–2013 and Analyses of Its Socio-Economic Drivers. J. Lake Sci. 2018, 30, 70–78. (In Chinese) [Google Scholar]
- Yu, C.; Chu, J.Y.; Bai, X.H.; Liu, W.L. Seasonal Variation of Nitrogen and Phosphorus in Miju River and Lake Erhai and Influencing Factors. Acta Ecol. Sin. 2011, 31, 119–126. (In Chinese) [Google Scholar]
- Ni, Z.K.; Wang, S.R. Historical Accumulation and Environmental Risk of Nitrogen and Phosphorus in Sediments of Lake Erhai, Southwest China. Ecol. Eng. 2015, 79, 42–53. [Google Scholar] [CrossRef]
- Ma, W.; Jiang, R.C.; Zhou, Y.; Su, J.G.; Xin, L.Y. Study on Diagnosis of Water Environmental Problems and Water Quality Protection Countermeasures in Lake Erhai Basin. Yangtze River 2021, 52, 45–53. (In Chinese) [Google Scholar]
- Guo, Y.; Dong, Y.; Chen, Q.Y.; Wang, S.R.; Ni, Z.K.; Liu, X.F. Water Inflow and Endogenous Factors Drove the Changes in The Buffering Capacity of Biogenic Elements in Lake Erhai, China. Sci. Total Environ. 2022, 806, 150343. [Google Scholar] [CrossRef]
- Zhu, M.S.; Zhang, H.C.; Chang, F.Q.; Li, H.Y.; Duan, L.Z.; Meng, H.L.; Bi, R.X.; Lu, Z.M. The Seasonal Variations of the Water Quality of Erhai during 2015–2016. Adv. Environ. Prot. 2017, 7, 297–308. (In Chinese) [Google Scholar] [CrossRef]
- Li, Y.; Li, B.F.; Zhang, K.; Zhu, K.; Yang, Q.P. Spatiotemporal Distribution Characteristics of The Annual Precipitation of Yunnan Erhai Basin. South North Water Transf. Water Sci. Technol. 2017, 15, 234–240. (In Chinese) [Google Scholar]
- Xiao, M.Q.; Ni, Z.K.; Zhao, H.C.; Wang, S.R. Characteristics and Significance of Nitrogen and Phosphorus Variation During High-Risk Period of Algal Bloom in Lake Erhai. Res. Environ. Sci. 2021, 34, 294–304. (In Chinese) [Google Scholar]
- Fan, Y.; Ni, Z.K.; Wang, S.R.; Zhang, J.; Wu, S.Z. Whole Process Phosphorus Management Strategy Construction with Phosphorus Load Characteristics, Driver and Efficiency from The Material Flow Perspective. J. Clean. Prod. 2021, 279, 122896. [Google Scholar] [CrossRef]
- Imerito, A. Dynamic Reservoir Simulation Model DYRESM v4. 0 Science Manual; Centre for Water Research, University of Western Australia: Perth, Australia, 2007. [Google Scholar]
- Rinke, K.; Yeates, P.; Rothhauptk, O. A Simulation Study of the Feedback of Phytoplankton on Thermal Structure Via Light Extinction. Freshw. Biol. 2010, 55, 1674–1693. [Google Scholar] [CrossRef]
- Yeates, P.S.; Imberger, J. Pseudo Two-Dimensional Simulations of Internal and Boundary Fluxes in Stratified Lakes and Reservoirs. Int. J. River Basin Manag. 2003, 1, 297–319. [Google Scholar] [CrossRef]
- Bernard, C. Patten. A Reservoir Cove Ecosystem Model. Trans. Am. Fish. Soc. 1975, 104, 596–619. [Google Scholar]
- Spigel, R.H.; Imberger, J.; Rayner, K.N. Modeling the Diurnal Mixed Layer. Limnol. Oceanogr. 1986, 31, 533–556. [Google Scholar] [CrossRef]
- Gal, G.; Imberger, J.; Zohary, T.; Antenucci, J.; Anis, A.; Rosenberg, T. Simulating the Thermal Dynamics of Lake Kinneret. Ecol. Model. 2003, 162, 69–86. [Google Scholar] [CrossRef]
- Dong, J.; Li, G.B.; Song, L.R. Historical Changes of Phytoplankton Functional Groups in Lake Fuxian, Lake Erhai and Lake Dianchi Since 1960s. J. Lake Sci. 2014, 26, 735–742. [Google Scholar]
- Zhang, R.F.; Luo, L.C.; Pan, M.; He, F.; Luo, C.L.; Meng, D.; Li, H.Y.; Li, J.L.; Gong, F.L.; Wu, G.Z.; et al. Estimations of Water Volume and External Loading Based on DYRESM Hydrodynamic Model at Lake Dianchi. Water 2022, 14, 2832. [Google Scholar] [CrossRef]
- Li, J.L.; Li, H.Y.; Luo, L.L.; Gong, F.L.; Zhang, R.F.; Liu, F.L.; Wu, S.T.; Luo, B.Y. Water Level Retrieval for the Past and Prediction for The Next 30 Years at Lake Fuxian. J. Lake Sci. 2022, 34, 958–971. (In Chinese) [Google Scholar]
- Wu, H.X.; Wang, S.R.; Wu, T.; Yao, B.; Ni, Z.K. Assessing the Influence of Compounding Factors to the Water Level Variation of Lake Erhai. Water 2020, 13, 29. [Google Scholar] [CrossRef]
- Zhai, Y. Study on Pollution of Inflow Rivers in Lake Erhai Watershed and Constructed Wetland Technology. Master’s Thesis, Shanghai Jiao Tong University, Shanghai, China, 2012. (In Chinese). [Google Scholar]
- Yan, C.L.; Zhao, M.; Li, Z.K.; Li, J.; Duan, Y.S. Water Characteristics of Inflow Rivers in Northern Lake Erhai and Their Impact on The Northern Lake Area. Environ. Eng. 2020, 38, 59–63. (In Chinese) [Google Scholar]
- Huang, M.Y. Water Quality Characteristics and Pollution Load Estimation of Main Rivers Around Lake Erhai. Yangtze River 2022, 53, 61–66. (In Chinese) [Google Scholar]
- Yan, C.Z.; Jin, X.C.; Zhao, J.Z.; Shen, B.; Huang, C.Z.; Xiong, Z.H. Ecological Protection and Sustainable Utilization of Lake Erhai, Yunnan. Environ. Sci. 2005, 26, 38–42. [Google Scholar]
- Wang, J.L.; Lu, J.Z.; Zhang, Z.; Han, X.X.; Zhang, C.; Chen, X.L. Agricultural Non-Point Sources and Their Effects on Chlorophyll-a in a Eutrophic Lake over Three Decades (1985–2020). Environ. Sci. Pollut. Res. 2022, 29, 46634–46648. [Google Scholar] [CrossRef]
- Fenocchi, A.; Rogora, M.; Morabito, G.; Marchetto, A.; Sibilla, S.; Dresti, C. Applicability of a One-Dimensional Coupled Ecological-Hydrodynamic Numerical Model to Future Projections in a Very Deep Large Lake (Lake Maggiore, Northern Italy/Southern Switzerland). Ecol. Model. 2019, 392, 38–51. [Google Scholar] [CrossRef]
- Lu, S.Y.; Zhang, W.T.; Xing, Y.; Qu, J.T.; Li, K.; Zhang, Q.; Xue, W. Spatial Distribution of Water Quality Parameters of Rivers Around Lake Erhai During the Dry and Rainy Seasons. Environ. Earth Sci. 2015, 74, 7423–7430. [Google Scholar] [CrossRef]
- Ma, W.; Zhou, Y.; Su, J.Y.; Jiang, R.C.; Hu, X.Q. Study on the Hydrodynamic Characteristics and Transportation and Diffusion of Pollutants in Lake Erhai. J. China Inst. Water Resour. Hydropower Res. 2021, 19, 281–289. (In Chinese) [Google Scholar]
- Chen, Q.Y.; Wang, S.R.; Ni, Z.K.; Guo, Y.; Liu, X.F.; Wang, G.Q.; Li, H. No-Linear Dynamics of Lake Ecosystem in Responding to Changes of Nutrient Regimes and Climate Factors: Case Study on Lake Dianchi and Lake Erhais, China. Sci. Total Environ. 2021, 781, 146761. [Google Scholar] [CrossRef]
- Wu, G.G.; Ni, L.Y.; Cao, T.; Zhang, M.; Xie, P.; Xu, J. Warming and Nutrients Affect The Growth of Phytoplankton in Lake Erhai over the Period of 1980–2009. Lake Sci. 2022, 25, 209–212. (In Chinese) [Google Scholar]


| Grade | Surface Water | I | II | III | IV | V |
|---|---|---|---|---|---|---|
| TN (mg/L)≤ | Lake, River | 0.2 | 0.5 | 1.0 | 1.5 | 2.0 |
| TP (mg/L)≤ | River | 0.02 | 0.1 | 0.2 | 0.3 | 0.4 |
| Lake | 0.01 | 0.025 | 0.05 | 0.1 | 0.2 |
| Parameters | Reference Value | Value in This Paper |
|---|---|---|
| Bulk aerodynamic momentum transport coefficient | 1.3 × 10⁻³~2.17 × 10⁻³ [27,28] | 1.3 × 10⁻³ |
| Mean albedo of water | 0.07~0.08 [28,29] | 0.08 |
| Emissivity of a water surface | 0.94~0.96 [16,27] | 0.96 |
| Critical wind speed | 3.0~6.5 m/s [16,27] | 4.5 m/s |
| Shear production efficiency | 0.06~0.08 [16,27] | 0.08 |
| Potential energy mixing efficiency | 0.2~0.29 [16,27] | 0.25 |
| Wind stirring efficiency | 0.15~0.8 [26,30] | 0.25 |
| Vertical mixing coefficient | 200~400 [27,31] | 400 |
| Parameter | Value |
|---|---|
| Nitrification rate coefficient | 0.006/day |
| Denitrification rate coefficient | 0.05/day |
| PO4 sediment flux | 0.85 g/m2/day |
| NH4-N sediment flux | 0.01 g/m2/day |
| NO3-N sediment flux | −0.035 g/m2/day |
| Maximum potential growth rate of cyanobacteria | 0.4/day |
| Respiration rate coefficient for cyanobacteria | 0.04/day |
| Maximum potential growth rate of diatom | 0.3/day |
| Respiration rate coefficient for diatom | 0.06/day |
| Half-saturation constant for phosphorus | 0.09 mg P/L |
| Half-saturation constant for nitrogen | 0.05 mg N/L |
| Data Type | Period | Description | Data Source |
|---|---|---|---|
| Lake topography | — | Water depth | Erhai Administration Bureau |
| Meteorology | 2000~2020 | Daily meteorological data from Dali Meteorological Station (NO.56751, 25.7° N, 100°18′41′′ E) | The China Meteorological Data Service Center |
| outflows | 2000~2020 | Annual data were distributed to each month of the year according to the proportion of rainfall, and then evenly distributed to each day of the month | Wu et al., 2020 [35] |
| Water quality of inflow rivers1 | 2008~2019 | Monthly TN and TP, missed values were replaced by multiyear averaged value in the same month | Yu et al., 2011; Zhao et al., 2012; Yan et al., 2020; Huang et al., 2016; [18,36,37,38] |
| WLs | 2000~2020 | Daily WLs | Erhai Administration Bureau |
| Vertical profile of water quality 1 | January~December 2015 | Monthly data, WT, and DO data were collected at 1 m interval | Zhu et al., 2017 [22] |
| Water quality of Lake Erhai 1 | 2008~2020 | Monthly monitoring by conventional method | Erhai Administration Bureau |
| Scenarios | Reduction Rate of External Loads | TN Loads (t/y) | TP Loads (t/y) |
|---|---|---|---|
| Baseline | 0 | 515.42 | 37.34 |
| S1 | 10% | 463.88 | 33.61 |
| S2 | 20% | 412.34 | 29.87 |
| S3 | 30% | 360.79 | 26.14 |
| S4 | 40% | 309.25 | 22.40 |
| S5 | 50% | 257.71 | 18.67 |
| S6 | Grade Ⅲ for water quality of inflow rivers | 231.64 | 27.75 |
| Scenarios | TN | TP | Chla | |||
|---|---|---|---|---|---|---|
| Annual Concentration (mg/L) | Improvement Rate (%) | Annual Concentration (mg/L) | Improvement Rate (%) | Annual Concentration (mg/L) | Improvement Rate (%) | |
| Baseline | 0.51 | — | 0.021 | — | 8.30 | — |
| S1 | 0.49 | 3.27 | 0.020 | 4.15 | 8.72 | −4.37 |
| S2 | 0.44 | 13.42 | 0.019 | 12.32 | 7.20 | 11.75 |
| S3 | 0.41 | 17.57 | 0.017 | 17.46 | 7.39 | 9.48 |
| S4 | 0.37 | 26.37 | 0.016 | 23.28 | 5.66 | 27.78 |
| S5 | 0.36 | 27.75 | 0.015 | 26.43 | 4.81 | 36.63 |
| S6 | 0.27 | 46.32 | 0.013 | 38.74 | 4.76 | 37.07 |
Disclaimer/Publisher’s Note: The statements, opinions and data contained in all publications are solely those of the individual author(s) and contributor(s) and not of MDPI and/or the editor(s). MDPI and/or the editor(s) disclaim responsibility for any injury to people or property resulting from any ideas, methods, instructions or products referred to in the content. |
© 2023 by the authors. Licensee MDPI, Basel, Switzerland. This article is an open access article distributed under the terms and conditions of the Creative Commons Attribution (CC BY) license (https://creativecommons.org/licenses/by/4.0/).
Share and Cite
Gong, F.; Luo, L.; Li, H.; Chen, L.; Zhang, R.; Wu, G.; Zhang, J.; Shi, W.; Zhang, F.; Zhang, H.; et al. Quantitative Assessment of Water Quality Improvement by Reducing External Loadings at Lake Erhai, Southwest China. Int. J. Environ. Res. Public Health 2023, 20, 5038. https://doi.org/10.3390/ijerph20065038
Gong F, Luo L, Li H, Chen L, Zhang R, Wu G, Zhang J, Shi W, Zhang F, Zhang H, et al. Quantitative Assessment of Water Quality Improvement by Reducing External Loadings at Lake Erhai, Southwest China. International Journal of Environmental Research and Public Health. 2023; 20(6):5038. https://doi.org/10.3390/ijerph20065038
Chicago/Turabian StyleGong, Falu, Liancong Luo, Huiyun Li, Lan Chen, Rufeng Zhang, Guizhu Wu, Jian Zhang, Weiqiang Shi, Fan Zhang, Hao Zhang, and et al. 2023. "Quantitative Assessment of Water Quality Improvement by Reducing External Loadings at Lake Erhai, Southwest China" International Journal of Environmental Research and Public Health 20, no. 6: 5038. https://doi.org/10.3390/ijerph20065038