

Ecological Risk Assessment of Geological Disasters Based on Probability-Loss Framework: A Case Study of Fujian, China
 ,
,  ,
,
Abstract
:1. Introduction
2. Materials and Methods
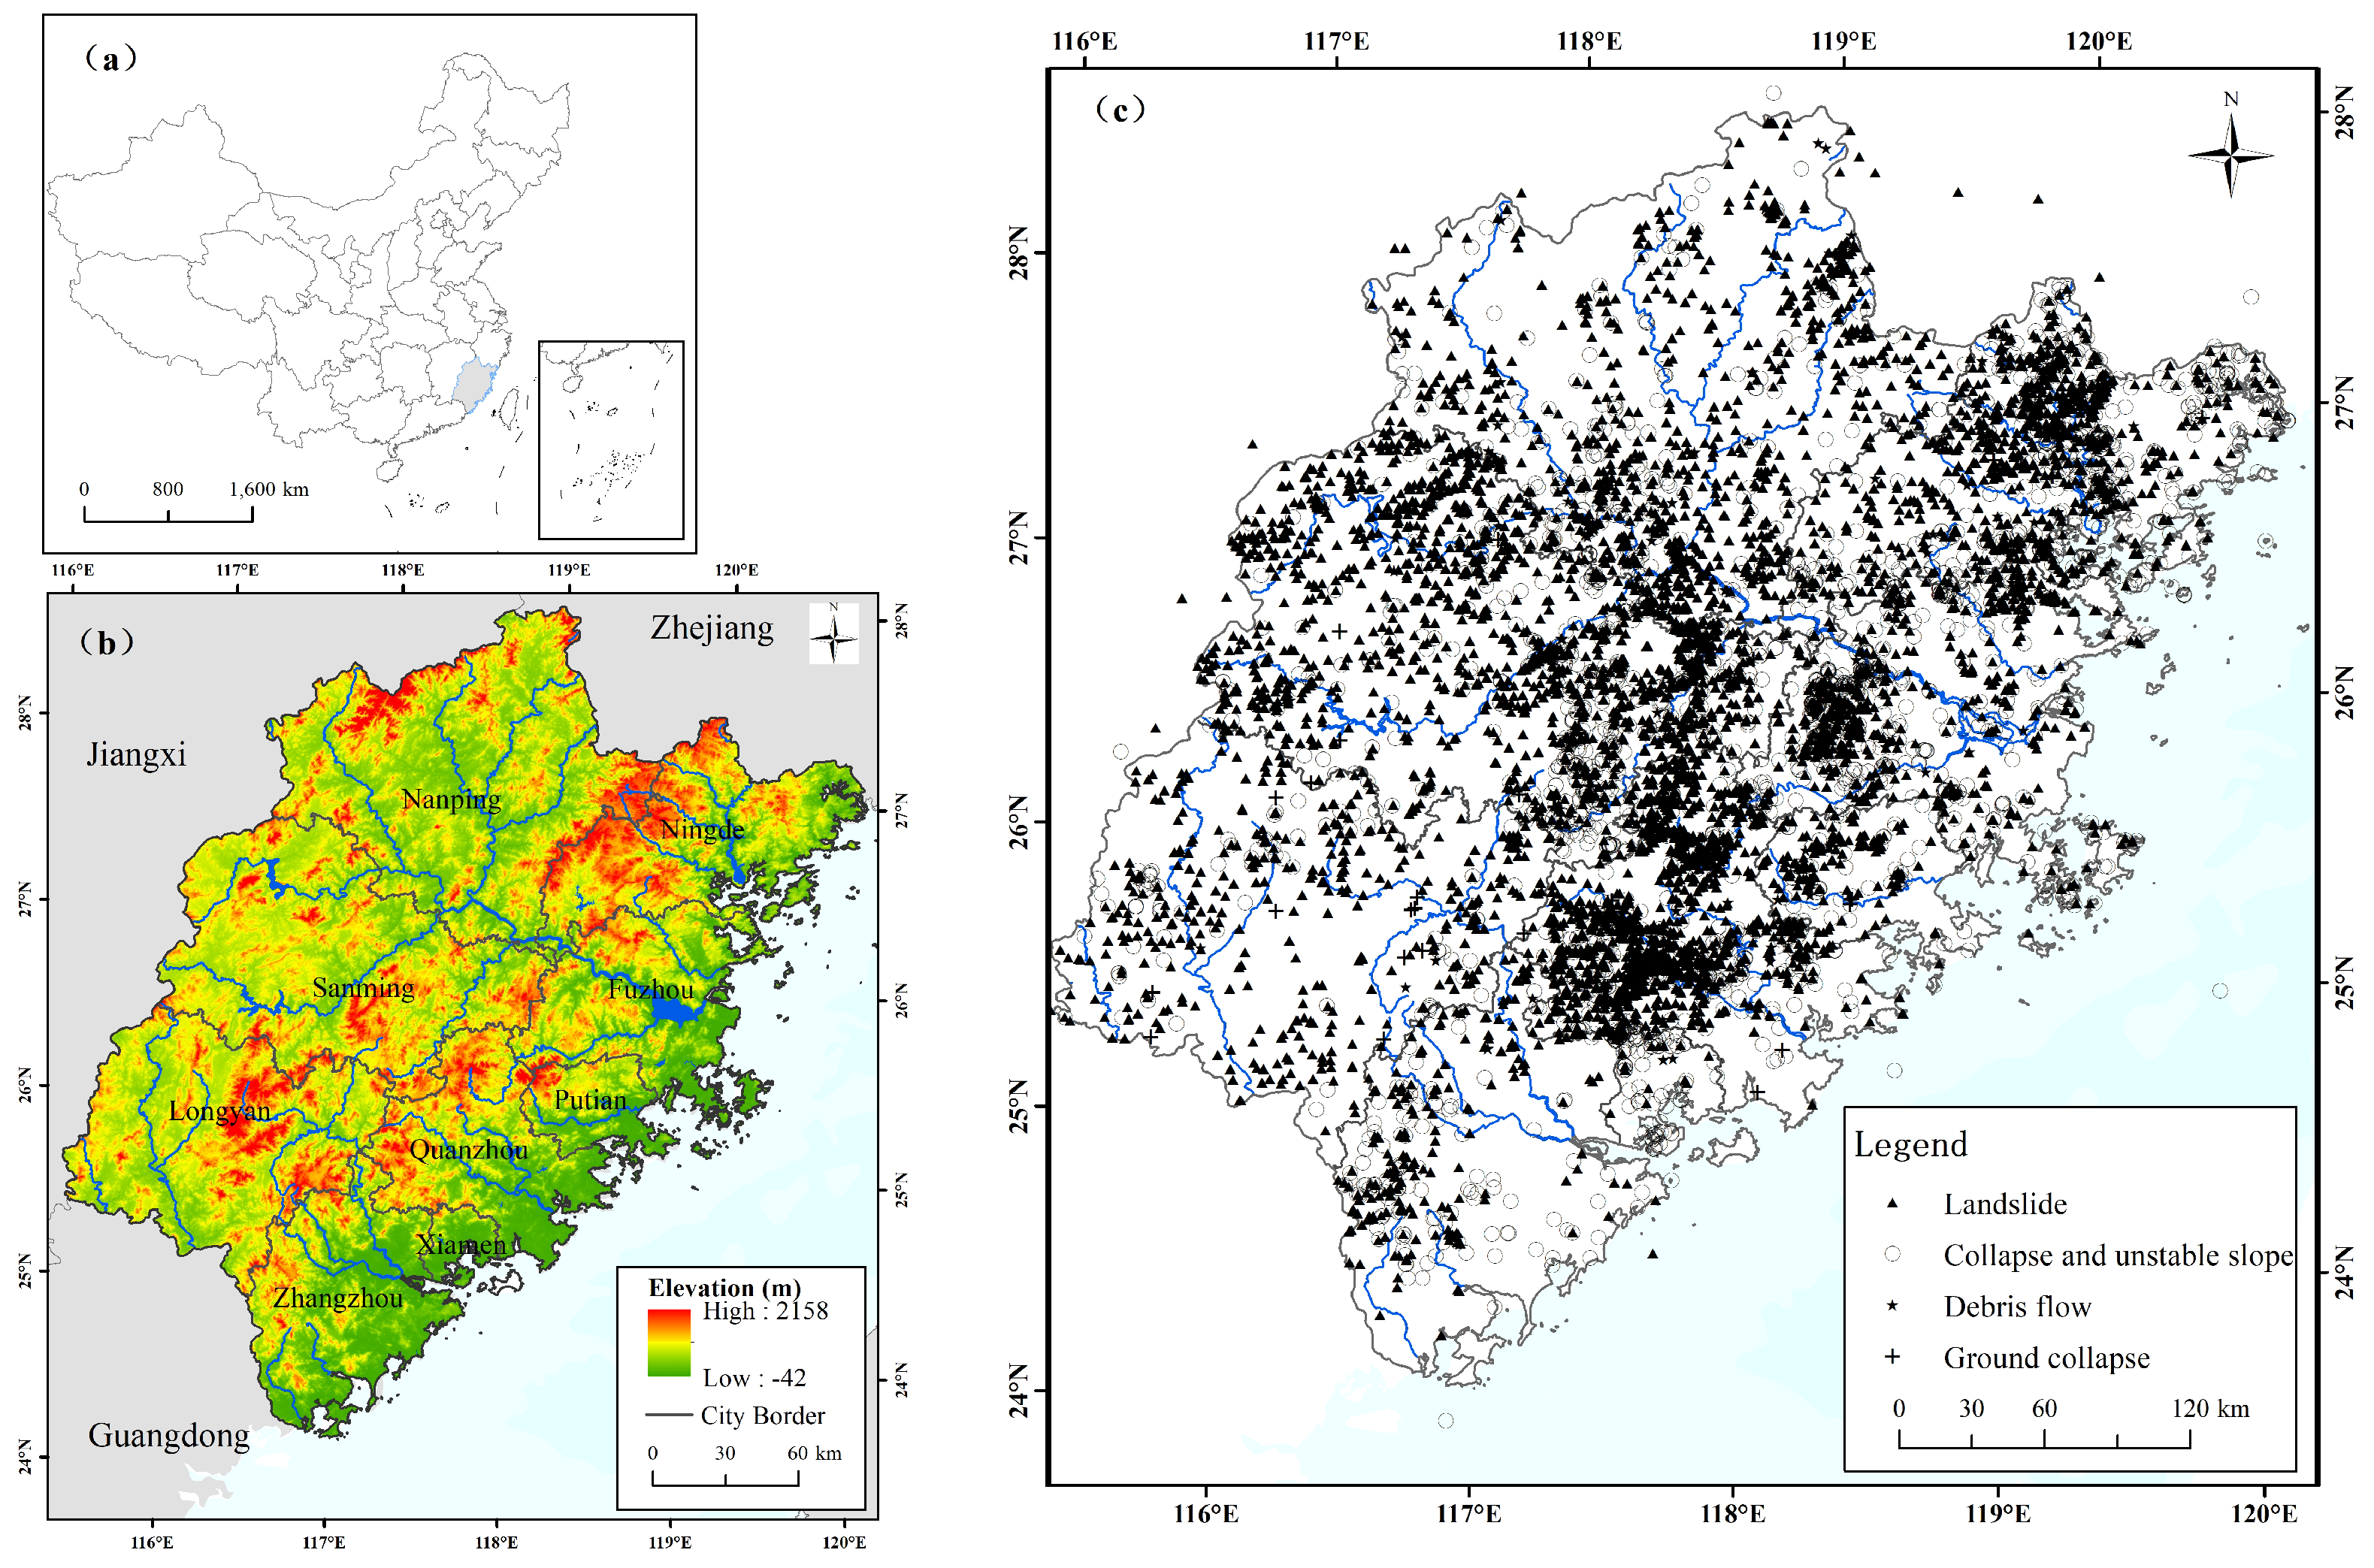
2.1. Study Area
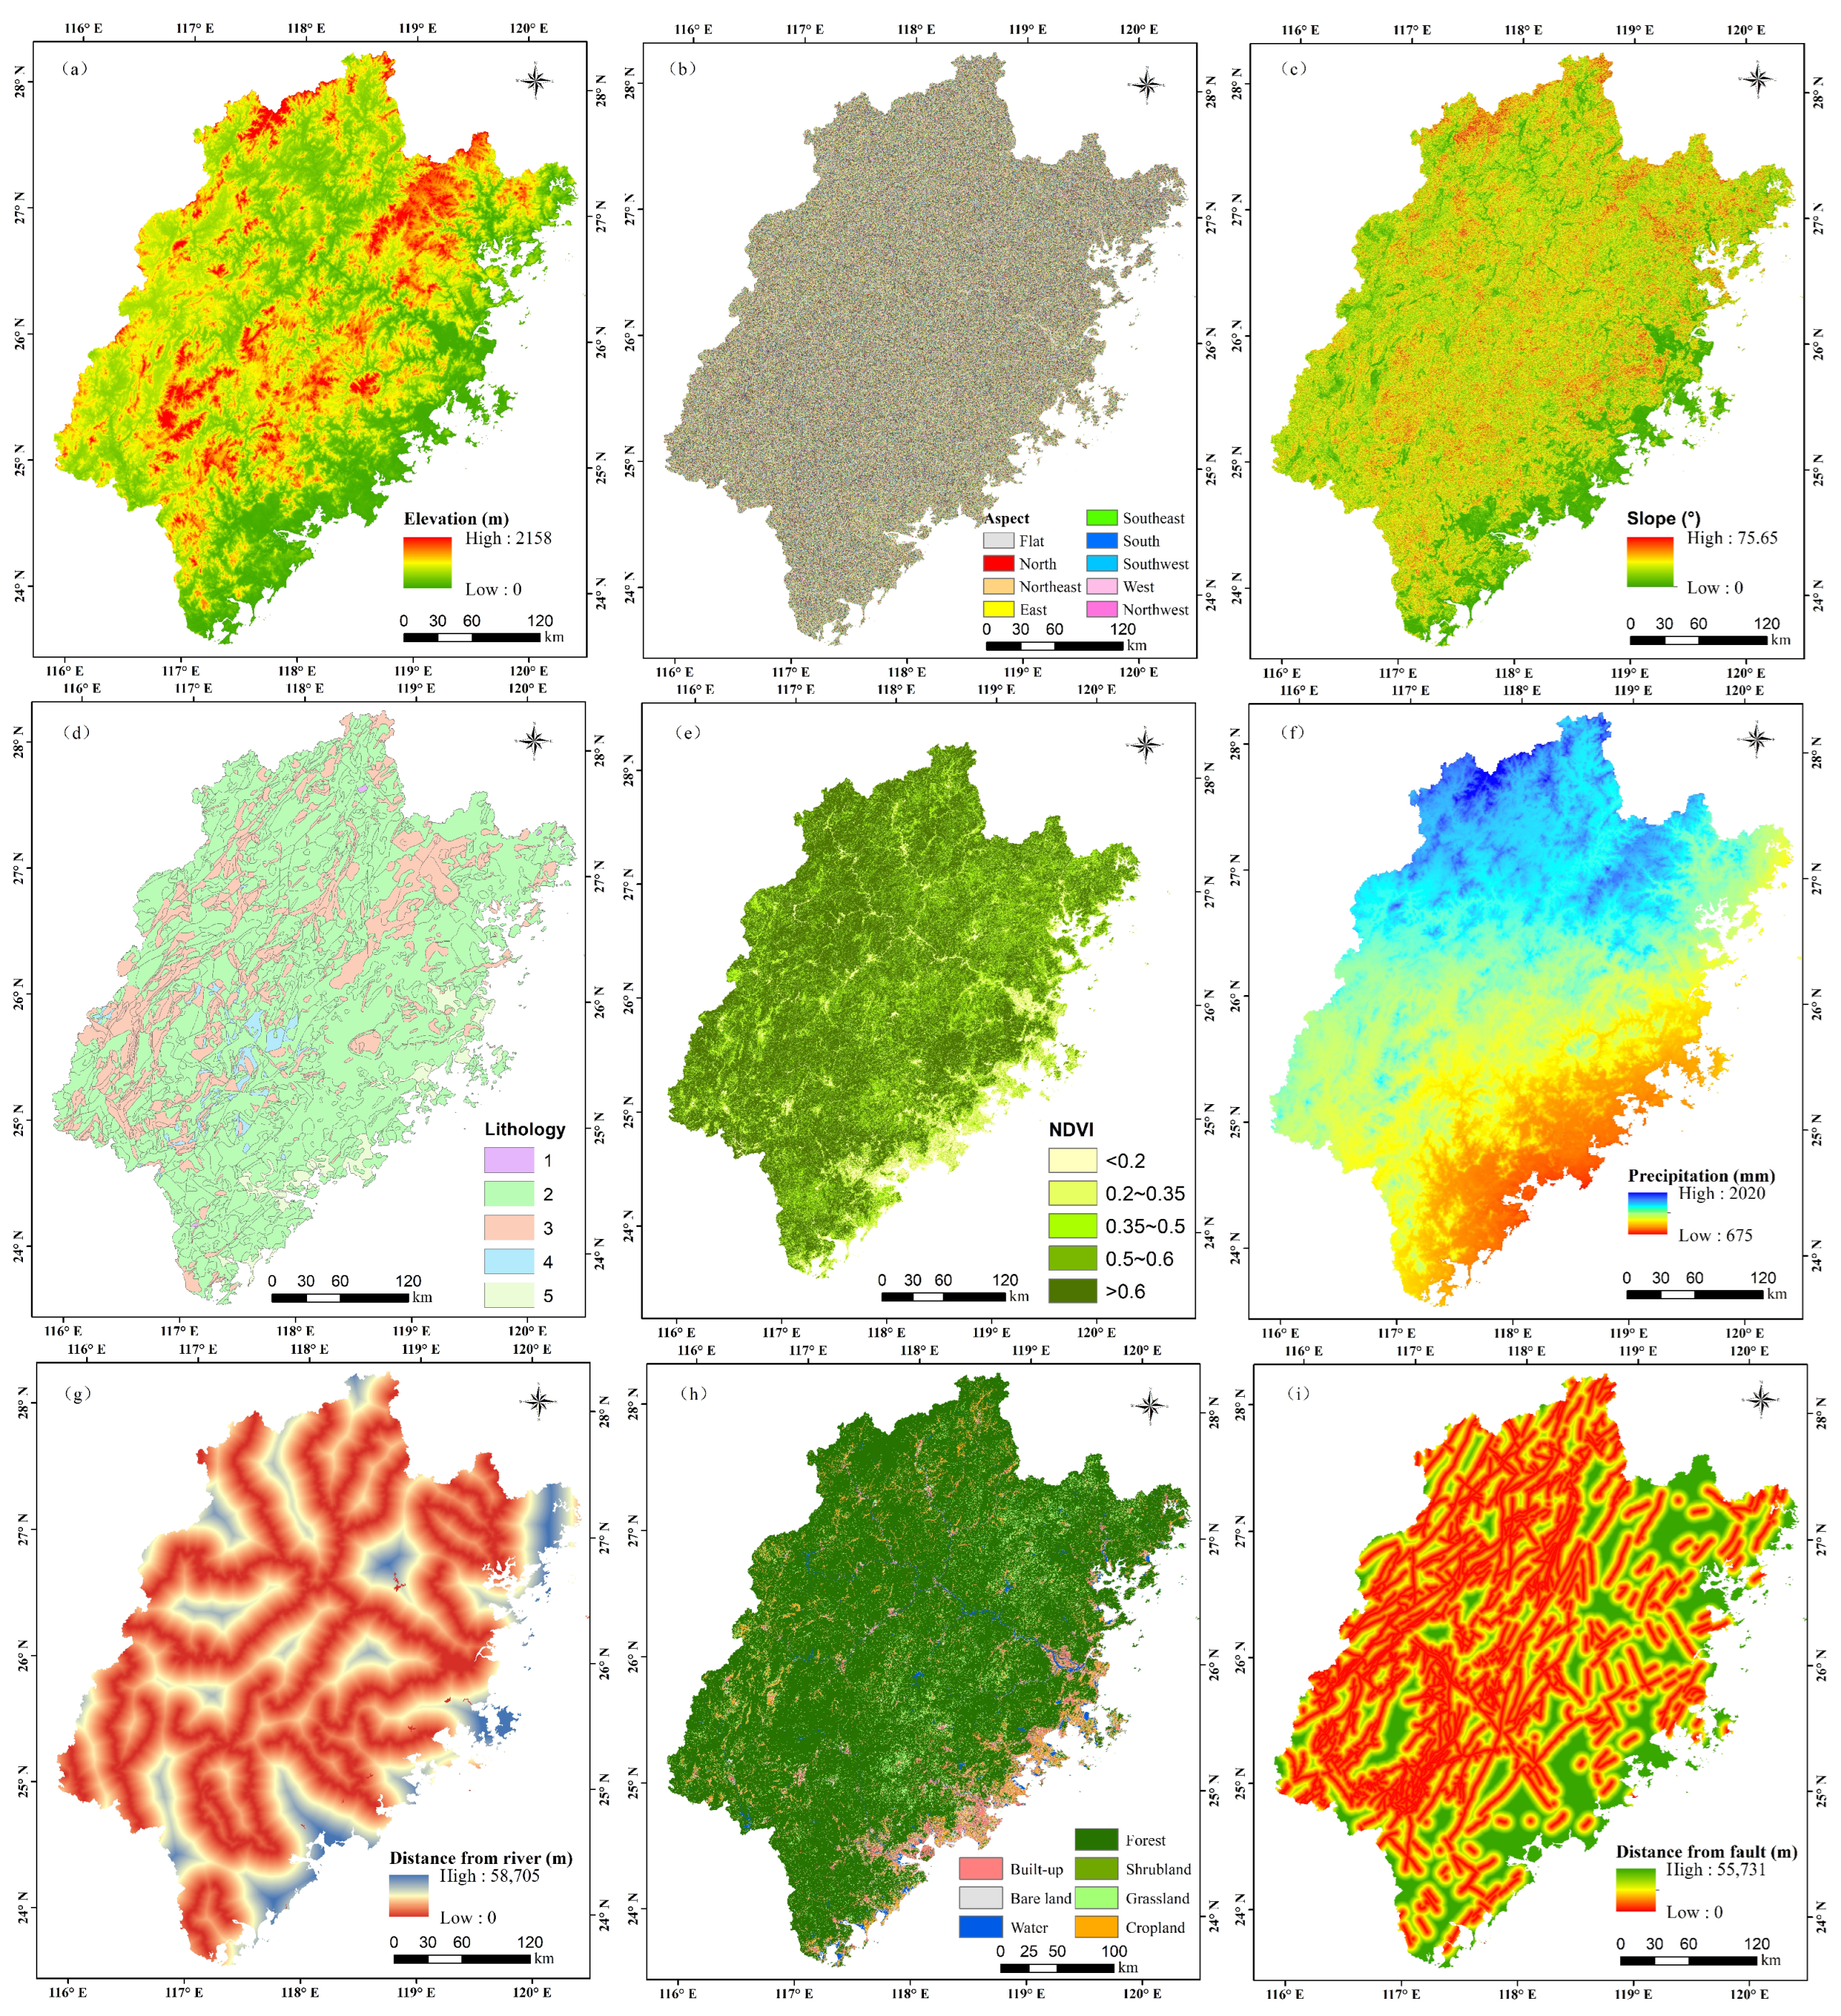
2.2. Data Sources
2.3. Methods
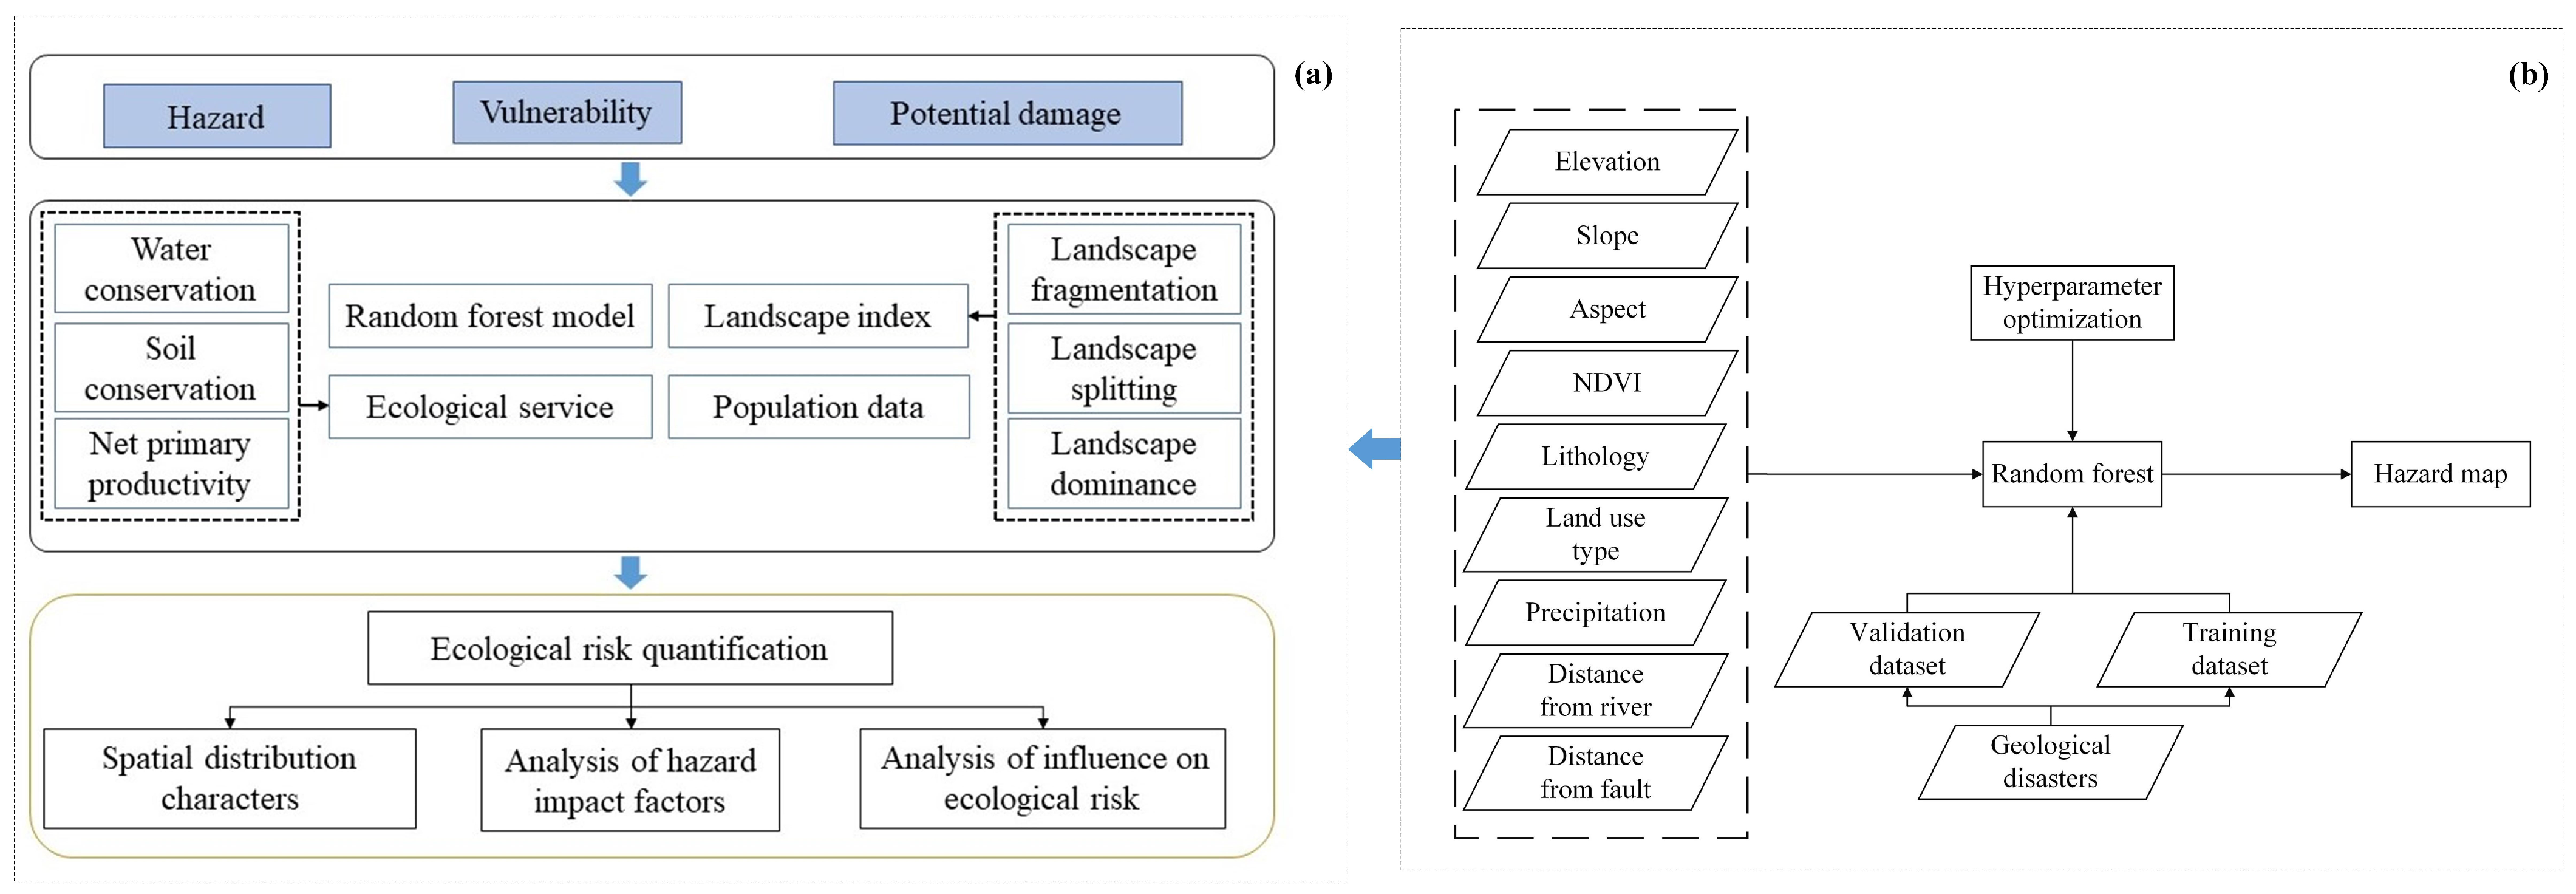
2.3.1. Research Framework
2.3.2. Quantifying the Hazard Based on Random Forest Model
Random Forest Model
Model Validation and Accuracy Analysis
2.3.3. Vulnerability Assessment via Landscape Pattern Indices
2.3.4. Calculation of Potential Damage
Water Conservation
Soil Conservation
3. Results
3.1. Analysis on Hazard of Geological Disasters
3.1.1. Validation of Results for Hazard Assessment
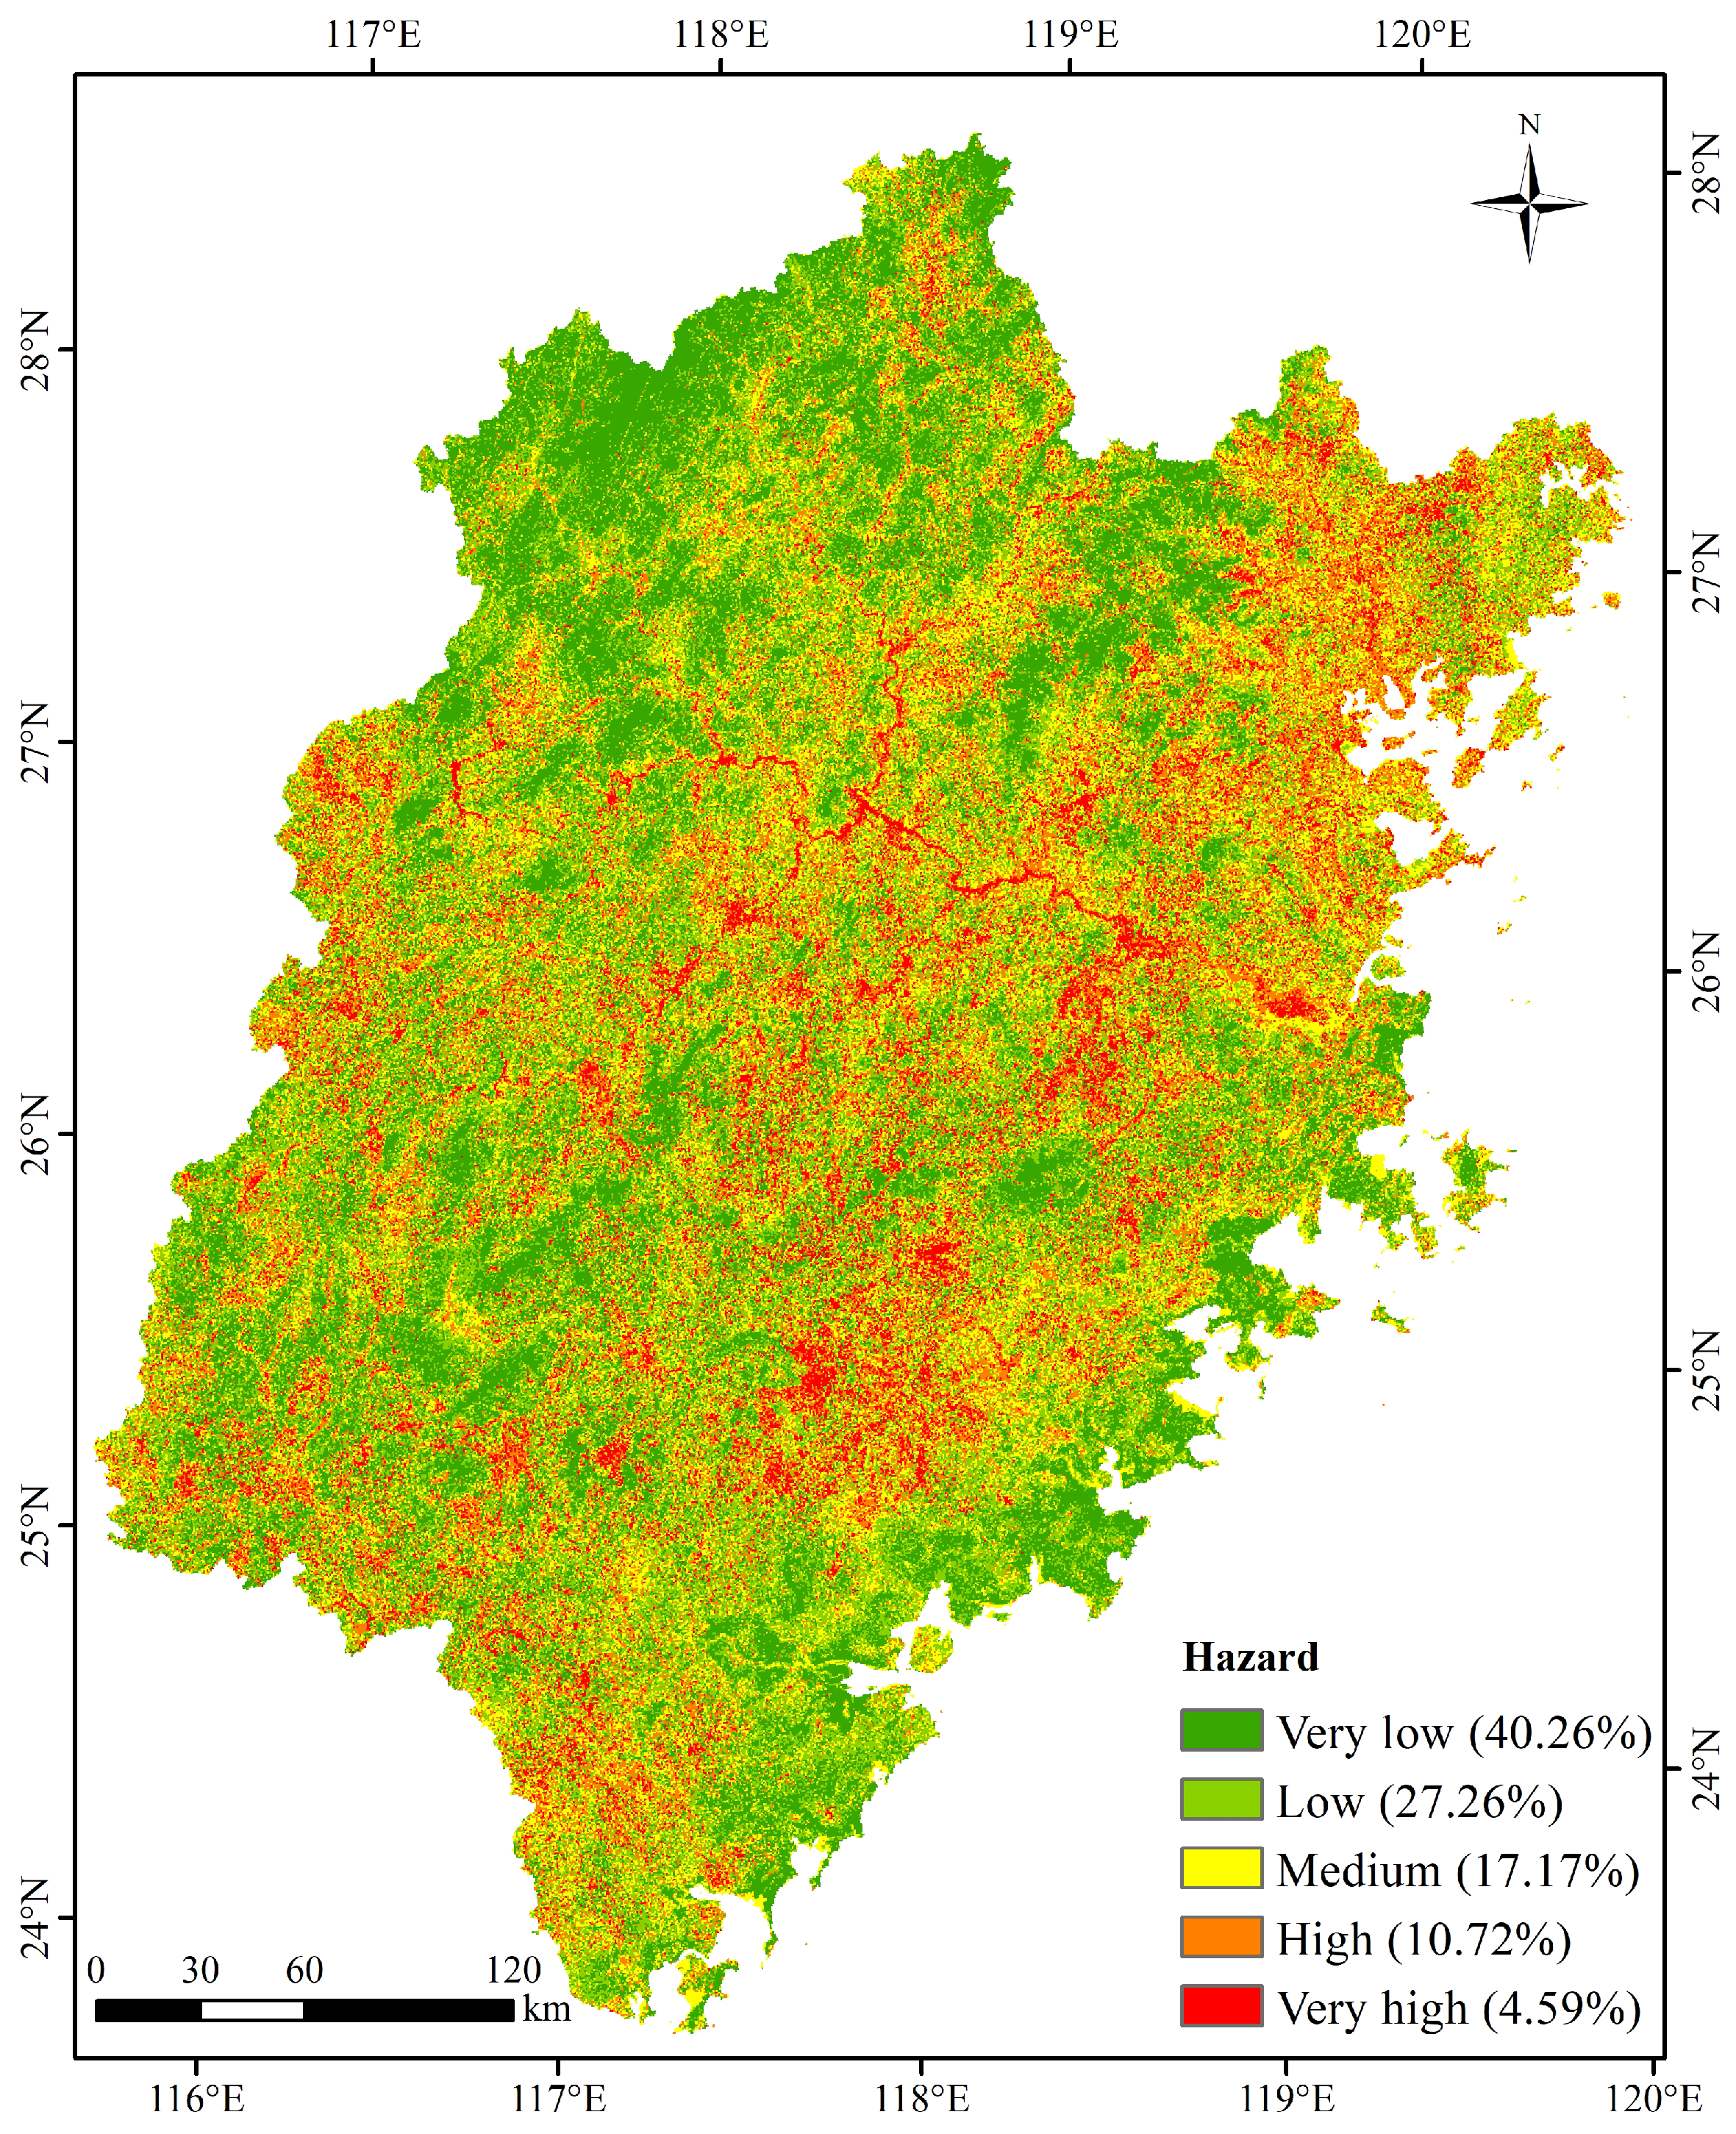
3.1.2. Spatial Distribution of Hazard
3.2. Spatial Distribution of Vulnerability and Potential Damage
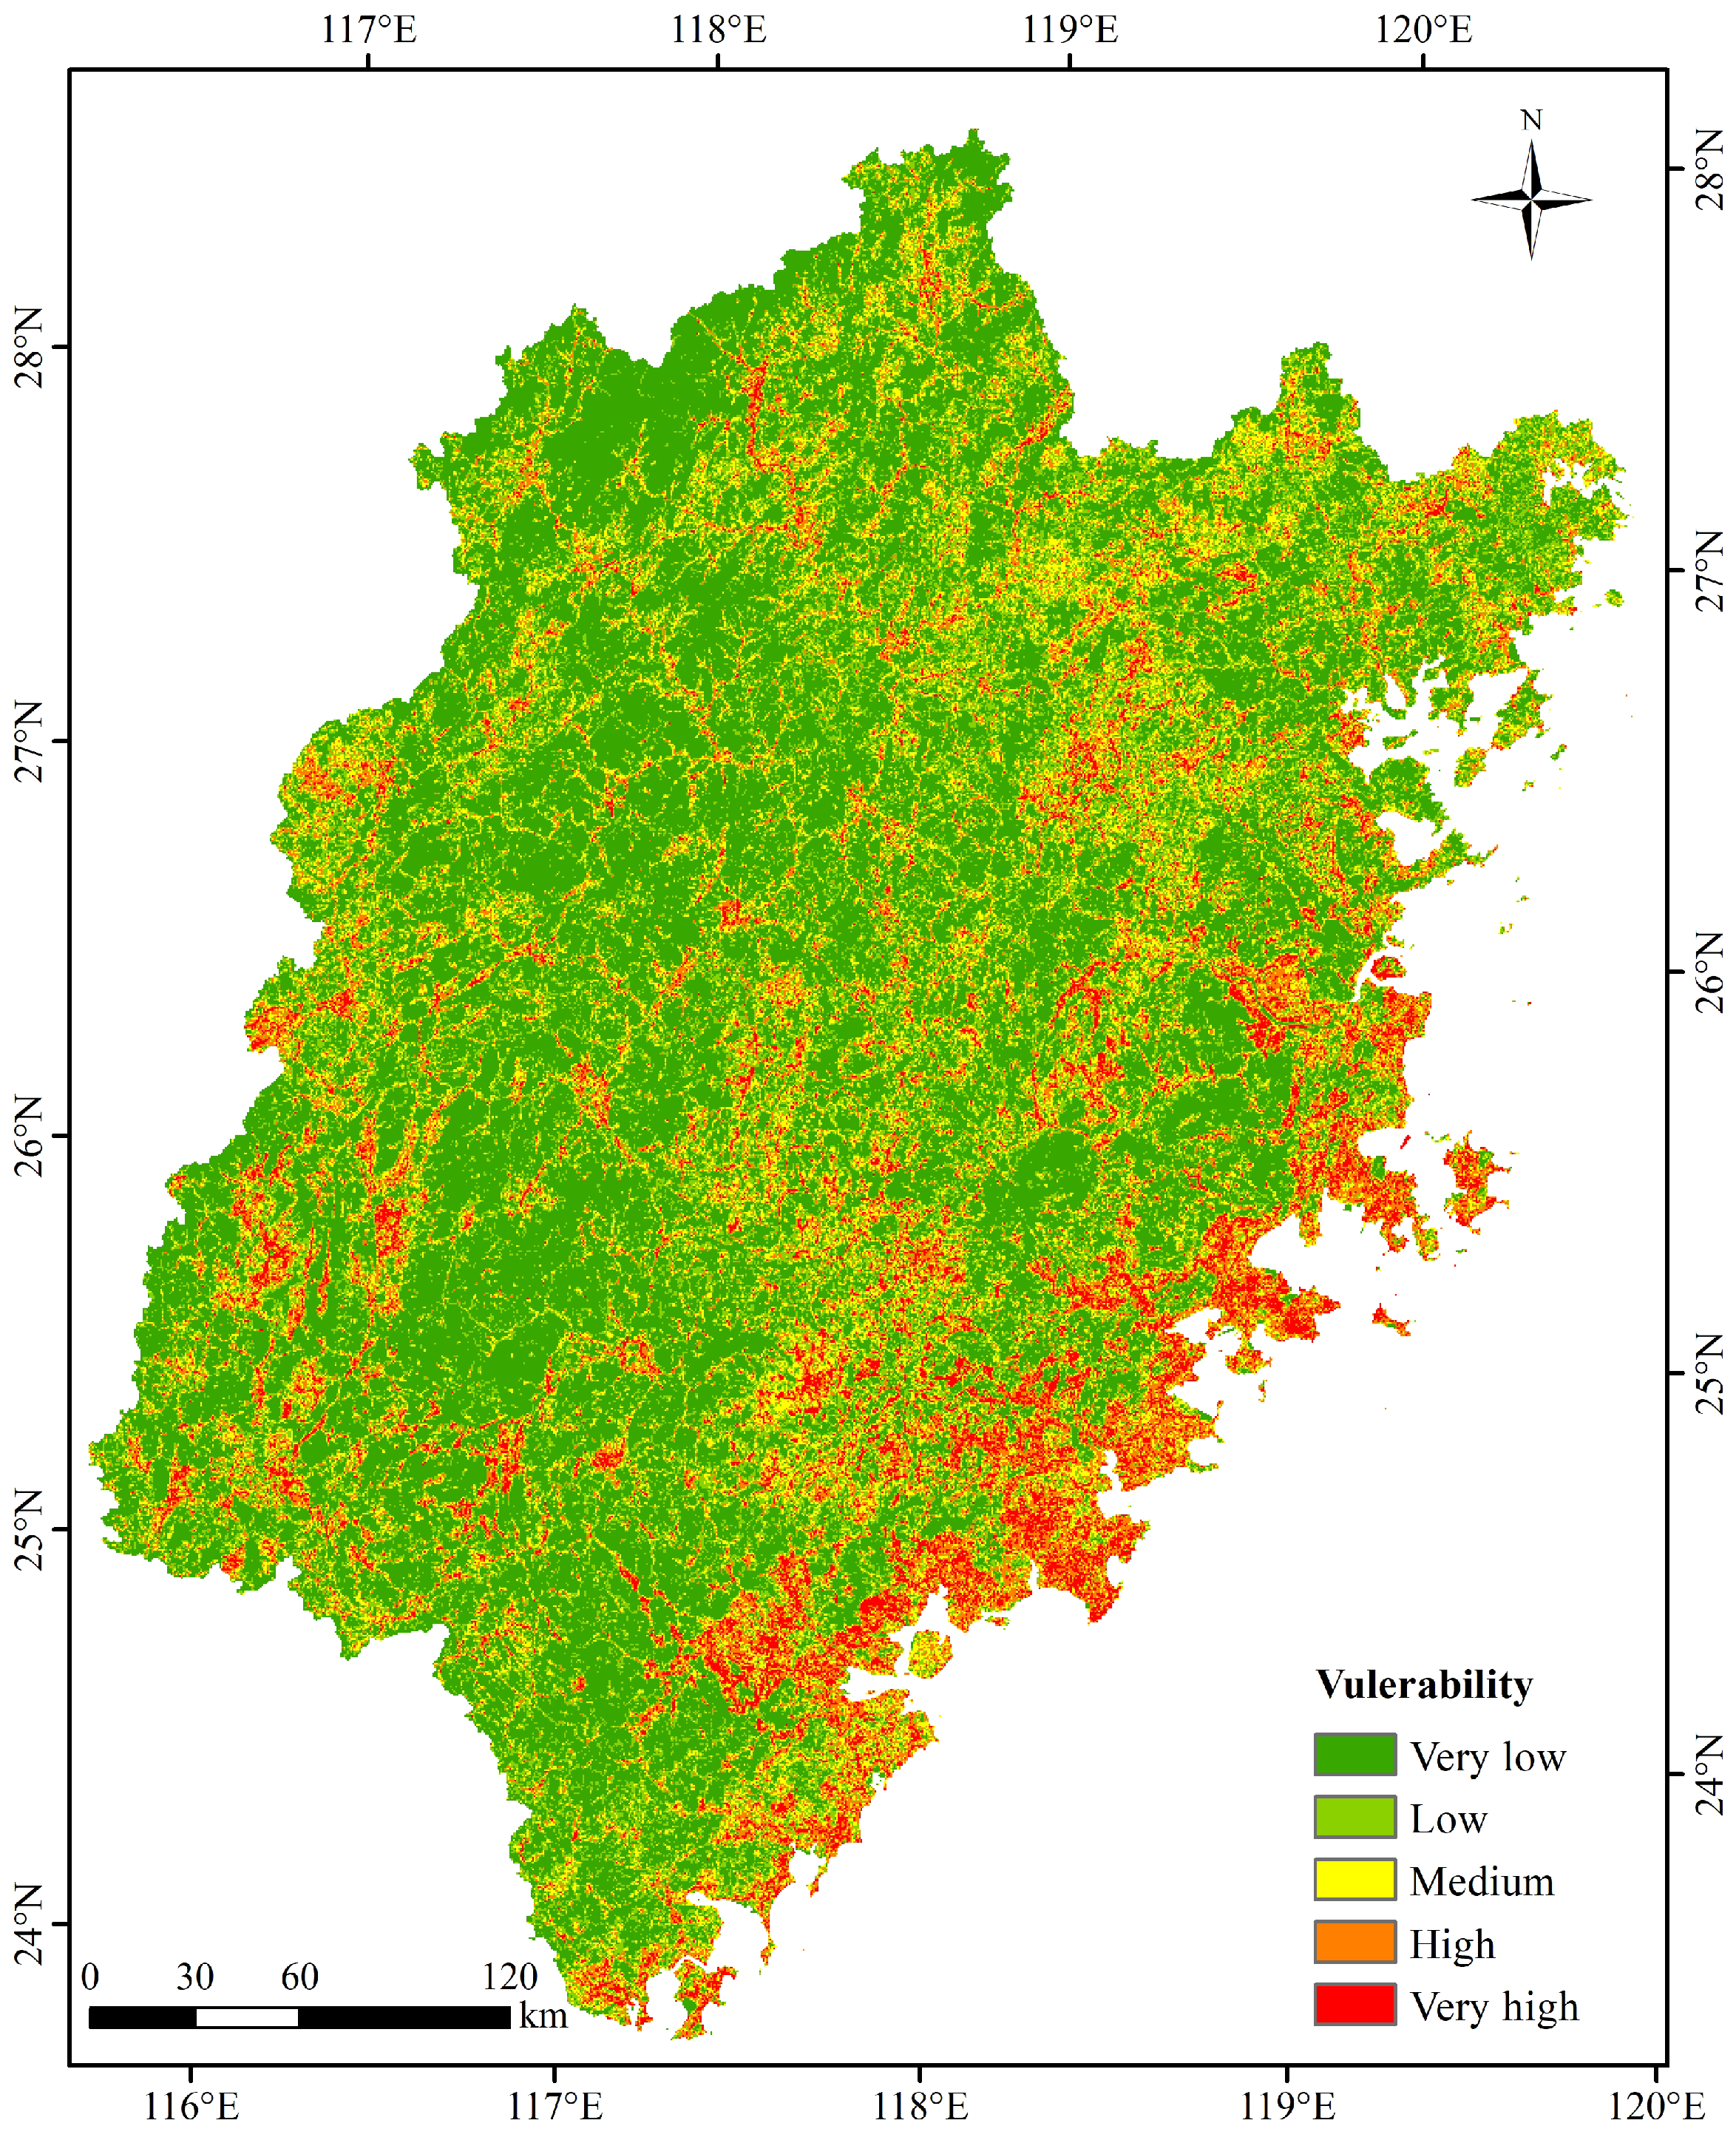
3.2.1. Spatial Distribution Characteristics of Vulnerability
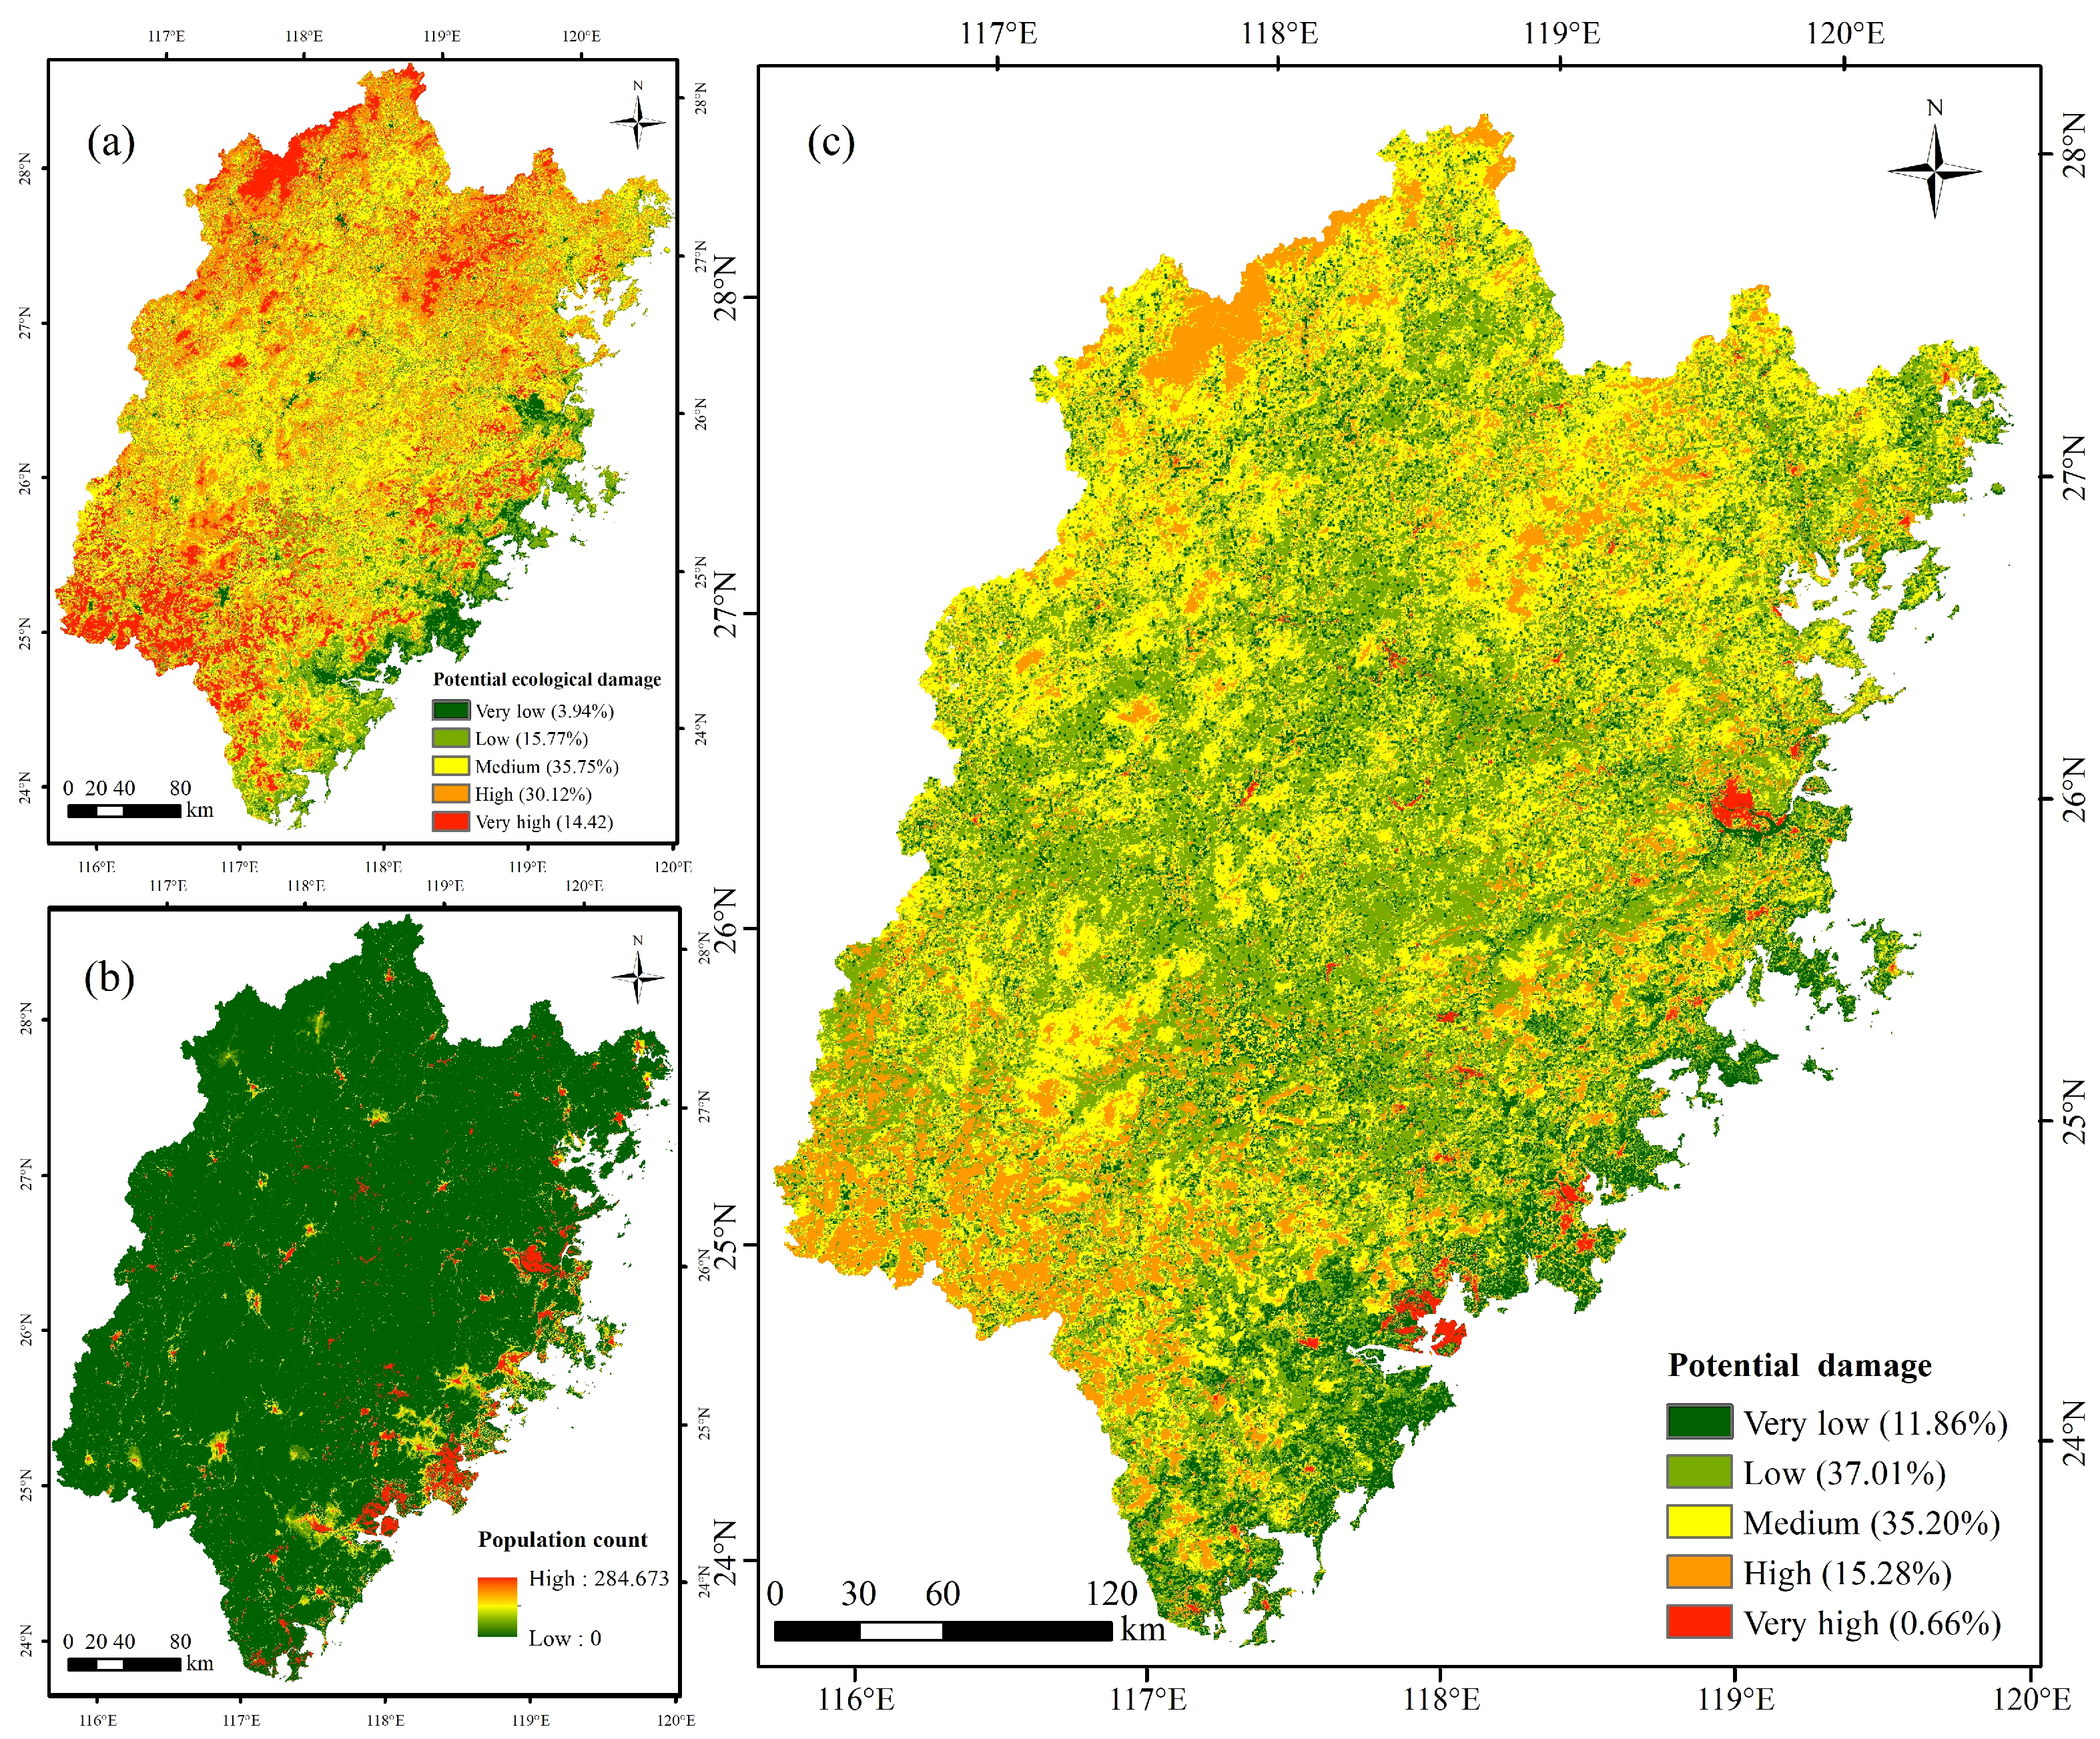
3.2.2. Spatial Distribution Characteristics of Potential Damage
3.3. Ecological Risk of Geological Disasters
3.3.1. Spatial Pattern of Ecological Risk
3.3.2. Mechanisms of Influence on Ecological Risk
4. Discussion
4.1. Analysis of the Hazard Impact Factors
4.2. Development Strategy for Hazard Prevention and the Improvement of the ERA
5. Conclusions
- (1)
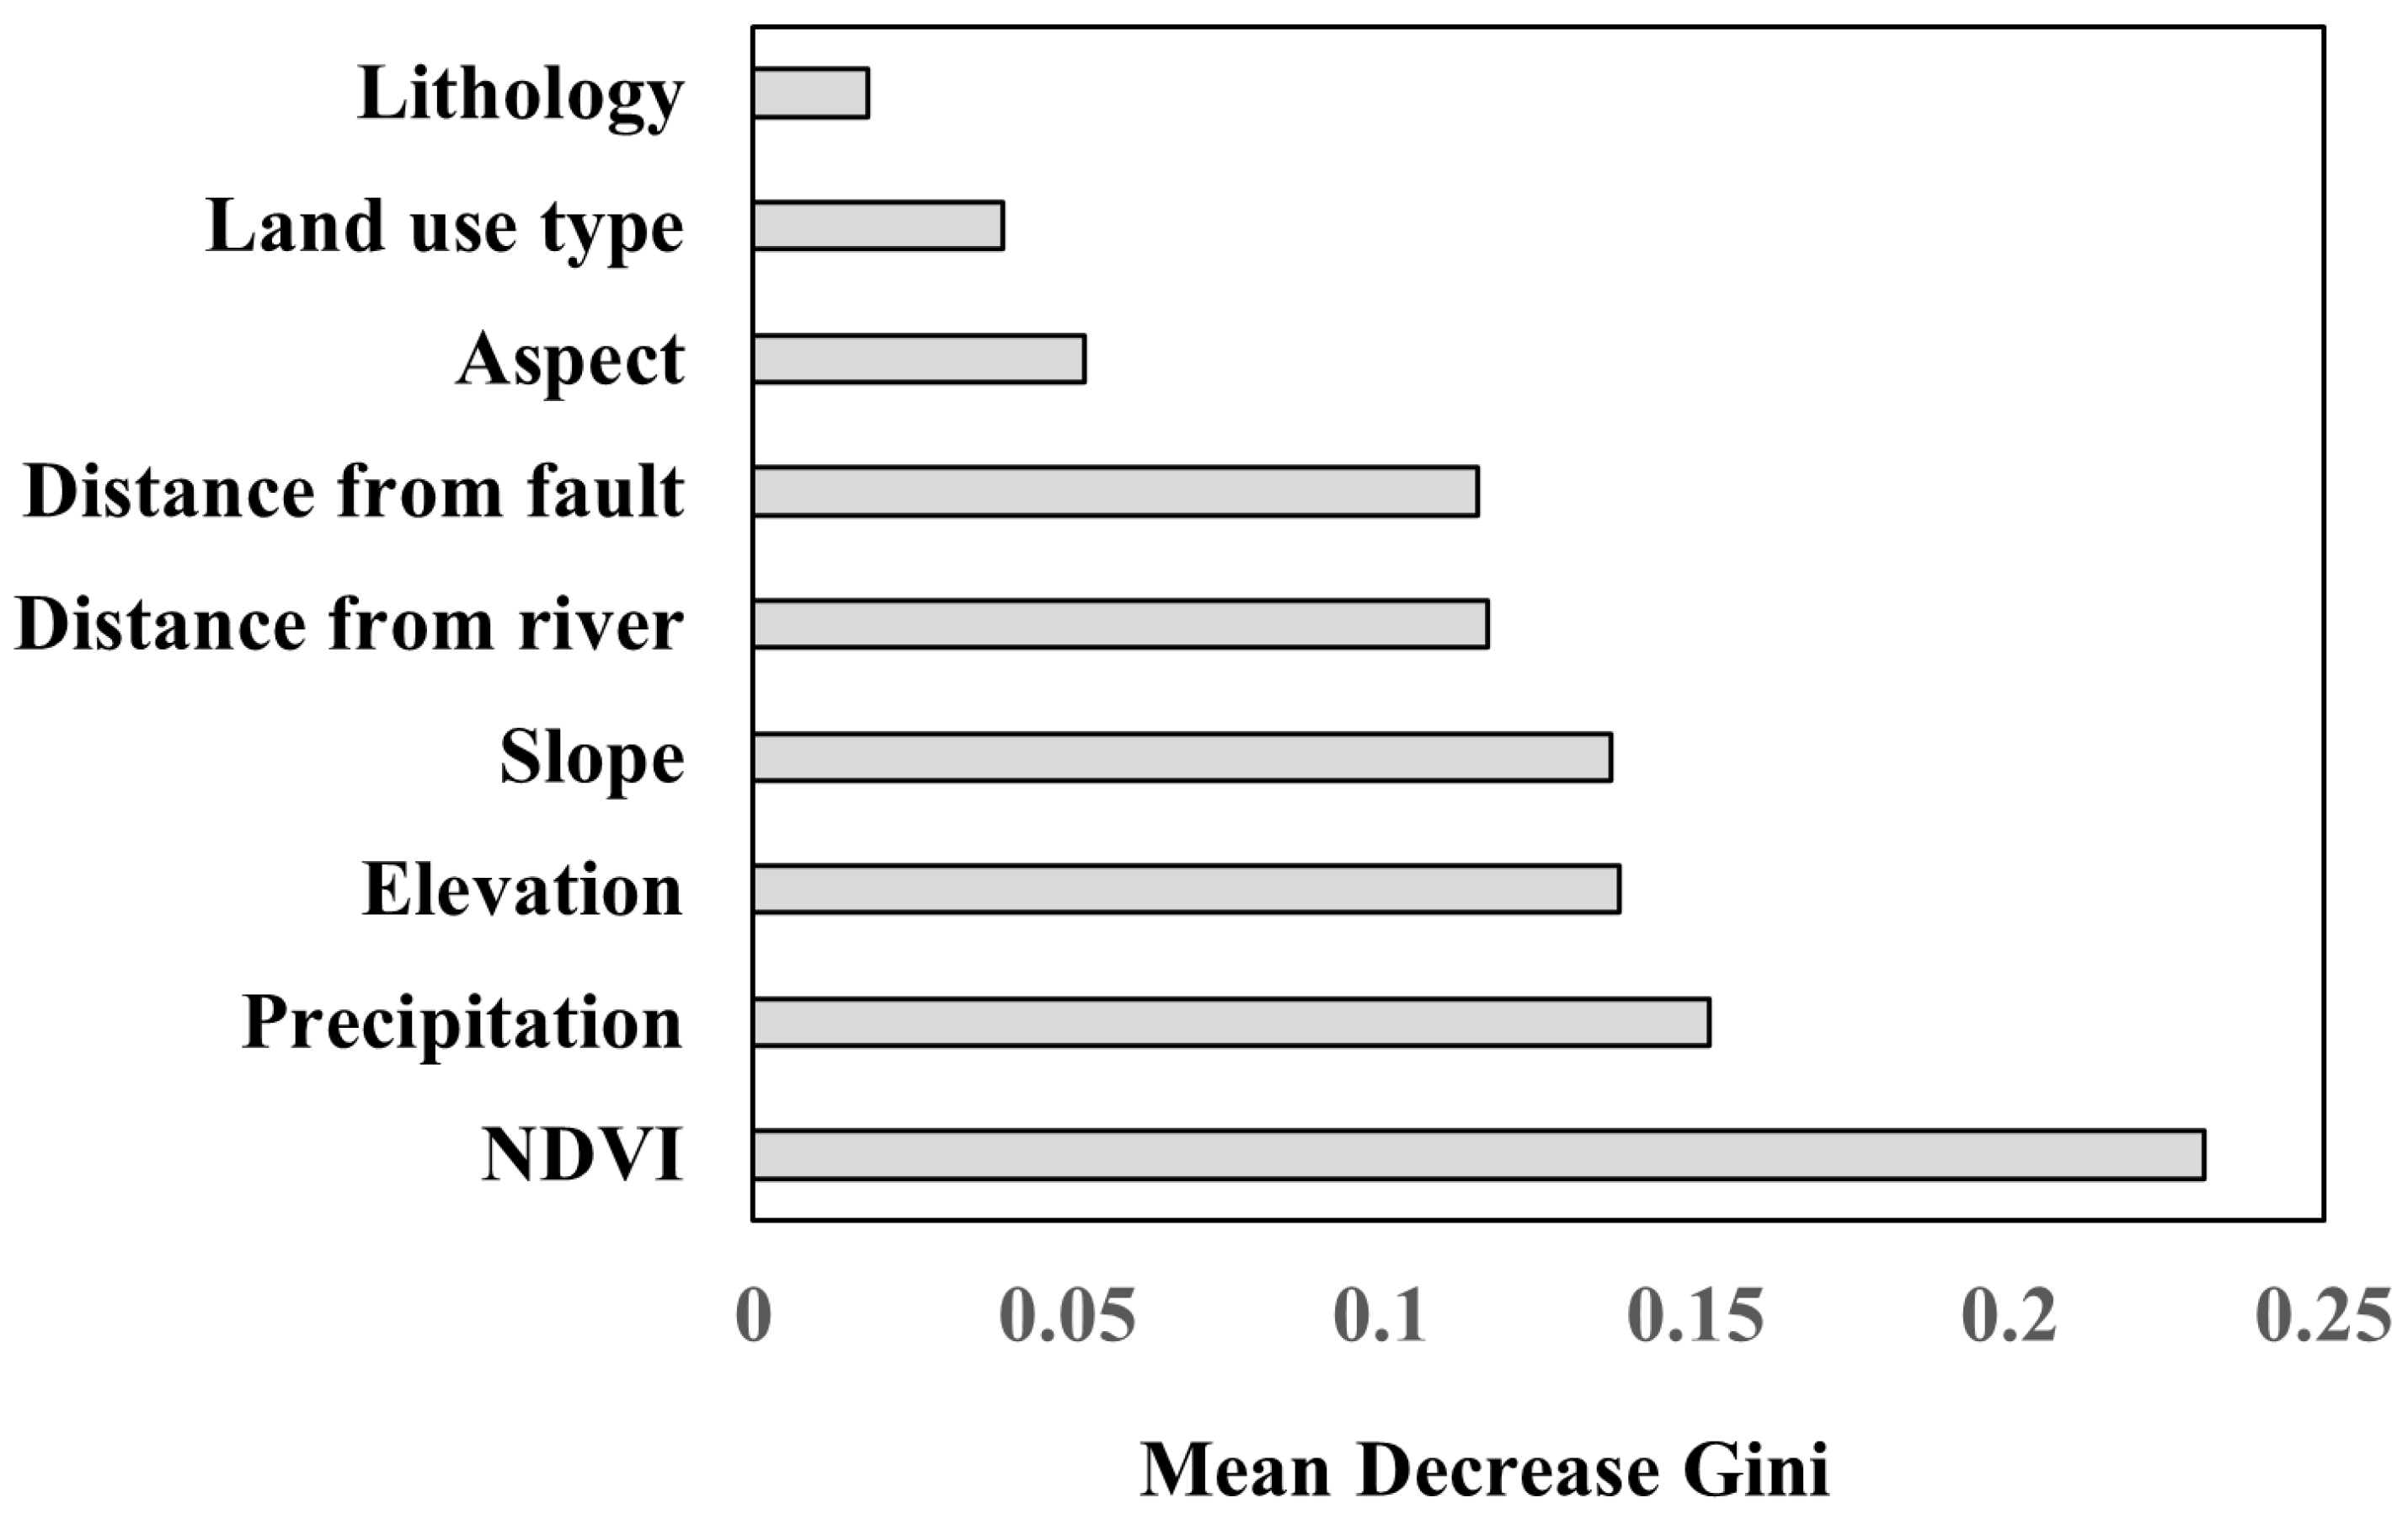
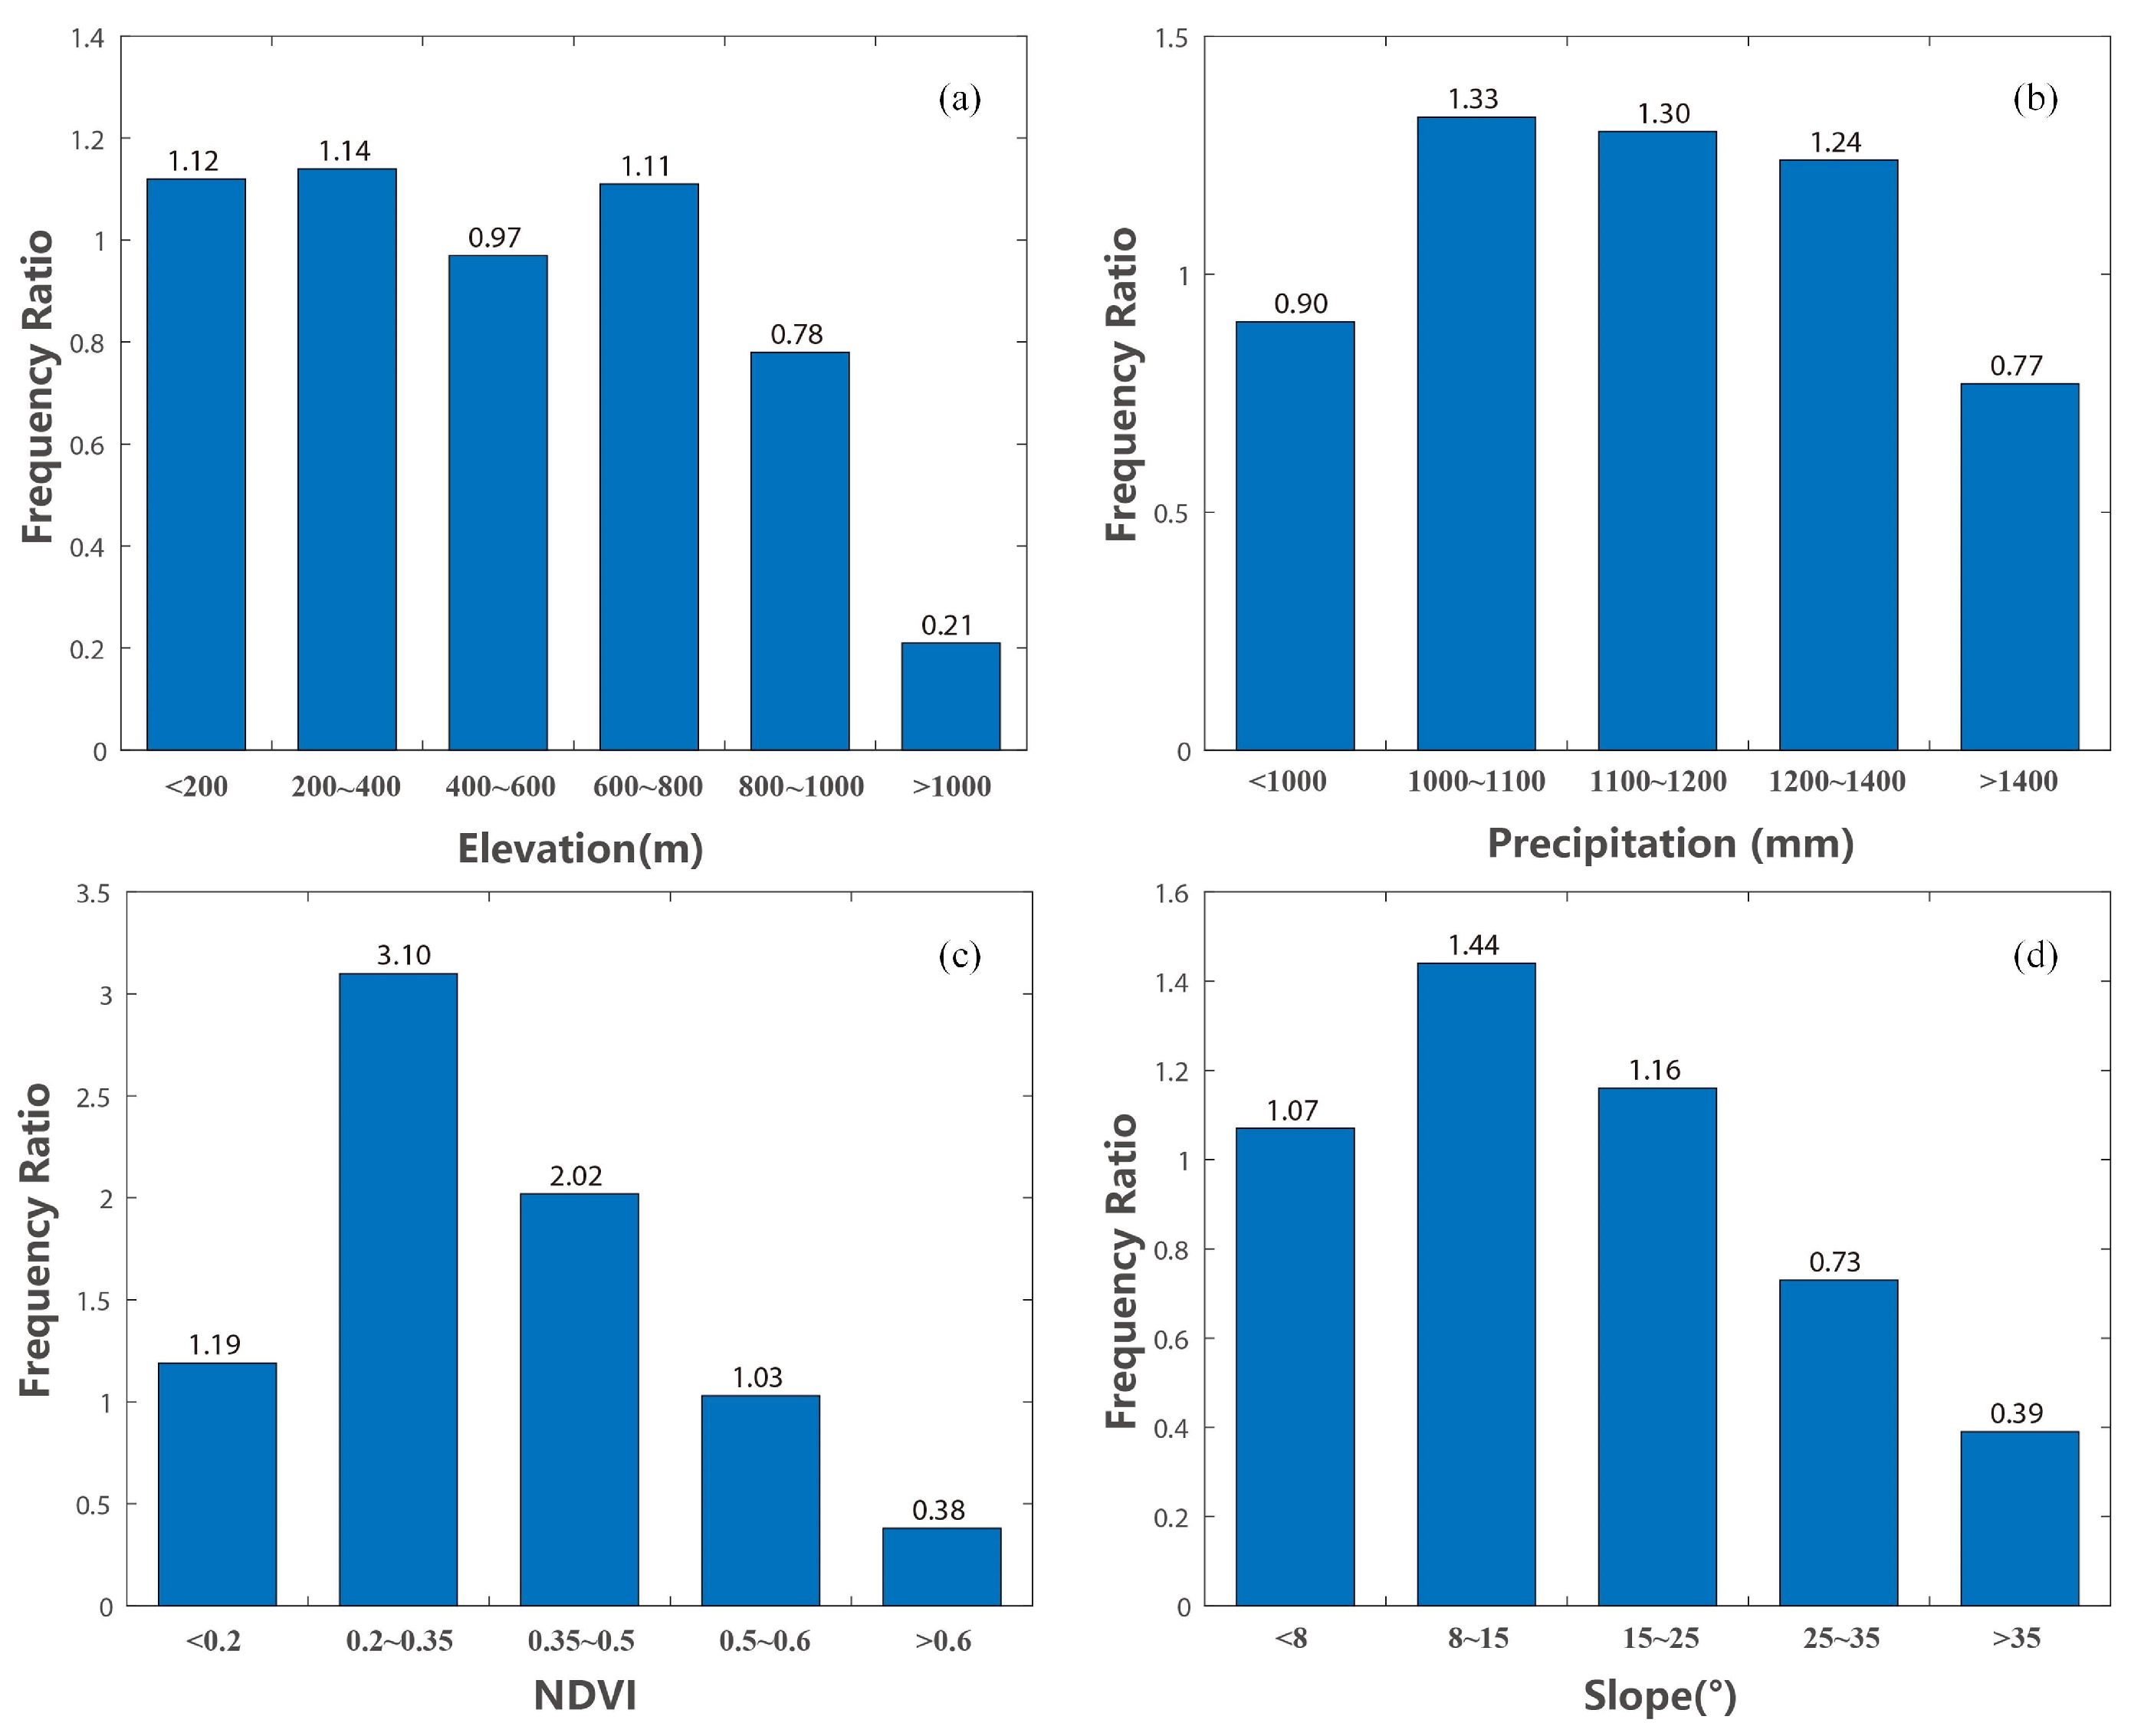
- The hazard of geological disasters are mainly medium risks. The area with high and very high levels of geological hazard account for and of the study area, respectively. These areas are mainly distributed in the northeast and inland regions and present a striped distribution pattern along the river valley. The results of the conditioning factor importance evaluation and impact analysis of typical conditioning factors showed that NDVI, precipitation, elevation, and slope are the most important factors that may encourage the geological disaster hazard.
- (2)
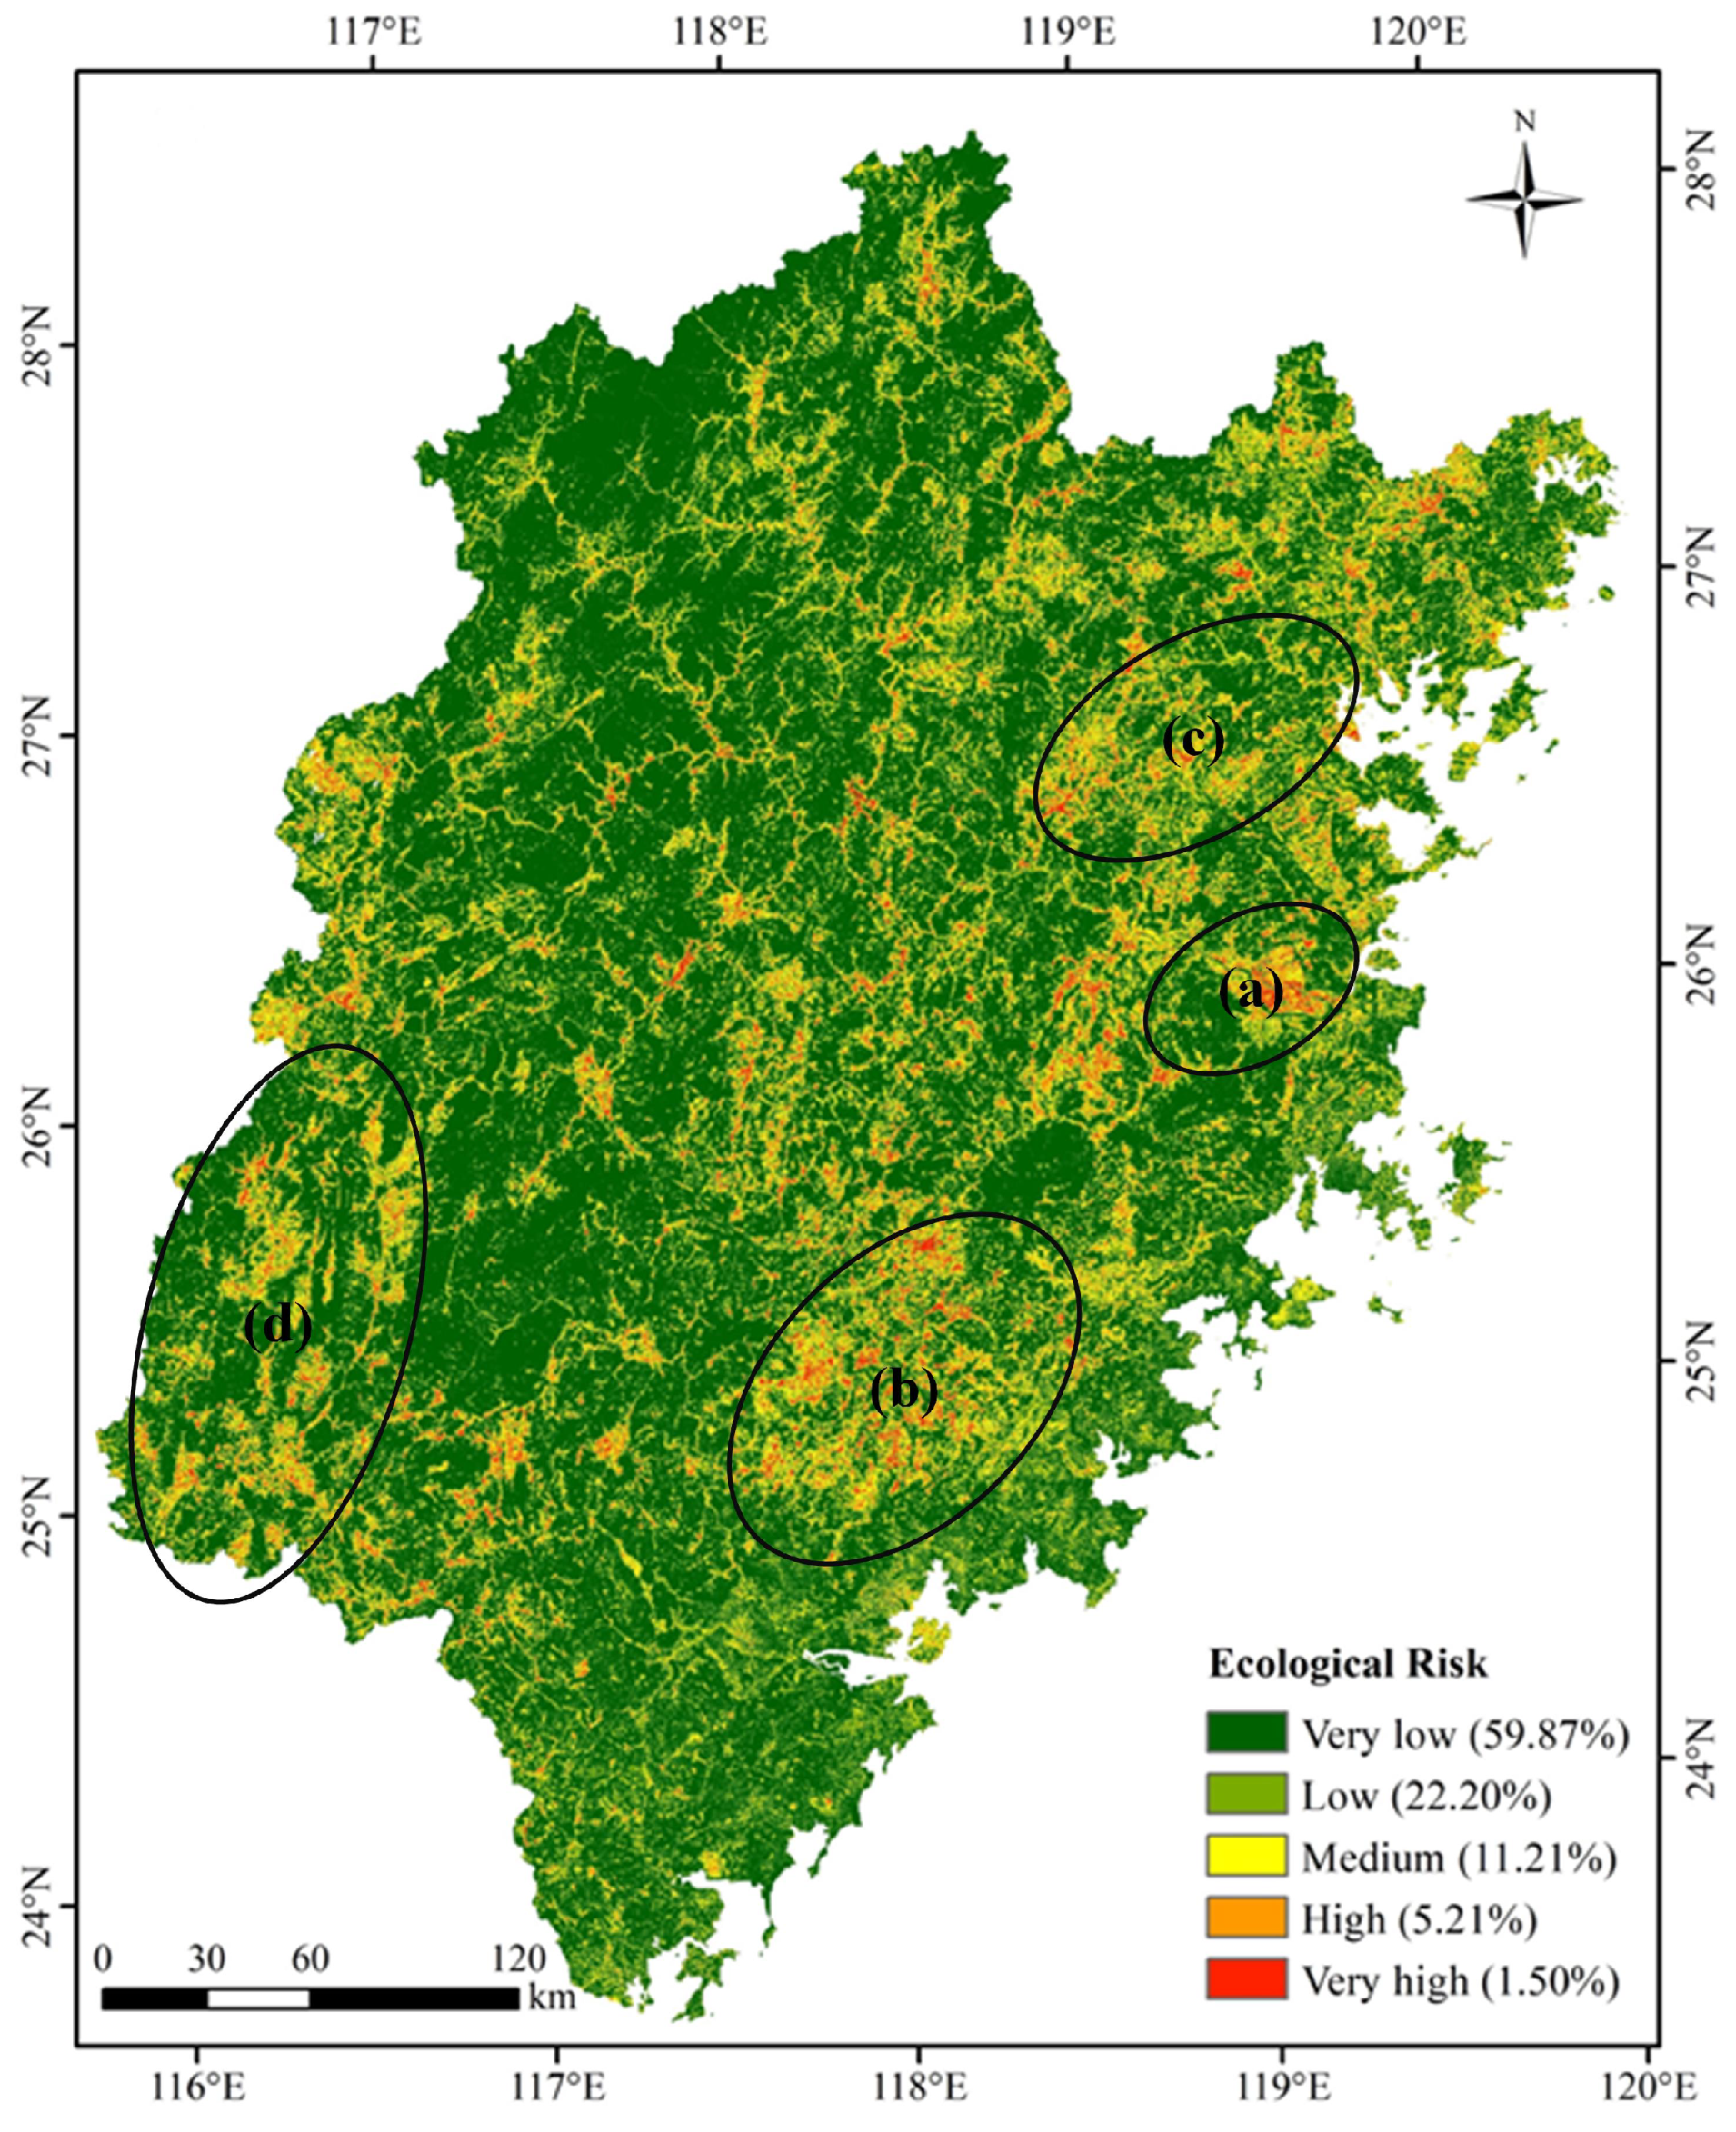
- The high ecological risk of the study area shows trends of local clustering and global dispersion. The areas with high ecological risk are mainly concentrated along the Fuzhou Plain, southeastern part of Daiyun Mountain, southwest edge of Jiufeng Mountain, and valley area of the Ting River watershed. The causes and mechanisms of the high ecological risk in the study area have significant great spatial variability, and human activities have a significant influence on the ecological risk.
- (3)
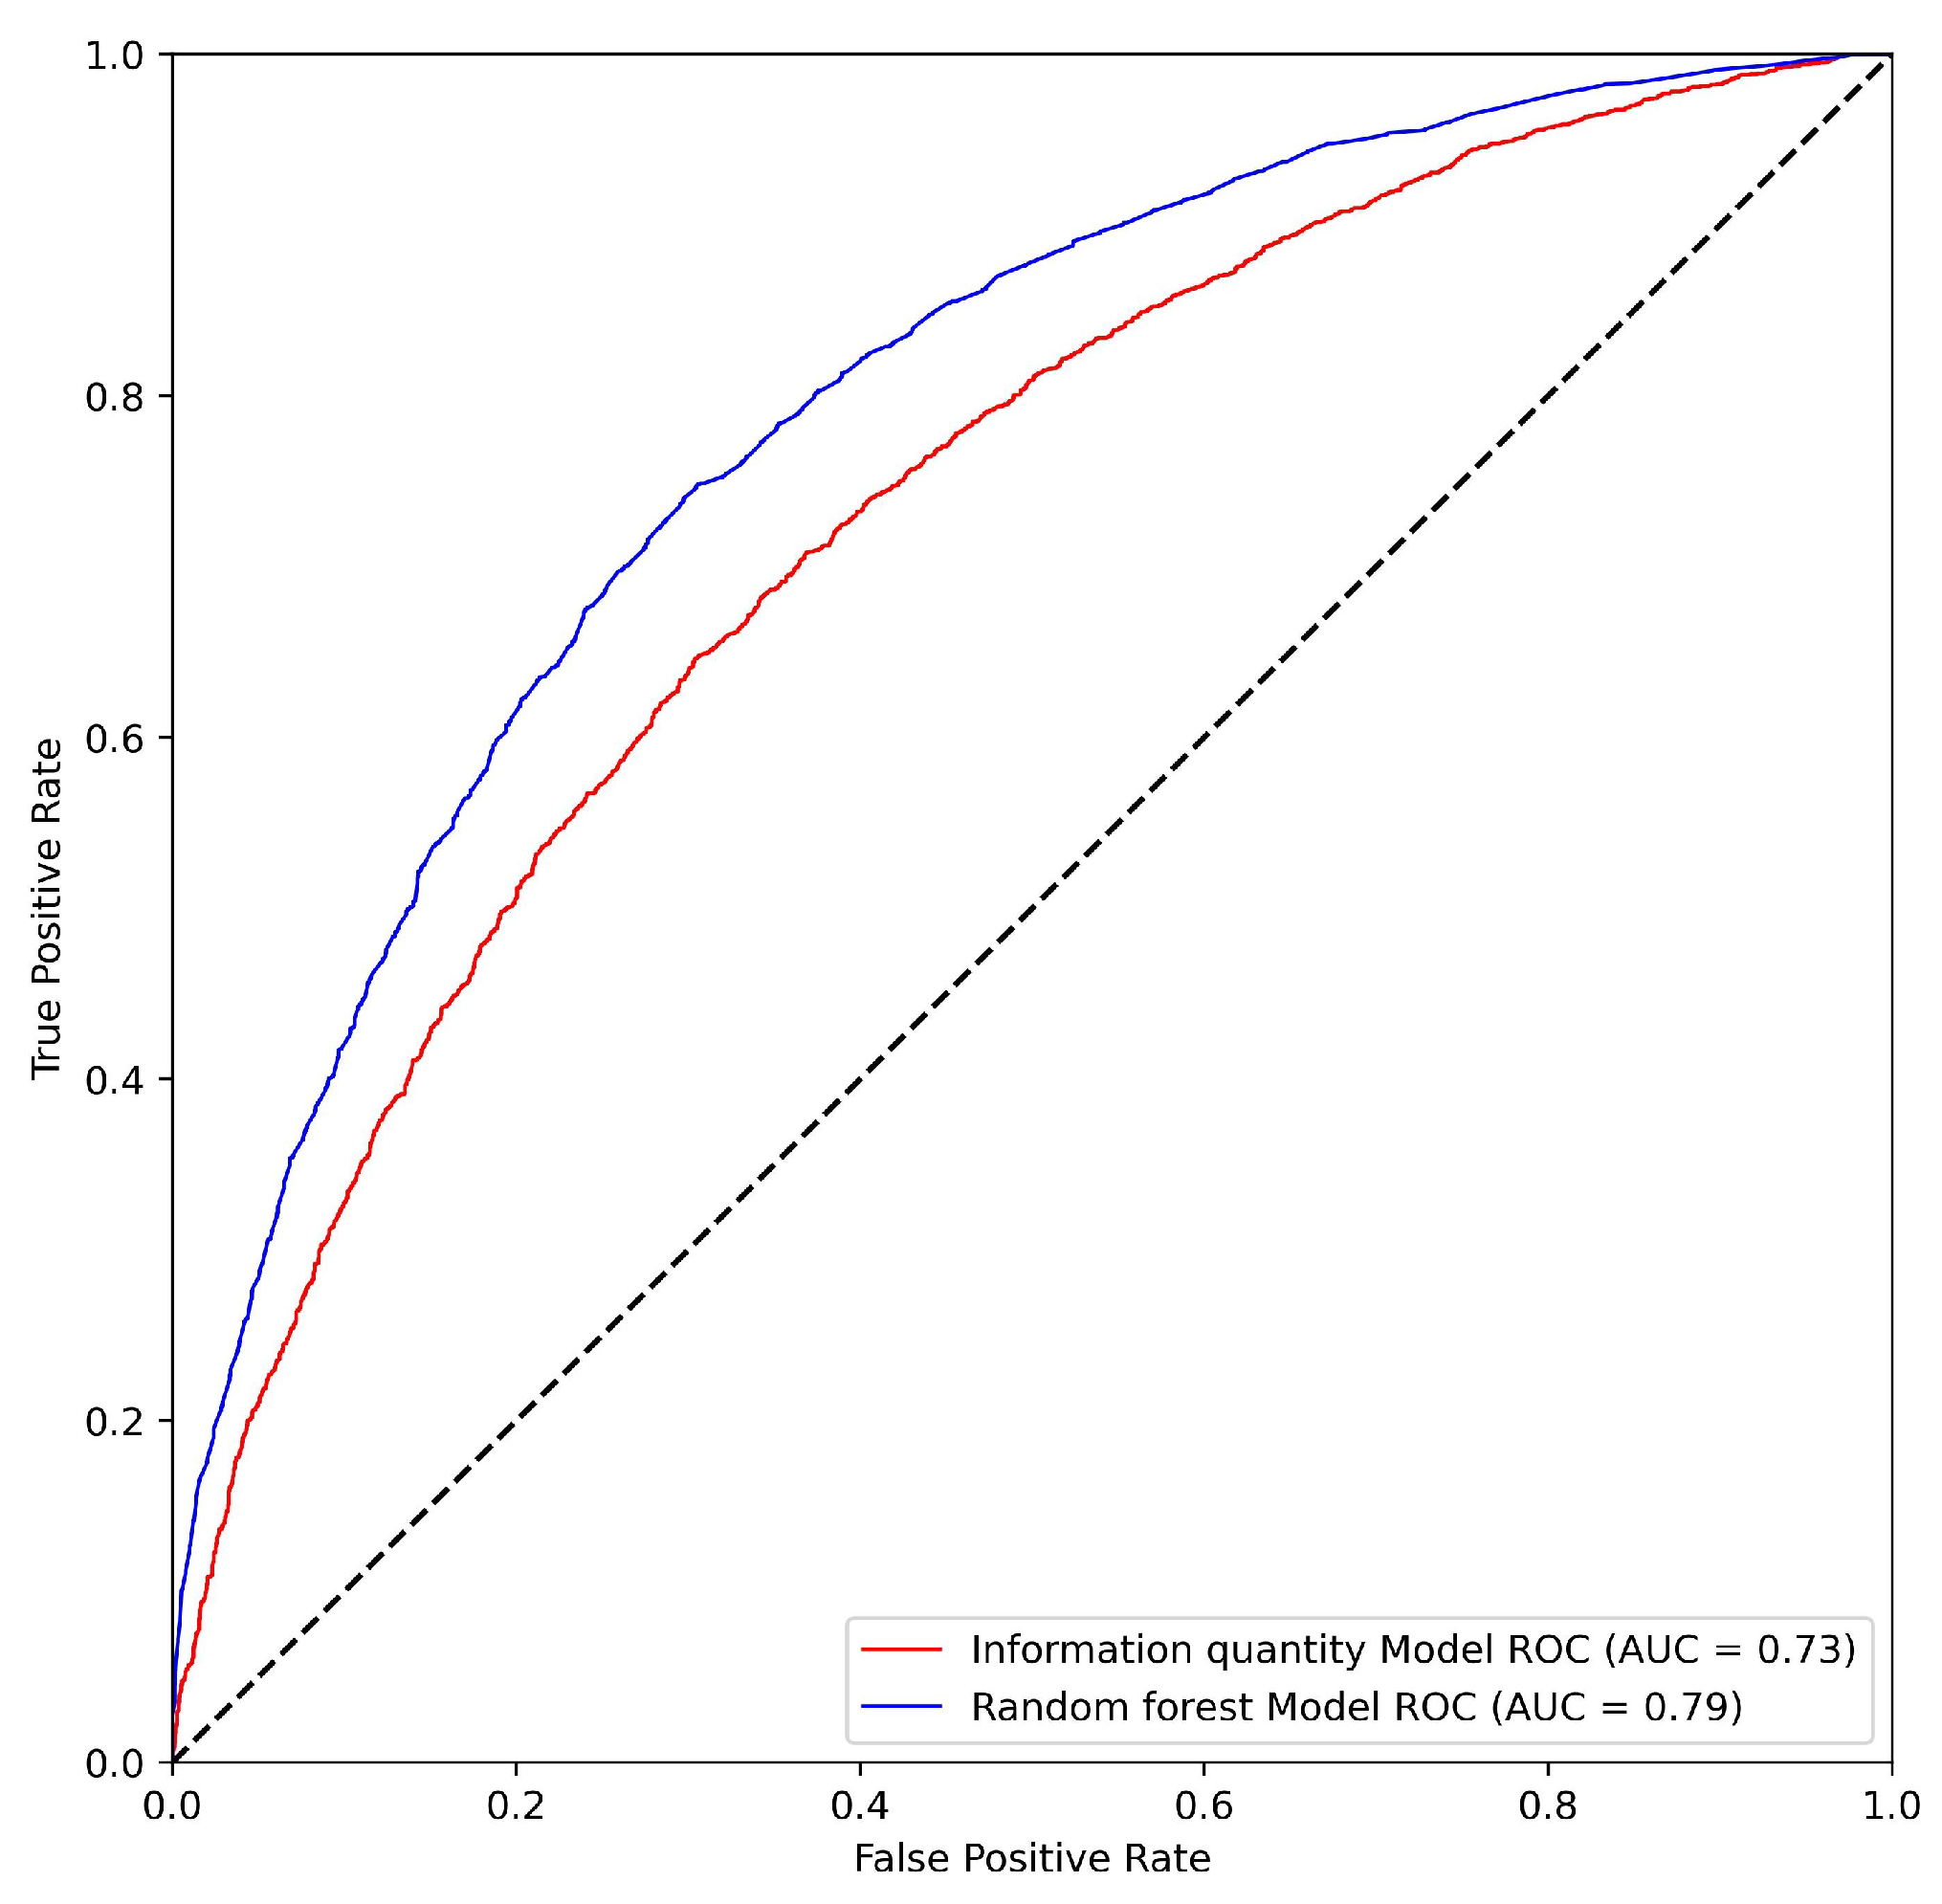
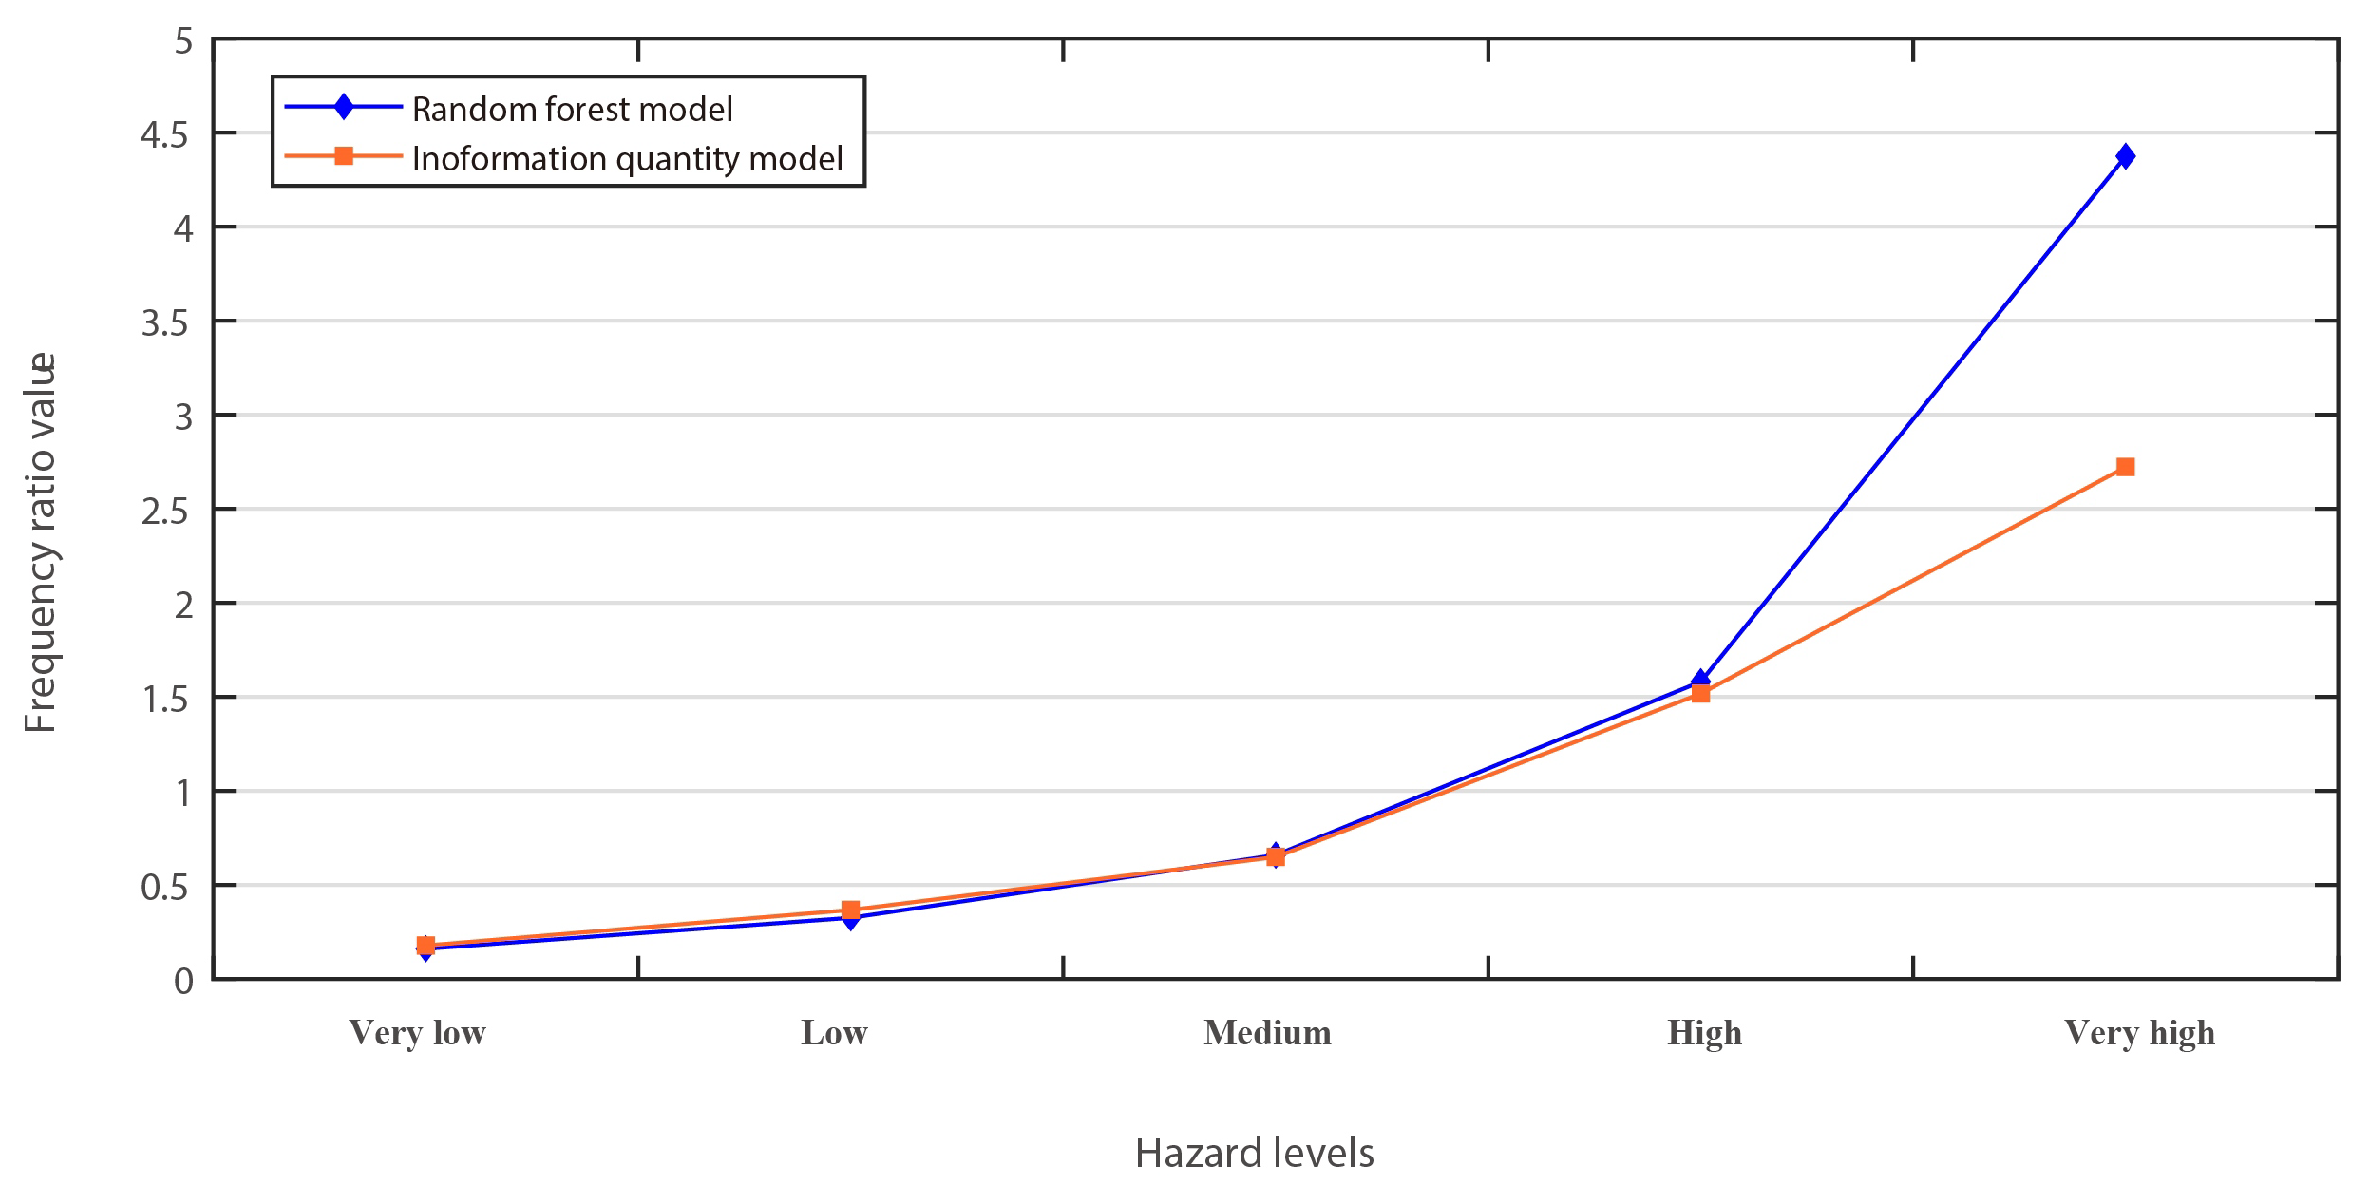
- The geological disaster hazard assessment result based on the random forest model has a high reliability. The AUC value of the ROC curve is 0.79, and of the historical verification geological disaster points fall within high hazard regions. Compared with the information quantity model, the RF model performed better in terms of the hazard assessment of geological disasters, especially regarding the identification of high-level hazard areas.
Author Contributions
Funding
Institutional Review Board Statement
Informed Consent Statement
Data Availability Statement
Acknowledgments
Conflicts of Interest
Appendix A
References
- National Bureau of Statistics of China. China Statistical Yearbook (2021); China Statistics Press: Beijing, China, 2021.
- Ouyang, Z.; Xu, W.; Wang, X.Z.; Wang, W.J.; Dong, R.C.; Zheng, H.; Li, D.; Li, Z.Q.; Zhang, H.F.; Zhuang, C.W. Impact assessment of Wenchuan Earthquake on ecosystems. Acta Ecol. Sin. 2008, 28, 5801–5809. [Google Scholar]
- Norton, S.B.; Rodier, D.J.; van der Schalie, W.H.; Wood, W.P.; Slimak, M.W.; Gentile, J.H. A framework for ecological risk assessment at the EPA. Environ. Toxicol. Chem. 1992, 11, 1663–1672. [Google Scholar] [CrossRef]
- Munns, W.R., Jr. Assessing risks to wildlife populations from multiple stressors: Overview of the problem and research needs. Ecol. Soc. 2006, 11, 23. [Google Scholar] [CrossRef] [Green Version]
- Hou, M.; Ge, J.; Gao, J.; Meng, B.; Li, Y.; Yin, J.; Liu, J.; Feng, Q.; Liang, T. Ecological Risk Assessment and Impact Factor Analysis of Alpine Wetland Ecosystem Based on LUCC and Boosted Regression Tree on the Zoige Plateau, China. Remote Sens. 2020, 12, 368. [Google Scholar] [CrossRef] [Green Version]
- Nan, W.U.; Hongfeng, C.; Pidong, K.; Chaoyang, F.; Hongqiang, J.; Wenjun, W.U.; Daiqing, L.I.; Yangchen, Z. Potential degradation risk assessment driven by human activities in ecological red-line regions: A case study in Anhui Province. Acta Ecol. Sin. 2020, 40, 5571–5578. [Google Scholar]
- Li, D.; Yu, R.; Chen, J.; Leng, X.; Zhao, D.; Jia, H.; An, S. Ecological Risk of Heavy Metals in Lake Sediments of China: A National-Scale Integrated Analysis. J. Clean. Prod. 2022, 334, 130206. [Google Scholar] [CrossRef]
- Yao, X.; Luo, K.; Niu, Y.; Li, Y.; Ren, B. Ecological Risk from Toxic Metals in Sediments of the Yangtze, Yellow, Pearl, and Liaohe Rivers, China. Bull. Environ. Contam. Toxicol. 2021, 107, 140–146. [Google Scholar] [CrossRef]
- Jin, W.; Cui, Y.; Wu, S.; Cheng, D. Ecological risk resonance of urbanization and its effect on geohazard disaster: The case of Freetown, Sierra Leone. Urban Ecosyst. 2020, 23, 1141–1152. [Google Scholar] [CrossRef]
- Arrogante-Funes, P.; Bruzon, A.G.; Arrogante-Funes, F.; Ramos-Bernal, R.N.; Vazquez-Jimenez, R. Integration of Vulnerability and Hazard Factors for Landslide Risk Assessment. Int. J. Environ. Res. Public Health 2021, 18, 1987. [Google Scholar] [CrossRef]
- Du, Y.; Zhao, S.; Hu, Z.; Wang, Y.; Peng, J. Ecological risk assessment of landslide disasters in mountainous areas of Southwest China: A case study in Dali Bai Autonomous Prefecture. Acta Geogr. Sin. 2016, 71, 1544–1561. [Google Scholar] [CrossRef]
- Landis, W.G.; Wiegers, J.K. Ten Years of the Relative Risk Model and Regional Scale Ecological Risk Assessment. Hum. Ecol. Risk Assess. Int. J. 2007, 13, 25–38. [Google Scholar] [CrossRef]
- Gong, J.; Zhao, C.; Wang, H.; Sun, P.; Xie, Y.; Meng, X. Ecological Risk Assessment of Longnan Mountainous Area Based on Geological Disasters—A Case Study of Wudu. Mt. Res. 2012, 30, 570–577. [Google Scholar]
- Xu, W.; Wang, J.; Zhang, M.; Li, S. Construction of landscape ecological network based on landscape ecological risk assessment in a large-scale opencast coal mine area. J. Clean. Prod. 2021, 286, 125523. [Google Scholar] [CrossRef]
- Gao, H.; Song, W. Assessing the Landscape Ecological Risks of Land-Use Change. Int. J. Environ. Res. Public Health 2022, 19, 3945. [Google Scholar] [CrossRef] [PubMed]
- Liang, Y.; Song, W. Integrating potential ecosystem services losses into ecological risk assessment of land use changes: A case study on the Qinghai-Tibet Plateau. J. Environ. Manag. 2022, 318, 115607. [Google Scholar] [CrossRef] [PubMed]
- Liu, W.; Zhang, Y.; Liang, Y.; Sun, P.; Li, Y.; Su, X.; Wang, A.; Meng, X. Landslide Risk Assessment Using a Combined Approach Based on InSAR and Random Forest. Remote Sens. 2022, 14, 2131. [Google Scholar] [CrossRef]
- Jaiswal, P.; van Westen, C.J.; Jetten, V. Quantitative estimation of landslide risk from rapid debris slides on natural slopes in the Nilgiri hills, India. Nat. Hazards Earth Syst. Sci. 2011, 11, 1723–1743. [Google Scholar] [CrossRef] [Green Version]
- Lee, S.; Won, J.S.; Jeon, S.W.; Park, I.; Lee, M.J. Spatial Landslide Hazard Prediction Using Rainfall Probability and a Logistic Regression Model. Math. Geosci. 2015, 47, 565–589. [Google Scholar] [CrossRef]
- Dieu Tien, B.; Tran Anh, T.; Klempe, H.; Pradhan, B.; Revhaug, I. Spatial prediction models for shallow landslide hazards: A comparative assessment of the efficacy of support vector machines, artificial neural networks, kernel logistic regression, and logistic model tree. Landslides 2016, 13, 361–378. [Google Scholar] [CrossRef]
- Lin, J.; Chen, W.; Qi, X.; Hou, H. Risk assessment and its influencing factors analysis of geological hazards in typical mountain environment. J. Clean. Prod. 2021, 309, 127077. [Google Scholar] [CrossRef]
- Wu, J.; Luo, Y.; Wang, X.; Zhao, Y. Uncertainty analysis and risk management of ecological risk of urban landslidedisaster:a case of Shenzhen City. Acta Ecol. Sin. 2020, 40, 3612–3621. [Google Scholar] [CrossRef]
- Reichenbach, P.; Rossi, M.; Malamud, B.D.; Mihir, M.; Guzzetti, F. A review of statistically-based landslide susceptibility models. Earth-Sci. Rev. 2018, 180, 60–91. [Google Scholar] [CrossRef]
- Lin, J.; Lin, M.; Chen, W.; Zhang, A.; Qi, X.; Hou, H. Ecological risks of geological disasters and the patterns of the urban agglomeration in the Fujian Delta region. Ecol. Indic. 2021, 125, 107475. [Google Scholar] [CrossRef]
- Yang, S. TheEvaluation of Geological Hazard Susceptibility in the Southeast Coastal Area Taking FujianProvince for an Example. Ph.D. Thesis, Beijing Jiaotong University, Beijing, China, 2016. [Google Scholar] [CrossRef]
- Shi, T.; Yang, X.; Christakos, G.; Wang, J.; Liu, L. Spatiotemporal Interpolation of Rainfall by Combining BME Theory and Satellite Rainfall Estimates. Atmosphere 2015, 6, 1307–1326. [Google Scholar] [CrossRef] [Green Version]
- Wei, F.; Gao, K.; Hu, K.; Li, Y.; Gardner, J.S. Relationships between debris flows and earth surface factors in Southwest China. Environ. Geol. 2008, 55, 619–627. [Google Scholar] [CrossRef]
- Peng, S.; Ding, Y.; Wen, Z.; Chen, Y.; Cao, Y.; Ren, J. Spatiotemporal change and trend analysis of potential evapotranspiration over the Loess Plateau of China during 2011–2100. Agric. For. Meteorol. 2017, 233, 183–194. [Google Scholar] [CrossRef] [Green Version]
- Zanaga, D.; Van De Kerchove, R.; De Keersmaecker, W.; Souverijns, N.; Brockmann, C.; Quast, R.; Wevers, J.; Grosu, A.; Paccini, A.; Vergnaud, S.; et al. ESA WorldCover 10 m 2020 v100; Zenodo: Geneva, Switzerland, 2021. [Google Scholar] [CrossRef]
- Yue, T.; Yin, S.; Xie, Y.; Yu, B.; Liu, B. Rainfall erosivity mapping over mainland China based on high-density hourly rainfall records. Earth Syst. Sci. Data 2022, 14, 665–682. [Google Scholar] [CrossRef]
- Chen, S.; Chen, B.; Fath, B.D. Ecological risk assessment on the system scale: A review of state-of-the-art models and future perspectives. Ecol. Model. 2013, 250, 25–33. [Google Scholar] [CrossRef]
- Das, I.; Stein, A.; Kerle, N.; Dadhwal, V.K. Landslide susceptibility mapping along road corridors in the Indian Himalayas using Bayesian logistic regression models. Geomorphology 2012, 179, 116–125. [Google Scholar] [CrossRef]
- Sun, D.; Wen, H.; Wang, D.; Xu, J. A random forest model of landslide susceptibility mapping based on hyperparameter optimization using Bayes algorithm. Geomorphology 2020, 362, 107201. [Google Scholar] [CrossRef]
- Breiman, L. Random forests. Mach. Learn. 2001, 45, 5–32. [Google Scholar] [CrossRef] [Green Version]
- Di Napoli, M.; Carotenuto, F.; Cevasco, A.; Confuorto, P.; Di Martire, D.; Firpo, M.; Pepe, G.; Raso, E.; Calcaterra, D. Machine learning ensemble modelling as a tool to improve landslide susceptibility mapping reliability. Landslides 2020, 17, 1897–1914. [Google Scholar] [CrossRef]
- Kulkarni, V.Y.; Sinha, P.K. Pruning of random forest classifiers: A survey and future directions. In Proceedings of the 2012 International Conference on Data Science & Engineering (ICDSE), Cochin, India, 18–20 July 2012; pp. 64–68. [Google Scholar]
- Peduzzi, P. Landslides and vegetation cover in the 2005 North Pakistan earthquake: A GIS and statistical quantitative approach. Nat. Hazards Earth Syst. Sci. 2010, 10, 623–640. [Google Scholar] [CrossRef] [Green Version]
- Fawcett, T. An introduction to ROC analysis. Pattern Recognit. Lett. 2006, 27, 861–874. [Google Scholar] [CrossRef]
- Jiansheng, W.; Minli, Z.; Jian, P. Assessment of mining area’s ecological vulnerability based on landscape pattern: A case study of Liaoyuan, Jilin Province of Northeast China. Chin. J. Ecol. 2012, 31, 3213–3220. [Google Scholar]
- Griffith, J.A.; Martinko, E.A.; Price, K.P. Landscape structure analysis of Kansas at three scales. Landsc. Urban Plan. 2000, 52, 45–61. [Google Scholar] [CrossRef]
- Wang, H.F.; Rao, E.M.; Xiao, Y.; Yan, Y.; Lu, H.T.; Zhu, J.Y. Ecological risk assessment in Southwest China based on multiple risk sources. Acta Ecol. Sin. 2018, 38, 8992–9000. [Google Scholar]
- Li, W.; Cao, Q.; Lang, K.; Wu, J. Linking potential heat source and sink to urban heat island: Heterogeneous effects of landscape pattern on land surface temperature. Sci. Total Environ. 2017, 586, 457–465. [Google Scholar] [CrossRef]
- Zhang, B.; Li, W.; Xie, G.; Xiao, Y. Water conservation function and its measurement methods of forest ecosystem. Chin. J. Ecol. 2009, 28, 529–534. [Google Scholar]
- Cai, C.; Ding, S.; Shi, Z.; Huang, L.; Zhang, G. Study of applying USLE and geographical information system IDRISI to predict soil erosion in small watershed. J. Soil Water Conserv. 2000, 14, 19–24. [Google Scholar]
- Rao, E.; Ouyang, Z.; Yu, X.; Xiao, Y. Spatial patterns and impacts of soil conservation service in China. Geomorphology 2014, 207, 64–70. [Google Scholar] [CrossRef]
- Yi, K.; Wang, S.Y.; Wang, X. The Characteristics of Spatial-temporal Differentiation of Soil Erosion Based on RUSLE Model: A Case Study of Chaoyang City, Liaoning Province. Sci. Geogr. Sin. 2015, 35, 365–372. [Google Scholar] [CrossRef]
- Zhou, M.; Deng, J.; Lin, Y.; Belete, M.; Wang, K.; Comber, A.; Huang, L.; Gan, M. Identifying the Effects of Land Use Change on Sediment Export: Integrating Sediment Source and Sediment Delivery in the Qiantang River Basin, China. Sci. Total Environ. 2019, 686, 38–49. [Google Scholar] [CrossRef] [PubMed]
- Yang, D.; Kanae, S.; Oki, T.; Koike, T.; Musiake, K. Global potential soil erosion with reference to land use and climate changes. Hydrol. Process. 2003, 17, 2913–2928. [Google Scholar] [CrossRef]
- Teng, H. Assimilating Multi-Source Data to Model and Map Potential Soil Loss in China. Doctoral Dissertation, Zhengjiang University, Hangzhou, China, 2017. [Google Scholar]
- Zhou, L.; Li, Y.; Sun, Y. Determination of units for various factors of Revised Universal Soil Loss Equation. Bull. Soil Water Conserv. 2018, 38, 169–174. [Google Scholar]
- Zong, L.; He, S.; Lian, J.; Bie, Q.; Wang, X.; Dong, J.; Xie, Y. Detailed Mapping of Urban Land Use Based on Multi-Source Data: A Case Study of Lanzhou. Remote Sens. 2020, 12, 1987. [Google Scholar] [CrossRef]


| Random Forest Model | Information Quantity Model | |||||
|---|---|---|---|---|---|---|
| Hazard Level | Area (km) | Number of Geological Disasters /Proportion | Frequency (/km) | Area (km) | Number of Geological Disasters /Proportion | Frequency (/km) |
| Very low | 28,621.38 | 96/3.76% | 0.34 | 10,330.91 | 39/1.53% | 0.38 |
| Low | 31,239.9 | 212/8.31% | 0.68 | 32,976.65 | 257/10.07% | 0.78 |
| Medium | 28,747.29 | 395/15.48% | 1.37 | 35,017.88 | 482/18.90% | 1.38 |
| High | 21,083.87 | 695/27.24% | 3.30 | 25,278.4 | 814/31.91% | 3.22 |
| Very high | 12,639.22 | 1153/45.20% | 9.12 | 16,602.56 | 959/37.60% | 5.78 |
Disclaimer/Publisher’s Note: The statements, opinions and data contained in all publications are solely those of the individual author(s) and contributor(s) and not of MDPI and/or the editor(s). MDPI and/or the editor(s) disclaim responsibility for any injury to people or property resulting from any ideas, methods, instructions or products referred to in the content. |
© 2023 by the authors. Licensee MDPI, Basel, Switzerland. This article is an open access article distributed under the terms and conditions of the Creative Commons Attribution (CC BY) license (https://creativecommons.org/licenses/by/4.0/).
Share and Cite
Zong, L.; Zhang, M.; Chen, Z.; Niu, X.; Chen, G.; Zhang, J.; Zhou, M.; Liu, H. Ecological Risk Assessment of Geological Disasters Based on Probability-Loss Framework: A Case Study of Fujian, China. Int. J. Environ. Res. Public Health 2023, 20, 4428. https://doi.org/10.3390/ijerph20054428
Zong L, Zhang M, Chen Z, Niu X, Chen G, Zhang J, Zhou M, Liu H. Ecological Risk Assessment of Geological Disasters Based on Probability-Loss Framework: A Case Study of Fujian, China. International Journal of Environmental Research and Public Health. 2023; 20(5):4428. https://doi.org/10.3390/ijerph20054428
Chicago/Turabian StyleZong, Leli, Ming Zhang, Zi Chen, Xiaonan Niu, Guoguang Chen, Jie Zhang, Mo Zhou, and Hongying Liu. 2023. "Ecological Risk Assessment of Geological Disasters Based on Probability-Loss Framework: A Case Study of Fujian, China" International Journal of Environmental Research and Public Health 20, no. 5: 4428. https://doi.org/10.3390/ijerph20054428