

Developing and Applying an Urban Resilience Index for the Evaluation of Declining Areas: A Case Study of South Korea’s Urban Regeneration Sites

Abstract
:1. Introduction
2. Background
2.1. Urban Decline and Regeneration
2.2. Urban Resilience
3. Methodology
3.1. Selection and Classification of Urban Resilience Evaluation Indicators
3.2. Results Indexing Using the Euclidean Distance
- In the case of one measurement indicator, the height of the Euclidean space is “0”. Thus, use the normalization measurement value.
- In the case of two measurement indicators, use the Euclidean norm of two measurement indicator values in the Euclidean space:
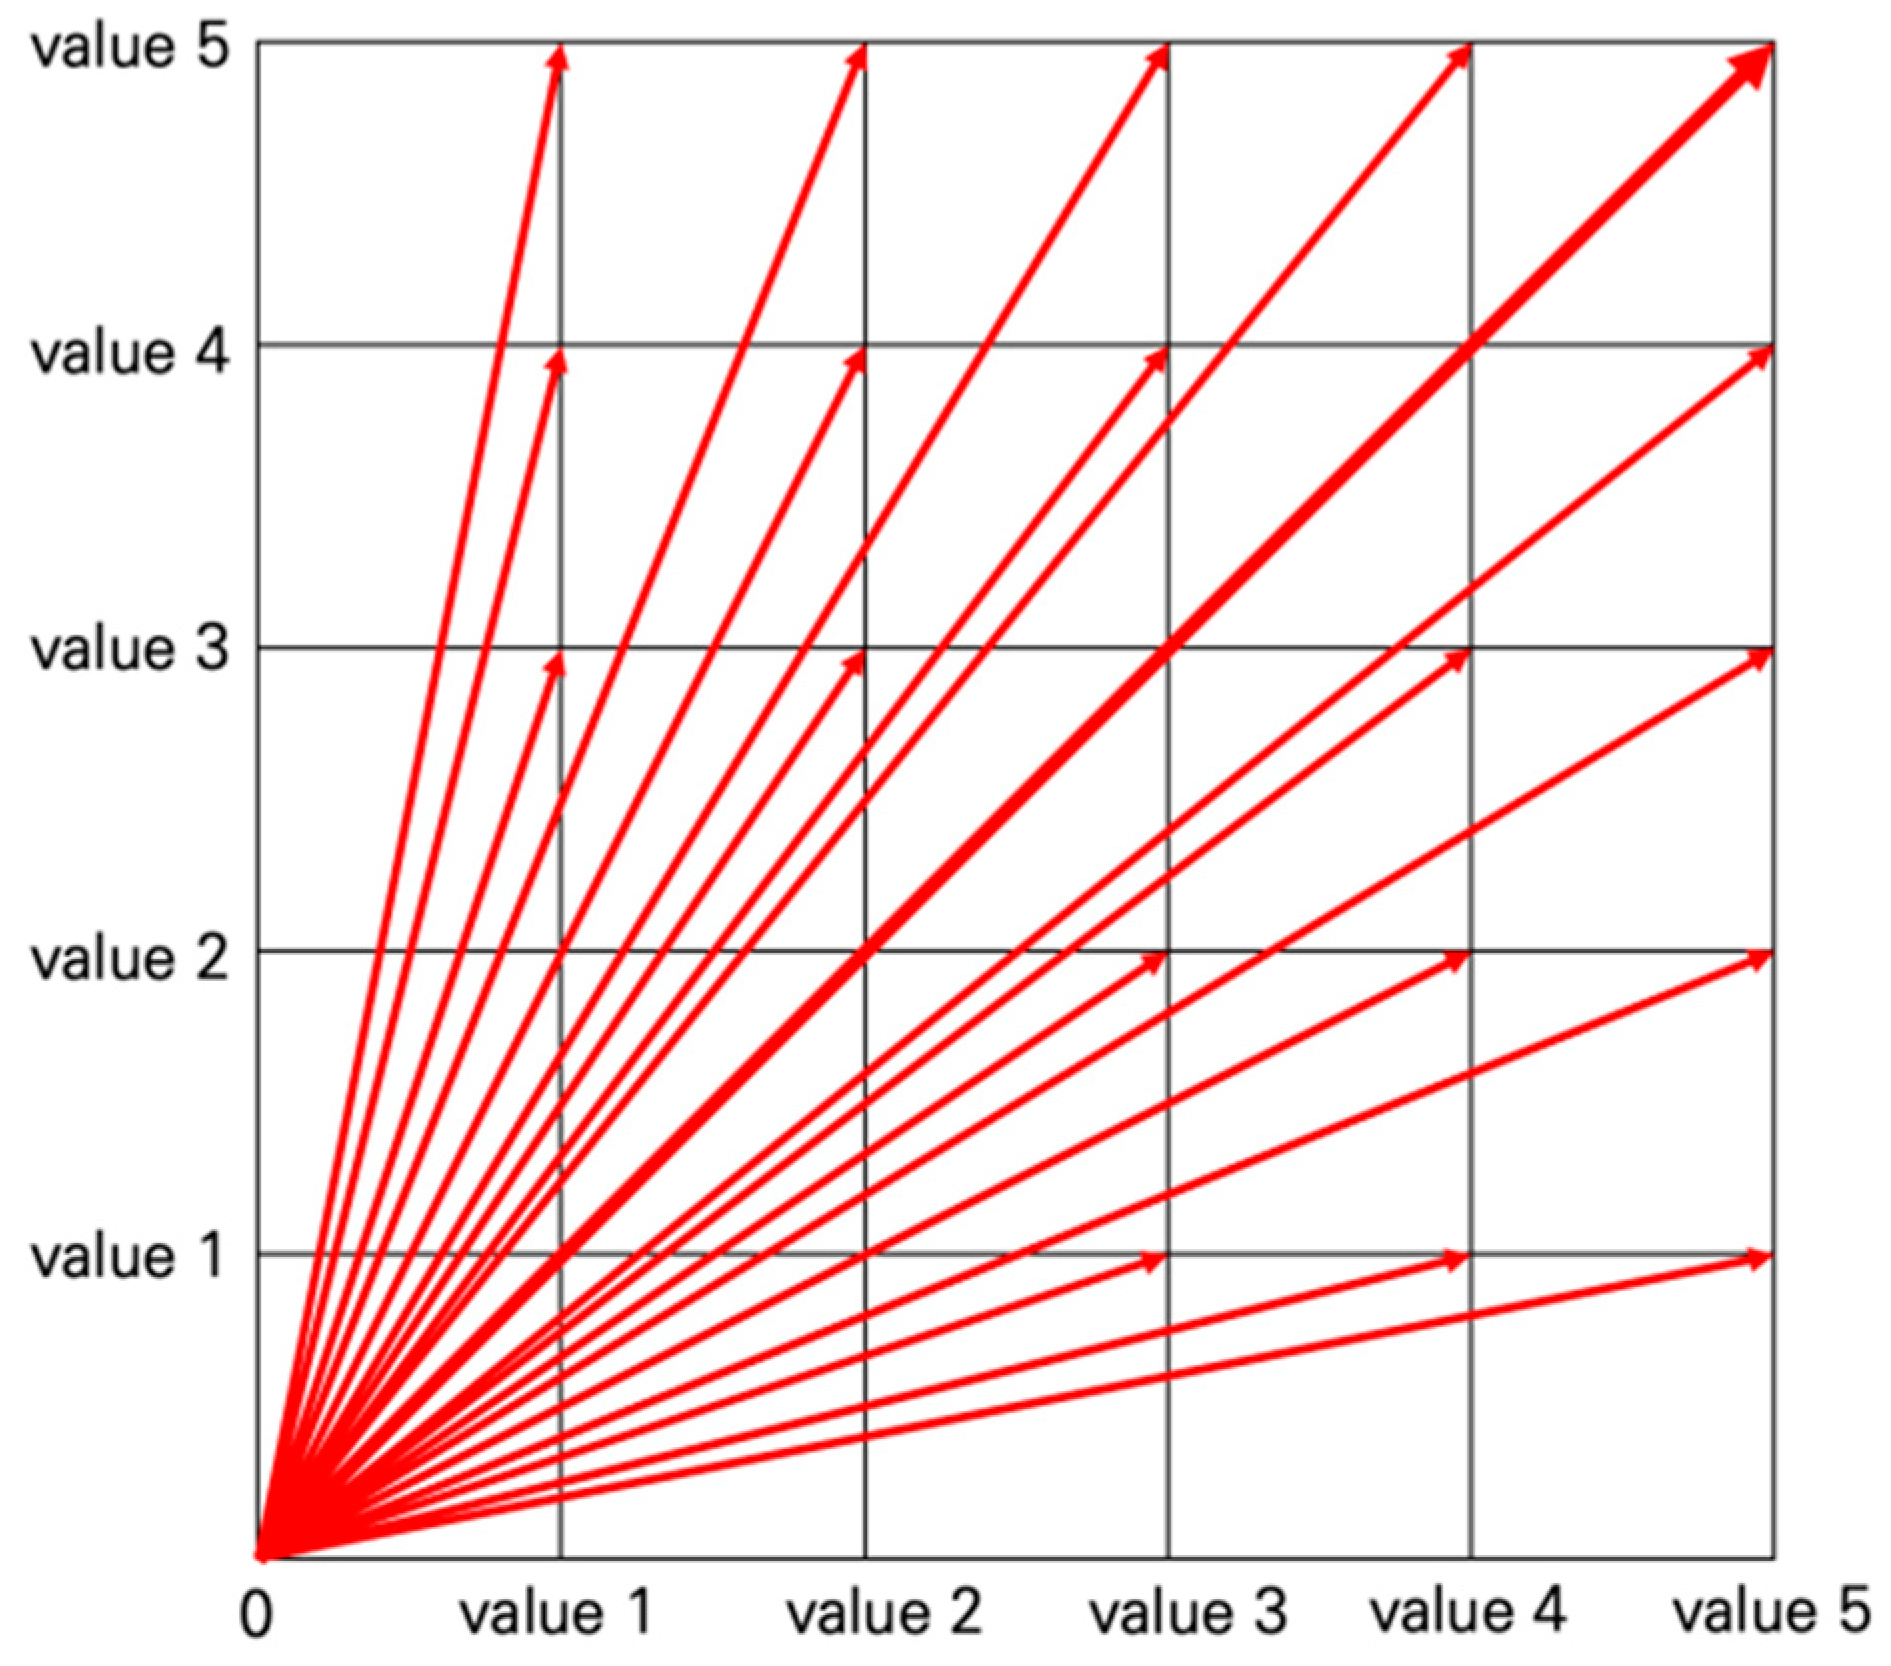
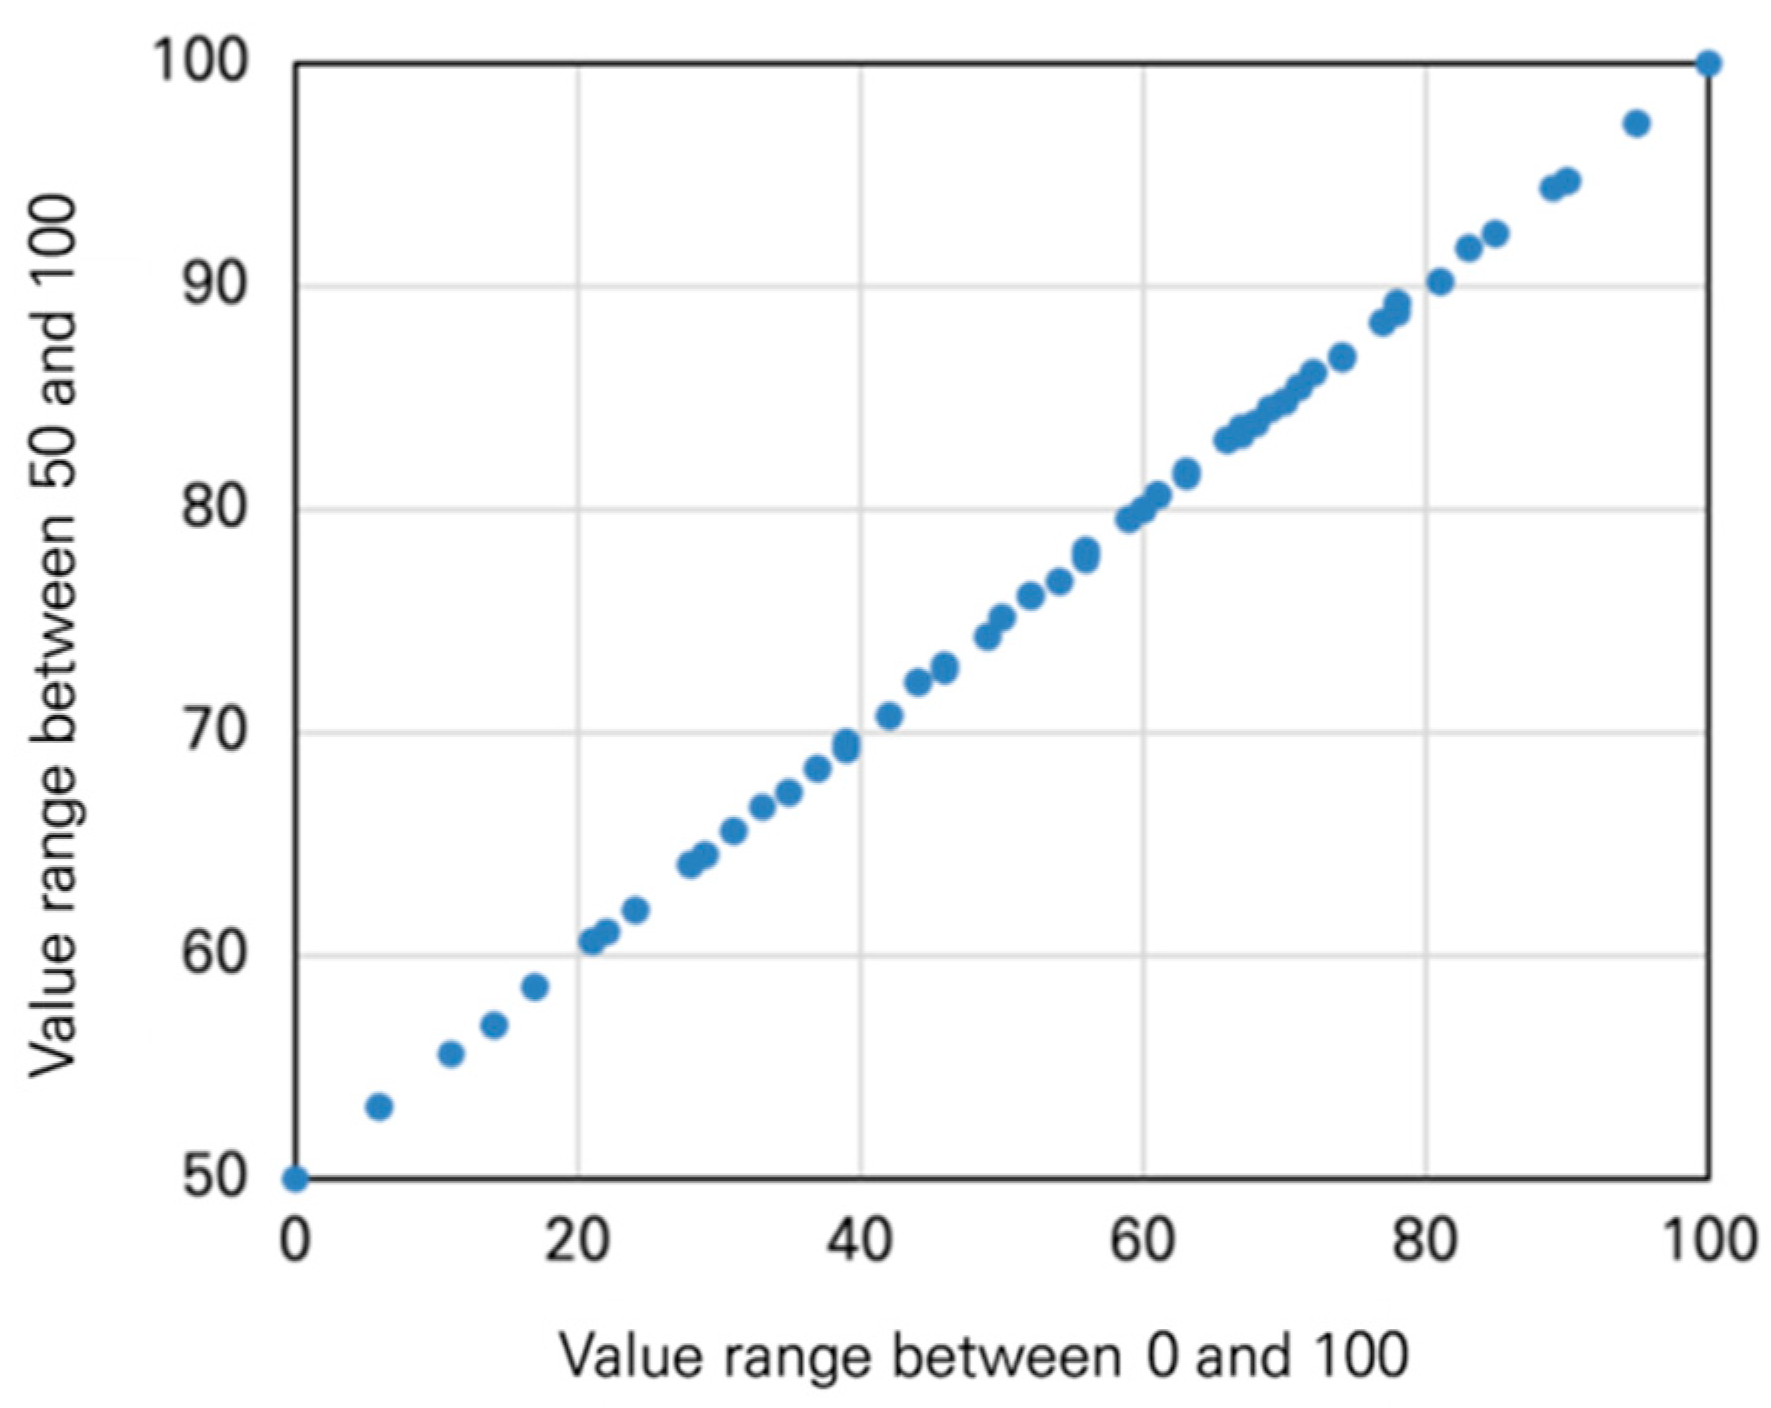
- In the case of three measurement indicators, use the Euclidean norm of three measurement indicator values in the Euclidean space:when raw value was used without normalization, the angle between two measurement indicators was deduced and defined as cos θ. Subsequently, calculate to deduce the Scala-product of a vector multiplied by the Euclidean norm. To deduce the index from the calculated Euclidean distance, two steps are required: (1) the normalization of the Euclidean distance; and (2) translation to the selected range. For the normalization of the distance, Min–Max Normalization is used to interpret the meaning of the value measurement, as the calculated index can vary widely, depending on the number of indices and value range:
- α is the measurement indicator value, Amax is the maximum value of measurement indicator, and Amin is the minimum value of measurement indicator.
- α is the measurement indicator value, Β is the maximum value within the range, and A is the minimum value within the range.
- Note: the range of the values does not impact the magnitude and position of the basis of value (Figure 3).
- 𝑠 is the set of {GRI-Vulnerability, GRI-Adaptability … ISS-Transformability}, and 𝑖 is the set of sites, is the j-th indicator of the .
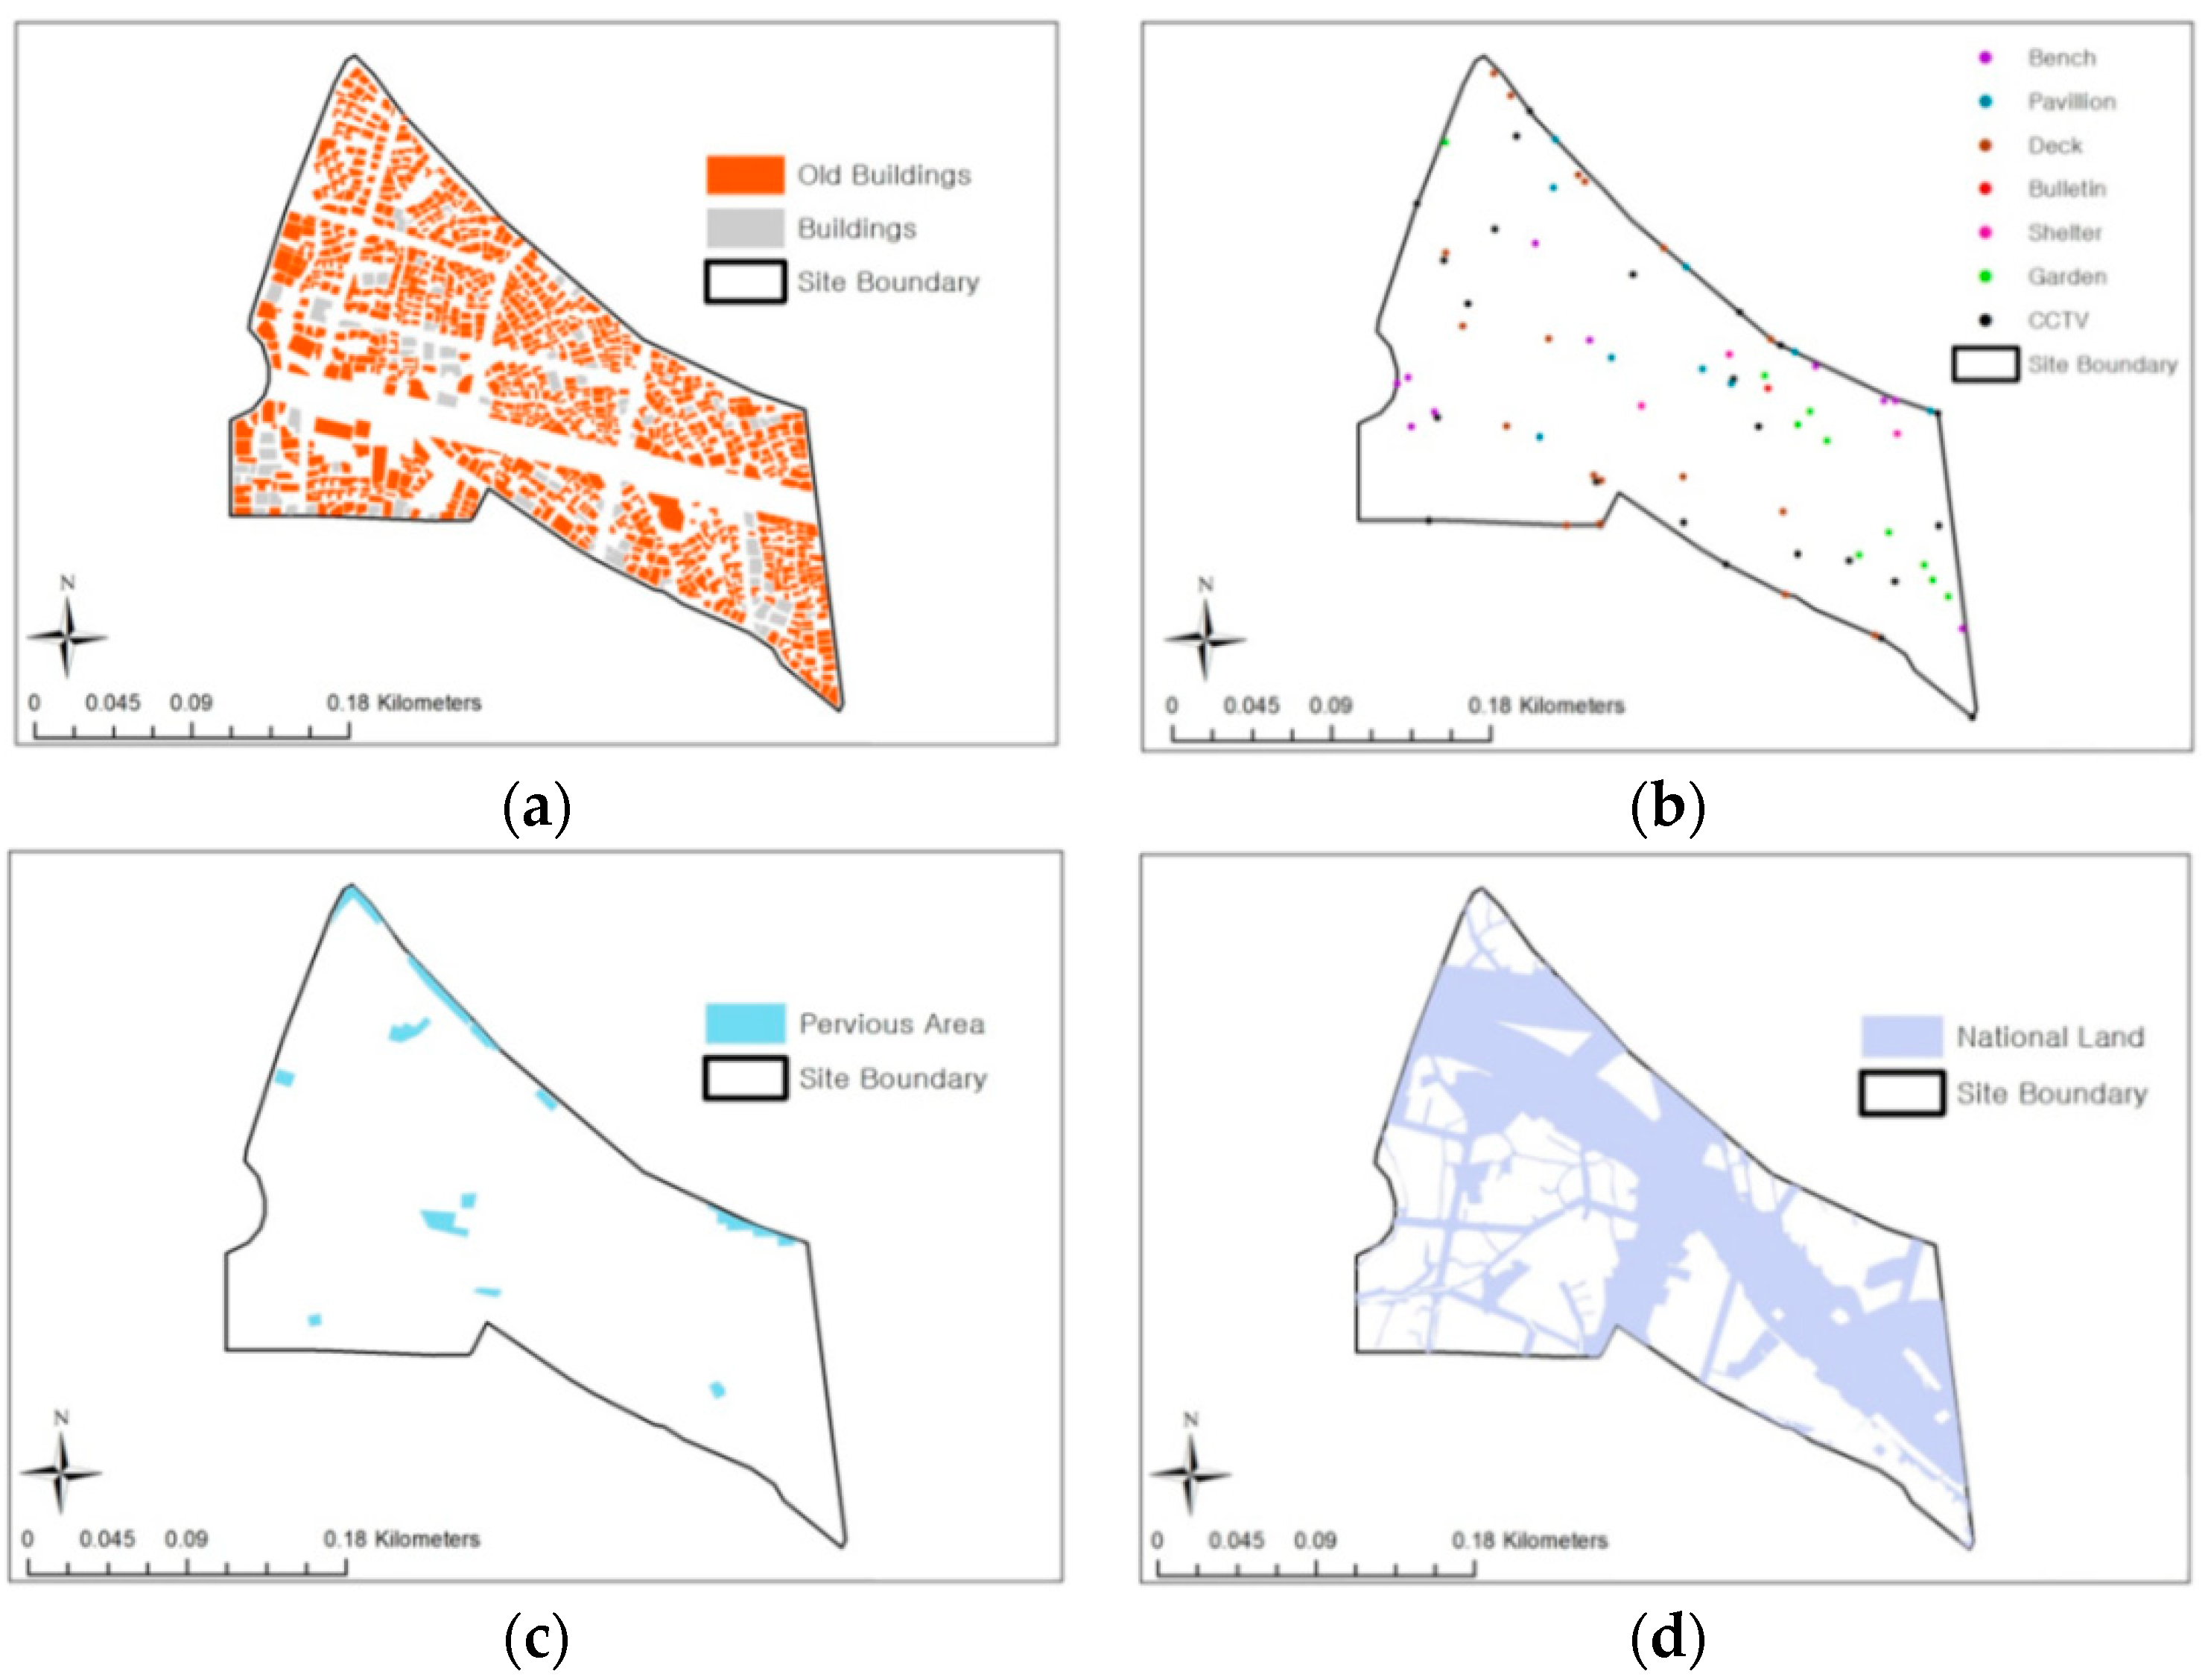
3.3. Target Sites
3.4. Data
4. Results
5. Conclusions
Author Contributions
Funding
Institutional Review Board Statement
Informed Consent Statement
Data Availability Statement
Conflicts of Interest
References
- Park, S. Enhancing Regional Resilience in Response to Crisis. Land 2015, 400, 2–4. [Google Scholar]
- Jung, H.; Yang, C. Research trend of resilience studies in public administration and public policy using keywords network analysis. Korean J. Policy Anal. Eval. 2018, 28, 49–74. [Google Scholar] [CrossRef]
- Marchese, D.; Reynolds, E.; Bates, M.E.; Morgan, H.; Clark, S.S.; Linkov, I. Resilience and sustainability: Similarities and differences in environmental management applications. Sci. Total Environ. 2018, 613, 1275–1283. [Google Scholar] [CrossRef]
- Sanchez, A.X.; Van der Heijden, J.; Osmond, P. The city politics of an urban age: Urban resilience conceptualisations and policies. Palgrave Commun. 2018, 4, 25. [Google Scholar] [CrossRef] [Green Version]
- Lee, G.; Jin, D.; Song, S.; Choi, H. Text analysis on the research trend of ‘Resilience’ in Korea: Focus on climate change and urban disaster. J. Clim. Chang. Res. 2019, 10, 401–414. [Google Scholar] [CrossRef]
- Choi, H.; Lee, G.; Eo, S. Development of urban resilience evaluation indicators and policy application. In KEI Environment Forum; KEI: Sejong, Korea, 2021; p. 12. [Google Scholar]
- Shin, Y.; Lee, S.; Chang, K.; Yang, D. Development of comprehensive diagnosis model for urban space in deteriorated areas: Focusing on disaster risk and resiliency. J. Korea Plan. Assoc. 2021, 56, 169–176. [Google Scholar] [CrossRef]
- Jeon, E.; Byun, B. A study on the Development and application of community resilience evaluation indicators for responding to climate change. Geogr. J. Korea 2017, 51, 47–58. [Google Scholar]
- Korean Law Information Center. Special Act on the Promotion and Support of Urban Regeneration. Available online: https://www.law.go.kr/ (accessed on 20 September 2022).
- Han, J.; Nam, J. A study on the effects of the decline of industrial complex on the urban areas. J. Korean Reg. Dev. Assoc. 2020, 32, 167–187. [Google Scholar]
- Kwon, O.; Kang, E.; Ma, K. A study on the impact of the urban decline on the subjective well-being of residents. J. Korean Reg. Sci. Assoc. 2019, 35, 33–47. [Google Scholar] [CrossRef]
- Jung, E. A study about the planning housing cluster for sustainable community of declining regions in non-urban area. J. Korean Reg. Dev. Assoc. 2017, 29, 57–74. [Google Scholar]
- Adger, W.N. Social capital, collective action and adaptation to climate change. Econ. Geogr. 2010, 79, 327–345. [Google Scholar] [CrossRef]
- Kwon, Y.; Lee, J.; Kim, H.; Oh, J. Comprehensive urban regeneration design strategy of abandoned railroad area through citizen-participation: Focused on the case of Gwangyang-si abandoned railroad park. J. Urban Des. Inst. Korea 2013, 14, 47–63. [Google Scholar] [CrossRef]
- Yoon, Y. The approvement and review of maeulmandeulgi through resident’s participation for community oriented urban renewal development. SH Urban Res. Insight 2014, 4, 33–43. [Google Scholar] [CrossRef]
- Lee, N.; Ahn, J. ‘General type of neighborhood regeneration’ urban regeneration project and promotion of resident-participation: Focusing on Garibong-dong, Guro-gu, Seoul. J. Korean Urban Geogr. Soc. 2017, 20, 63–78. [Google Scholar] [CrossRef]
- Lee, J. A case study on residents’ participation in urban regeneration project. SH Urban Res. Insight 2020, 10, 55–70. [Google Scholar] [CrossRef]
- Kang, J.; Moon, K. The effect of local social properties on residents’ intention to participate in urban regeneration projects. J. Korean Hous. Assoc. 2022, 33, 87–95. [Google Scholar] [CrossRef]
- Kim, J.; Nam, J. A study on vacant house distribution and management of urban declining area. J. Korean Reg. Sci. Assoc. 2016, 32, 105–122. [Google Scholar]
- Im, H.; Ahn, M.; Lee, C.; Lee, S.; Lee, J. Development of a comprehensive diagnosis index for disasters in declining areas and comparison of risks between regions: A case of Seoul. J. Korean Reg. Sci. Assoc. 2021, 37, 33–47. [Google Scholar] [CrossRef]
- Kim, Y.; Park, B.; Jung, H. Climate change vulnerability of roads to heavy snow: Establishing new assessment criteria on VESTAP. Korean J. Urban Stud. 2018, 14, 73–92. [Google Scholar] [CrossRef]
- Kim, J.; Park, J.; Cho, B.; Lee, S. A comparative analysis of disaster vulnerability factors between declining areas and urban areas. J. Digit. Contents Soc. 2020, 21, 2021–2032. [Google Scholar] [CrossRef]
- OECD. Indicators for Resilient Cities; OECD: Paris, France, 2018; pp. 1–66. [Google Scholar]
- Walker, B.; Honning, C.S.; Carpenter, S.R.; Kinzig, A. Resilience, adaptability and transformability insocial-ecological systems. Ecol. Soc. 2004, 9, 5. [Google Scholar] [CrossRef]
- Folke, C.; Carpenter, S.R.; Walker, B.; Scheffer, M.; Chapin, T.; Rockstrom, J. Resilience thinking: Integrating resilience, adaptability and transformability. Ecol. Soc. 2010, 15, 20. [Google Scholar] [CrossRef]
- Kim, J.; Im, J.; Lee, S. Development and applicability of resilient city criteria for adopting resilient city model: Focused on Hamburg water cycle jenfelder au, Germany. J. Urban Des. Inst. Korea 2018, 19. [Google Scholar] [CrossRef]
- Cutter, S.L.; Ash, K.D.; Emirich, C.T. The geographies of community disaster resilience. Glob. Environ. Chang. 2014, 29, 65–77. [Google Scholar] [CrossRef]
- U.S. IOTWS. How Resilient Is Your Coastal Community? A Guide for Evaluating Coastal Community Resilience to Tsunamis and Other Hazards; U.S. Indian Ocean Tsunami Warning System Program; USAID: Washington, DC, USA, 2007. [Google Scholar]
- Kang, S.; Cho, S.; Hong, S. A Policy Implication for Community Resilience from Natural Disasters; Gyeonggi Research Institute: Suwon, Republic of Korea, 2013. [Google Scholar]
- Yoon, D.; Kang, J.; Brody, S. A measurement of community disaster resilience in Korea. J. Environ. Plan. Manag. 2016, 59, 436–460. [Google Scholar] [CrossRef]
- Sherrieb, K.; Norris, F.H.; Galea, S. Measuring capacities for community resilience. Soc. Indic. Res. 2010, 99, 227–247. [Google Scholar] [CrossRef]
- EPA. Development of a Climate Resilience Screening Index (CSRI): An Assessment of Resilience to Acute Meteorological Events and Selected Natural Hazards; Environmental Protection Agency: Washington, DC, USA, 2017. [Google Scholar]
- Miola, A.; Paccagnan, V.; Padadimitriou, E.; Mandrici, A. Climate Resilient Development Index: Theoretical Framework, Selection Criteria and Fit-for-Purpose Indicators; Report EUR 27126; European Commission: Brussels, Belgium, 2015. [Google Scholar]
- Kim, D.; Song, S.; Kang, S.; Kwon, T.; Kim, J.; Nam, K.; Yoon, D.; Lee, D.; Jung, J.; Jo, S.; et al. Urban Climate Resilience: Operationalization and Evolution (II); Korea Environment Institute: Yeongi-gun, Korea, 2016. [Google Scholar]
- Parsons, M.; Morley, P. The Australian natural disaster resilience index. Aust. J. Emerg. Manag. 2017, 32, 20–22. [Google Scholar]
- Cutter, S.L.; Burton, C.G.; Emrich, C.T. Disaster resilience indicators for benchmarking baseline conditions. J. Homel. Secur. Emerg. Manag. 2010, 7, 51. [Google Scholar] [CrossRef]
- Lee, G.; Jung, Y.; Eo, S.; Choi, H. A primary study to develop an evaluation index for urban resilience in declining areas: Utilization of policy network analysis and fuzzy multiple-criteria decision-making method. J. Clim. Chang. Res. 2021, 12, 739–754. [Google Scholar] [CrossRef]


| Organizations | RM | SS | AR | SAM | RE | GP | SA |
|---|---|---|---|---|---|---|---|
| OECD | - | ● | ● | ● | - | - | ● |
| UN-HABITAT | - | ● | - | ● | ● | - | - |
| International Council for Local Environmental | - | ● | ● | ● | ● | - | - |
| United Nations Office for Disaster Risk Reduction | ● | - | ● | - | ● | - | - |
| Rockefeller Foundation | - | ● | - | ● | - | ● | - |
| World Bank | - | ● | - | ● | ● | - | - |
| USAID | ● | ● | - | ● | ● | ● | - |
| 100 Resilient Cities | - | ● | - | ● | - | ● | - |
| Resilient Europe | - | ● | - | - | ● | ● | - |
| Global Alliance for Resilience | - | ● | ● | ● | ● | - | ● |
| Large | Medium | Small | Indicators | Unit | ||
|---|---|---|---|---|---|---|
| GRI | Vulnerability | Disaster damage | GV-1 | Property damage from disaster | Total amount of property damage due to disasters in last 10 years | ₩ / m2 |
| GV-2 | Human life damage from disaster | Total casualties due to disasters in last 10 years | No. of people / m2 | |||
| Size of vulnerable area | GV-3 | Special purpose district | Combined area of the district | m2 | ||
| Adaptability | Ecological adaptability | GA-1 | Open space | Percentage of open space area in urban planning facilities | % | |
| GA-2 | Green parks and infrastructure | Proportion of green area and other green spaces | % | |||
| Safety of buildings and structures | GA-3 | Aged building | Percentage of 20 years + old buildings | % | ||
| GA-4 | Building density | Ratio of floor area of buildings in the target site | % | |||
| GA-5 | Structural stability | Percentage of wooden or masonry structured buildings | % | |||
| Transformability | Scalability of community facilities | GT-1 | Community facilities accessibility | Number of schools + public health centers + administrative facilities + parks | No. of facilities/m2 | |
| GT-2 | Land ownership status | Ratio of publicly owned land | % | |||
| Adequacy of response infrastructure | GT-3 | Road accessibility | Ratio of buildings adjacent to roads with a width of 4 m or more | % | ||
| GT-4 | Accessibility to evacuation facilities | Number of civil defense evacuation facilities | No. of facilities/m2 | |||
| ISS | Vulnerability | Population composition | IV-1 | Vulnerable population | Proportion of vulnerable population (age less than 14 and more than 65) | % |
| IV-2 | Population change | Population change rate of a region in last 10 years | % | |||
| Society and economy | IV-3 | Economically vulnerable class | Proportion of basic livelihood recipient + single-parent family beneficiary + foreign residents | % | ||
| IV-4 | Small business owners | Percentage of small business owners | % | |||
| Adaptability | Pre-emptive response system | IA-1 | Customized alarm system | Number of alarm systems and notification systems + CCTV | No. of systems/ 10,000 m2 | |
| IA-2 | Vacant house maintenance project | Percentage of vacant houses | % | |||
| Tailored (Emergency) support system | IA-3 | Emergency medical (protection) system | Area that can be opened for emergency medical support | m2/person | ||
| IA-4 | Public safety management personnel | Local government safety management (police officers + firefighters + public officials dedicated to social welfare) personnel | No. of personnel/1,000 people | |||
| Transformability | Availability of human resource | IT-1 | Disaster management budget | Average value of local government disaster management funds raised in last five years | ₩1M/1,000people | |
| IT-2 | Volunteer | Number of local government registered volunteers | No. of volunteers/ 1,000 people | |||
| Risk communication activity | IT-3 | Resident/Business/Socio-economic organization | Percentage of participants in the organization (such as residents, merchants, etc.) + subscribers to community mapping services | % | ||
| IT-4 | Community activity spaces | Number of outdoor community places (chairs, tables, etc.) | No. of places/ 10,000 m2 | |||
| Sites | Site A | Site B | Site C |
|---|---|---|---|
 |  |  |  |
| Area: 174,452 m2 Project period: 2019~2022 | Area: 294,831 m2 Project period: 2017~2022 | Area: 109,000 m2 Project period: 2020~2023 | |
| Comparative Site A | Comparative Site B | Comparative Site C | |
 |  |  | |
| Area: 246,526 m2 | Area: 597,472 m2 | Area: 190,141 m2 |
| Category | Site-A | Site-B | Site-C | |||||||||
|---|---|---|---|---|---|---|---|---|---|---|---|---|
| Preproject | Postproject | Preproject | Postproject | Preproject | Postproject | |||||||
| Value | Grade | Value | Grade | Value | Grade | Value | Grade | Value | Grade | Value | Grade | |
| GV-1 | 649.29 | 1 | 649.29 | 1 | 241.82 | 4 | 241.82 | 4 | 82.56 | 5 | 82.56 | 5 |
| GV-2 | 7.48 | 1 | 7.48 | 1 | 1.95 | 3 | 1.95 | 3 | 0.29 | 5 | 0.29 | 5 |
| GV-3 | 3.70 | 5 | 3.70 | 5 | 5.81 | 4 | 5.81 | 4 | 2.68 | 5 | 2.68 | 5 |
| GA-1 | 0.00 | 1 | 0.79 | 1 | 0.00 | 1 | 3.10 | 3 | 0.00 | 1 | 4.04 | 3 |
| GA-2 | 0.00 | 1 | 5.47 | 5 | 2.94 | 3 | 10.21 | 5 | 4.71 | 5 | 16.03 | 5 |
| GA-3 | 87.55 | 2 | 87.55 | 2 | 80.23 | 2 | 80.23 | 2 | 89.17 | 2 | 89.17 | 2 |
| GA-4 | 52.45 | 3 | 52.45 | 3 | 31.12 | 4 | 31.12 | 4 | 26.95 | 5 | 26.95 | 5 |
| GA-5 | 22.49 | 1 | 22.49 | 1 | 40.82 | 1 | 40.82 | 1 | 13.38 | 1 | 13.38 | 1 |
| GT-1 | 0.00 | 1 | 1.20 | 5 | 0.47 | 2 | 1.19 | 5 | 0.24 | 1 | 2.57 | 5 |
| GT-2 | 30.50 | 3 | 30.50 | 3 | 32.21 | 3 | 32.21 | 3 | 19.14 | 1 | 19.14 | 1 |
| GT-3 | 50.31 | 5 | 50.31 | 5 | 41.91 | 5 | 41.91 | 5 | 55.59 | 5 | 55.59 | 5 |
| GT-4 | 0.00 | 1 | 0.00 | 1 | 0.00 | 1 | 0.00 | 1 | 0.00 | 1 | 0.00 | 1 |
| IV-1 | 27.30 | 3 | 27.30 | 3 | 25.92 | 3 | 25.92 | 3 | 58.64 | 1 | 58.64 | 1 |
| IV-2 | −23.81 | 1 | −23.81 | 1 | −25.47 | 1 | −25.47 | 1 | 1.46 | 5 | 1.46 | 5 |
| IV-3 | 10.00 | 1 | 10.00 | 1 | 8.98 | 2 | 8.98 | 2 | 4.66 | 2 | 4.66 | 2 |
| IV-4 | 54.90 | 1 | 54.90 | 1 | 59.58 | 1 | 59.58 | 1 | 50.32 | 1 | 50.32 | 1 |
| IA-1 | 1.49 | 2 | 2.69 | 3 | 0.88 | 1 | 2.17 | 3 | 2.48 | 3 | 5.96 | 5 |
| IA-2 | 6.90 | 3 | 6.90 | 3 | 11.98 | 1 | 11.98 | 1 | 0.51 | 5 | 0.51 | 5 |
| IA-3 | 0.68 | 1 | 0.68 | 1 | 1.77 | 2 | 1.77 | 2 | 2.38 | 3 | 2.38 | 3 |
| IA-4 | 4.83 | 3 | 4.83 | 3 | 4.19 | 3 | 4.19 | 3 | 3.25 | 2 | 3.25 | 2 |
| IT-1 | 69.31 | 5 | 69.31 | 5 | 40.00 | 3 | 40.00 | 3 | 40.27 | 3 | 40.27 | 3 |
| IT-2 | 245.66 | 1 | 245.66 | 1 | 196.34 | 1 | 196.34 | 1 | 266.49 | 2 | 266.49 | 2 |
| IT-3 | 11.51 | 3 | 11.51 | 3 | 8.71 | 2 | 8.71 | 2 | 8.35 | 2 | 8.35 | 2 |
| IT-4 | 2.58 | 4 | 3.10 | 5 | 0.78 | 1 | 1.15 | 1 | 2.57 | 4 | 3.12 | 5 |
| Before Project | After Project | Comparative Group |
|---|---|---|
 |  |  |
 |  |  |
 |  |  |
Disclaimer/Publisher’s Note: The statements, opinions and data contained in all publications are solely those of the individual author(s) and contributor(s) and not of MDPI and/or the editor(s). MDPI and/or the editor(s) disclaim responsibility for any injury to people or property resulting from any ideas, methods, instructions or products referred to in the content. |
© 2023 by the authors. Licensee MDPI, Basel, Switzerland. This article is an open access article distributed under the terms and conditions of the Creative Commons Attribution (CC BY) license (https://creativecommons.org/licenses/by/4.0/).
Share and Cite
Kim, B.; Lee, G.-S.; Kim, M.; Lee, W.-S.; Choi, H.-S. Developing and Applying an Urban Resilience Index for the Evaluation of Declining Areas: A Case Study of South Korea’s Urban Regeneration Sites. Int. J. Environ. Res. Public Health 2023, 20, 3653. https://doi.org/10.3390/ijerph20043653
Kim B, Lee G-S, Kim M, Lee W-S, Choi H-S. Developing and Applying an Urban Resilience Index for the Evaluation of Declining Areas: A Case Study of South Korea’s Urban Regeneration Sites. International Journal of Environmental Research and Public Health. 2023; 20(4):3653. https://doi.org/10.3390/ijerph20043653
Chicago/Turabian StyleKim, Byungsuk, Gil-Sang Lee, Minjun Kim, Who-Seung Lee, and Hee-Sun Choi. 2023. "Developing and Applying an Urban Resilience Index for the Evaluation of Declining Areas: A Case Study of South Korea’s Urban Regeneration Sites" International Journal of Environmental Research and Public Health 20, no. 4: 3653. https://doi.org/10.3390/ijerph20043653