
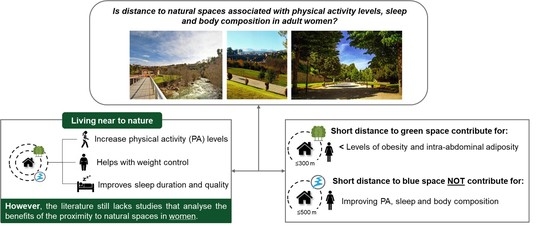
Distance to Natural Environments, Physical Activity, Sleep, and Body Composition in Women: An Exploratory Analysis

 ,
,  , , , , and
Abstract
:
1. Introduction
2. Materials and Methods
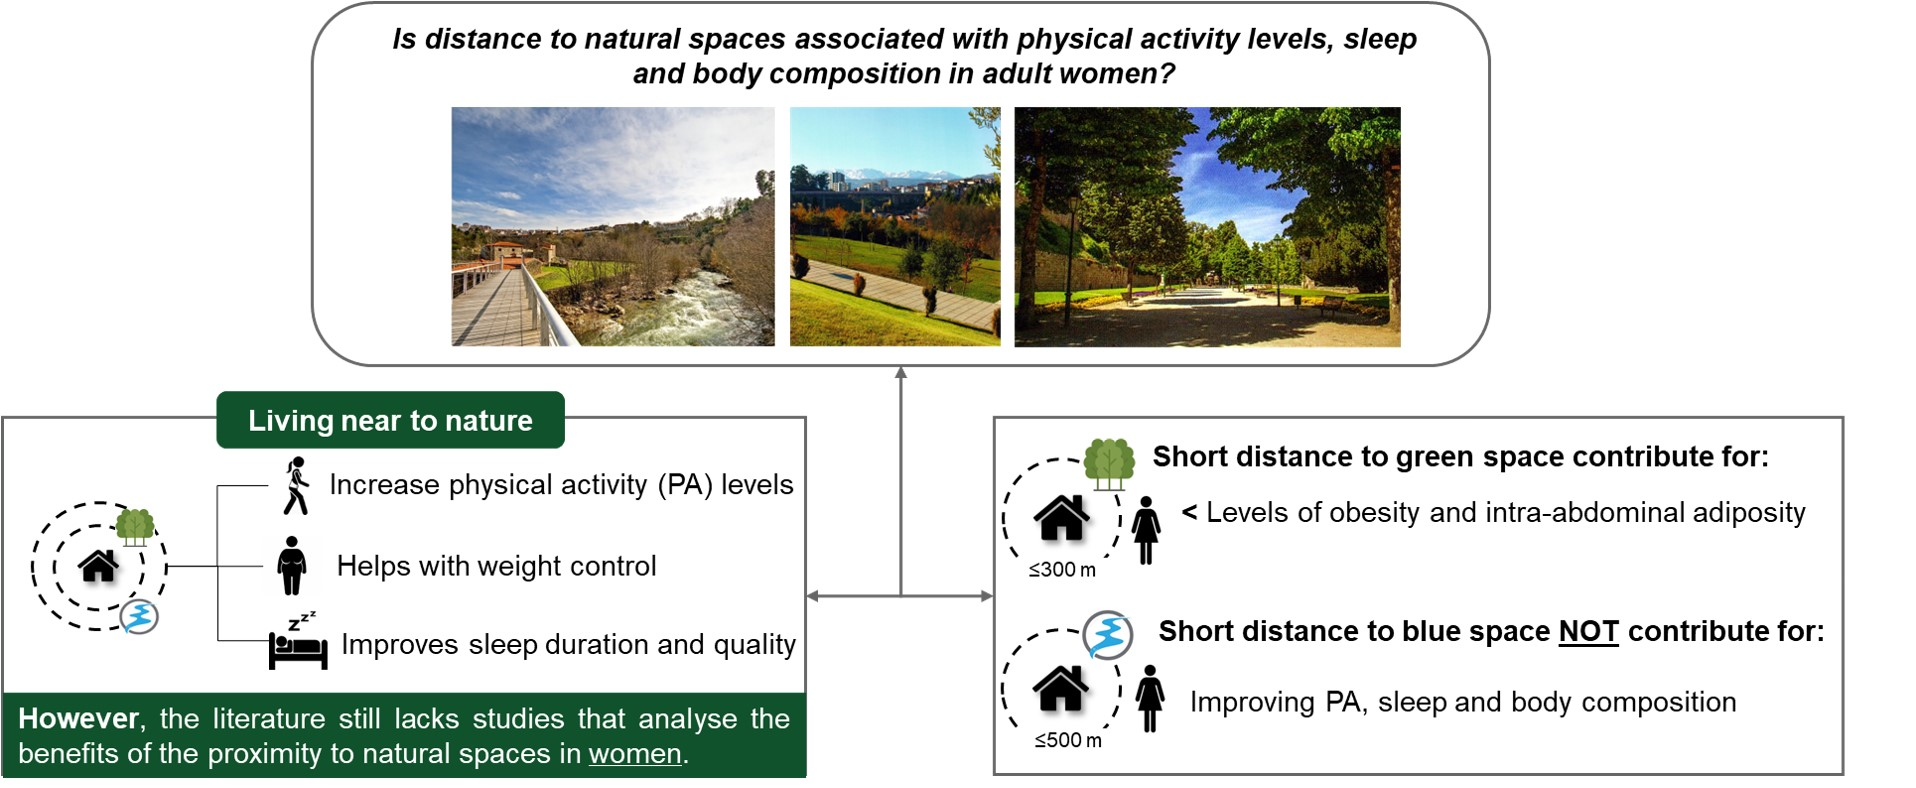
2.1. Study Area
2.2. Ethics Statement
2.3. Study Design and Sample
2.4. Exposure Assessment
2.5. Health Measures
2.6. Demographic Characteristics
2.7. Statistical Analyses
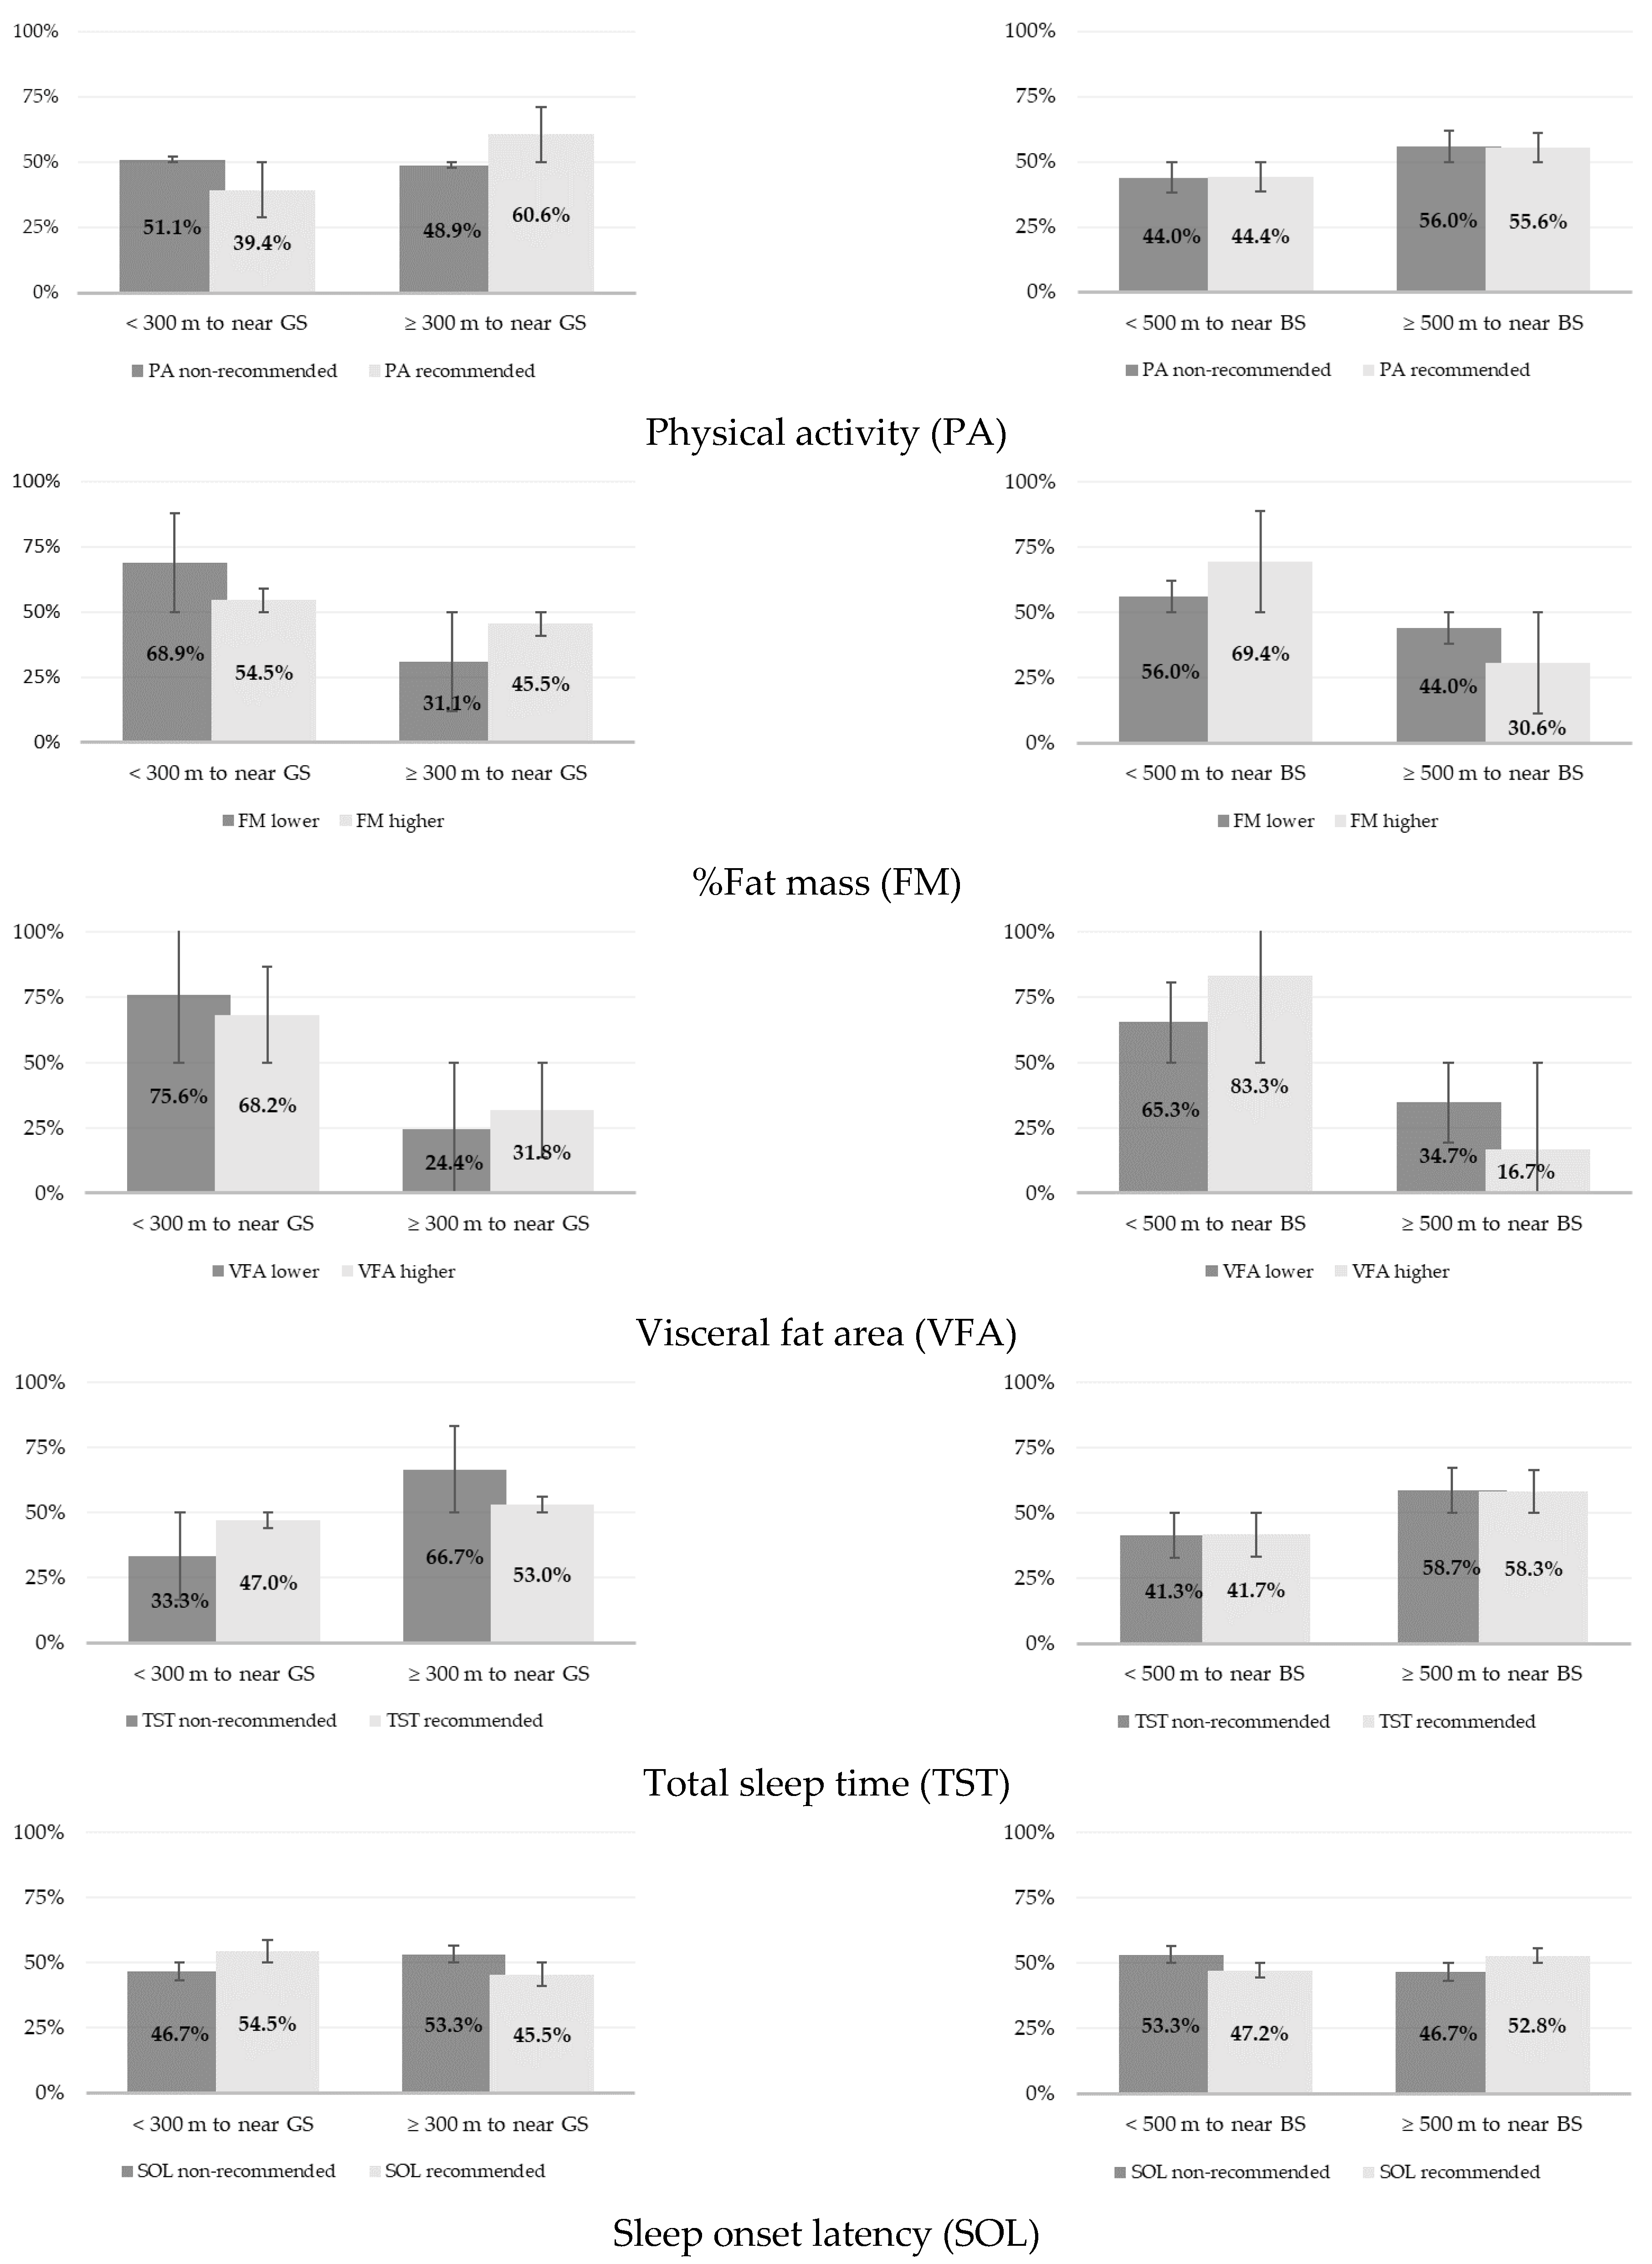
3. Results
4. Discussion
5. Conclusions
Supplementary Materials
Author Contributions
Funding
Institutional Review Board Statement
Informed Consent Statement
Data Availability Statement
Acknowledgments
Conflicts of Interest
References
- Mussida, C.; Patimo, R. Women’s family care responsibilities, employment and health: A tale of two countries. J. Fam. Econ. Issues 2021, 42, 489–507. [Google Scholar] [CrossRef]
- Eurostat. How Many Healthy Life Years for EU Men and Women? Available online: https://ec.europa.eu/eurostat/web/products-eurostat-news/-/ddn-20220613-1 (accessed on 20 December 2022).
- Romana, G.; Kislaya, I.; Salvador, M.; Gonçalves, S.; Nunes, B.; Dias, C. Multimorbidity in Portugal: Results from the first national health examination survey. Acta Med. Port. 2019, 32, 30–37. [Google Scholar] [CrossRef] [Green Version]
- Hazra, N.; Dregan, A.; Jackson, S.; Gulliford, M. Differences in health at age 100 according to sex: Population-based cohort study of centenarians using electronic health records. J. Am. Geriatr. Soc. 2015, 63, 1331–1337. [Google Scholar] [CrossRef] [PubMed] [Green Version]
- Rodrigues, A.; Gregório, M.; Sousa, R.; Dias, S.; Santos, M.; Mendes, J.; Coelho, P.; Branco, J.; Canhão, H. Challenges of ageing in Portugal: Data from the EpiDoC cohort. Acta Med. Port. 2018, 31, 80–93. [Google Scholar] [CrossRef] [PubMed] [Green Version]
- 978-92-76-56432-4 EU; Special Eurobarometer 525 Sport and Physical Activity. European Union—Diretorate-General for Education, Youth, Sport and Culture and Co-Ordinated by the Directorate-General for Communication: Brussels, Belgium, 2022.
- Rossi, E.; Diniz, T.; Buonani, C.; Neves, L.; Fortaleza, A.; Christofaro, D.; Freitas Junior, I. Physical activity level behavior according to the day of the week in postmenopausal women. Rev. Andal. Med. Deport. 2017, 10, 64–68. [Google Scholar] [CrossRef] [Green Version]
- Pengo, M.; Won, C.; Bourjeily, G. Sleep in women across the life span. Chest 2018, 154, 196–206. [Google Scholar] [CrossRef] [PubMed]
- Jonasdottir, S.; Minor, K.; Lehmann, S. Gender differences in nighttime sleep patterns and variability across the adult lifespan: A global-scale wearables study. Sleep 2020, 44, zsaa169. [Google Scholar] [CrossRef]
- Pusalavidyasagar, S.; Abbasi, A.; Cervenka, T.; Irfan, M. Sleep in women across the stages of life. Clin. Pulm. Med. 2018, 25, 89–99. [Google Scholar] [CrossRef]
- Foster, R. Sleep, circadian rhythms and health. Interface Focus 2020, 10, 20190098. [Google Scholar] [CrossRef] [Green Version]
- Watson, N.; Badr, M.; Belenky, G.; Bliwise, D.; Buxton, O.; Buysse, D.; Dinges, D.; Gangwisch, J.; Grandner, M.; Kushida, C.; et al. Joint Consensus Statement of the American Academy of Sleep Medicine and Sleep Research Society on the Recommended Amount of Sleep for a Healthy Adult: Methodology and Discussion. Sleep 2015, 38, 1161–1183. [Google Scholar] [CrossRef]
- Dzhambov, A. Residential green and blue space associated with better mental health: A pilot follow-up study in university students. Arh. Hig. Rada Toksikol. 2018, 69, 340–349. [Google Scholar] [CrossRef] [PubMed] [Green Version]
- Britton, E.; Kindermann, G.; Domegan, C.; Carlin, C. Blue care: A systematic review of blue space interventions for health and wellbeing. Health Promot. Int. 2020, 35, 50–69. [Google Scholar] [CrossRef] [PubMed] [Green Version]
- Karastergiou, K.; Smith, S.; Greenberg, A.; Fried, S. Sex differences in human adipose tissues—The biology of pear shape. Biol. Sex Differ. 2012, 3, 13. [Google Scholar] [CrossRef] [PubMed] [Green Version]
- Palmer, B.; Clegg, D. The sexual dimorphism of obesity. Mol. Cell. Endocrinol. 2015, 402, 113–119. [Google Scholar] [CrossRef] [Green Version]
- Bissoli, L.; Fantin, F.; Francesco, V.; Fontana, G.; Zivelonghi, A.; Zoico, E.; Zamboni, M.; Rossi, A.; Micciolo, R.; Bosello, O. Longitudinal body composition changes in old men and women: Interrelationships with worsening disability. J. Gerontol. Ser. A Biol. Sci. Med. Sci. 2007, 62, 1375–1381. [Google Scholar]
- Ambikairajah, A.; Walsh, E.; Tabatabaei-Jafari, H.; Cherbuin, N. Fat mass changes during menopause: A meta-analysis. Am. J. Obstet. Gynecol. 2019, 221, 393–409. [Google Scholar] [CrossRef]
- Shulman, G. Ectopic fat in insulin resistance, dyslipidemia, and cardiometabolic disease. N. Engl. J. Med. 2014, 371, 1131–1141. [Google Scholar] [CrossRef]
- White, M.; Alcock, I.; Grellier, J.; Wheeler, B.; Hartig, T.; Warber, S.; Bone, A.; Depledge, M.; Fleming, L. Spending at least 120 minutes a week in nature is associated with good health and wellbeing. Sci. Rep. 2019, 9, 7730. [Google Scholar] [CrossRef] [Green Version]
- Jimenez, M.; DeVille, N.; Elliott, E.; Schiff, J.; Wilt, G.; Hart, J.; James, P. Associations between nature exposure and health: A review of the evidence. Int. J. Environ. Res. Public Health 2021, 18, 4790. [Google Scholar] [CrossRef]
- Taylor, L.; Hochuli, D. Defining greenspace: Multiple uses across multiple disciplines. Landsc. Urban. Plan. 2017, 158, 25–38. [Google Scholar] [CrossRef] [Green Version]
- Markevych, I.; Schoierer, J.; Hartig, T.; Chudnovsky, A.; Hystad, P.; Dzhambov, A.; de Vries, S.; Triguero-Mas, M.; Brauer, M.; Nieuwenhuijsen, M.; et al. Exploring pathways linking greenspace to health: Theoretical and methodological guidance. Environ. Res. 2017, 158, 301–317. [Google Scholar] [CrossRef]
- Hooper, P.; Foster, S.; Edwards, N.; Turrell, G.; Burton, N.; Giles-Corti, B.; Brown, W. Positive HABITATS for physical activity: Examining use of parks and its contribution to physical activity levels in mid-to older-aged adults. Health Place 2020, 63, 102308. [Google Scholar] [CrossRef]
- Zhang, J.; Yu, Z.; Zhao, B.; Sun, R.; Vejre, H. Links between green space and public health: A bibliometric review of global research trends and future prospects from 1901 to 2019. Environ. Res. Lett. 2020, 15, 063001. [Google Scholar] [CrossRef]
- Gascon, M.; Zijlema, W.; Vert, C.; White, M.; Nieuwenhuijsen, M. Outdoor blue spaces, human health and well-being: A systematic review of quantitative studies. Int. J. Hyg. Environ. Health 2017, 220, 1207–1221. [Google Scholar] [CrossRef] [PubMed]
- Astell-Burt, T.; Feng, X.; Kolt, G. Does access to neighbourhood green space promote a healthy duration of sleep? Novel findings from a cross-sectional study of 259 319 Australians. BMJ Open 2013, 3, e003094. [Google Scholar] [CrossRef] [PubMed] [Green Version]
- Lovell, R.; Wheeler, B.; Higgins, S.; Irvine, K.; Depledge, M. A systematic review of the health and well-being benefits of biodiverse environments. J. Toxicol. Environ. Health Part B 2014, 17, 1–20. [Google Scholar] [CrossRef] [Green Version]
- Fuller, R.; Irvine, K.; Devine-Wright, P.; Warren, P.; Gaston, K. Psychological benefits of greenspace increase with biodiversity. Biol. Lett. 2007, 3, 390–394. [Google Scholar] [CrossRef] [PubMed] [Green Version]
- Johansson, M.; Gyllin, M.; Witzell, J.; Küller, M. Does biological quality matter? Direct and reflected appraisal of biodiversity in temperate deciduous broad-leaf forest. Urban Urban Green 2014, 13, 28–37. [Google Scholar] [CrossRef]
- Yang, L.; Ho, J.; Wong, F.; Chang, K.; Chan, K.; Wong, M.; Ho, H.; Yuen, J.; Huang, J.; Siu, J. Neighbourhood green space, perceived stress and sleep quality in an urban population. Urban Urban Green 2020, 54, 126763. [Google Scholar] [CrossRef]
- Johnson, B.S.; Malecki, K.M.; Peppard, P.E.; Beyer, K.M.M. Exposure to neighborhood green space and sleep: Evidence from the Survey of the Health of Wisconsin. Sleep Health 2018, 4, 413–419. [Google Scholar] [CrossRef] [PubMed]
- McMorris, O.; Villeneuve, P.J.; Su, J.; Jerrett, M. Urban greenness and physical activity in a national survey of Canadians. Environ. Res. 2015, 137, 94–100. [Google Scholar] [CrossRef] [PubMed]
- Teixeira, A.; Gabriel, R.; Quaresma, L.; Alencoão, A.; Martinho, J.; Moreira, H. Obesity and natural spaces in adults and older people: A systematic review. J. Phys. Act. Health 2021, 18, 714–727. [Google Scholar] [CrossRef] [PubMed]
- Völker, S.; Kistemann, T. The impact of blue space on human health and well-being—Salutogenetic health effects of inland surface waters: A review. Int. J. Hyg. Environ. Health 2011, 214, 449–460. [Google Scholar] [CrossRef] [PubMed]
- Wu, J.; Xu, Z.; Jin, Y.; Chai, Y.; Newell, J.; Ta, N. Gender disparities in exposure to green space: An empirical study of suburban Beijing. Landsc. Urban Plan. 2022, 222, 104381. [Google Scholar] [CrossRef]
- Samulowitz, A.; Gremyr, I.; Eriksson, E.; Hensing, G. “Brave Men” and “Emotional Women”: A theory-guided literature review on gender bias in health care and gendered norms towards patients with chronic pain. Pain Res. Manag. 2018, 2018, 6358624. [Google Scholar] [CrossRef] [PubMed]
- Li, X.; Liu, L.; Zhang, Z.; Zhang, W.; Liu, D.; Feng, Y. Gender disparity in perceived urban green space and subjective health and well-being in China: Implications for sustainable urban greening. Sustainability 2020, 12, 10538. [Google Scholar] [CrossRef]
- Hologic, I. The Hologic Global Women’s Health Index: Pathways to a Healthy Future for Women; HOLOGIC: Marlborough, MA, USA, 2022. [Google Scholar]
- Braçe, O.; Garrido-Cumbrera, M.; Correa-Fernández, J. Gender differences in the perceptions of green spaces characteristics. Soc. Sci. Q. 2021, 102, 2640–2648. [Google Scholar] [CrossRef]
- Ghani, F.; Rachele, J.; Loh, V.; Washington, S.; Turrell, G. Do differences in social environments explain gender differences in recreational walking across neighbourhoods? Int. J. Environ. Res. Public Health 2019, 16, 1980. [Google Scholar] [CrossRef] [Green Version]
- Loarne-Lemaire, S.; Bertrand, G.; Razgallah, M.; Maalaoui, A.; Kallmuenzer, A. Women in innovation processes as a solution to climate change: A systematic literature review and an agenda for future research. Technol. Forecast. Soc. Chang. 2021, 164, 120440. [Google Scholar] [CrossRef]
- Sillman, D.; Rigolon, A.; Browning, M.; Yoon, H.; McAnirlin, O. Do sex and gender modify the association between green space and physical health? A systematic review. Environ. Res. 2022, 209, 112869. [Google Scholar] [CrossRef]
- Núñez, M.; Suzman, L.; Maneja, R.; Bach, A.; Marquet, O.; Anguelovski, I.; Knobel, P. Gender and sex differences in urban greenness’ mental health benefits: A systematic review. Health Place 2022, 76, 102864. [Google Scholar] [CrossRef] [PubMed]
- Peel, M.; Finlayson, B.; McMahon, T. Updated world map of the Köppen-Geiger climate classification. Hydrol. Earth Syst. Sci. 2007, 11, 1633–1644. [Google Scholar] [CrossRef] [Green Version]
- Sługocki, Ł.; Czerniawski, R.; Kowalska-Góralska, M.; Senze, M.; Reis, A.; Carrola, J.; Teixeira, C. The impact of land use transformations on zooplankton communities in a small mountain river (The corgo river, northern Portugal). Int. J. Environ. Res. Public Health 2019, 16, 20. [Google Scholar] [CrossRef] [PubMed] [Green Version]
- Cunha, N.; Magalhães, M. Methodology for mapping the national ecological network to mainland Portugal: A planning tool towards a green infrastructure. Ecol. Indic. 2019, 104, 802–818. [Google Scholar] [CrossRef]
- Jansen, F.; Ettema, D.; Kamphuis, C.; Pierik, F.; Dijst, M. How do type and size of natural environments relate to physical activity behavior? Health Place 2017, 46, 73–81. [Google Scholar] [CrossRef]
- Muller, G.; Harhoff, R.; Rahe, C.; Berger, K. Inner-city green space and its association with body mass index and prevalent type 2 diabetes: A cross-sectional study in an urban german city. BMJ Open 2018, 8, e019062. [Google Scholar] [CrossRef] [Green Version]
- Akpinar, A. Assessing the associations between types of green space, physical activity, and health indicators using GIS and participatory survey. ISPRS Ann. Photogramm. Remote Sens. Spat. Inf. Sci. 2017, 4, 47–54. [Google Scholar] [CrossRef] [Green Version]
- Grellier, J.; White, M.P.; Albin, M.; Bell, S.; Elliott, L.R.; Gascón, M.; Gualdi, S.; Mancini, L.; Nieuwenhuijsen, M.J.; Sarigiannis, D.A.; et al. BlueHealth: A study programme protocol for mapping and quantifying the potential benefits to public health and well-being from Europe’s blue spaces. BMJ Open 2017, 7, e016188. [Google Scholar] [CrossRef] [Green Version]
- Nations, U. World Urbanization Prospects 2018: Highlights; United Nations: Department of Economic and Social Affairs Population Division: New York, NY, USA, 2019.
- Schindler, M.; Le Texier, M.; Caruso, G. How far do people travel to use urban green space? A comparison of three European cities. Appl. Geogr. 2022, 141, 102673. [Google Scholar] [CrossRef]
- Klompmaker, J.; Hoek, G.; Bloemsma, L.; Gehring, U.; Strak, M.; Wijga, A.; van den Brink, C.; Brunekreef, B.; Lebret, E.; Janssen, N. Green space definition affects associations of green space with overweight and physical activity. Environ. Res. 2018, 160, 531–540. [Google Scholar] [CrossRef]
- O’Callaghan-Gordo, C.; Espinosa, A.; Valentin, A.; Tonne, C.; Pérez-Gómez, B.; Castaño-Vinyals, G.; Dierssen-Sotos, T.; Moreno-Iribas, C.; de Sanjose, S.; Fernandez-Tardón, G.; et al. Green spaces, excess weight and obesity in Spain. Int. J. Hyg. Environ. Health 2020, 223, 45–55. [Google Scholar] [CrossRef] [PubMed]
- Toftager, M.; Ekholm, O.; Schipperijn, J.; Stigsdotter, U.; Bentsen, P.; Gronbaek, M.; Randrup, T.; Kamper-Jorgensen, F. Distance to green space and physical activity: A danish national representative survey. J. Phys. Act. Health 2011, 8, 741–749. [Google Scholar] [CrossRef] [PubMed] [Green Version]
- Chumlea, W.; Sun, S. Bioeletctrical impedance analysis. In Human Body Composition; Heymsfield, S., Lohman, T., Wang, Z., Going, S., Eds.; Human Kinetics: Champaign, IL, USA, 2005; pp. 78–88. [Google Scholar]
- Biospace. InBody 720 the Precision Body Composition Analyser: User’s Manual. Available online: https://www.bodyanalyse.no/gammel/images/stories/inbody/dokumenter/InBody720_User_manual.pdf (accessed on 12 November 2022).
- Cruz-Jentoft, A.; Bahat, G.; Bauer, J.; Boirie, Y.; Bruyère, O.; Cederholm, T.; Cooper, C.; Landi, F.; Rolland, Y.; Sayer, A.; et al. Sarcopenia: Revised European consensus on definition and diagnosis. Age Ageing 2019, 48, 16–31. [Google Scholar] [CrossRef] [Green Version]
- Després, J.; Lamarche, B. Effects of diet and physical activity on adiposity and body fat distribution: Implications for the prevention of cardiovascular disease. Nutr. Res. Rev. 1993, 6, 137–159. [Google Scholar] [CrossRef] [PubMed]
- Obesity Algorithm. Available online: https://obesitymedicine.org/obesity-algorithm/ (accessed on 20 December 2022).
- Wang, H.; Hai, S.; Cao, L.; Zhou, J.; Liu, P.; Dong, B. Estimation of prevalence of sarcopenia by using a new bioelectrical impedance analysis in Chinese community-dwelling elderly people. BMC Geriatr. 2016, 16, 216. [Google Scholar] [CrossRef] [Green Version]
- Miyatake, N.; Tanakai, A.; Eguchi, M.; Miyachi, M.; Tabata, I.; Numata, T. Reference data of multi frequencies bioelectric impedance method in Japanese. J. Anti Aging Med. 2009, 6, 10–14. [Google Scholar] [CrossRef] [Green Version]
- Ling, C.; Craen, A.; Slagboom, P.; Gunn, D.; Stokkel, M.; Westendorp, R.; Maier, A. Accuracy of direct segmental multi-frequency bioimpedance analysis in the assessment of total body and segmental body composition in middle-aged adult population. Clin. Nutr. 2011, 30, 610–615. [Google Scholar] [CrossRef] [Green Version]
- Fang, W.; Yang, J.; Lin, C.; Hsiao, P.; Tu, M.; Chen, C.; Tsai, D.; Su, W.; Huang, G.; Chang, H.; et al. Accuracy augmentation of body composition measurement by bioelectrical impedance analyzer in elderly population. Medicine 2020, 99, e19103. [Google Scholar] [CrossRef]
- Alkahtani, S. A cross-sectional study on sarcopenia using different methods: Reference values for healthy Saudi young men. BMC Musculoskelet. Disord. 2017, 18, 119. [Google Scholar] [CrossRef] [Green Version]
- Ogawa, H.; Fujitani, K.; Tsujinaka, T.; Imanishi, K.; Shirakata, H.; Kantani, A.; Hirao, M.; Kurokawa, Y.; Utsumi, S. InBody 720 as a new method of evaluating visceral obesity. Hepatogastroenterology 2011, 58, 42–44. [Google Scholar]
- Gao, B.; Liu, Y.; Ding, C.; Liu, S.; Chen, X.; Bian, X. Comparison of visceral fat area measured by CT and bioelectrical impedance analysis in Chinese patients with gastric cancer: A cross-sectional study. BMJ Open 2020, 10, e036335. [Google Scholar] [CrossRef] [PubMed]
- Choi, L.; Ward, S.; Schnelle, J.; Buchowski, M. Assessment of wear/nonwear time classification algorithms for triaxial accelerometer. Med. Sci. Sport. Exerc. 2012, 44, 2009–2016. [Google Scholar] [CrossRef] [PubMed] [Green Version]
- Rhudy, M.; Dreisbach, S.; Moran, M.; Ruggiero, M.; Veerabhadrappa, P. Cut points of the Actigraph GT9X for moderate and vigorous intensity physical activity at four different wear locations. J. Sport. Sci. 2019, 38, 503–510. [Google Scholar] [CrossRef] [PubMed]
- Bull, F.; Al-Ansari, S.; Biddle, S.; Borodulin, K.; Buman, M.; Cardon, G.; Carty, C.; Chaput, J.; Chastin, S.; Chou, R.; et al. World Health Organization 2020 guidelines on physical activity and sedentary behaviour. Br. J. Sport. Med. 2020, 54, 1451–1462. [Google Scholar] [CrossRef]
- Cole, R.; Kripke, D.; Gruen, W.; Mullaney, D.; Gillin, J. Automatic sleep/wake identification from wrist activity. Sleep 1992, 15, 461–469. [Google Scholar] [CrossRef] [PubMed]
- Carskadon, M.; Dement, W. Normal Human Sleep: An Overview. In Principles and Practice of Sleep Medicine, 2nd ed.; Kryger, M., Roth, T., Dement, W., Eds.; WB Saunders: Philadelphia, PA, USA, 1994; pp. 18–25. [Google Scholar]
- Lacks, P.; Morin, C.M. Recent advances in the assessment and treatment of insomnia. J. Consult. Clin. Psychol. 1992, 60, 586–594. [Google Scholar] [CrossRef]
- Li, A.; Chen, S.; Quan, S.; Silva, G.; Ackerman, C.; Powers, L.; Roveda, J.; Perfect, M. Sleep patterns and sleep deprivation recorded by actigraphy in 4th-grade and 5th-grade students. Sleep Med. 2020, 67, 191–199. [Google Scholar] [CrossRef]
- Loewen, A.; Siemens, A.; Hanly, P. Sleep disruption in patients with sleep apnea and end-stage renal disease. J. Clin. Sleep Med. 2009, 5, 324–329. [Google Scholar] [CrossRef] [Green Version]
- Swanson, L.; Hood, M.; Hall, M.; Avis, N.; Joffe, H.; Colvin, A.; Ruppert, K.; Kravitz, H.; Neal-Perry, G.; Derby, C.; et al. Sleep timing, sleep regularity, and psychological health in early late life women: Findings from the Study of Women’s Health Across the Nation (SWAN). Sleep Health 2022, in press. [Google Scholar] [CrossRef]
- Furihata, R.; Hall, M.; Stone, K.; Ancoli-Israel, S.; Smagula, S.; Cauley, J.; Kaneita, Y.; Uchiyama, M.; Buysse, D. An aggregate measure of sleep health is associated with prevalent and incident clinically significant depression symptoms among community-dwelling older women. Sleep 2017, 40, zsw075. [Google Scholar] [CrossRef] [Green Version]
- Roenneberg, T.; Kuehnle, T.; Juda, M.; Kantermann, T.; Allebrandt, K.; Gordijn, M.; Merrow, M. Epidemiology of the human circadian clock. Sleep Med. Rev. 2007, 11, 429–438. [Google Scholar] [CrossRef] [PubMed] [Green Version]
- SPSS. SPSS Categories® 14.0; Prentice Hall: Chicago, IL, USA, 2005. [Google Scholar]
- Watson, N.; Badr, M.; Belenky, G.; Bliwise, D.; Buxton, O.; Buysse, D.; Dinges, D.; Gangwisch, J.; Grandner, M.; Kushida, C.; et al. Recommended amount of sleep for a healthy adult: A joint consensus statement of the American Academy of Sleep Medicine and Sleep Research Society. Sleep 2015, 38, 843–844. [Google Scholar] [CrossRef] [PubMed]
- Mezick, E.; Matthews, K.; Hall, M.; Kamarck, T.; Buysse, D.; Owens, J.; Reis, S. Intra-individual variability in sleep duration and fragmentation: Associations with stress. Psychoneuroendocrinology 2009, 34, 1346–1354. [Google Scholar] [CrossRef] [Green Version]
- Sosso, F.; Holmes, S.; Weinstein, A. Influence of socioeconomic status on objective sleep measurement: A systematic review and meta-analysis of actigraphy studies. Sleep Health 2021, 7, 417–428. [Google Scholar] [CrossRef]
- Exelmans, L.; Van den Bulck, J. Bedtime mobile phone use and sleep in adults. Soc. Sci. Med. 2016, 148, 93–101. [Google Scholar] [CrossRef] [PubMed]
- Pfeifer, C. An empirical note on commuting distance and sleep during workweek and weekend. Bull. Econ. Res. 2018, 70, 97–102. [Google Scholar] [CrossRef]
- Su, J.; Dadvand, P.; Nieuwenhuijsen, M.; Bartoll, X.; Jerrett, M. Associations of green space metrics with health and behavior outcomes at different buffer sizes and remote sensing sensor resolutions. Environ. Int. 2019, 126, 162–170. [Google Scholar] [CrossRef]
- Vîlcea, C.; Șoșea, C. A GIS-based analysis of the urban green space accessibility in Craiova city, Romania. Geogr. Tidsskr. Den. 2020, 120, 19–34. [Google Scholar] [CrossRef]
- Commission, E. Towards a Local Sustainability Profile: European Common Indicators; Office for Official Publications of the European Communities: Luxembourg, 2001. [Google Scholar]
- Annerstedt, M.; Östergren, P.; Björk, J.; Grahn, P.; Skärbäck, E.; Währborg, P. Green qualities in the neighbourhood and mental health—Results from a longitudinal cohort study in Southern Sweden. BMC Public Health 2012, 12, 337. [Google Scholar] [CrossRef] [Green Version]
- Konijnendijk, C. Evidence-based guidelines for greener, healthier, more resilient neighbourhoods: Introducing the 3–30–300 rule. J. For. Res. 2022, 1–10. [Google Scholar] [CrossRef]
- Browning, M.; Lee, K. Within what distance does “greenness” best predict physical health? A systematic review of articles with gis buffer analyses across the lifespan. Int. J. Environ. Res. Public Health 2017, 14, 675. [Google Scholar] [CrossRef] [Green Version]
- Giles-Corti, B.; Broomhall, M.; Knuiman, M.; Collins, C.; Douglas, K.; Ng, K.; Lange, A.; Donovan, R. Increasing walking: How important is distance to, attractiveness, and size of public open space? Am. J. Prev. Med. 2005, 28, 169–176. [Google Scholar] [CrossRef] [PubMed]
- Witten, K.; Hiscock, R.; Pearce, J.; Blakely, T. Neighbourhood access to open spaces and the physical activity of residents: A national study. Prev. Med. 2008, 47, 299–303. [Google Scholar] [CrossRef] [PubMed]
- Kaczynski, A.; Potwarka, L.; Saelens, B. Association of park size, distance, and features with physical activity in neighborhood parks. Am. J. Public Health 2008, 98, 1451–1456. [Google Scholar] [CrossRef]
- Coombes, E.; Jones, A.; Hillsdon, M. The relationship of physical activity and overweight to objectively measured green space accessibility and use. Soc. Sci. Med. 2010, 70, 816–822. [Google Scholar] [CrossRef] [PubMed] [Green Version]
- Foster, C.; Hillsdon, M.; Jones, A.; Grundy, C.; Wilkinson, P.; White, M.; Sheehan, B.; Wareham, N.; Thorogood, M. Objective measures of the environment and physical activity--results of the environment and physical activity study in English adults. J. Phys. Act. Health 2009, 6, S70–S80. [Google Scholar] [CrossRef] [PubMed]
- Schipperijn, J.; Bentsen, P.; Troelsen, J.; Toftager, M.; Stigsdotter, U. Associations between physical activity and characteristics of urban green space. Urban Urban Green 2013, 12, 109–116. [Google Scholar] [CrossRef]
- Boulton, C.; Dedekorkut-Howes, A.; Byrne, J. Factors shaping urban greenspace provision: A systematic review of the literature. Landsc. Urban Plan 2018, 178, 82–101. [Google Scholar] [CrossRef]
- Le Texier, M.; Schiel, K.; Caruso, G. The provision of urban green space and its accessibility: Spatial data effects in Brussels. PLoS ONE 2018, 13, e0204684. [Google Scholar] [CrossRef]
- Russell, R.; Guerry, A.; Balvanera, P.; Gould, R.; Basurto, X.; Chan, K.; Klain, S.; Levine, J.; Tam, J. Humans and nature: How knowing and experiencing nature affect well-being. Annu. Rev. Environ. Resour. 2013, 38, 473–502. [Google Scholar] [CrossRef]
- Basu, S.; Nagendra, H. Perceptions of park visitors on access to urban parks and benefits of green spaces. Urban Urban Green 2021, 57, 126959. [Google Scholar] [CrossRef]
- Elliott, L.; White, M.; Grellier, J.; Rees, S.; Waters, R.; Fleming, L. Recreational visits to marine and coastal environments in England: Where, what, who, why, and when? Mar. Policy 2018, 97, 305–314. [Google Scholar] [CrossRef] [Green Version]
- Sarkar, C. Residential greenness and adiposity: Findings from the UK Biobank. Environ. Int. 2017, 106, 1–10. [Google Scholar] [CrossRef] [PubMed] [Green Version]
- Mena, C.; Fuentes, E.; Ormazabal, Y.; Palomo-Velez, G.; Palomo, I. Role of access to parks and markets with anthropometric measurements, biological markers, and a healthy lifestyle. Int. J. Environ. Health Res. 2015, 25, 373–383. [Google Scholar] [CrossRef]
- Halonen, J.; Kivimaki, M.; Pentti, J.; Stenholm, S.; Kawachi, I.; Subramanian, S.; Vahtera, J. Green and blue areas as predictors of overweight and obesity in an 8-year follow-up study. Obesity 2014, 22, 1910–1917. [Google Scholar] [CrossRef]
- Jimenez, M.; Wellenius, G.; James, P.; Subramanian, S.; Buka, S.; Eaton, C.; Gilman, S.; Loucks, E. Associations of types of green space across the life-course with blood pressure and body mass index. Environ. Res. 2020, 185, 109411. [Google Scholar] [CrossRef]
- Michael, Y.; Nagel, C.; Gold, R.; Hillier, T. Does change in the neighborhood environment prevent obesity in older women? Soc. Sci. Med. 2014, 102, 129–137. [Google Scholar] [CrossRef] [Green Version]
- Tuomela, J.; Kaprio, J.; Sipilä, P.N.; Silventoinen, K.; Wang, X.; Ollikainen, M.; Piirtola, M. Accuracy of self-reported anthropometric measures—Findings from the Finnish Twin Study. Obes. Res. Clin. Pract. 2019, 13, 522–528. [Google Scholar] [CrossRef]
- Pretty, J.; Peacock, J.; Sellens, M.; Griffin, M. The mental and physical health outcomes of green exercise. Int. J. Environ. Health Res. 2005, 15, 319–337. [Google Scholar] [CrossRef]
- Peacock, J.; Hine, R.; Pretty, J. Got the Blues, Then Find Some Greenspace: The Mental Health Benefits of Green Exercise Activities and Green Care; University of Essex: Colchester, UK, 2007. [Google Scholar]
- Townsend, M.; Weerasuriya, R. Beyond Blue to Green: The Benefits of Contact with Nature for Mental Health and Wellbeing; Beyond Blue Limited: Melbourne, Australia, 2010. [Google Scholar]
- West, S.; Shores, K.; Mudd, L. Association of available parkland, physical activity, and overweight in America’s largest cities. J. Public Health Manag. Pract. 2012, 18, 423–430. [Google Scholar] [CrossRef]
- BHS. The health benefits of horse riding in the UK; The British Horse Society: Warwickshire, UK, 2013. [Google Scholar]
- Handy, S.; Van Wee, B.; Kroesen, M. Promoting Cycling for Transport: Research Needs and Challenges. Transp. Rev. 2014, 34, 4–24. [Google Scholar] [CrossRef]
- Wolf, I.; Wohlfart, T. Walking, hiking and running in parks: A multidisciplinary assessment of health and well-being benefits. Landsc. Urban Plan. 2014, 130, 89–103. [Google Scholar] [CrossRef]
- Ghimire, R.; Ferreira, S.; Green, G.; Poudyal, N.; Cordell, H.; Thapa, J. Green space and adult obesity in the United States. Ecol. Econ. 2017, 136, 201–212. [Google Scholar] [CrossRef]
- Hunter, R.; Christian, H.; Veitch, J.; Astell-Burt, T.; Hipp, J.A.; Schipperijn, J. The impact of interventions to promote physical activity in urban green space: A systematic review and recommendations for future research. Soc. Sci. Med. 2015, 124, 246–256. [Google Scholar] [CrossRef] [PubMed] [Green Version]
- Li, Q.; Otsuka, T.; Kobayashi, M.; Wakayama, Y.; Inagaki, H.; Katsumata, M.; Hirata, Y.; Li, Y.; Hirata, K.; Shimizu, T.; et al. Acute effects of walking in forest environments on cardiovascular and metabolic parameters. Eur. J. Appl. Physiol. 2011, 111, 2845–2853. [Google Scholar] [CrossRef]
- Grigsby-Toussaint, D.; Turi, K.; Krupa, M.; Williams, N.; Pandi-Perumal, S.; Jean-Louis, G. Sleep insufficiency and the natural environment: Results from the US behavioral risk factor surveillance system survey. Prev. Med. 2015, 78, 78–84. [Google Scholar] [CrossRef] [Green Version]
- Triguero-Mas, M.; Donaire-Gonzalez, D.; Seto, E.; Valentin, A.; Smith, G.; Martinez, D.; Carrasco-Turigas, G.; Masterson, D.; van den Berg, M.; Ambros, A.; et al. Living close to natural outdoor environments in four European cities: Adults’ contact with the environments and physical activity. Int. J. Environ. Res. Public Health 2017, 14, 1162. [Google Scholar] [CrossRef] [Green Version]
- Shin, J.; Parab, K.; An, R.; Grigsby-Toussaint, D. Greenspace exposure and sleep: A systematic review. Environ. Res. 2020, 182, 109081. [Google Scholar] [CrossRef] [PubMed]
- Topalidis, P.; Florea, C.; Eigl, E.; Kurapov, A.; Leon, C.; Schabus, M. Evaluation of a low-cost commercial Actigraph and its potential use in detecting cultural variations in physical activity and sleep. Sensors 2021, 21, 3774. [Google Scholar] [CrossRef]
- James, P.; Banay, R.; Hart, J.E.; Laden, F. A review of the health benefits of greenness. Curr. Epidemiol. Rep. 2015, 2, 131–142. [Google Scholar] [CrossRef] [Green Version]
- Kondo, M.; Fluehr, J.; McKeon, T.; Branas, C. Urban green space and its impact on human health. Int. J. Environ. Res. Public Health 2018, 15, 445. [Google Scholar] [CrossRef] [Green Version]
- Halperin, D. Environmental noise and sleep disturbances: A threat to health? Sleep Sci. 2014, 7, 209–212. [Google Scholar] [CrossRef] [Green Version]
- Van Rossum, E. Obesity and cortisol: New perspectives on an old theme. Obesity 2017, 25, 500–501. [Google Scholar] [CrossRef]
- Van der Valk, E.; Savas, M.; Van Rossum, E. Stress and obesity: Are there more susceptible individuals? Curr. Obes. Rep. 2018, 7, 193–203. [Google Scholar] [CrossRef] [PubMed] [Green Version]
- Li, J.; Vitiello, M.; Gooneratne, N. Sleep in normal aging. Sleep Med. Clin. 2018, 13, 1–11. [Google Scholar] [CrossRef]
- Lavoie, C.; Zeidler, M.; Martin, J. Sleep and aging. Sleep Sci. Pract. 2018, 2, 3. [Google Scholar] [CrossRef] [Green Version]
- Lee, J.; Han, Y.; Cho, H.; Kim, M. Sleep disorders and menopause. J. Menopausal Med. 2019, 25, 83–87. [Google Scholar] [CrossRef] [PubMed]
- Gómez-Santos, C.; Saura, C.; Lucas, J.; Castell, P.; Madrid, J.; Garaulet, M. Menopause status is associated with circadian- and sleep-related alterations. Menopause 2016, 23, 682–690. [Google Scholar] [CrossRef]
- Baker, F.; Zambotti, M.; Colrain, I.; Bei, B. Sleep problems during the menopausal transition: Prevalence, impact, and management challenges. Nat. Sci. Sleep 2018, 10, 73–95. [Google Scholar] [CrossRef] [PubMed] [Green Version]
- Karasek, M. Melatonin, human aging, and age-related diseases. Exp. Gerontol. 2004, 39, 1723–1729. [Google Scholar] [CrossRef] [PubMed]
- Wurtman, R. Age-related decreases in melatonin secretion--clinical consequences. J. Clin. Endocrinol. Metab. 2000, 85, 2135–2136. [Google Scholar] [CrossRef] [PubMed]
- Liu, R.; Lian, Z.; Lan, L.; Qian, X.; Chen, K.; Hou, K.; Li, X. Effects of negative oxygen ions on sleep quality. Procedia Eng. 2017, 205, 2980–2986. [Google Scholar] [CrossRef]
- Georgiou, M.; Morison, G.; Smith, N.; Tieges, Z.; Chastin, S. Mechanisms of Impact of blue spaces on human health: A systematic literature review and meta-analysis. Int. J. Environ. Res. Public Health 2021, 18, 2486. [Google Scholar] [CrossRef] [PubMed]
- Goldenberg, R.; Kalantari, Z.; Destouni, G. Increased access to nearby green–blue areas associated with greater metropolitan population well-being. Land Degrad. Dev. 2018, 29, 3607–3616. [Google Scholar] [CrossRef] [Green Version]
- Csomós, G.; Farkas, J.; Kovács, Z. Access to urban green spaces and environmental inequality in post-socialist cities. Hung. Geogr. Bull. 2020, 69, 191–207. [Google Scholar] [CrossRef]
- Vanhöfen, J.; Schöffski, N.; Härtel, T.; Randler, C. Are lay people able to estimate breeding bird diversity? Animals 2022, 12, 3095. [Google Scholar] [CrossRef]
- Forman, R. Urban Regions: Ecology and Planning beyond the City; Cambridge University Press: Cambridge, UK, 2008; Volume 408. [Google Scholar]
- Barton, J.; Pretty, J. What is the best dose of nature and green exercise for improving mental health? A multi-study analysis. Environ. Sci. Technol. 2010, 44, 3947–3955. [Google Scholar] [CrossRef]
- Mytton, O.; Townsend, N.; Rutter, H.; Foster, C. Green space and physical activity: An observational study using health survey for England data. Health Place 2012, 18, 1034–1041. [Google Scholar] [CrossRef] [Green Version]
- Lachowycz, K.; Jones, A. Towards a better understanding of the relationship between greenspace and health: Development of a theoretical framework. Landsc. Urban Plan. 2013, 118, 62–69. [Google Scholar] [CrossRef]
- Picavet, H.; Milder, I.; Kruize, H.; Vries, S.; Hermans, T.; Wendel-Vos, W. Greener living environment healthier people?: Exploring green space, physical activity and health in the Doetinchem cohort study. Prev. Med. 2016, 89, 7–14. [Google Scholar] [CrossRef]
- Gascon, M.; Triguero-Mas, M.; Martínez, D.; Dadvand, P.; Forns, J.; Plasència, A.; Nieuwenhuijsen, M.J. Mental health benefits of long-term exposure to residential green and blue spaces: A systematic review. Int. J. Environ. Res. Public Health 2015, 12, 4354–4379. [Google Scholar] [CrossRef] [PubMed] [Green Version]
- Foley, R.; Kistemann, T. Blue space geographies: Enabling health in place. Health Place 2015, 35, 157–165. [Google Scholar] [CrossRef] [PubMed] [Green Version]
- Poulsen, M.N.; Schwartz, B.S.; Dewalle, J.; Nordberg, C.; Pollak, J.S.; Silva, J.; Mercado, C.I.; Rolka, D.B.; Siegel, K.R.; Hirsch, A.G. Proximity to freshwater blue space and type 2 diabetes onset: the importance of historical and economic context. Landsc. Urban Plan. 2021, 209, 104060. [Google Scholar] [CrossRef] [PubMed]


| Variables | (n = 111 Women) |
|---|---|
| Mean ± SD | |
| Age (years) | 37.78 ± 14.70 |
| Body composition | |
| Body mass (kg) | 61.02 ± 8.83 |
| Height (m) | 1.63 ± 0.06 |
| Fat mass (kg) | 18.59 ± 6.81 |
| Fat mass (%) | 29.61 ± 73.39 |
| Visceral fat area (cm2) | 79.09 ± 34.97 |
| Appendicular skeletal muscle mass (ASMM, kg) | 17.26 ± 2.58 |
| Appendicular skeletal muscle mass index (ASMMI, kg/m2) | 6.51 ± 0.69 |
| Physical activity (PA) | |
| Total PA (min/week) | 745.98 ± 313.50 |
| Moderate-to-vigorous PA (min/week) | 188.03 ± 118.99 |
| Steps/day (n) | 12,712.98 ± 3816.90 |
| Sleep | |
| Total sleep time (h) | 7.04 ± 1.18 |
| Sleep efficiency (%) | 93.20 ± 2.83 |
| Sleep onset latency (min) | 32.11 ± 13.68 |
| Nocturnal awakenings (n) | 15.15 ± 5.31 |
| Minutes of awakenings (min) | 2.09 ± 0.44 |
| Sleep fragmentation (%) | 23.14 ± 8.78 |
| Sleep fragmentation index (n) | 3.51 ± 1.67 |
| Sleep onset time (HH:MM ± min) | 00:27 ± 30 |
| Sleep offset time (HH:MM ± min) | 08:05 ± 10 |
| Sleep midpoint time (HH:MM ± min) | 04:19 ± 02 |
| Distance to natural spaces (m) | |
| Green spaces | 360.76 ± 244.30 |
| Blue spaces | 421.45 ± 207.83 |
| Variables | n (%) |
|---|---|
| Fat mass (%) | |
| Non-obese | 67 (60.4) |
| Obese | 44 (39.6) |
| Visceral fat area (cm2) | |
| Normal | 79 (71.2) |
| High | 32 (28.8) |
| Appendicular skeletal muscle mass index (kg/m2) | |
| Normal | 101 (91.0) |
| Deficit | 10 (9.0) |
| Moderate-to-Vigorous PA (min/week) | |
| Non-recommended | 49 (44.1) |
| Recommended | 62 (55.9) |
| Total Sleep Time (min) | |
| Non-recommended | 46 (41.4) |
| Recommended | 65 (58.6) |
| Sleep efficiency (%) | |
| Non-recommended | --- |
| Recommended | 111 (100.0) |
| Sleep onset latency (min) | |
| Non-recommended | 57 (51.4) |
| Recommended | 54 (48.6) |
| Sleep fragmentation index (event/h) | |
| Normal | 92 (82.9) |
| Possible sleep disturbance | 19 (17.1) |
| Sleep midpoint | |
| Before 2:00 AM (early) | 2 (1.8) |
| Between 2:00 and 4:00 AM (healthy) | 42 (37.8) |
| After 4:00 AM (late) | 67 (60.4) |
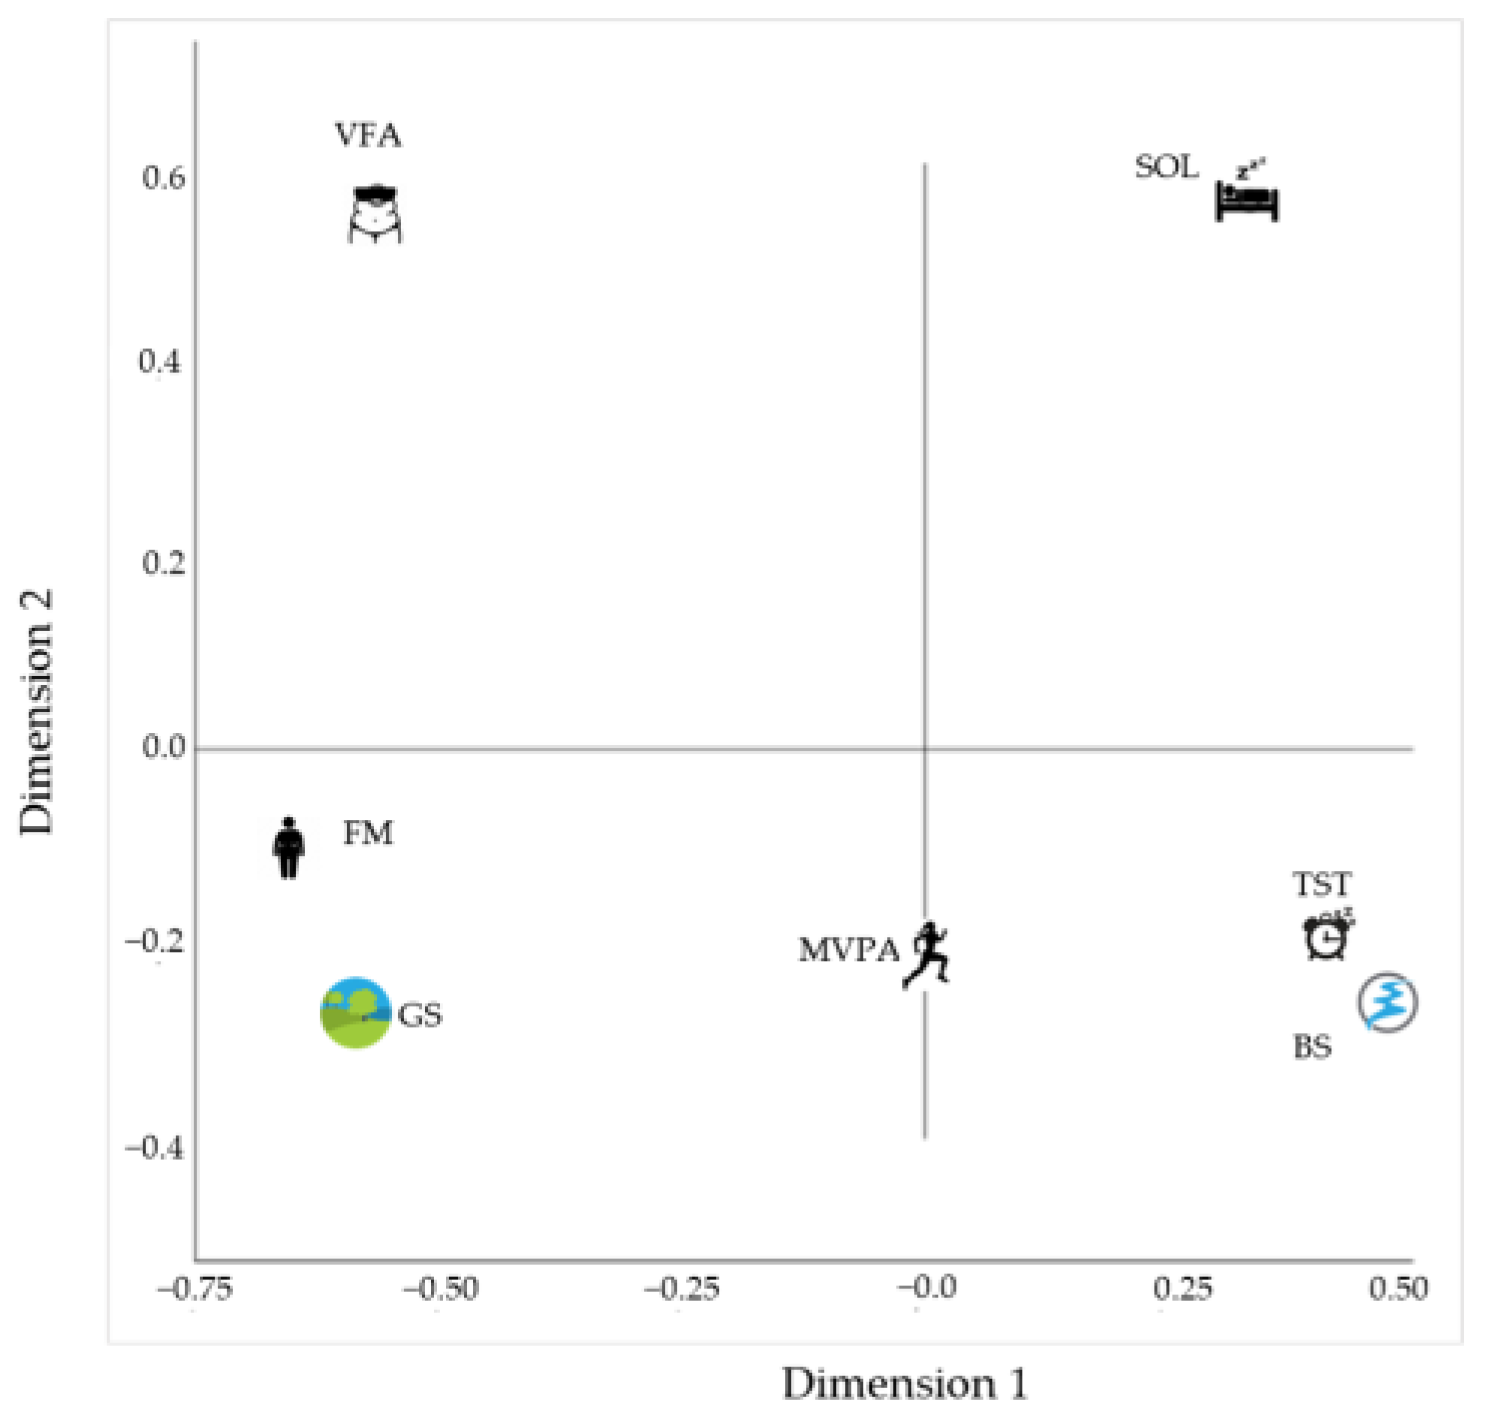
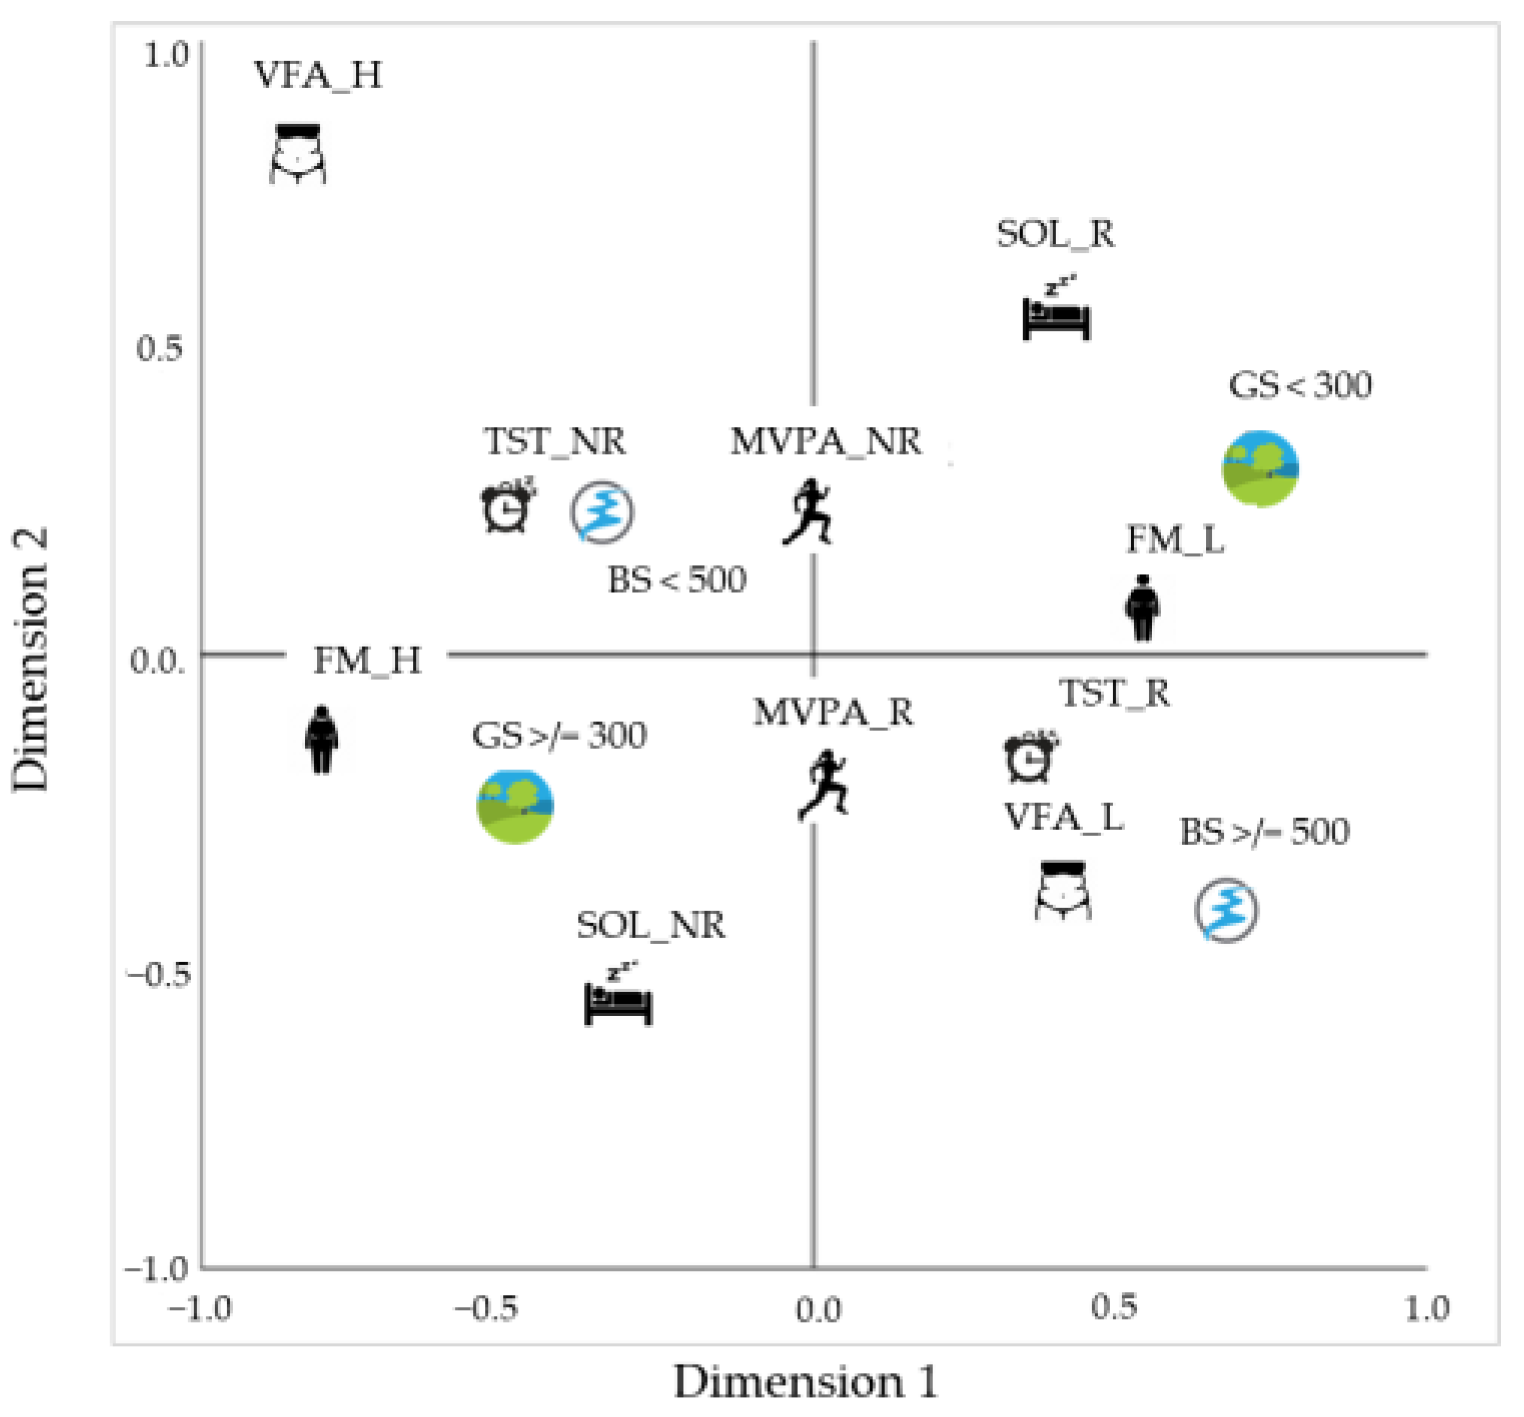
| Sets | Dimensions | Sum | ||
|---|---|---|---|---|
| Dimension 1 | Dimension 2 | |||
| Loss | Distance to natural spaces | 0.484 | 0.826 | 1.310 |
| Actigraphy variables | 0.708 | 0.559 | 1.267 | |
| Body composition variables | 0.526 | 0.407 | 0.933 | |
| Mean of sets | 0.573 | 0.597 | 1.170 | |
| Eigenvalue | 0.427 | 0.403 | ||
| Fit | 0.830 | |||
Disclaimer/Publisher’s Note: The statements, opinions and data contained in all publications are solely those of the individual author(s) and contributor(s) and not of MDPI and/or the editor(s). MDPI and/or the editor(s) disclaim responsibility for any injury to people or property resulting from any ideas, methods, instructions or products referred to in the content. |
© 2023 by the authors. Licensee MDPI, Basel, Switzerland. This article is an open access article distributed under the terms and conditions of the Creative Commons Attribution (CC BY) license (https://creativecommons.org/licenses/by/4.0/).
Share and Cite
Teixeira, A.; Gabriel, R.; Martinho, J.; Oliveira, I.; Santos, M.; Pinto, G.; Moreira, H. Distance to Natural Environments, Physical Activity, Sleep, and Body Composition in Women: An Exploratory Analysis. Int. J. Environ. Res. Public Health 2023, 20, 3647. https://doi.org/10.3390/ijerph20043647
Teixeira A, Gabriel R, Martinho J, Oliveira I, Santos M, Pinto G, Moreira H. Distance to Natural Environments, Physical Activity, Sleep, and Body Composition in Women: An Exploratory Analysis. International Journal of Environmental Research and Public Health. 2023; 20(4):3647. https://doi.org/10.3390/ijerph20043647
Chicago/Turabian StyleTeixeira, Andreia, Ronaldo Gabriel, José Martinho, Irene Oliveira, Mário Santos, Graça Pinto, and Helena Moreira. 2023. "Distance to Natural Environments, Physical Activity, Sleep, and Body Composition in Women: An Exploratory Analysis" International Journal of Environmental Research and Public Health 20, no. 4: 3647. https://doi.org/10.3390/ijerph20043647