Article

Environmental, Human and Ecotoxicological Impacts of Different Rice Cultivation Systems in Northern Thailand

by
Patharanun Toolkiattiwong
,
Noppol Arunrat
* and
Sukanya Sereenonchai
Faculty of Environment and Resource Studies, Mahidol University, Nakhon Pathom 73170, Thailand
*
Author to whom correspondence should be addressed.
Int. J. Environ. Res. Public Health 2023, 20(3), 2738; https://doi.org/10.3390/ijerph20032738
Submission received: 30 December 2022 / Revised: 24 January 2023 / Accepted: 31 January 2023 / Published: 3 February 2023
(This article belongs to the Special Issue Water, Health, and Environment)

Abstract

:
Sustainable practices in rice cultivation require effective farming management concerning environmental and human health impacts. In this study, three rice cultivation systems, namely low-land, upland, and terraced rice in the Mae Chaem District, Chiang Mai Province, were assessed and the carbon footprint (CF), water footprint (WF), and human and ecotoxicological impacts were compared from pesticide application. The results showed that the highest CF intensity was observed in terraced rice with 1.15 kg CO2eq kg−1 rice yield, followed by lowland rice (1.02 kg CO2eq kg−1 rice yield) and upland rice (0.17 kg CO2eq kg−1 rice yield) fields. Moreover, lowland rice cultivation generated the highest total WF with 1701.6 m3 ton−1, followed by terraced rice (1422.1 m3 ton−1) and upland rice (1283.2 m3 ton−1). The lowland rice fields had the most impact on human health and freshwater ecotoxicity, followed by the terraced and upland rice cultivation systems. The results also showed that most of the pesticides remaining in soils were chlorpyrifos (98.88%), butachlor (96.94%), and fipronil (95.33%), respectively. The substances with the greatest distributions in freshwater were acephate (56.74%), glyphosate (50.90%), and metaldehyde (45.65%), respectively. This study indicated that, with more agricultural inputs, higher CF, WF, human health impacts, and freshwater ecotoxicity were generated. Although the use of pesticides in the study areas did not exceed the recommendations on the packaging, glyphosate and chlorpyrifos are restricted in Thailand, so it is necessary to monitor their use due to their long-term health effects.

1. Introduction

Based on the geographical distribution in Thailand, traditional rice cultivation practices can be simply classified into lowland, upland, and terraced rice. Lowland rice is usually grown in floodplain areas where fields are flooded during the growing season. Cultivation can be done more than once a year [1]. Upland rice is generally grown on hills and sloping areas where water relies only on rainfall, leading to cultivation once a year. Terraced rice is also grown on high hills and sloping areas where natural water is available, facilitating fields that are flooded during the growing season [2]. Among these rice cultivation systems, management practices are different throughout the rice’s life cycle, which causes the difference in environmental and human health impacts [3,4].
Carbon footprint (CF) and water footprint (WF) were developed to assess the pressure from human activities on the environment. For climate change, the CF assessment has been widely used to express a quantity of carbon dioxide equivalent (CO2eq) [5], which is associated with the sum of three main greenhouse gases’ (GHGs: CH4, N2O, and CO2) contributions to global warming. In rice paddies, methane (CH4) is produced in continuous flooding, which generates an anaerobic environment and favors methanogen bacteria for CH4 generation [6]. Nitrous oxide (N2O) can be directly and indirectly produced from chemical fertilizers, manure management, organic fertilizers, and crop residue burning, which is mostly emitted during dry periods [7]. Excessive usage of nitrogen fertilizer significantly increases denitrification from paddy soils [8]. CO2 is mainly generated from fuel combustion (diesel and gasoline fuels) during the cultivation stages [9]. To mitigate CO2 emission, paddy soils have the potential for soil carbon sequestration through management practices (e.g., incorporating rice straw and stubble, manure and compost application, green manure, organic fertilizer, and minimum/no tillage) [10,11,12,13]. Thus, it is necessary to take soil organic carbon (SOC) into account when estimating CF [10,14,15]. Moreover, WF is used as an indicator for measuring the volume of direct and indirect water use in the life cycle of production, which consists of green, blue, and gray WFs [16]. Green WF indicates the amount of rainwater stored in the soil that is evaporated, transpired, and consumed by plants during cultivation. Blue WF refers to the water consumption from rivers, lakes, ponds, and groundwater, while gray WF means the consumption of freshwater to dilute a load of pollutants and meet the standard of water quality [17,18].
Pesticides cause serious concerns for human health impacts. Once pesticides are applied, pesticide residues remain in the soil and can be transported and bioaccumulated in the air, crops, and food webs [19,20]. Safi [21] reported that lung cancer; breast cancer; lymphomas; leukemia; and cancers of the urinary bladder, prostate, brain, colon, stomach, liver, and thyroid gland are closely correlated with chronic exposure to pesticides in the Gaza Governorates. Ghafouri-Khosrowshahi et al. [22] found that rural farmers who live close to agricultural areas have higher health risks than urban people. They also concluded that exposure to organophosphate pesticides may impair hypothalamic and pituitary endocrine functions and gonadal processes. To evaluate the total human population damage, disability-adjusted life years (DALYs) are usually used to express the years of life lost [23]. Meanwhile, a potentially disappeared fraction of species (PDF) is a relative measure of the damage to ecosystem quality, indicating a fraction of species richness that can be potentially lost due to an environmental mechanism [24]. Thus, it is very important for minimizing the pesticides used in agricultural lands to protect human health, which needs a comprehensive environmental and human health impact assessment.
Chiang Mai Province is a mountainous area in Northern Thailand with steep river valleys, upland areas, and lowland rural areas. Such a geographical pattern causes different traditional ways of life for rice cultivation, consisting of upland, terrace, and lowland rice. To date, there is no comprehensive study to assess and compare the environmental and human health impacts of these rice cultivation systems. Therefore, the objectives of this study were to (1) evaluate the CF and WF and (2) assess the human health impact of pesticide application. This study provides scientific insight for policy planning and advocacy to reduce environmental damage and human health issues.

2. Materials and Methods
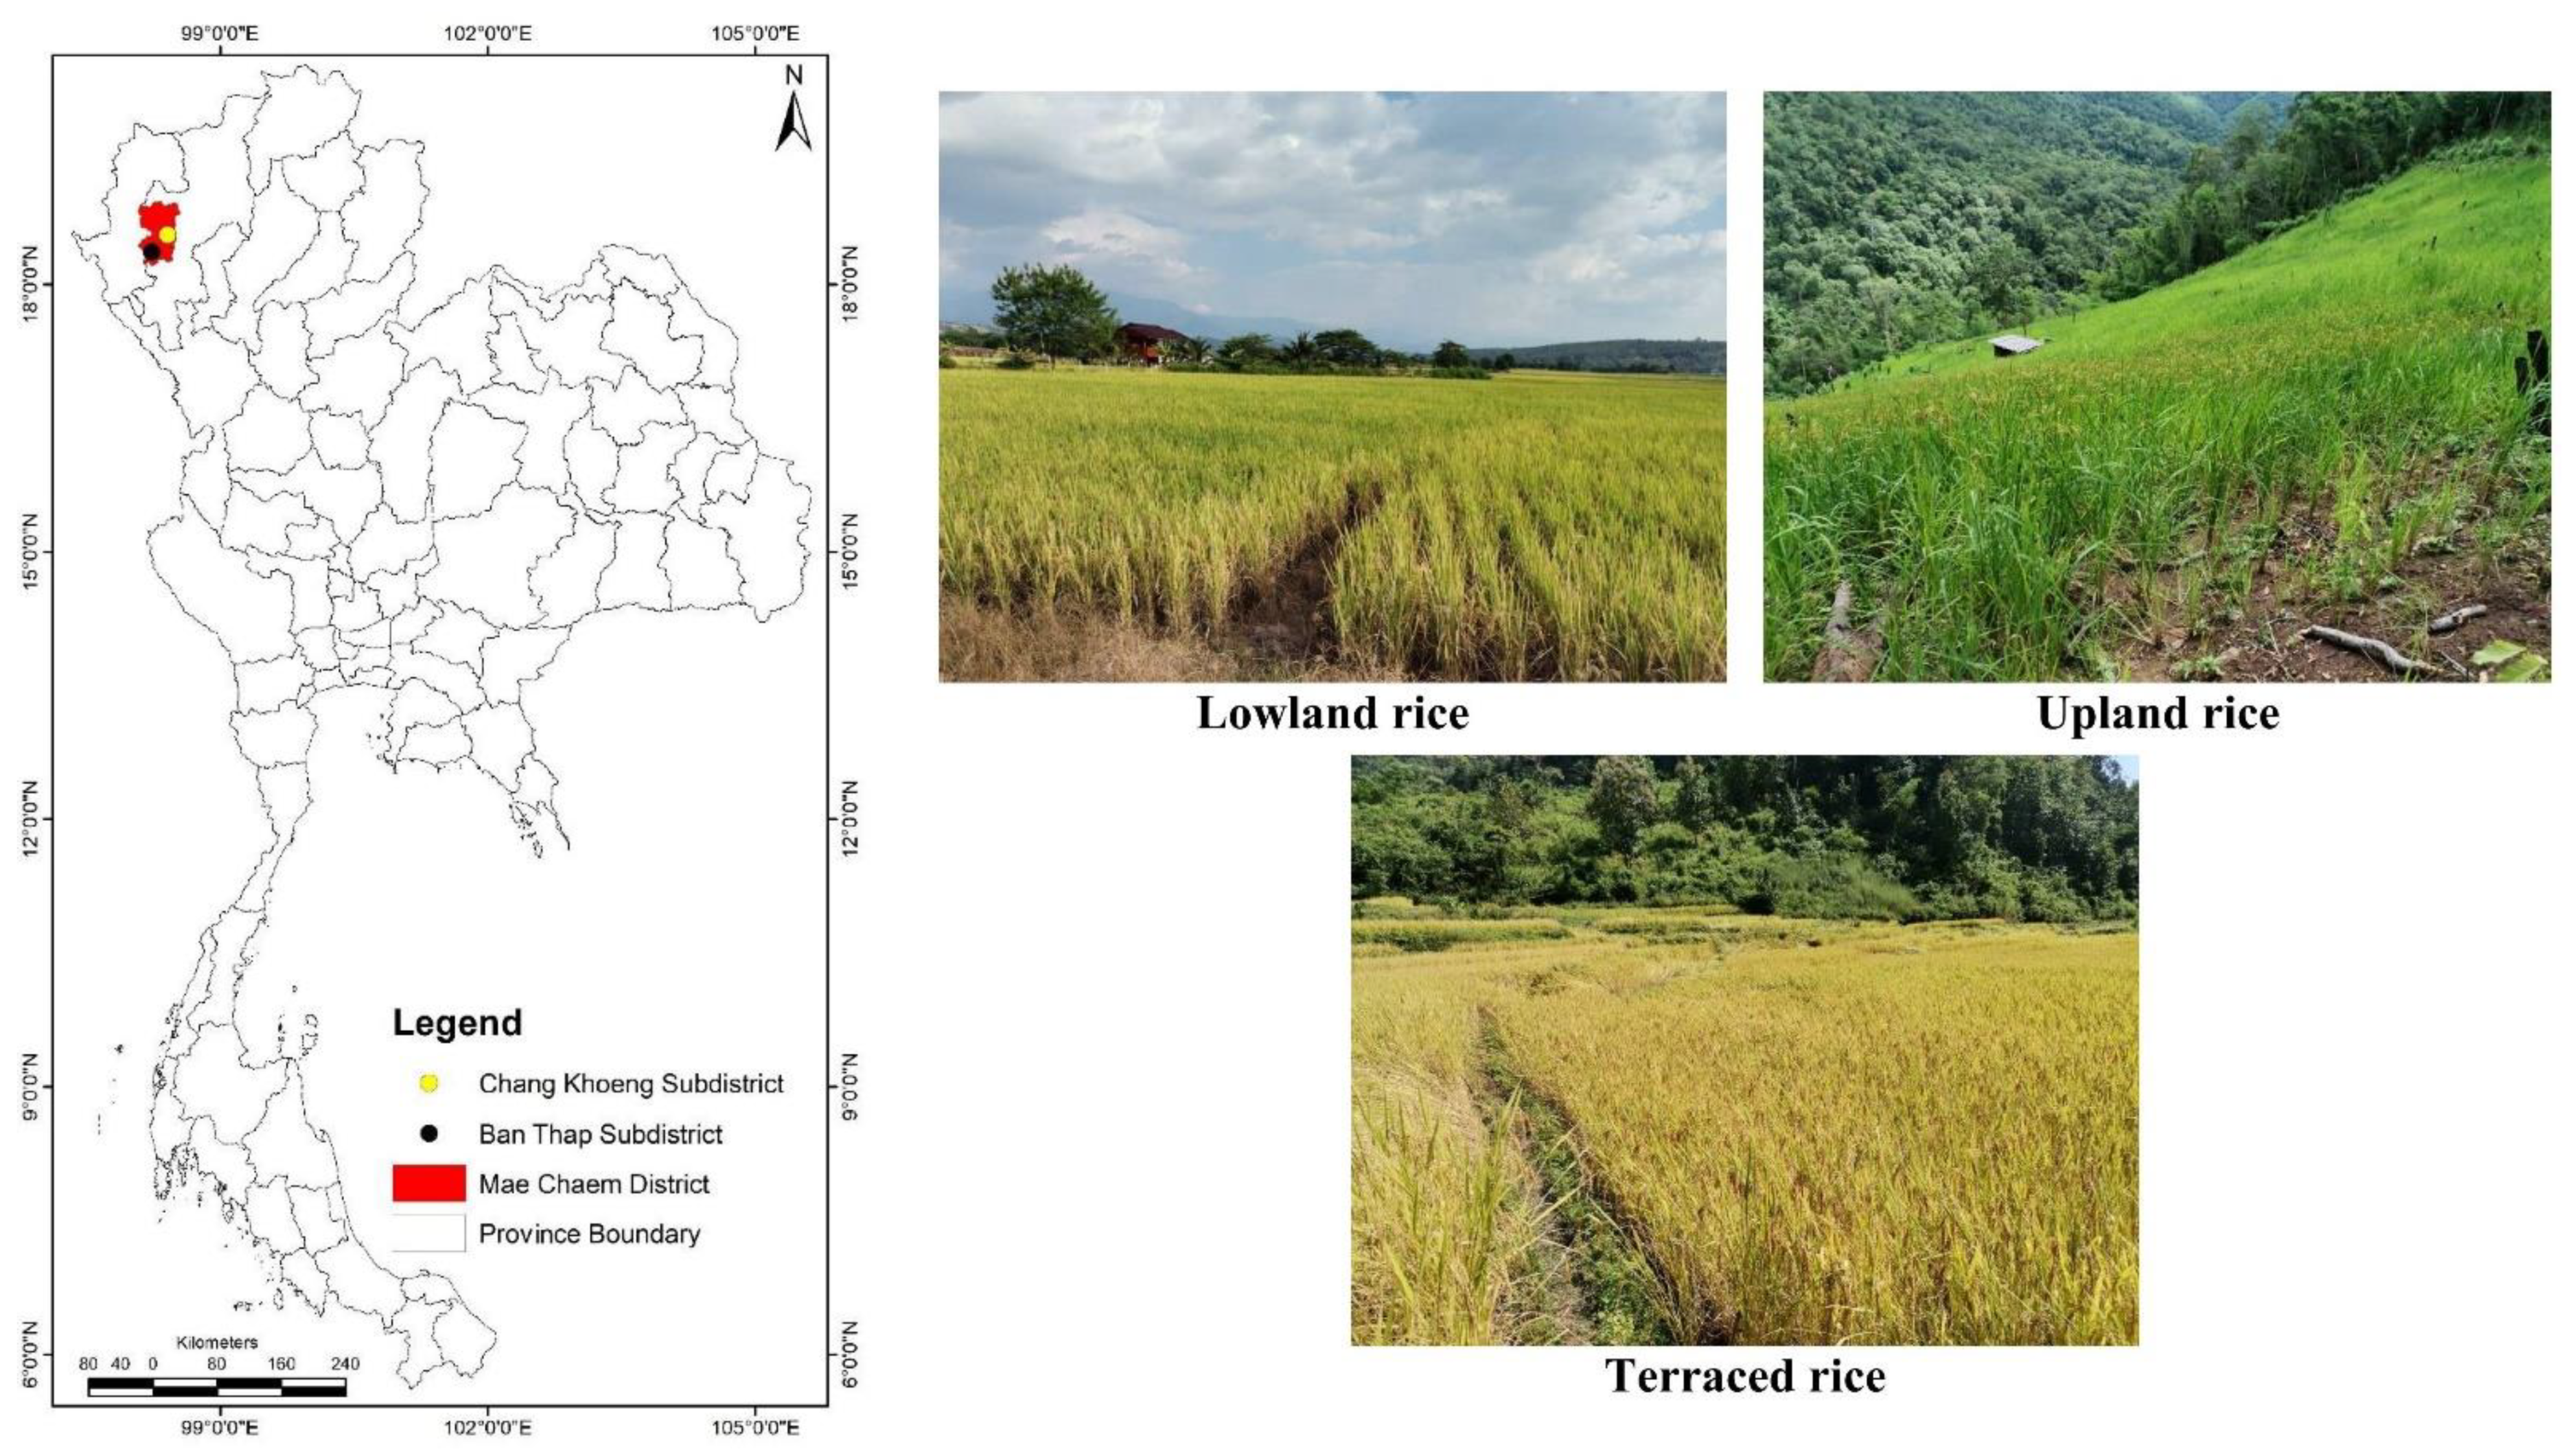
2.1. Study Area

The study was conducted in Mae Chaem District, Chiang Mai Province, Northern Thailand, with a wide range of elevation from 282 to 2565 m.a.s.l. at the highest peak (Doi Inthanon) [25]. The climate is classified as a tropical climate with three seasons (rainy May–October, winter November–February (10–19 °C), and summer January–April) [26]. The average annual rainfall was 978.2 mm, with the highest rainfall being in August, and an average annual temperature of 25.4 °C, with the hottest month being April (40 °C) [27]. A slope complex series is classified for the soils in the highlands (slope > 35%) of Thailand [28]. The soil is mainly mostly reddish-brown lateritic. The soil textures are mostly sandy clay loam, sandy clay, and clay loam, with an acidic soil pH (5.0–5.8) [29].
In this study, lowland rice cultivation was investigated in the Chang Khoeng Subdistrict, while upland and terraced rice fields were studied in the Ban Thap Subdistrict, Mae Chaem District, Chiang Mai Province (Figure 1).

2.2. Data Collection

2.2.1. Farm Management Practices

Three crop years (2019/2020–2021/2022) of farm practices were obtained from the owners of upland (47 farms), terraced (30 farms), and lowland (66 farms) rice farms using a questionnaire. All the practices were collected throughout the crop year, including seeds, fossil fuels (diesel and gasoline), manure, chemical fertilizers (N-P2O5-K2O), insecticides, herbicides, labor, and rice yields (Table 1). In addition, dates and months of all practices were recorded, consisting of land preparation, sowing, transplanting, chemical fertilizer application, insecticide and herbicide application, water pumping, and harvesting.

2.2.2. Soil Sampling and Analysis

Soil samples from three rice systems were collected at 0–30 cm in depth after the harvests for three consecutive years (2020–2022). At each field, soil samples were randomly gathered from five pits. At each pit, soil samples were collected for three replications. Undisturbed soil cores (5.0 cm width × 5.5 cm length) were used to collect soil samples; then, the soil bulk density was measured after drying in an oven at 105 °C for 24 h.
After air drying soil samples at room temperature for 7–10 days, soil samples were crushed and passed through a 2 mm sieve. Organic carbon (OC) was determined by potassium dichromate (K2Cr2O7) oxidation [30].

2.2.3. Soil Organic Carbon Calculation

The SOC stock was calculated using the following equation:
S O C 30 c m = ( ρ × O C × L ) × 1000
Δ S O C S 30 c m = S O C 30 c m ( 2022 ) S O C 30 c m ( 2020 ) 2 × 44 12
where SOC30cm is soil organic carbon stock (kg C ha−1), ρ is soil bulk density (g cm−3), OC is organic carbon content (%), L is soil thickness (cm), Δ S O C S 30 c m is the SOC sequestration at a depth of 30 cm (kg CO2eq ha−1 year−1), S O C 30 c m ( 2022 ) and S O C 30 c m ( 2020 ) are the amounts of SOC stocks at a depth of 30 cm (kg C ha−1) in 2022 and 2020, respectively, and 44/12 is the coefficient for converting C into CO2.
Due to soil bulk density changes over time, the soil thickness (cm) was adjusted by using the equivalent soil mass method to reduce the error in the SOC stock calculations. The equation is used below [31]:
Soil mass=ρ × L
where soil mass is the mass of the soil sample (kg soil m−2). In this study, the soil mass values in 2020 were from the beginning of the study, while the soil mass values in 2022 were from the end of the study.

2.3. System Boundary and Functional Unit

The CF was calculated following the 2019 Refinement to the 2006 IPCC Guidelines for National Greenhouse Gas Inventories [32]. The cradle-to-gate concept was used for the life cycle assessment of rice production, including the raw material production, transportation, field emissions, and harvesting stages. Emissions of CO2, CH4, and N2O were expressed in carbon dioxide equivalents (CO2eq). The radiative forcing potential relative to CO2 was 28 for CH4 and 265 for N2O [33]. The functional unit of CF is expressed as kg CO2eq ha−1 year−1 and kg CO2eq kg−1 rice yields.

2.4. Carbon Footprint Calculation

In this study, the equations from the 2019 Refinement to the 2006 IPCC Guidelines for National Greenhouse Gas Inventories [32] were used as follows:
C F I = G H G t o t a l Δ S O C S 30 c m Y
G H G t o t a l = G H G r m + G H G t r a n + G H G u t i + G H G C H 4 + G H G N 2 O
where CFI is the carbon footprint intensity (kg CO2eq kg−1 rice yield), GHGtotal is the total GHG emissions (kg CO2eq ha−1 year−1), Y is the rice yield (kg ha−1 year−1), G H G r m is GHG emissions from the raw material production (kg CO2eq ha−1 year−1), G H G t r a n is GHG emissions from transportation activity (kg CO2eq year−1), G H G u t i is GHG emissions during the utilization phase (kg CO2eq ha−1 year−1), and   G H G C H 4 and G H G N 2 O are the methane (kg CH4 ha−1) and the direct and indirect N2O emissions (kg N2O ha−1) from rice cultivation. All the emission factors were obtained from sources by Arunrat et al. [1] and Arunrat et al. [15]. The emissions factor of human labor was 0.86 kg CO2eq day−1 [34].

2.5. Water Footprint Calculation

The total WF in rice cultivation (WFtotal, m3 ton−1) is the sum of green, blue, and gray water [35,36,37], as presented in Equation (6).
W F t o t a l = W F g r e e n + W F b l u e + W F g r a y
The green WF and blue WF are calculated using Equations (7)–(10), respectively.
W F g r e e n = C W U g r e e n Y = 10 × d = 1 l g p E T g r e e n Y
W F b l u e = C W U b l u e Y = 10 × d = 1 l g p E T b l u e Y
E T g r e e n = m i n ( E T c , P e f f )
E T b l u e = m a x ( 0 , E T c P e f f )
where CWU is crop water use (m3 ha−1), ETgreen is evapotranspiration of green water (mm day−1), ETblue is evapotranspiration of blue water (mm day−1), lgp is the growing period, Peff is the effective rainfall, and ETc is the crop evapotranspiration. The “0” value is considered when Peff exceeds crop evapotranspiration. Evapotranspiration was calculated by the CROPWAT 8.0 model.
The gray WF calculation (WFgray, m3 ha−1) used Equation (11) [38]:
W F g r a y = α × ( x = 1 n N + O N ) ( C m a x C n a l ) / Y
where α is the fraction of leaching runoff (0.1 is for nitrogen) [39], ON is the amount of organic amendment (kg N ha−1), Cmax is the maximum acceptable concentration of a load of pollutant (NO3-N < 5 mg L−1, Pollution Control Department [40]), and Cnal is the natural N concentration (Cnal = 0 kg m−3).

2.6. Human and Ecotoxicity Impacts

This study followed a method of life cycle impact assessment to assess the health and freshwater ecotoxicity impacts of pesticide use in three rice planting systems (lowland rice, upland rice, and terraced rice fields) using the USEtox model. This study examined the proportion of pesticides as an emission in agricultural soils at steady-state conditions.
The USEtox model was developed under UNEP–SETAC as a model for determining the health effects and environmental toxicity of chemicals [41]. Fate transportation in days, exposure, and effects from intakes is a process for determining the effects in the USEtox model. The human health and ecotoxicity impact scores were determined by multiplying the released pesticide mass, depending on active ingredients coupled with the characterization factor provided by USEtox. Accordingly, the human toxicity and freshwater ecotoxicity impact scores (IS) can be described as:
I S = i , x M x , i × C F x , i
where M x , i is the mass of pesticide active ingredient x emitted to compartment I per area treated (kg emitted ha−1), and C F x , i is the amount of pesticide active ingredient x released to compartment i expressed as disability-adjusted life years (DALYs). For the freshwater ecotoxicity impact score, a potentially disappeared fraction of species (PDF) was used to demonstrate the impact by consideration between the freshwater volume (m3) and the duration of one day per kg pesticide active ingredient emission (PDF m3 day kg−1emitted). The characterization factor for human health and freshwater ecotoxicity impacts can be calculated as Equations (13) and (14).
C F x = I F x × E F x × D F x
I F x = F F x × X F x
The characterization factor for human health represents health effects at the endpoint level (DALY kg−1emitted). The characterization factor for each pesticide is related to the human intake fraction ( I F x ) via the inhalation and ingestion route (kgintake kg−1emitted), where fate ( F F x ) and human exposure ( X F x ) matrices can be integrated into an intermediary matrix referred to as the intake fraction. E F x is the health effect of pesticide intake (cases kg−1intake), and D F x is the damage occurrence (DALY case−1).
The characterization factor for freshwater ecotoxicity is due to a combination of fate transportation ( F F x ) (day). The X F x is the exposure of the bioavailable fraction of pesticides in freshwater, E F x represent ecological effects of changes in a potentially affected fraction (PAF m3 kg−1), and D F x   is the damage factor (PDF PAF−1). The characterization factors for nearly 4000 chemicals were included in the USEtox model.

2.7. Statistical Analysis

The analyses were performed using SPSS (v. 25.0). A one-way ANOVA and Tukey’s honestly significant difference (HSD) tests (p < 0.05) were performed to identify differences in values among the three rice cultivation systems.

3. Results

3.1. Input Inventory Analysis

As shown in Table 1, it is noteworthy that the largest input of seed can be seen in the lowland rice system with 137.5 (±50) kg ha−1 crop−1. There was no significant difference in seed input among the three rice systems. However, the amount of gasoline used in the rice systems is significantly different (p < 0.05). Similar to seeds, the gasoline input took the largest portion of the lowland rice system, with 125.0 (±43.75) L ha−1 per crop, whereas nearly half of the amount used in the lowlands was utilized in terraced rice. During the study period, there was no remarkable difference in the use of diesel between lowland and terraced rice, while no diesel input was found in the upland rice system. It is interesting to note that the agricultural input of straw was significantly different among the three rice systems (p < 0.05). The lowland rice system used straw 3474.4 (±1250) kg ha−1 per crop, terraced rice 2618.5 (±1250) kg ha−1 crop−1, and upland rice 1316.7 (±625) kg ha−1 per crop, respectively. In lowland and terraced rice systems, no significant difference in manure input was noteworthy, whereas farmers did not use manure in the upland rice system. On the other hand, terraced rice was labor-intensive, with the need for 5.0 (±3.0) persons per day, while rice farming in the upland area had a lesser labor need (3.0 ± 2.0 persons per day). The input of 16-20-0 fertilizer in lowland and terraced rice was slightly different, and the upland rice does not use such a kind of fertilizer. However, 16-16-8 fertilizer was utilized in all rice systems. The same amount of that kind of fertilizer was used in lowland and terraced rice farming, although upland rice needed a smaller amount of 16-16-8 fertilizer compared to the other two rice systems. The use of 46-0-0 fertilizer was not popular in the study area. Only lowland rice used that fertilizer, and the estimated amount was 62.5 (±37.25) kg ha−1 crop−1.

3.2. Soil Organic Carbon Stock and Sequestration

The soil organic carbon (SOC) stock was significantly higher in the upland rice system compared to the other two rice systems in the three selected years (2020, 2021, and 2022) (p < 0.05). On the other hand, the SOC stock in each rice system was not significantly different during the study period. In 2022, the upland rice stored 61,068.6 ± 867 kg C ha−1 of SOC, terraced rice 44,960.5 ± 1045 kg C ha−1, and lowland rice 32,804.7 ± 1127 kg C ha−1, respectively. It is noteworthy that, in each year of the study period, the SOC stocks in the three rice systems were significantly different (p < 0.05). The present study also proved that the SOC storage capacity of the lowland rice system was nearly half that of the upland system. Moreover, the differences in SOC sequestration (ΔSOCS) during the study period were more significant in the lowland rice system compared to the other two systems, with an increase of 52.9 (±12.2) kg C ha−1 year−1 and 194.0 (±45.1) kg CO2eq ha−1 year−1 (Table 2).

3.3. Greenhouse Gas Emissions and Carbon Footprint Intensity

Among the agricultural inputs at the raw materials production stage, chemical fertilizers contributed to the highest GHG emission compared to the other inputs, with 686.5 ± 181.5 kg CO2eq ha−1 year−1 in lowland rice, 315.6 ± 93.6 kg CO2eq ha−1 year−1 in terraced rice, and 125.7 ± 24.6 kg CO2eq ha−1 year−1 in upland rice, respectively. It is also noteworthy that the emissions due to chemical fertilizers in different rice systems were significantly different (p < 0.05), and lowland rice made the greatest amount of emissions. At the same stage, herbicides and pesticides took second and third place in contributing to GHG emissions. Farming lowland rice caused the highest level of emission with 82.4 (±10) kg CO2eq ha−1 year−1 due to herbicides, while the use of pesticides in terraced rice made the emission of 97.5 ± 10.1 kg CO2eq ha−1 year−1. Upland rice did not use gasoline and diesel, so it made zero emissions due to these inputs. However, these two agricultural inputs significantly contributed to GHG emissions at the field emission stage in lowland and terraced rice (p < 0.05). On the other hand, the contribution of CH4 in lowland and terraced rice farming at the cultivation stage made the highest level of emissions, with 2767.9 ± 1512.4 kg CO2eq ha−1 year−1 and 2914.3 ± 1604.5 kg CO2eq ha−1 year−1, respectively. Herbicides, N2O, and labor were also sources of emissions, and they significantly differently contributed to GHG emissions in the three different rice systems (p < 0.05). In harvesting rice, zero emissions were found in terraced and upland rice systems. In total and net GHG emissions, lowland rice farming took first place. Similarly, the lowland rice system gave the highest yield with 4632.5 ± 870.6 kg ha−1 year−1. The highest carbon footprint intensity was observed in terraced rice with 1.15 (±0.66) kg CO2eq kg−1 rice yield, and the intensities in the three rice systems were significantly different (p < 0.05) (Table 3).

3.4. Water Footprint

In the three rice systems, the consumption of green WF was obviously high compared to blue and gray WFs. Upland rice took first place in using green WF with 94.9% of the total WF, while the only remaining WF in the same rice system was gray WF. However, the amount of green WF in the three different rice systems was not significantly different, whereas a remarkable difference in gray WF of each system was found. It is interesting to note that lowland rice generated the highest amount of gray WF with 589.7 (±125.7) m3 ton−1 among the three systems while it used green water with 59.3% of total WF. The consumption of blue WF was comparatively low in the terraced and lowland rice systems compared to the other WFs, and no blue WF was found in upland rice (Table 4).

3.5. Pesticide Usage in Three Rice Planting Systems

This study found that farmers used a total of 14 pesticides, including six herbicides: 2,4-D dimethyl ammonium, acetochlor, alachlor, atrazine, butachlor, and glyphosate; five insecticides: acephate, carbendazim, chlorpyrifos, cypermethrin, and fipronil; two fungicides: captan and mancozeb; and one molluscicide: metaldehyde. The areas in the order of the greatest use of pesticide types and amounts were lowland rice fields, upland rice, and terraced rice systems, respectively. The amounts of active ingredients used per hectare per year differed in each area, as shown in Table 5.
This study compared farmers’ pesticide uses to the maximum recommended dosages on each package per hectare per year. Alachlor, atrazine, and 2,4-D dimethyl ammonium were the top three pesticides used in 2020, 2021, and 2022. It was found that most of the farmers used pesticides as recommended, except for acephate and glyphosate, for all three years in the lowlands; carbendazim in 2020 in the uplands; and carbendazim in 2020, captan in 2021, and fipronil in 2021 at cultivation, used in doses higher than the instructions on the package. In addition, the use of pesticides in rice cultivation for acetochlor, atrazine, butachlor, and metaldehyde tends to increase every year. Although the use of pesticides by farmers did not exceed the recommended dosage on the packaging, some substances must be monitored. Glyphosate is restricted in Thailand, making it necessary to monitor its use due to its long-term health effects. Likewise, chlorpyrifos is a pesticide listed as a type 4 hazardous substance in Thailand, and it was officially banned in 2020. This may require a review of the use of such pesticides in rice cultivation. Farmers in upland and terraced rice cultivation use fewer types of pesticides than lowland rice cultivation; in the lowland, the main purpose is commercial and focuses on good yields, while upland and terraced rice cultivation mostly grow rice for household consumption and sometimes for sale. In each area, there are agricultural scholars to give advice on the type and amount of pesticide use. However, it is not possible to control the type and amount of use as it should in reality. The accessibility of pesticides varies from area to area, resulting in different pesticides being used, such as atrazine, acetochlor butachlor, and glyphosate being used only in lowland cultivation. In addition, farmers in some areas have concerns about health issues, especially the use of glyphosate, which has a relatively high health impact due to its use restrictions in Thailand, and noticed that it was only used in the lowland cultivation area. All of this is the reason why the types of pesticides farmers use vary from area to area.

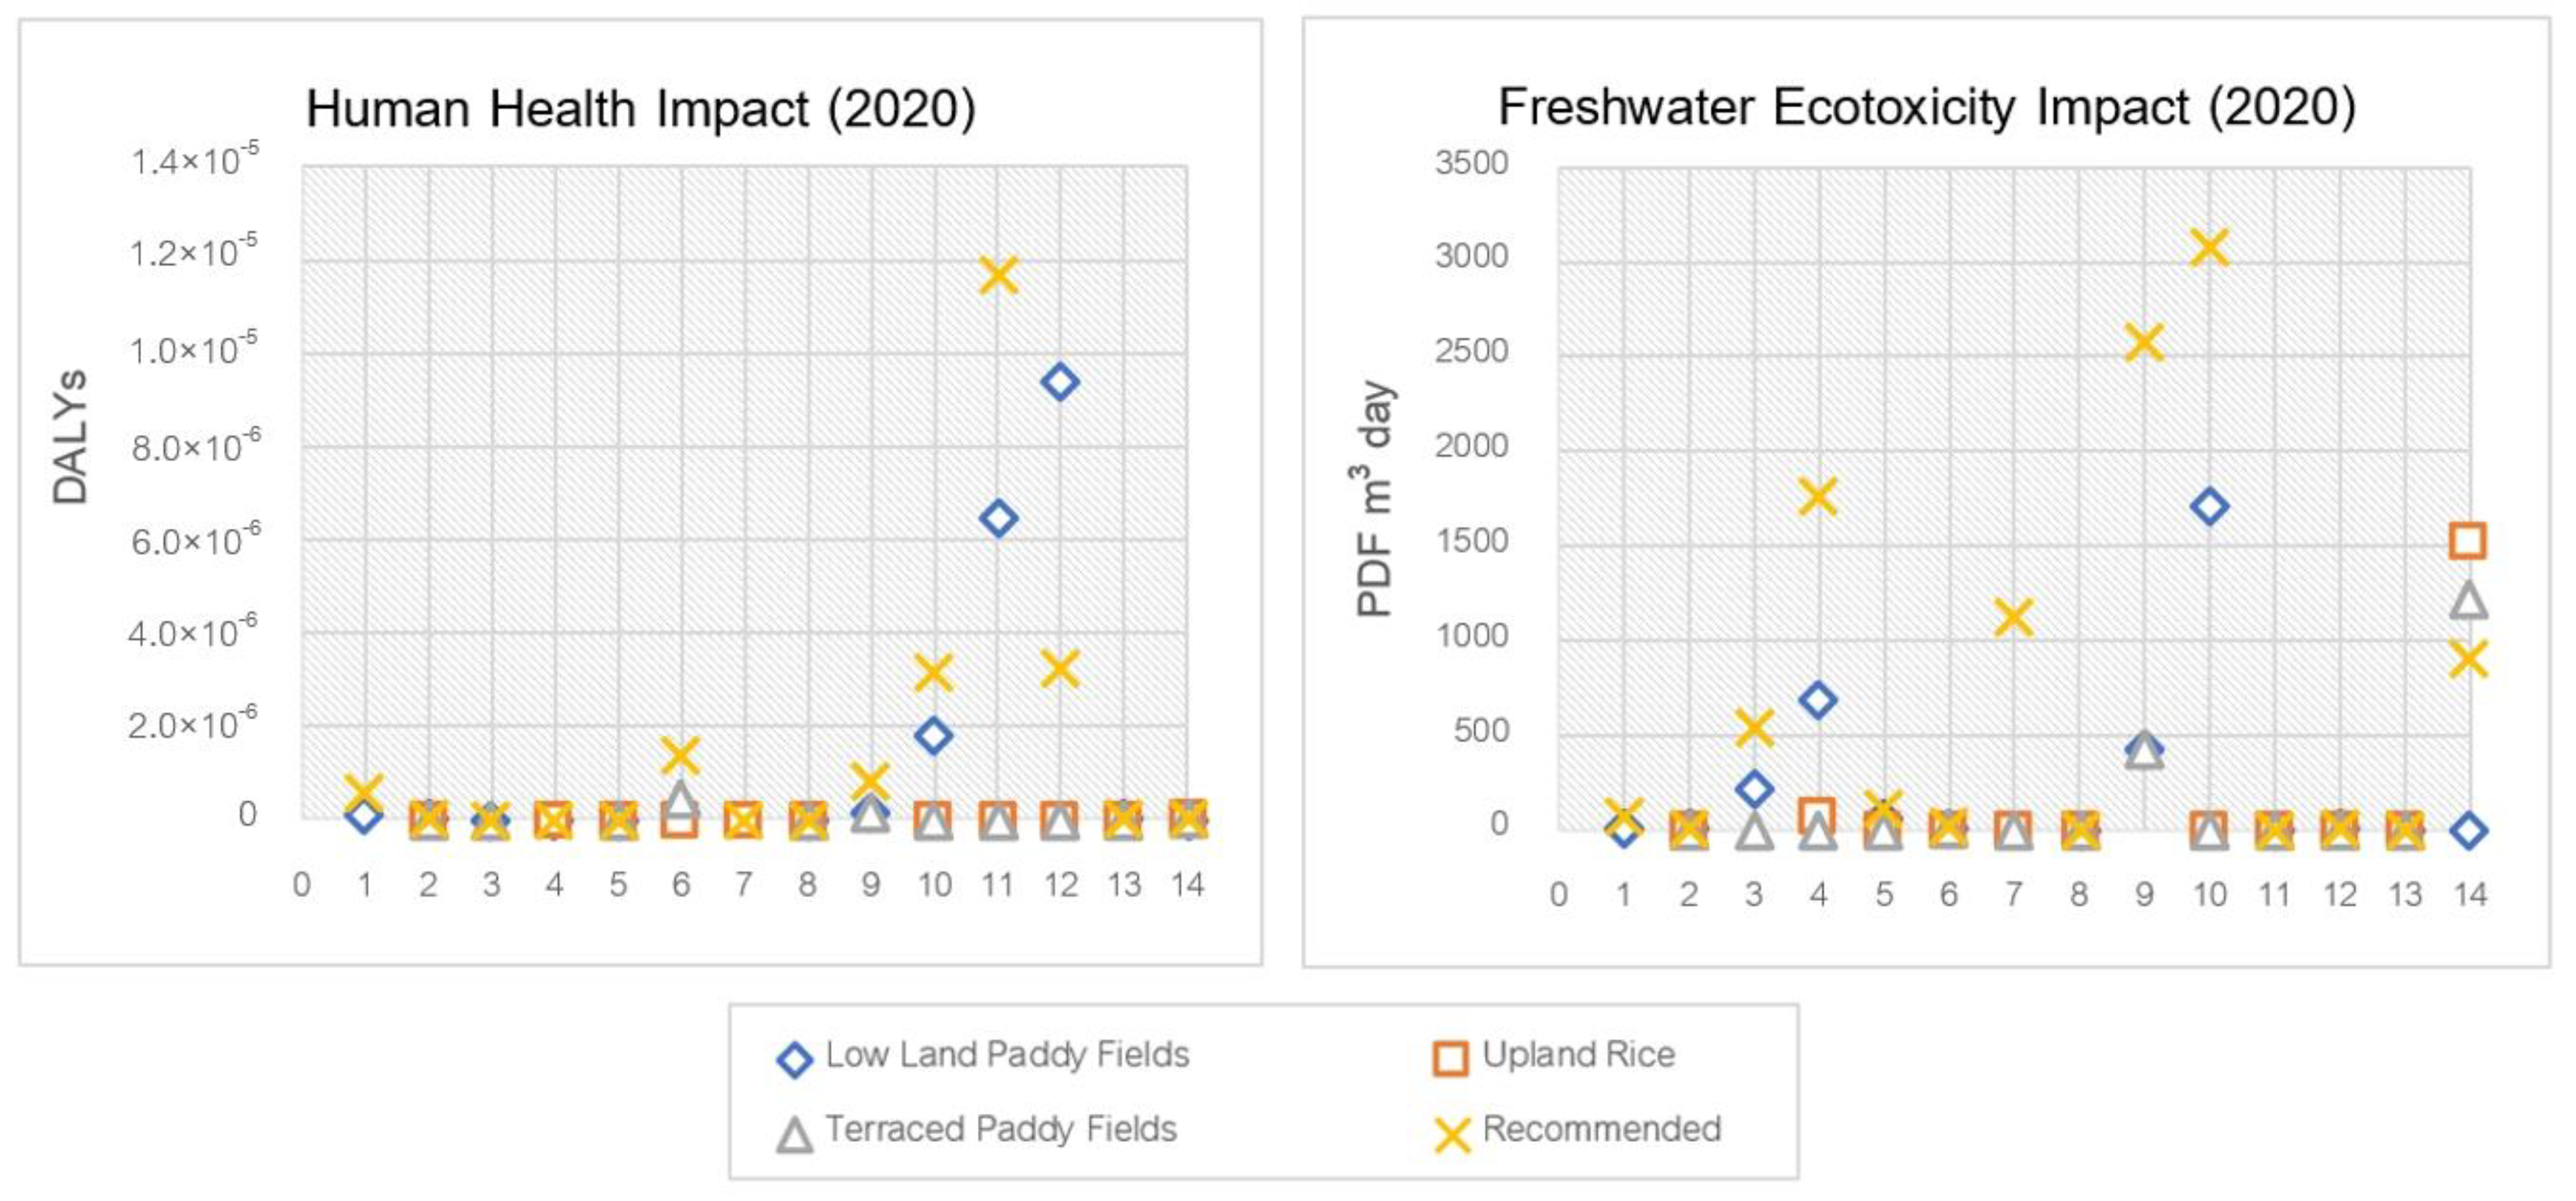
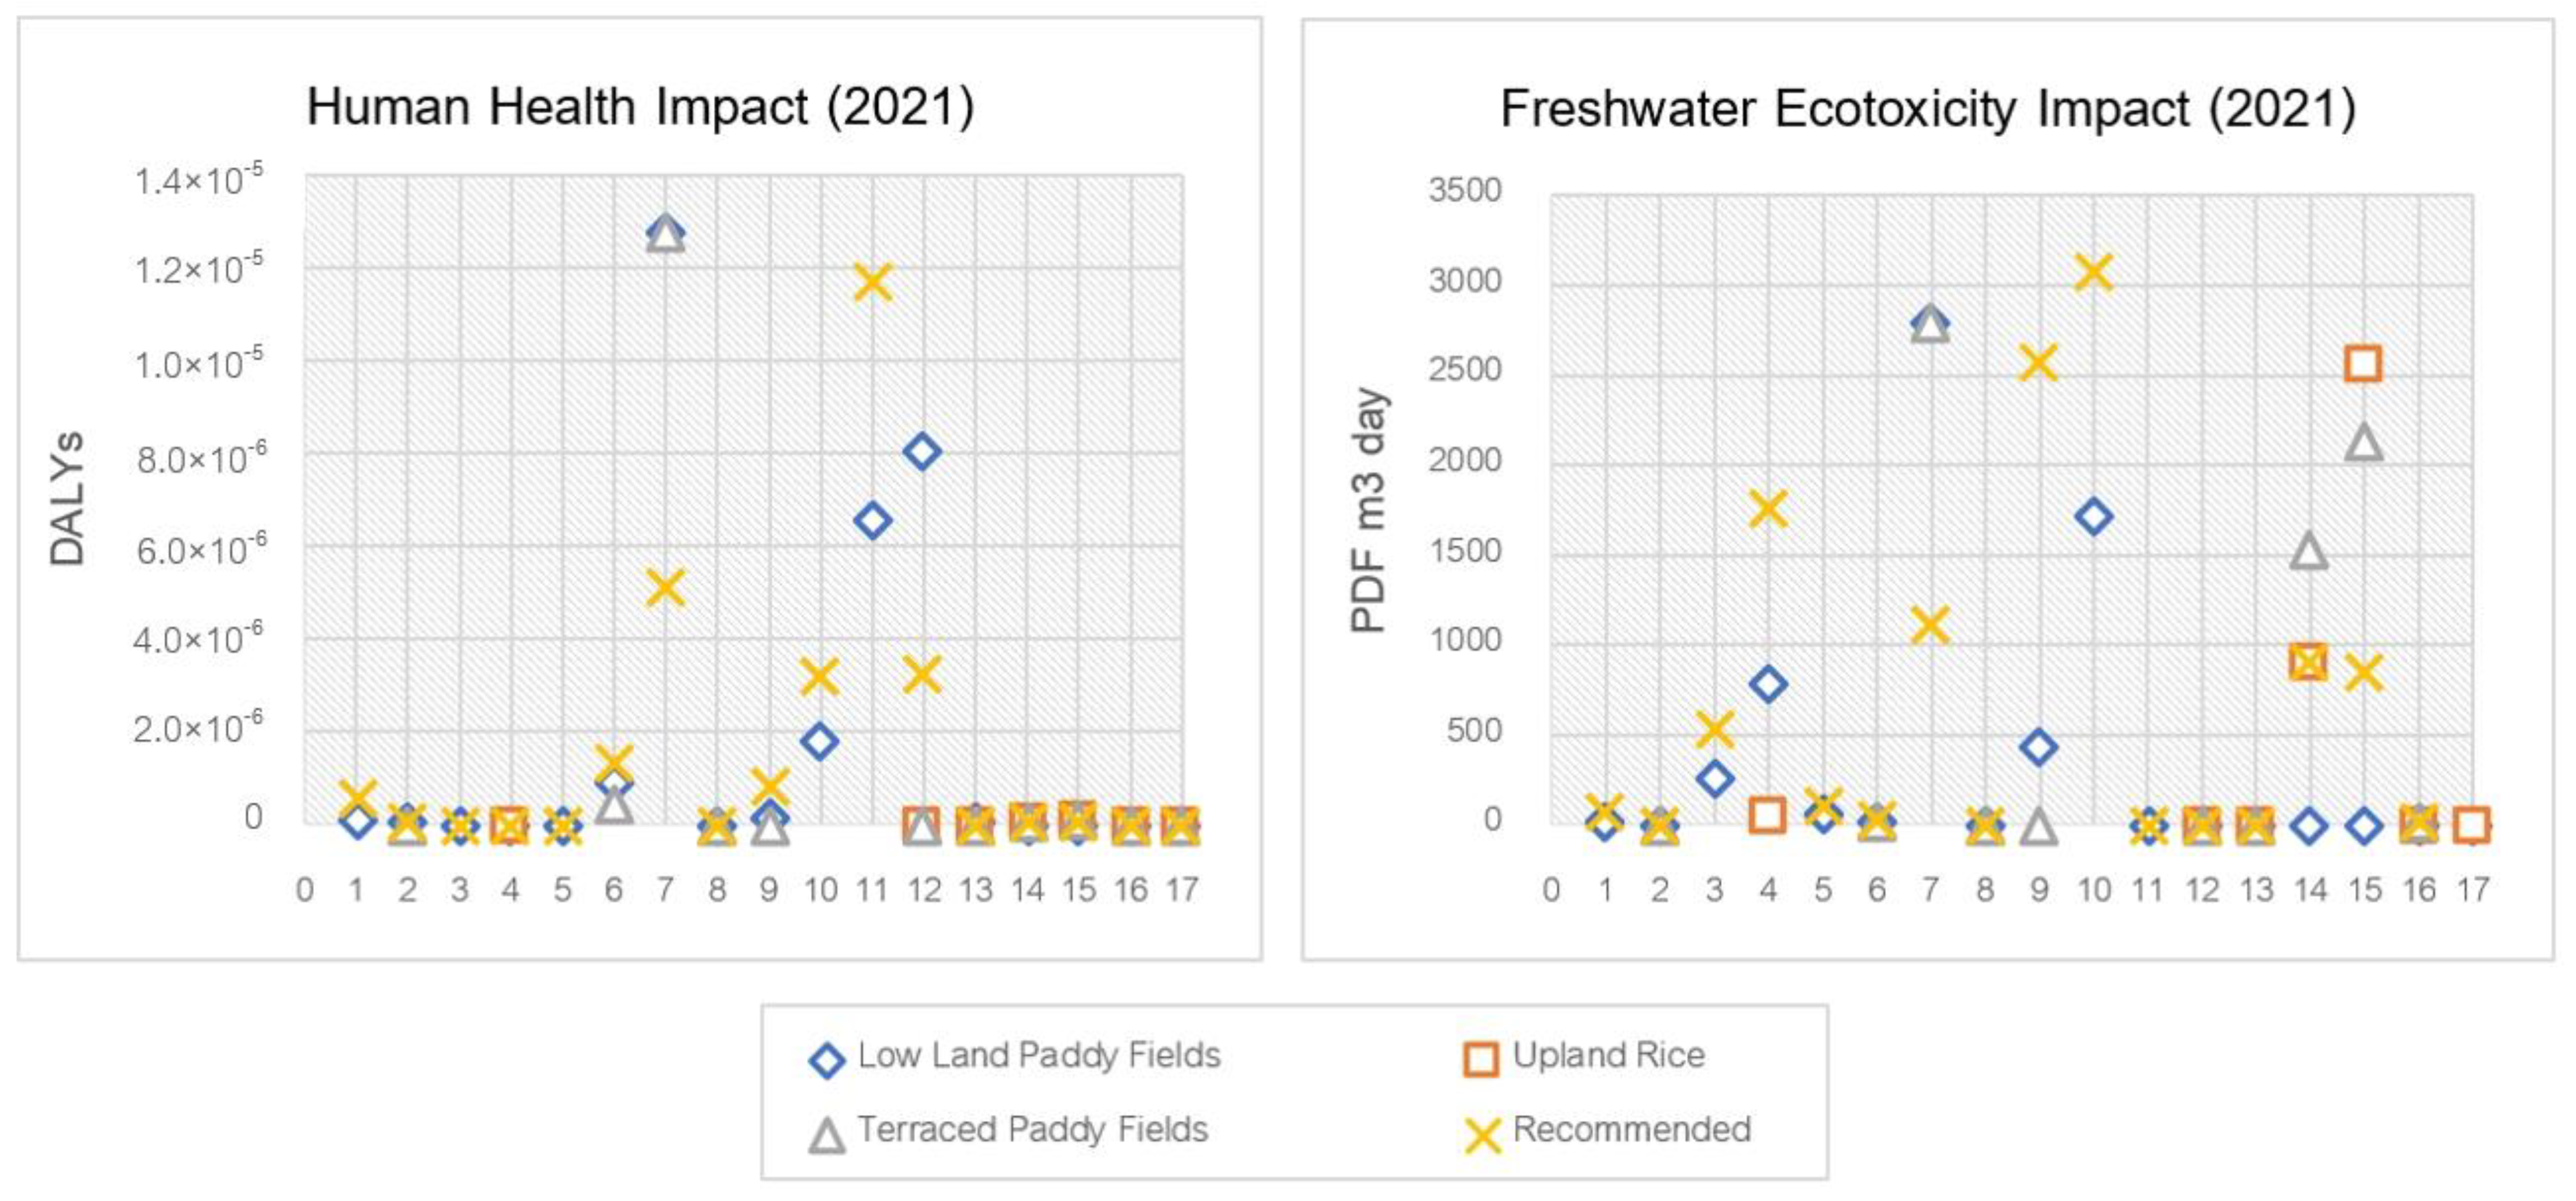
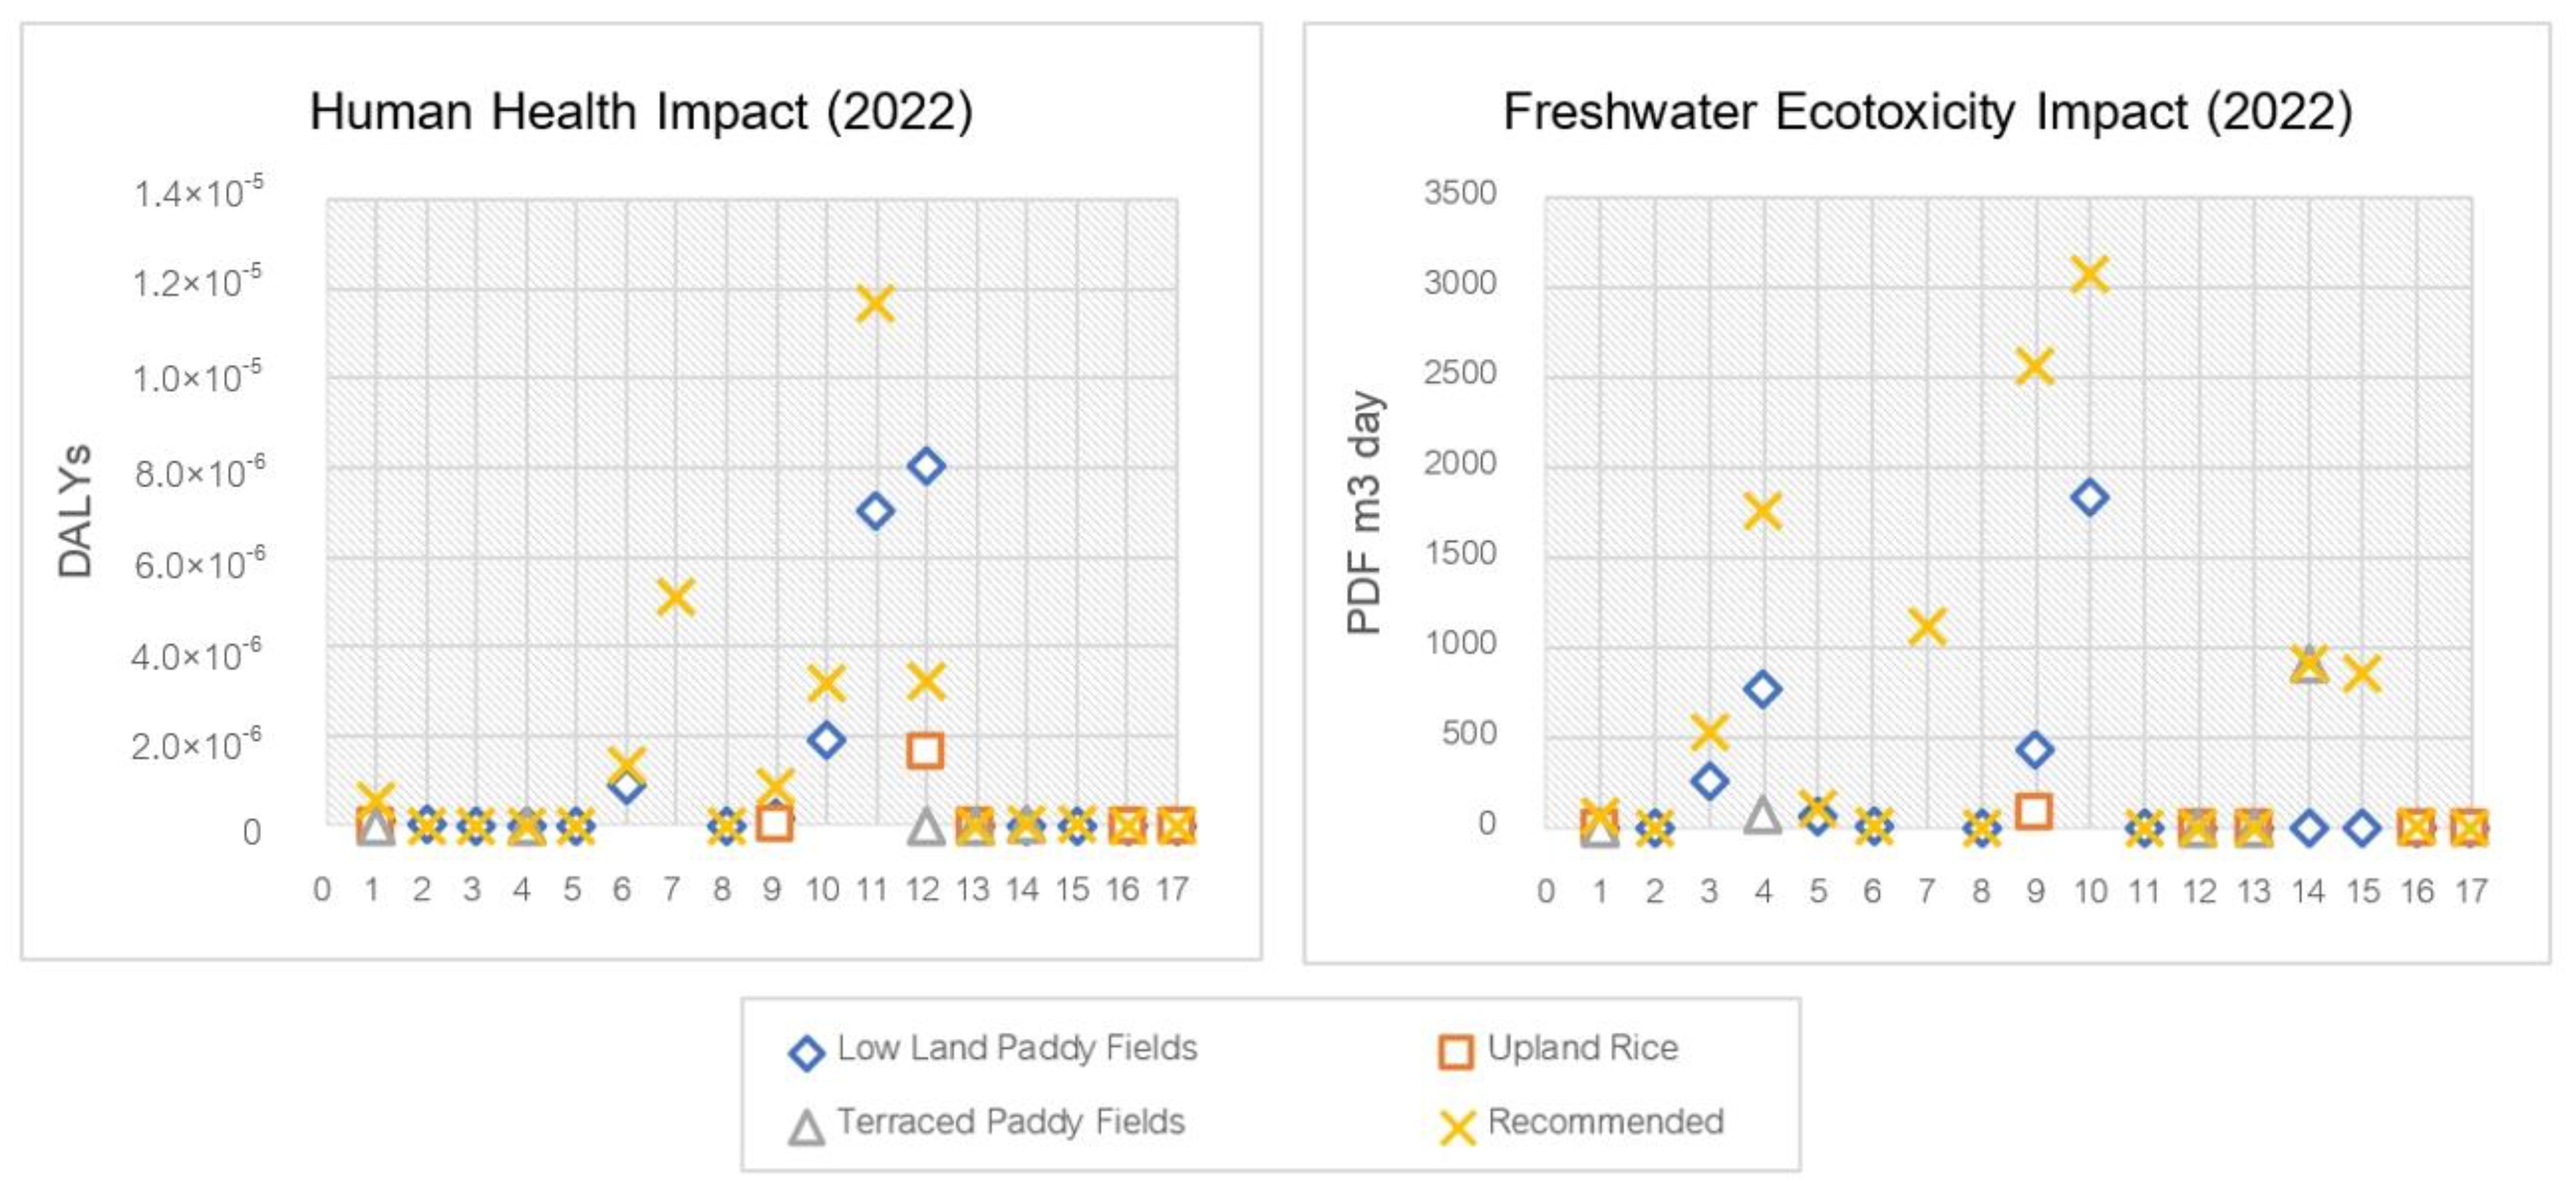
3.6. Toxicity from Pesticide Usage

The most noticeable impact on the amount of pesticide use was in lowland rice fields. The average impact score of pesticide use in rice cultivation showed that acephate had the greatest human health impact (non-cancer) at 9.39 × 10⁻⁶ DALYs, followed by atrazine at 1.76 × 10⁻⁶ DALYs and 2,4-D at 7.36 × 10⁻⁶ DALYs, respectively. On the other hand, atrazine showed a higher health impact (cancer) (6.46 × 10⁻⁶ DALYs) than acephate (1.44 × 10⁻⁸ DALYs). However, if pesticides do not show cancer and non-cancer health effects, it does not mean that these pesticides do not have that effect, as toxicological data may not be able to indicate such effects due to the lack of toxicological data on individual substances. Specifically, for their health effects, only two pesticides, atrazine and acephate, have toxicological data in the USEtox database. In upland rice and terraced rice systems, pesticides are not used as much, and therefore, the effects may not be apparent. In addition, the use of pesticides by most farmers did not exceed the recommendations on the packaging, resulting in low health effects.
In lowland rice fields, atrazine also showed the most freshwater ecotoxicity impact at 1702.79 PDF.m3.day due to specific toxicity data and the amount of substance used by farmers, followed by alachlor at 686.17 PDF.m3.day and mancozeb at 429.16 PDF.m3.day, respectively. In upland rice areas, carbendazim had the highest freshwater ecotoxicity impact at 1522.18 PDF.m3.day; as with the terraced rice farming, carbendazim also shows the highest toxicity at 1217.75 PDF.m3.day, followed by mancozeb at 429.16 PDF.m3.day, respectively. The human health and freshwater ecotoxicity impacts of rice cultivation (2020) are shown in Figure 2. However, the health impacts between cancer and non-cancer were calculated separately. The non-cancer health impacts were considered with NOEL (no observable effect level) or LOEL (lowest-observed effect level) to ED50 (effective dose at 50%), which differed from the cancer effect that was determined by a separate dose–response curve, depending on each of the toxicology test results for each substance.
In 2021, the amount of pesticide used in each area changed, resulting in increased health impacts from the use of certain substances shown in Figure 3. Fipronil showed the most pronounced health impact (non-cancer) at 1.28 × 10⁻⁵ DALYs in both the lowland rice fields and terraced rice, followed by acephate (8.05 × 10⁻⁶ DALYs) and atrazine (1.77 × 10⁻⁶ DALYs), respectively. For cancer effects, atrazine (6.51 × 10⁻⁶ DALYs) also showed a greater effect than acephate (1.23 × 10⁻⁸ DALYs).
The freshwater ecotoxicity impact was more apparent in 2020, when initiating the use of certain pesticides, especially fipronil and cypermethrin, increased their impacts. In lowland rice fields, fipronil showed the greatest effect at 2801.46 PDF.m3.day, followed by atrazine at 1717.44 PDF.m3.day and alachlor at 777.19 PDF.m3.day, respectively. The freshwater ecotoxicity impact in the upland rice area stands out from the use of cypermethrin (2564.41 PDF.m3.day) and carbendazim (913.31 PDF.m3.day). In terraced rice farming, fipronil showed the highest freshwater ecotoxicity impact at 2801.46 PDF.m3.day, followed by cypermethrin at 2137.00 PDF.m3.day and carbendazim at 1522.18 PDF.m3.day, respectively.
In 2022, the health impacts were still quite pronounced in lowland rice fields. Acephate showed the greatest health impact (non-cancer) at 8.05 × 10⁻⁶ DALYs, followed by atrazine at 1.91 × 10⁻⁶ DALYs and 2,4-D dimethyl ammonium at 8.93 × 10⁻⁷ DALYs, respectively. For cancer effects, atrazine also shows a greater effect than acephate at 7.00 × 10⁻⁶ DALYs and 1.23 × 10⁻⁸ DALYs, respectively. In upland rice, acephate shows the most obvious health effects (non-cancer) at 1.61 × 10⁻⁶ DALYs. In terraced rice farming, the health impact was not clearly demonstrated compared to the other areas.
For freshwater ecotoxicity, lowland rice fields still had the greatest impact due to the intensive use of pesticides by farmers compared to the other areas. Atrazine revealed the greatest impact at 1845.60 PDF.m3.day, followed by alachlor at 764.58 PDF.m3.day and mancozeb at 429.16 PDF.m3.day, respectively. The use of carbendazim in terraced rice farming resulted in a more pronounced effect than other substances at 913.31 PDF.m3.day. However, the upland rice area has less freshwater ecotoxicity impact compared to other areas. The health and freshwater ecotoxicity impacts in 2022 are shown in Figure 4.

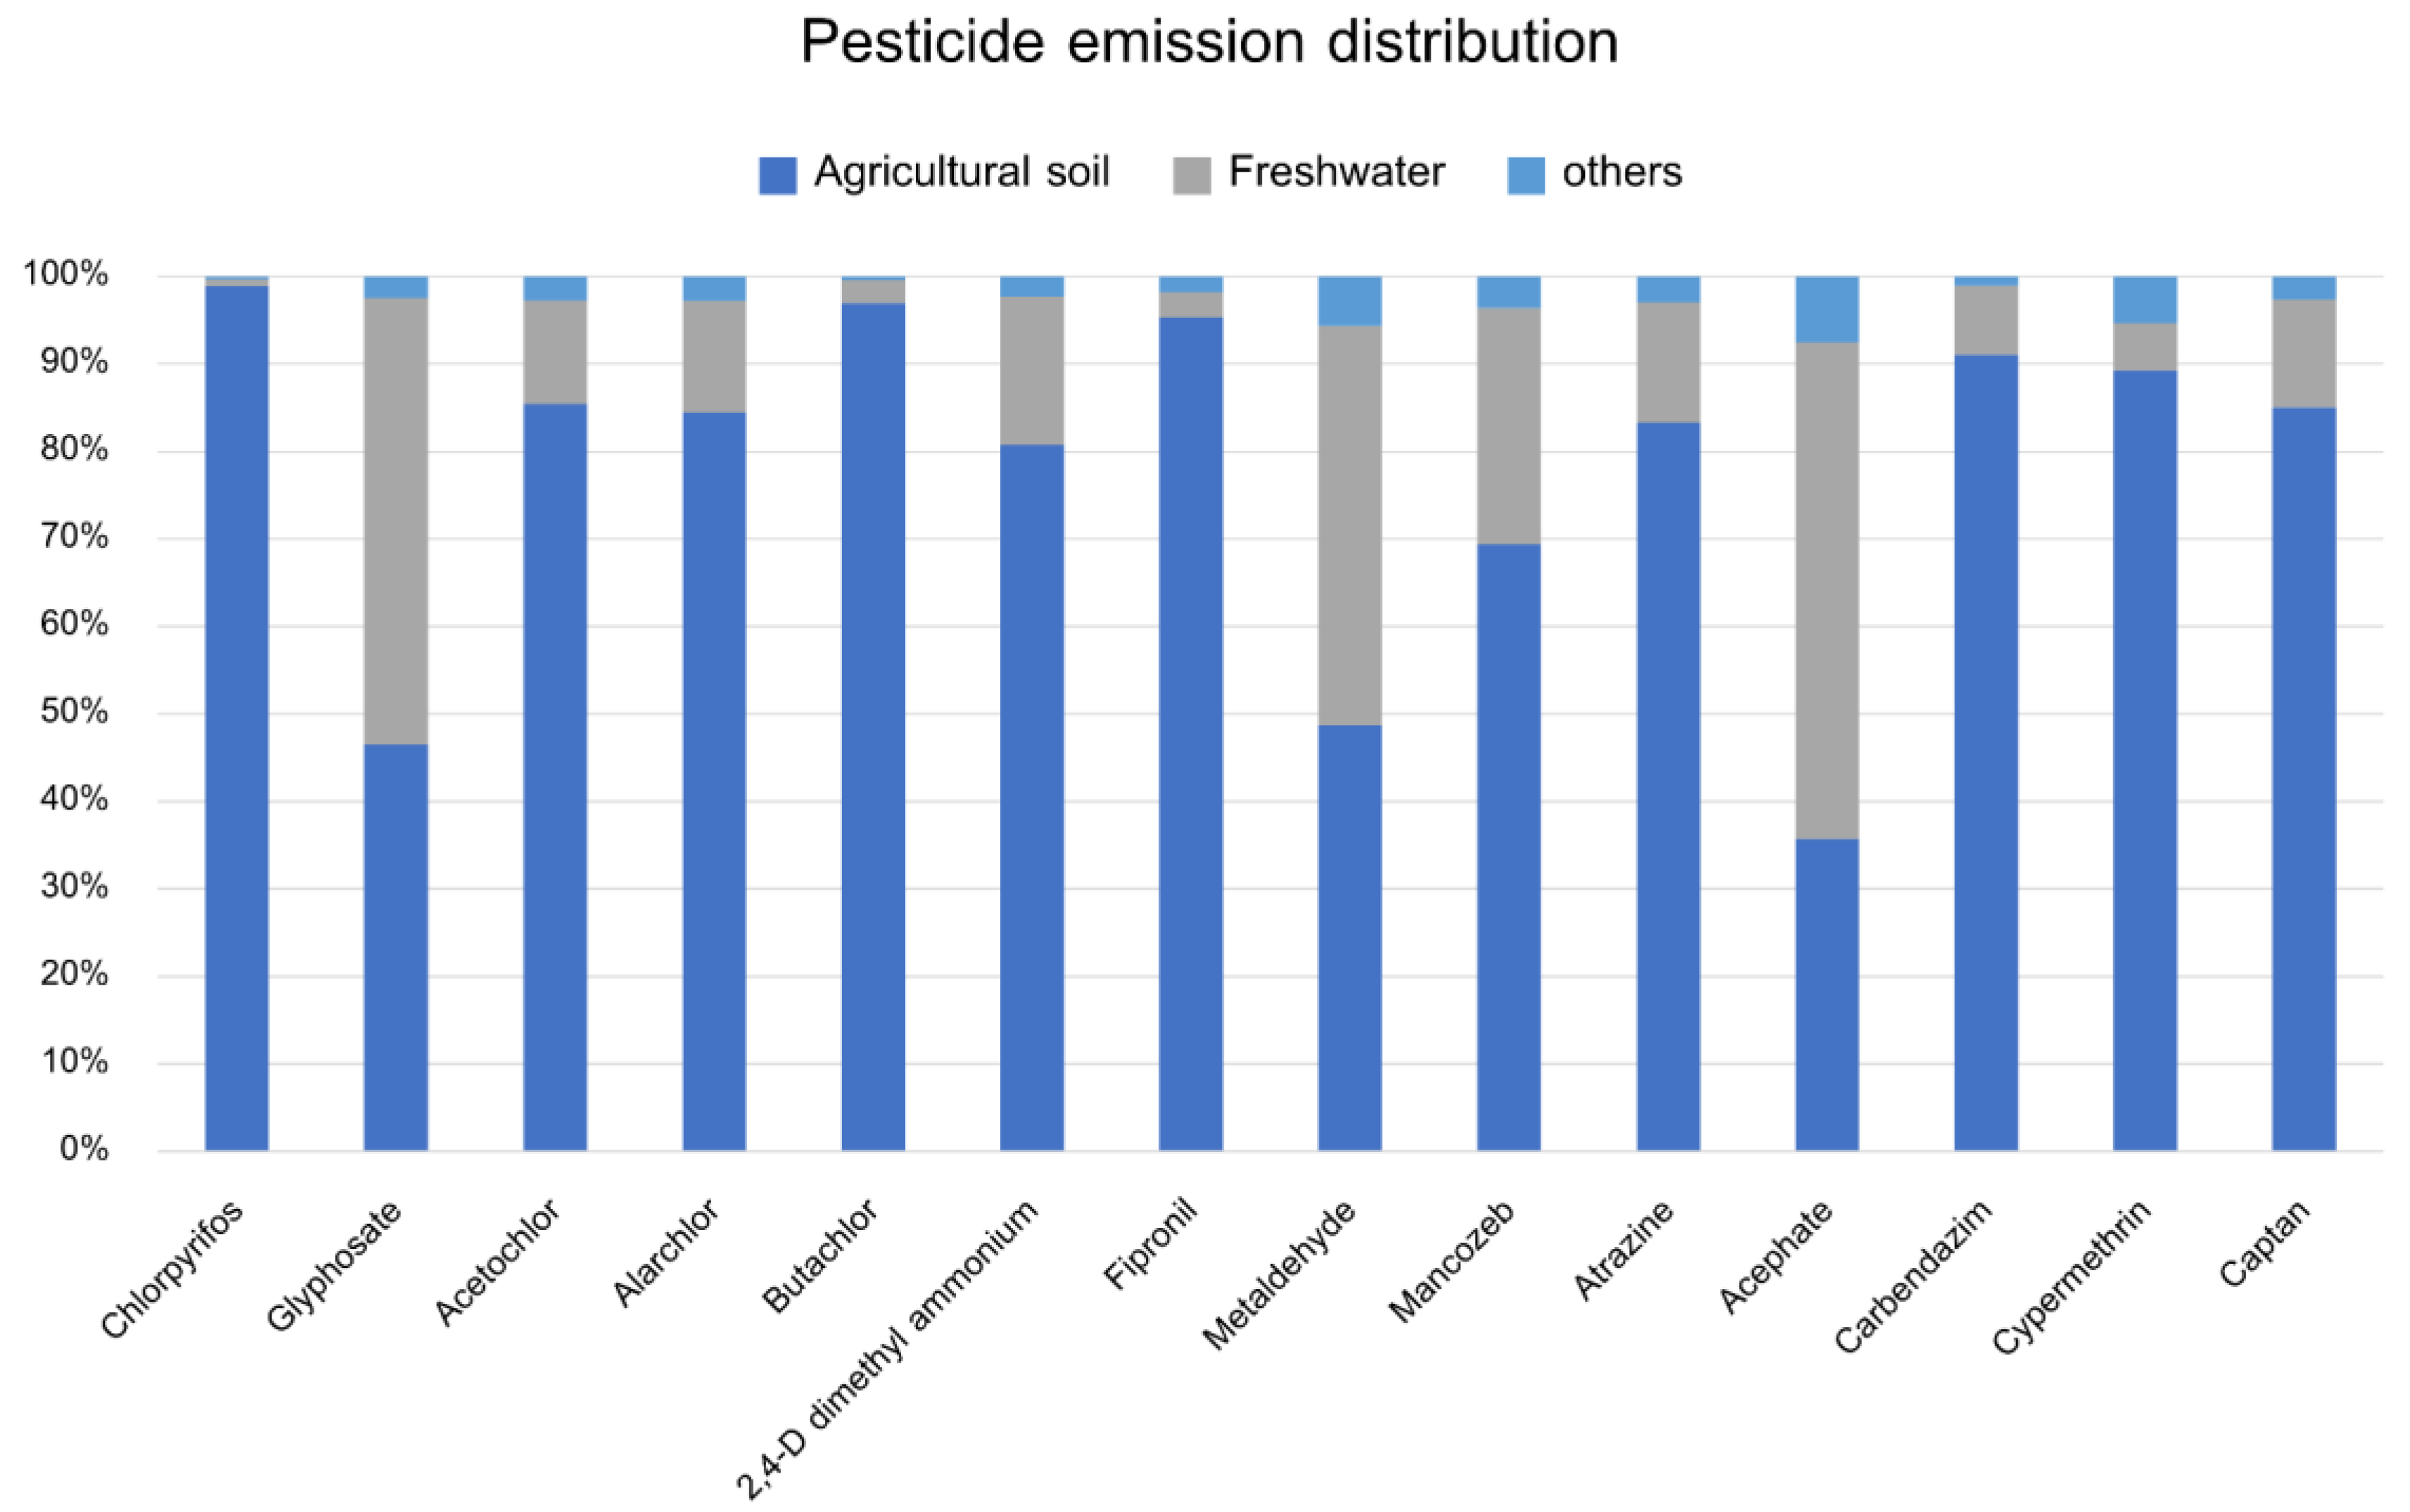
3.7. Pesticide Emission Distribution

The emission distribution of each pesticide after being released from the agricultural soil is shown in Figure 5. The USEtox model demonstrates that the distribution of pesticides to various environmental media, especially the distribution into freshwater, has been linked to ecotoxicity, coupled with the chemical properties of the compounds. The results showed that most of the pesticides remaining in agricultural soils were chlorpyrifos (98.88%), butachlor (96.94%), and fipronil (95.33%), respectively. The substances with the greatest distributions in freshwater were acephate (56.74%), glyphosate (50.90%), and metaldehyde (45.65%), respectively.

4. Discussion

4.1. Environmental Impact under Different Rice Cultivation Systems

The more agricultural inputs were used, the higher GHG emissions were generated, which was the case in the present study. Lowland rice cultivation used the largest agricultural inputs compared to the other two rice systems, especially using gasoline and chemical fertilizers, whereas the lowest usage of inputs was found in upland rice cultivation (Table 1). This is because lowland rice is generally practiced as intensive cultivation in flat areas, aiming for maximum economic benefit, whereas upland rice was grown for household consumption. As also presented in Table 3, chemical fertilizers contributed to the highest GHG emission compared to the other inputs at the raw materials production stage, obviously in lowland rice cultivation. Similarly, herbicides and pesticides generated the second and third places in contributing GHG emissions in lowland rice and terraced rice at the raw materials production stage, which is consistent with the studies of Khoshnevisan et al. [9] and Arunrat et al. [42].
Under the anaerobic conditions of flooded paddy fields, the organic matter decomposition by methanogenic bacteria causes CH4 emission [43]. It is found in lowland and terraced rice cultivation systems in the present study, where CH4 emission was generated at the highest level compared to the other activities, whereas zero CH4 emission was produced from upland rice fields due to cultivation in dryland areas (Table 3). Alam et al. [44] also reported that roughly 60% of the total GHG emissions from rice production were CH4 due to continuously flooded conditions. However, this condition can prevent weed growth and water stress in paddy fields [15], as well as increase sequestered SOC [45]. N2O emissions are largely emitted from using chemical fertilizers [46], which is in line with the findings of the present study (Table 3). In the net GHG emission, lowland rice cultivation generated the highest GHG emissions, followed by the terraced and upland rice cultivation systems, which is similar to the rice yield (Table 3). This is because practicing intensive cultivation as lowland rice farming can promote a high yield by using chemical fertilizers to enhance plant growth and applying pesticides and herbicides to prevent weed and pest damage.
Terraced rice cultivation has the highest carbon footprint intensity (1.15 kg CO2eq kg−1 rice yield), while the lowest was detected in upland rice (0.17 kg CO2eq kg−1 rice yield) (Table 3). A study by Champrasert et al. [47] estimated the carbon footprint intensity of upland rice in Karen and Lawa tribes in Northern Thailand, with the values of 0.13 and 0.19 kg CO2eq kg−1 nonmilled rice, respectively. As suggested by several studies [10,13,14,15,48,49], accounting for SOC sequestration in the carbon footprint calculation can increase the accuracy of the net carbon footprint, because farming practices directly affect soil carbon changes. This is also evidenced in the present study that SOC sequestration (ΔSOCS) increased during the study period (Table 2). Adamu et al. [50] mentioned that even a small increase in SOC stock can play an important role in GHG reduction in the atmosphere. Similar to the study by Pan et al. [11], paddy fields have a higher potential to store carbon in the soil than croplands due to the inputs from rice residue, turnover of roots, and root exudates [51]. Therefore, the present study also suggests including the change of SOC sequestration for estimating the carbon footprint of crop production.
The WF is an effective indicator for measuring the direct and indirect water use in the life cycle of a product. Lowland rice generated the significantly highest total WF compared to terraced and upland rice systems, especially blue and gray WFs (p < 0.05) (Table 4) because of the higher use of irrigation water, chemical fertilizers, herbicides, and pesticides. This is consistent with the studies of Galloway and Cowling [52] and Benbi [53]. Increasing the yield and reducing fertilizer, herbicide, and pesticide applications can significantly reduce the total WF, which is supported by the studies of Huang et al. [54] and Zhuo et al. [55].

4.2. Human and Ecotoxicological Impacts under Different Rice Cultivation Systems

This study found that trends in health and environmental impacts were unclear over the three-year study. Additionally, the types of pesticides and amounts used vary from year to year. Regarding health impacts, acephate and atrazine demonstrated more pronounced cancer and non-cancerous health impacts than the other pesticides. The non-cancerous health impacts are expressions of the health effects demonstrated by an in vitro toxicology test; considering the effect of the intake dose on the target organs that have not been shown, they potentially cause tumors or cancer cells. The quantitative relationship between doses and chemicals that enter the body through various channels (ingestion and inhalation) can cause incidences of adverse health effects. For freshwater ecotoxicity, atrazine and alachlor are pesticides that should be monitored, as they have shown relatively high impacts (e.g., affects the lipid peroxidation and antioxidant enzyme system on Channa punctatus and inhibits the synthesis of long-chain fatty acids [56,57]), the same applies to carbendazim, because two-thirds of the rice planting area started using it in 2021–2022, showing a relatively high impact on freshwater ecotoxicity. Fipronil and cypermethrin are not used in rice cultivation every year, but studies show that their impact on health and freshwater ecotoxicity is quite high compared to other substances in this study, and they are other substances that should be considered if needed in the future. Fipronil can cause neurodegenerative disorders [58] and also affect aquatic ecosystems by affecting the behavior, regeneration, and reproduction of Girardia tigrina in water when exposed to chronic exposure [59]. In addition, cypermethrin ecotoxicity demonstrates potential hazards on several fish species (e.g., neurotoxicity, endocrine disruption, effects on proximate body composition, and oxidative stress injury) [60]. The freshwater ecotoxicity impact refers to the fraction of a chemical dissolved in freshwater causing the expression of the effect (EC50: effect concentration, a statistical consideration to estimate the effect 50% of a population (e.g., fish) is affected (e.g., died) in the laboratory, HC50: hazardous concentration of a chemical which 50% of species exposed to a concentration above their EC50, PNEC: predicted no effect concentration, NOEC: no observed effect concentration, etc.). Toxicological values in experimental animals will use the geometric mean of all test species depending on the model database [61]. Although most farmers in the three rice cultivation systems used pesticides according to the instructions on the packaging, the predictive modeling of impacts may further determine the trade-offs between pesticide efficacy and toxicity for both health and the environment.
The proportion of distribution into different media depends on the chemical properties of the substance. These data are obtained from the model’s calculations in steady conditions. The state depends on the chemical properties of each substance, such as molecular mass, partitioning coefficient, solubility (Kow), the partitioning coefficient between organic carbon and water (Koc), and Henry’s law constant, among others. Some substances, such as chlorpyrifos, have low Henry’s law constants, resulting in a proportional variation of their aqueous releases [62]. However, the efficacy of the measure is unclear, because other factors are difficult to determine. The efficacy and spread of pesticides depend on many factors, such as the amount of application in each area, the time of use, and the environmental conditions, including different soil conditions. The adhesion to soil particles is completely different in each soil type with different properties. The pH value is especially related to the degradation of pesticides, which affects the persistence of pesticides in the soil [63]. In addition, the persistence of pesticides depends on the combination of organic matter content and cation exchange capacity, among other factors [64].
However, the limitation of the USEtox model should be mentioned for future development. The life cycle assessment (LCA) and risk assessment are methodologically constrained methods, as they cannot be replicated in some complex environments, such as the breakdown of pesticide active ingredients (metabolism). The effects of a single substance at a steady state can be assessed in the USEtox model. The interaction effects between many chemicals and their metabolisms cannot be considered. The USEtox model considers two main exposure pathways: ingestion and inhalation exposure pathways. Exposure due to the proximity to sources such as farmers spraying pesticides and dermal channels, which are attractive exposure pathways, were not considered. In addition, the USEtox model evaluated the human carcinogenic and noncarcinogenic effects separately, which could not determine the specific illnesses directly related to the pesticide (e.g., lung cancer). The effectiveness of pesticides is influenced by other factors, such as time and level of pesticide application and environmental conditions, such as the characteristics of different soil types in each area, as well as chemical factors (e.g., soil pH and organic matter, among others). We acknowledge that the model depends on the uncertainty of the data, so laboratory results or field experiments are essential to test the robustness of each pesticide model in different cultivation areas. Some pesticides have no toxicological data, and, therefore, could not be calculated in this study, which was another limitation. This study examined the emission pathways of pesticides to agricultural soils, and future studies may use other models that could link the assumptions together to account for other environmental aspects.

5. Conclusions

The more agricultural inputs, particularly chemical fertilizers, herbicides, and pesticides, that were used, the more carbon footprint and gray WF were generated. Lowland rice production had the highest net GHG emissions due to intensive practices, followed by terraced and upland rice cultivation systems. In contrast, terraced and upland rice cultivation were grown relying on natural conditions and produced for household consumption. Similarly, the highest WF was found in lowland rice fields compared to terraced and upland rice systems due to the higher use of irrigation water, chemical fertilizers, herbicides, and pesticides. Alachlor, atrazine, and 2,4-D dimethyl ammonium were the top three pesticides used during the studied periods. Acephate and atrazine demonstrated more pronounced cancerous and non-cancerous health impacts than other pesticides. Meanwhile, atrazine, alachlor, and carbendazim should be monitored as relatively high freshwater impacts. The lowland rice fields had the most impacts on human health and freshwater ecotoxicity, followed by the terraced and upland rice cultivation systems. This study indicated that relying on nature-based resources for cultivation as upland rice consumed less anthropogenic sources, resulting in low environmental, human, and ecotoxicological impacts. Overall, the use of pesticides in the studied areas did not exceed the recommendations on the packaging, resulting in low health effects.

Author Contributions

Conceptualization, P.T., N.A. and S.S.; methodology, P.T. and N.A.; investigation, P.T. and N.A.; writing—original draft preparation, P.T., N.A. and S.S.; writing—review and editing, P.T. and N.A.; and supervision, N.A. and S.S. All authors have read and agreed to the published version of the manuscript.

Funding

This work (Grant No. RGNS 64-153) was supported by the Office of the Permanent Secretary, Ministry of Higher Education, Science, Research and Innovation (OPS MHESI), Thailand Science Research and Innovation (TSRI) and Mahidol University.

Institutional Review Board Statement

The study was conducted according to the guidelines of the Declaration of Helsinki and approved by the Institutional Review Board of Institute for Population and Social Research, Mahidol University (IPSR-IRB), COA. No. 2019/05-154 and COA. No. 2022/03-059.

Informed Consent Statement

Written informed consent was obtained from all subjects involved in the study.

Data Availability Statement

Not applicable.

Acknowledgments

We would like to thank the Office of the Permanent Secretary, Ministry of Higher Education, Science, Research and Innovation (OPS MHESI), Thailand Science Research and Innovation (TSRI) and Mahidol University for the funding support (Grant No. RGNS 64-153). Furthermore, the authors would like to thank the Thailand Science Research and Innovation (TSRI) and Office of the Higher Education Commission (OHEC) (grant number MRG 6280146) for providing the data.

Conflicts of Interest

The authors declare no conflict of interest.

References

  1. Arunrat, N.; Pumijumnong, N.; Sereenonchai, S.; Chareonwong, U.; Wang, C. Comparison of GHG emissions and farmers’ profit of large-scale and individual farming in rice production across four regions of Thailand. J. Clean. Prod. 2021, 278, 123945. [Google Scholar] [CrossRef]
  2. Arunrat, N.; Sereenonchai, S.; Kongsurakan, P.; Hatano, R. Assessing Soil Organic Carbon, Soil Nutrients and Soil Erodibility under Terraced Paddy Fields and Upland Rice in Northern Thailand. Agronomy 2022, 12, 537. [Google Scholar] [CrossRef]
  3. Mie, A.; Andersen, H.R.; Gunnarsson, S.; Kahl, J.; Kesse-Guyot, E.; Rembiałkowska, E.; Quaglio, G.; Philippe Grandjean, P. Human health implications of organic food and organic agriculture: A comprehensive review. Environ. Health 2017, 16, 111. [Google Scholar] [CrossRef] [PubMed]
  4. Jolodar, N.R.; Karimi, S.; Bouteh, E.; Balist, J.; Prosser, R. Human health and ecological risk assessment of pesticides from rice production in the Babol Roud River in Northern Iran. Sci. Total Environ. 2021, 772, 144729. [Google Scholar] [CrossRef] [PubMed]
  5. Wiedmann, T.; Minx, J. A definition of “carbon footprint”. In Ecological Economics Research Trends; Pertsova, C.C., Ed.; Nova Science Publishers: Hauppauge, NY, USA, 2008; pp. 1–11. [Google Scholar]
  6. Ding, Y.; Liu, Y.X.; Wu, W.X.; Shi, D.Z.; Yang, M.; Zhong, Z.K. Evaluation of biochar effects on nitrogen retention and leaching in multi-layered soil columns. Water Air Soil Pollut. 2010, 213, 47–55. [Google Scholar] [CrossRef]
  7. Koga, N. Nitrous oxide emissions under a four-year crop rotation system in northern Japan: Impacts of reduced tillage, composted cattle manure application and increased plant residue input. Soil Sci. Plant. Nutr. 2013, 59, 56–68. [Google Scholar] [CrossRef]
  8. Smith, K.A.; Ball, T.; Conen, F.; Dobbie, K.E.; Massheder, J.; Rey, A. Exchange of Greenhouse Gases between Soil and Atmosphere: Interactions of Soil Physical Factors and Biological Processes. Eur. J. Soil Sci. 2018, 69, 10–20. [Google Scholar] [CrossRef]
  9. Khoshnevisan, B.; Rafiee, B.; Omid, M.; Mousazadeh, H. Prognostication of environmental indices in potato production using artificial neural networks. J. Clean. Prod. 2013, 52, 402–409. [Google Scholar] [CrossRef]
  10. Lal, R. Soil carbon sequestration to mitigate climate change. Geoderma 2004, 123, 1–22. [Google Scholar] [CrossRef]
  11. Pan, G.; Li, L.; Wu, L.; Zhang, X. Storage and sequestration potential of topsoil organic carbon in China’s paddy soils. Glob. Chang. Biol. 2004, 10, 79–92. [Google Scholar] [CrossRef]
  12. Arunrat, N.; Kongsurakan, P.; Sereenonchai, S.; Hatano, R. Soil Organic Carbon in Sandy Paddy Fields of Northeast Thailand: A Review. Agronomy 2020, 10, 1061. [Google Scholar] [CrossRef]
  13. Arunrat, N.; Sereenonchai, S.; Wang, C. Carbon footprint and predicting the impact of climate change on carbon sequestration ecosystem services of organic rice farming and conventional rice farming: A case study in Phichit province, Thailand. J. Environ. Manag. 2021, 289, 112458. [Google Scholar] [CrossRef] [PubMed]
  14. Gan, Y.; Liang, C.; Chai, Q.; Lemke, R.L.; Campbell, C.A.; Zentner, R.P. Improving farming practices reduces the carbon footprint of spring wheat production. Nat. Commun. 2014, 5, 5012. [Google Scholar] [CrossRef]
  15. Arunrat, N.; Sereenonchai, S.; Chaowiwat, W.; Wang, C.; Hatano, R. Carbon, Nitrogen and Water Footprints of Organic Rice and Conventional Rice Production over 4 Years of Cultivation: A Case Study in the Lower North of Thailand. Agronomy 2022, 12, 380. [Google Scholar] [CrossRef]
  16. Hoekstra, A.Y. 2003 Virtual Water Trade. In Proceedings of the International Expert Meeting on Virtual Water Trade, Delft, The Netherlands, 12–13 December 2002. [Google Scholar]
  17. Hoekstra, A.Y.; Chapagain, A.K. Water footprints of nations: Water use by people as a function of their consumption pattern. Water Resour. Manag. 2010, 21, 35–48. [Google Scholar] [CrossRef]
  18. Hoekstra, A.Y.; Chapagain, A.K.; Aldaya, M.M.; Mekonnen, M.M. The Water Footprint Assessment Manual: Setting the Global Standard; Earthscan: London, UK, 2011. [Google Scholar]
  19. Ogbeide, O.; Tongo, I.; Ezemonye, L. Assessing the distribution and human health risk of organochlorine pesticide residues in sediments from selected rivers. Chemosphere 2016, 144, 1319–1326. [Google Scholar] [CrossRef] [PubMed]
  20. Silva, V.; Mol, H.G.J.; Zomer, P.; Tienstra, M.; Ritsema, C.J.; Geissen, V. Pesticide residues in European agricultural soils—A hidden reality unfolded. Sci. Total Environ. 2019, 653, 1532–1545. [Google Scholar] [CrossRef]
  21. Safi, J.M. Association between chronic exposure to pesticides and recorded cases of human malignancy in Gaza Governorates (1990–1999). Sci. Total Environ. 2002, 284, 75–84. [Google Scholar] [CrossRef]
  22. Ghafouri-Khosrowshahi, A.; Ranjbar, A.; Mousavi, L.; Nili-Ahmadabadi, H.; Ghaffari, F.; Zeinvand-Lorestani, H.; Nili-Ahmadabadi, A. Chronic exposure to organophosphate pesticides as an important challenge in promoting reproductive health: A comparative study. J. Educ. Health Promot. 2019, 8, 149. [Google Scholar]
  23. Murray, C.J.L.; Lopez, A.D.; Jamison, D.T. The global burden of disease in 1990: Summary results, sensitivity analysis and future directions. Bull. World Health Organ. 1994, 72, 495–509. [Google Scholar]
  24. Verones, F.; Moran, D.; Stadler, K.; Kanemoto, K.; Wood, R. Resource footprints and their ecosystem consequences. Sci. Rep. 2017, 7, 40743. [Google Scholar] [CrossRef] [PubMed]
  25. Thanapakpawin, P.; Richey, J.; Thomas, D.; Rodda, S.; Campbell, B.; Logsdon, M. Effects of landuse change on the hydrologic regime of the Mae Chaem river basin. NW Thailand J. Hydrol. 2007, 334, 215–230. [Google Scholar] [CrossRef]
  26. Walker, A.; Forests and Water in Northern Thailand. Resource Management in Asia-Pacific Program (RMAP), Division of Pacific and Asian History, Research School for Pacific and Asian Studies. 2004. Available online: https://openresearch-repository.anu.edu.au/handle/1885/40985 (accessed on 20 September 2022).
  27. Arunrat, N.; Sereenonchai, S.; Hatano, R. Impact of burning on soil organic carbon of maize-upland rice system in Mae Chaem Basin of Northern Thailand. Geoderma 2021, 392, 115002. [Google Scholar] [CrossRef]
  28. Land Development Department (LDD). Preliminary Study on Highland Development Project in Northern Thailand; Soil Survey Division, Land Development Department, Ministry of Agriculture and Cooperatives: Bangkok, Thailand, 1992. (In Thailand)
  29. Mae Chaem Watershed Research Station. Mae Chaem Watershed. 2010. Available online: http://www.dnp.go.th/watershed/research/mj_station.htm (accessed on 25 June 2018). (In Thailand).
  30. Walkley, A.; Black, J.A. An examination of the dichromate method for determining soil organic matter and a proposed modification of the chromic acid titration method. Soil Sci. 1934, 37, 29–38. [Google Scholar] [CrossRef]
  31. Ellert, B.H.; Bettany, J.R. Calculation of organic matter and nutrients stored in soils under contrasting management regimes. Can. J. Soil Sci. 1995, 75, 529–538. [Google Scholar] [CrossRef]
  32. IPCC (Intergovernmental Panel on Climate Change). 2019 Refinement to the 2006 IPCC Guidelines for National Greenhouse Gas Inventories; Calvo Buendia, E., Tanabe, K., Kranjc, A., Baasansuren, J., Fukuda, M., Ngarize, S., Osako, A., Pyrozhenko, Y., Shermanau, P., Federici, S., Eds.; Intergovernmental Panel on Climate Change (IPCC): Geneva, Switzerland, 2019. [Google Scholar]
  33. IPCC. Climate Change 2013: The Physical Science Basic Contribution of Working Group 1 to the Fifth Assessment Report of the Intergovernmental Panel on Climate Change; Cambridge University Press: Cambridge, UK, USA, 2013. [Google Scholar]
  34. Yin, W.; Chai, Q.; Fan, Z.; Hu, F.; Fan, H.; Guo, Y.; Zhao, C.; Yu, A. Energy budgeting, carbon budgeting, and carbon footprints of straw and plastic film management for environmentally clean of wheat-maize intercropping system in northwestern China. Sci. Total Environ. 2022, 826, 154220. [Google Scholar] [CrossRef] [PubMed]
  35. Allan, J.A. Virtual water: A strategic resource global solutions to regional deficits. Ground Water 1998, 36, 545–546. [Google Scholar] [CrossRef]
  36. Hoekstra, A.Y.; Hung, P.Q. Virtual water trade. A quantification of virtual water flows between nations in relation to international crop trade. Value Water Res. Rep. Ser. 2002, 11, 166. [Google Scholar]
  37. Hoekstra, A.Y.; Chapagain, A.K. Globalization of Water: Sharing the Planet’s Freshwater Resources; Blackwell Publishing: Oxford, UK, 2008. [Google Scholar]
  38. Mekonnen, M.M.; Hoekstra, A.Y. Global gray water footprint and water pollution levels related to anthropogenic nitrogen loads to fresh water. Environ. Sci. Technol. 2015, 49, 12860–12868. [Google Scholar] [CrossRef]
  39. IPCC. 2006 IPCC Guidelines for National Greenhouse Gas Inventories, Prepared by the National Greenhouse Gas Inventories Programme; Eggleston, H.S., Buendia, L., Miwa, K., Ngara, T., Tanabe, K., Eds.; IGES: Hayama, Japan, 2006. [Google Scholar]
  40. Pollution Control Department. The Quality of Surface Water Standard; Ministry of Natural Resources and Environment: Bangkok, Thailand, 1994. Available online: http://infofile.pcd.go.th/law/3_14_water.pdf (accessed on 7 September 2019). (In Thailand)
  41. Rosenbaum, R.K.; Bachmann, T.M.; Gold, L.S.; Huijbregts, M.A.J.; Jolliet, O.; Juraske, R.; Koehler, A.; Larsen, H.F.; MacLeod, M.; Margni, M.; et al. USEtox—The UNEP-SETAC toxicity model: Recommended characterisation factors for human toxicity and freshwater ecotoxicity in life cycle impact assessment. Int. J. Life Cycle Assess. 2008, 13, 532–546. [Google Scholar] [CrossRef]
  42. Arunrat, N.; Wang, C.; Pumijumnong, N. Alternative cropping systems for greenhouse gases mitigation in rice field: A case study in Phichit province of Thailand. J. Clean. Prod. 2016, 133, 657–671. [Google Scholar] [CrossRef]
  43. Adhya, T.K.; Rath, A.K.; Gupta, P.K.; Rao, V.R.; Das, S.N.; Parida, K.M.; Parashar, D.C.; Sethunathan, N. Methane emission from flooded rice fields under irrigated conditions. Biol. Fertil. Soils 1994, 18, 245–248. [Google Scholar] [CrossRef]
  44. Alam, M.K.; Biswas, W.K.; Bell, R.W. Greenhouse gas implications of novel and conventional rice production technologies in the Eastern-Gangetic plains. J. Clean. Prod. 2016, 112, 3977–3987. [Google Scholar] [CrossRef]
  45. Sass, R.L. Spatial and temporal variability in methane emissions from rice paddies: Implications for assessing regional methane budgets. Nutr. Cycl. Agroecosyst. 2002, 64, 3–7. [Google Scholar] [CrossRef]
  46. Zhang, W.; Dou, Z.; He, P.; Ju, X.; Powlson, D.; Chadwick, D.; Norse, D.; Lu, Y.; Zhang, Y.; Wu, L. New technologies reduce greenhouse gas emissions from nitrogenous fertilizer in China. Proc. Natl. Acad. Sci. USA 2013, 110, 8375–8380. [Google Scholar] [CrossRef]
  47. Champrasert, P.; Sampattagul, S.; Yodkhum, S.; Wangpakapattanawong, P. Assessment of Carbon Footprint of Upland Rice Production in Northern Thailand. Chiang Mai Univ. J. Nat. Sci. 2020, 19, 427–446. [Google Scholar] [CrossRef]
  48. Adewale, C.; Reganold, J.P.; Higgins, S.; Evans, R.D.; Carpenter-Boggs, L. Improving carbon footprinting of agricultural systems: Boundaries, tiers, and organic farming. Environ. Impact Assess. Rev. 2018, 71, 41–48. [Google Scholar] [CrossRef]
  49. Alam, M.K.; Bell, R.W.; Biswas, W.K. Decreasing the carbon footprint of an intensive rice-based cropping system using conservation agriculture on the Eastern Gangetic Plains. J. Clean. Prod. 2019, 218, 259–272. [Google Scholar] [CrossRef]
  50. Adamu, H.; Umar, Y.A.; Akanang, H.; Sabo, A. Evaluation of Carbon Sequestration Potential of Soils—What Is Missing? J. Geosci. Environ. Prot. 2021, 9, 39–47. [Google Scholar] [CrossRef]
  51. Freibauer, A.; Rounsevell, M.D.A.; Smith, P.; Verhagen, J. Carbon sequestration in agricultural soils of Europe. Geoderma 2004, 122, 1–23. [Google Scholar] [CrossRef]
  52. Galloway, J.N.; Cowling, E.B. Reactive nitrogen and the world: 200 years of change. Ambio 2002, 31, 64–71. [Google Scholar] [CrossRef] [PubMed]
  53. Benbi, D.K. Carbon footprint and agricultural sustainability nexus in an intensively cultivated region of Indo-Gangetic Plains. Sci. Total Environ. 2018, 644, 611–623. [Google Scholar] [CrossRef]
  54. Huang, J.; Xu, C.; Ridoutt, B.G.; Chen, F. Reducing Agricultural Water Footprints at the Farm Scale: A Case Study in the Beijing Region. Water 2015, 7, 7066–7077. [Google Scholar] [CrossRef] [Green Version]
  55. Zhuo, L.; Mekonnen, M.M.; Hoekstra, A.Y. The effect of inter-annual variability of consumption, production, trade and climate on crop-related green and blue water footprints and inter-regional virtual water trade: A study for China (1978–2008). Water Res. 2016, 94, 73–85. [Google Scholar] [CrossRef] [PubMed]
  56. Nwani, C.D.; Lakra, W.S.; Nagpure, N.S.; Kumar, R.; Kushwaha, B.; Srivastava, S.K. Toxicity of the herbicide atrazine: Effects on lipid peroxidation and activities of antioxidant enzymes in the freshwater fish Channa punctatus (Bloch). Int. J. Environ. Res. Public Health 2010, 7, 3298–3312. [Google Scholar] [CrossRef]
  57. Abigail, M.E.A.; Samuel, S.M.; Ramalingam, C. Addressing the environmental impacts of butachlor and the available remediation strategies: A systematic review. Int. J. Environ. Sci. Technol. 2015, 12, 4025–4036. [Google Scholar] [CrossRef]
  58. Koslowski, S.; Latapy, C.; Auvray, P.; Blondel, M.; Meijer, L. Long-term fipronil treatment induces hyperactivity in female mice. Int. J. Environ. Res. Public Health 2020, 17, 1579. [Google Scholar] [CrossRef] [PubMed]
  59. dos Reis, E.B.; Farnese, F.S.; Oliveira, M.S.; Rodrigues, A.C.M.; Dornelas, A.S.P.; Sarmento, R.A.; de Souza, J.C.P.; Resende, E.C.; Saraiva, A.S. Responses of Freshwater Planarian Girardia tigrina to Fipronil-Based Insecticide: Survival, Behavioral and Physiological Endpoints. Diversity 2022, 14, 698. [Google Scholar] [CrossRef]
  60. Farag, M.R.; Alagawany, M.; Bilal, R.M.; Gewida, A.G.A.; Dhama, K.; Abdel-Latif, H.M.R.; Amer, M.S.; Rivero-Perez, N.; Zaragoza-Bastida, A.; Binnaser, Y.S.; et al. An Overview on the Potential Hazards of Pyrethroid Insecticides in Fish, with Special Emphasis on Cypermethrin Toxicity. Animals 2021, 11, 1880. [Google Scholar] [CrossRef] [PubMed]
  61. Fantke, P.; Bijster, M.; Guignard, C.; Hauschild, M.Z.; Huijbregts, M.A.J.; Jolliet, O.; Kounina, A.; Magaud, V.; Margni, M.; McKone, T.E.; et al. USEtox 2.0: Documentation (Version 1). 2017. Available online: https://agris.fao.org/agris-search/search.do?recordID=FR2021087109 (accessed on 10 December 2022).
  62. Pennington, D.W.; Margni, M.; Ammann, C.; Jolliet, O. Multimedia fate and human intake modeling: Spatial versus nonspatial insights for chemical emissions in Western Europe. Environ. Sci. Technol. 2005, 39, 1119–1128. [Google Scholar] [CrossRef]
  63. Kah, M.; Beulke, S.; Brown, C.D. Factors influencing degradation of pesticides in soil. J. Agric. Food Chem. 2007, 55, 4487–4492. [Google Scholar] [CrossRef] [PubMed]
  64. Kodešová, R.; Kočárek, M.; Kodeš, V.; Drábek, O.; Kozák, J.; Hejtmánková, K. Pesticide adsorption in relation to soil properties and soil type distribution in regional scale. J. Hazard. Mater. 2011, 186, 540–550. [Google Scholar] [CrossRef] [PubMed]
Figure 1. Study area.
Ijerph 20 02738 g001
Figure 2. Human health and ecotoxicity impact scores on pesticide use in rice cultivation in 2020. 1. Chlorpyrifos, 2. Glyphosate, 3. Acephate, 4. Alachlor, 5. Butachlor, 6. 2,4-D dimethyl ammonium, 7. Fipronil, 8. Metaldehyde, 9. Mancozeb, 10. Atrazine, 11. Atrazine (cancer), 12. Acephate, 13. Acephate (cancer), and 14. Carbendazim.
Ijerph 20 02738 g002
Figure 3. Human health and ecotoxicity impact scores on pesticide use in rice cultivation in 2021. 1. Chlorpyrifos, 2. Glyphosate, 3. Acephate, 4. Alachlor, 5. Butachlor, 6. 2,4-D dimethyl ammonium, 7. Fipronil, 8. Metaldehyde, 9. Mancozeb, 10. Atrazine, 11. Atrazine (cancer), 12. Acephate, 13. Acephate (cancer), 14. Carbendazim, 15. Cypermethrin, 16. Captan, and 17. Captan (cancer).
Ijerph 20 02738 g003
Figure 4. Human health and ecotoxicity impact scores on pesticide use in rice cultivation in 2022. 1. Chlorpyrifos, 2. Glyphosate, 3. Acephate, 4. Alachlor, 5. Butachlor, 6. 2,4-D dimethyl ammonium, 7. Fipronil, 8. Metaldehyde, 9. Mancozeb, 10. Atrazine, 11. Atrazine (cancer), 12. Acephate, 13. Acephate (cancer), 14. Carbendazim, 15. Cypermethrin, 16. Captan, and 17. Captan (cancer).
Ijerph 20 02738 g004
Figure 5. Pesticide emission distribution.
Ijerph 20 02738 g005
Table 1. Input inventory of lowland, terraced, and upland rice systems during 2020–2022 (mean ± standard deviation).
InputUnitQuantity
LowlandTerracedUpland
Seedskg ha−1 crop−1137.5 ± 50.0 a112.5 ± 31.25 a125.00 ± 31.25 a
GasolineL ha−1 crop−1125.0 ± 43.75 a62.5 ± 31.25 b0
DieselL ha−1 crop−1156.25 ± 8.3 a125.0 ± 31.25 a0
Strawkg ha−1 crop−13474.4 ± 1250 a2618.5 ± 1250 b1316.7 ± 625 c
Manurekg ha−1 crop−11250 ± 312.5 a937.5 ± 187.5 a0
Laborman day−1 crop−14.0 ± 2.0 a5.0 ± 3.0 a3.0 ± 2.0 a
Fertilizer 16-20-0 kg ha−1 crop−1156.3 ± 85.2 a156.3 ± 75.3 a0
Fertilizer 16-16-8kg ha−1 crop−1125.0 ± 31.25 a125.0 ± 31.25 a62.5 ± 37.25 b
Fertilizer 46-0-0kg ha−1 crop−162.5 ± 37.2500
a–c represent significant differences in inputs among rice systems (p < 0.05).
Table 2. SOC stock at 0–30 cm, and the SOC sequestration rate from 2020–2022 (mean ± standard deviation).
Rice SystemSOC 2020
(kg C ha−1)
SOC 2021
(kg C ha−1)
SOC 2022
(kg C ha−1)
ΔSOCS
(kg C ha−1 year−1)
ΔSOCS
(kg CO2 ha−1 year−1)
Upland61,032.0 ± 1107 aA61,093.6 ± 1171 aA61,068.6 ± 867 aA36.6 ± 8.6 A134.3 ± 32.1 A
Terraced44,933.7 ± 1312 aB44,991.3 ± 1208 aB44,960.5 ± 1045 aB26.7 ± 10.1 A98.1 ± 38.9 A
Lowland32,751.7 ± 978 aC32,782.6 ± 1087 aC32,804.7 ± 1127 aC52.9 ± 12.2 B194.0 ± 45.1 B
a represents significant differences in SOC stocks among years 2020, 2021, and 2022 (p < 0.05). A–C represents significant differences in SOC stocks among rice systems (p < 0.05).
Table 3. GHG emissions of lowland, terraced, and upland rice systems during 2020–2022 (mean ± standard deviation).
Life Cycle StageRice System
LowlandTerracedUpland
Raw material production
(kg CO2eq ha−1 year−1)
Seeds24.5 ± 0.5 a22.3 ± 0.5 a31.3 ± 2.5 a
Gasoline58.7 ± 1.2 a22.1 ± 0.6 b0
Diesel38.5 ± 1.5 a17.8 ± 1.1 b0
Chemical fertilizers686.5 ± 181.5 a315.6 ± 93.6 b125.7 ± 24.6 c
Herbicides82.4 ± 10.3 a58.3 ± 8.5 b35.5 ± 5.5 c
Pesticides58.6 ± 7.6 a97.5 ± 10.1 b42.4 ± 8.4 a
Field emission
(kg CO2eq ha−1 year−1)
Gasoline312.4 ± 5.7 a167.5 ± 3.8 b0
Diesel257.7 ± 7.7 a113.1 ± 4.1 b0
Herbicides98.7 ± 0.7 a65.3 ± 1.1 b42.3 ± 0.4 c
Pesticides26.6 ± 1.4 a83.5 ± 1.7 b21.1 ± 0.6 a
CH4 2767.9 ± 1512.4 a2914.3 ± 1604.5 a0
N2O316.8 ± 21.3 a189.7 ± 15.4 b97.5 ± 11.3 c
Labor77.4 ± 5.4 a51.6 ± 3.8 b38.7 ± 10.4 c
Harvesting121.3 ± 15.200
Total GHG
(kg CO2eq ha−1 year−1)
4928.0 ± 2132.5 a4118.6 ± 1976.4 b434.5 ± 101.5 c
Net GHG emissions
(kg CO2eq ha−1 year−1)
4734.0 ± 1042.5 a4020.5 ± 867.5 b300.2 ± 87.6 c
Yield
(kg ha−1 year−1)
4632.5 ± 870.6 a3491.3 ± 367.5 b1755.6 ± 750.5 c
Carbon footprint intensity
(kg CO2eq kg−1 rice yield)
1.02 ± 0.32 a1.15 ± 0.66 b0.17 ± 0.09 c
a–c represent significant differences in GHG emissions among rice systems (p < 0.05).
Table 4. Water footprint of the lowland, terraced, and upland rice systems during 2020–2022 (mean ± standard deviation).
Rice SystemGreen WF
(m3 ton−1)
(%)Blue WF
(m3 ton−1)
(%)Gray WF
(m3 ton−1)
(%)Total
(m3 ton−1)
Upland1217.9 ± 108.9 a94.90.00.065.3 ± 17.6 a5.11283.2 ± 121.3 a
Terraced1116.8 ± 112.3 a78.537.5 ± 12.5 a2.6267.8 ± 100.3 b18.81422.1 ± 135.8 a
Lowland1008.5 ± 110.1 a59.3103.4 ± 56.8 b6.1589.7 ± 125.7 c34.71701.6 ± 181.4 b
a–c represent significant differences in the water footprint among rice systems (p < 0.05).
Table 5. Type and amount of pesticide used by farmers in each area.
Rice Cultivation SystemPesticidesAverage a.i. Use ± S.D. (kg ha−1 year−1)
2020
Average a.i. Use ± S.D. (kg ha−1 year−1)
2021
Average a.i. Use ± S.D. (kg ha−1 year−1)
2022
Average Active Ingredients Recommended
(kg ha−1 year−1)
Lowland2,4-D0.919 ± 0.2751.160 ± 0.2361.116 ± 0.3361.680
Acephate0.547 ± 0.1350.498 ± 0.1500.469 ± 0.1490.188
Acetochlor0.605 ± 0.2700.692 ± 0.2350.750 ± 0.2641.563
Alachlor1.400 ± 0.3461.586 ± 0.2851.560 ± 0.3293.600
Atrazine1.246 ± 0.7241.256 ± 0.5301.350 ± 0.6052.530
Butachlor0.984 ± 0.6001.055 ± 0.3741.125 ± 0.4101.800
Chlorpyrifos0.125 ± 00.143 ± 0.00010.125 ± 01.000
Fipronil-0.125 ± 0-0.050
Glyphosate0.881 ± 0.4420.793 ± 0.2660.990 ± 0.3760.450
Mancozeb0.500 ± 00.500 ± 00.500 ± 03.000
Metaldehyde0.536 ± 0.1520.564 ± 0.1430.577 ± 0.1171.313
UplandAcephate--0.0002 ± 00.188
Alachlor0.15 ± 00.09 ± 0-3.600
Carbendazim0.312 ± 00.188 ± 0-0.188
Chlorpyrifos--0.025 ± 01.000
Cypermethrin-0.131 ± 0-0.044
Mancozeb--0.0002 ± 03.000
Terraced2,4-D0.525 ± 00.525 ± 0-1.680
Alachlor--0.150 ± 03.600
Carbendazim0.250 ± 0.0880.312 ± 00.188 ± 0.1770.188
Captan-0.938 ± 0-0.125
Chlorpyrifos--0.013 ± 01.000
Cypermethrin0.109 ± 0--0.043
Fipronil-0.125 ± 0-0.050
Mancozeb0.500 ± 00.500 ± 0-3.000
Metaldehyde0.313 ± 00.313 ± 0-0.313
Disclaimer/Publisher’s Note: The statements, opinions and data contained in all publications are solely those of the individual author(s) and contributor(s) and not of MDPI and/or the editor(s). MDPI and/or the editor(s) disclaim responsibility for any injury to people or property resulting from any ideas, methods, instructions or products referred to in the content.

