
Metabolic Control, Diabetic Complications and Drug Therapy in a Cohort of Patients with Type 1 and Type 2 Diabetes in Secondary and Tertiary Care between 2004 and 2019
 ,
,  and
and
Abstract
:1. Introduction
2. Methods
2.1. Participants and Study Design
2.2. Measurements
2.3. Diagnosis and Therapy
2.4. Statistical Analysis
3. Results
3.1. Characteristics and Metabolic Control
3.1.1. T1DM
3.1.2. T2DM
3.2. Complications and Comorbidity
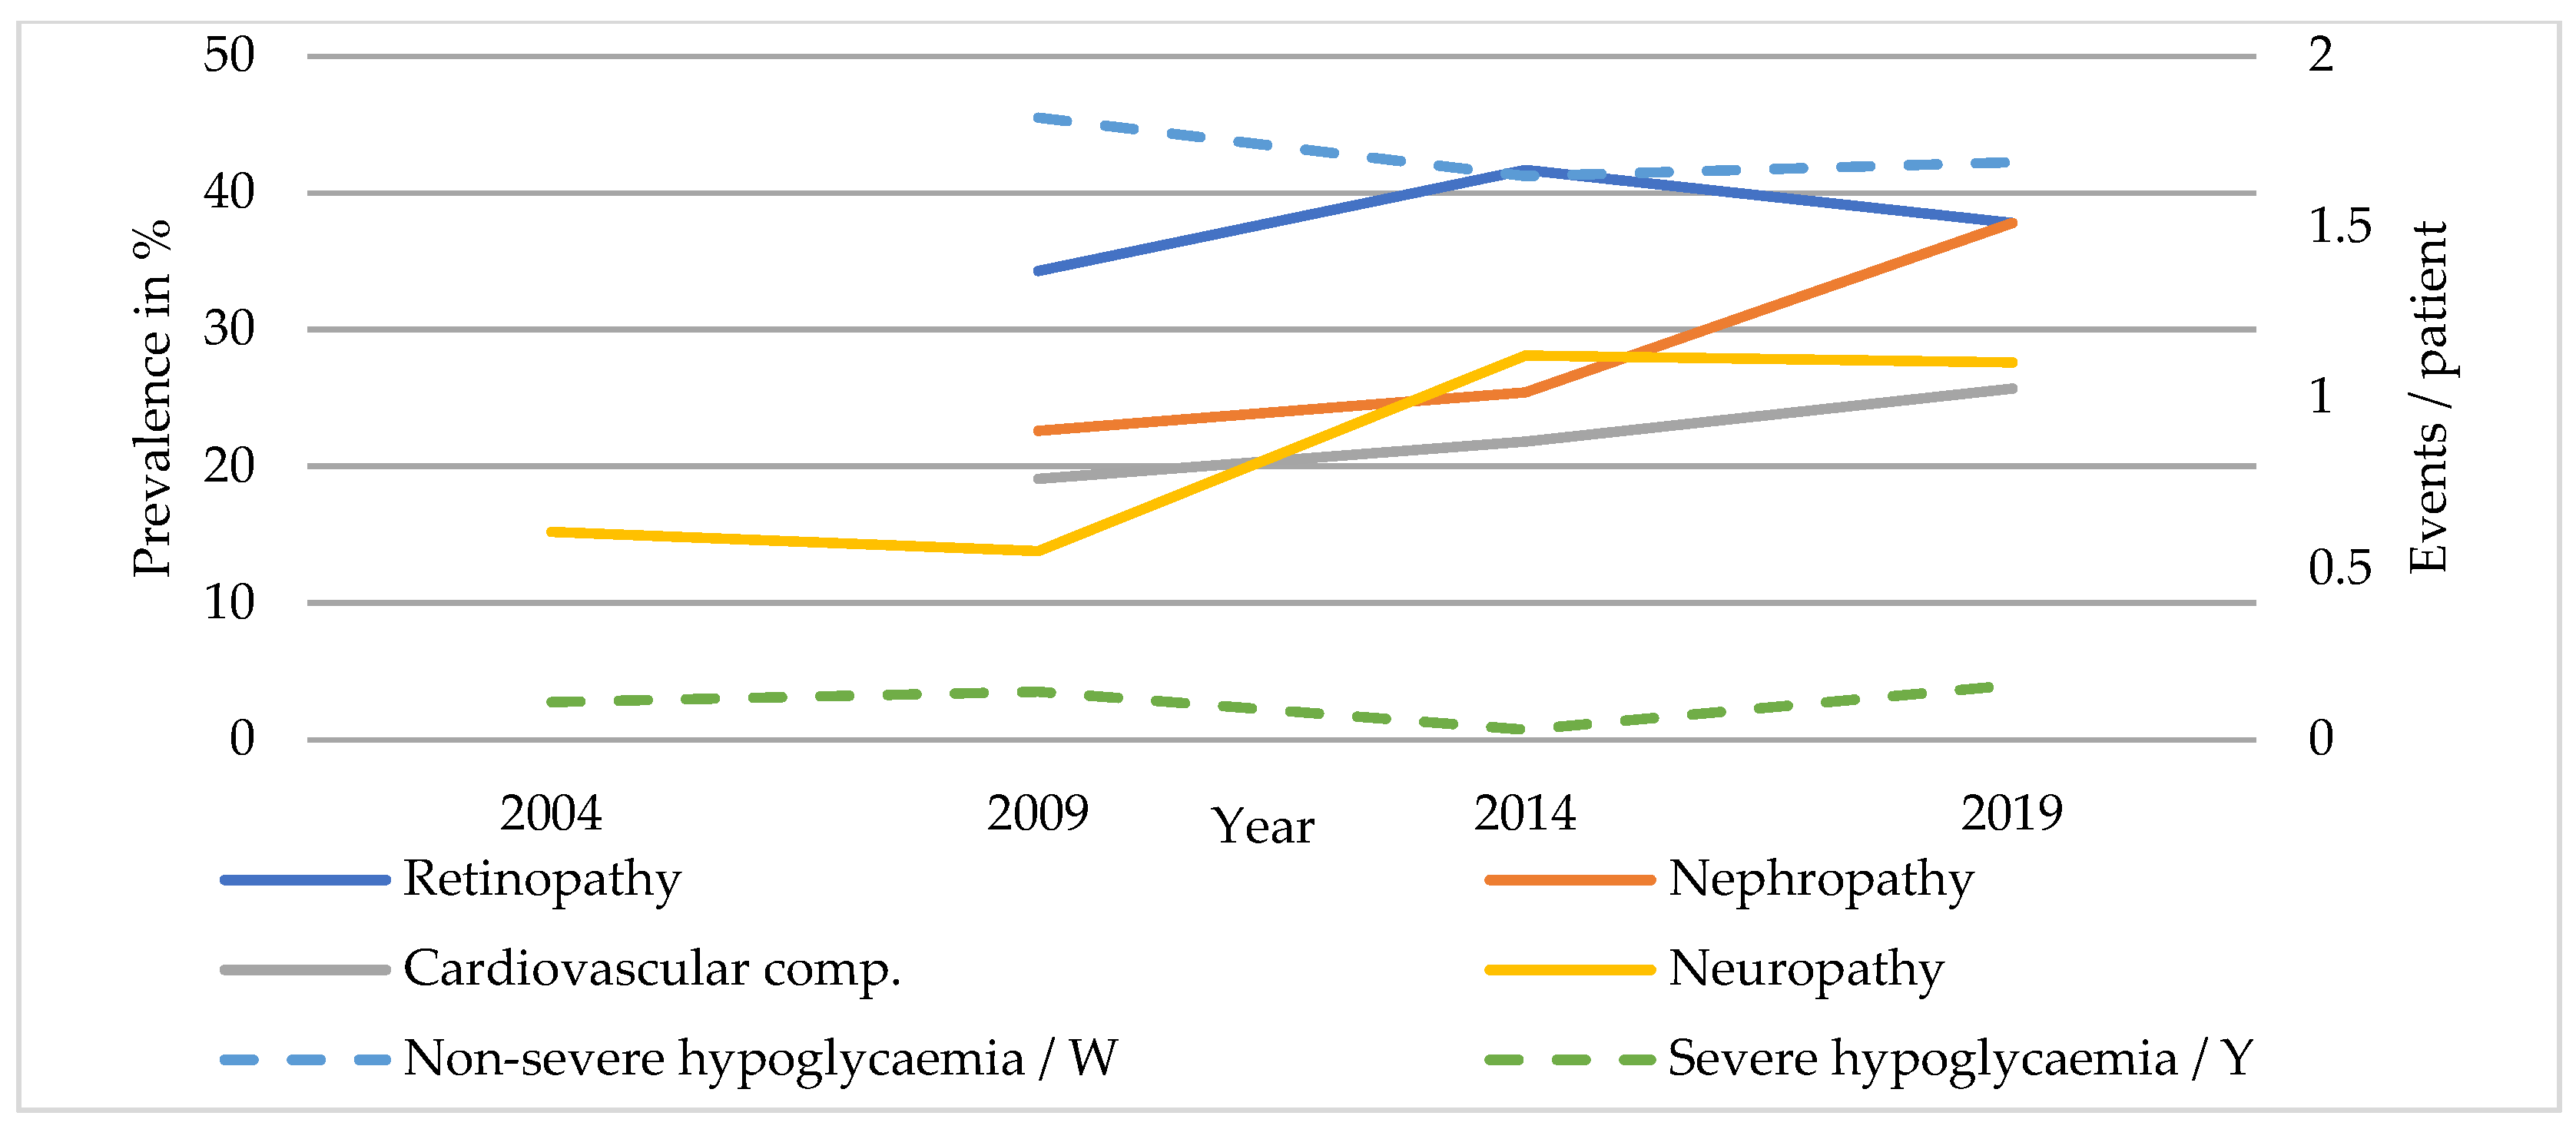
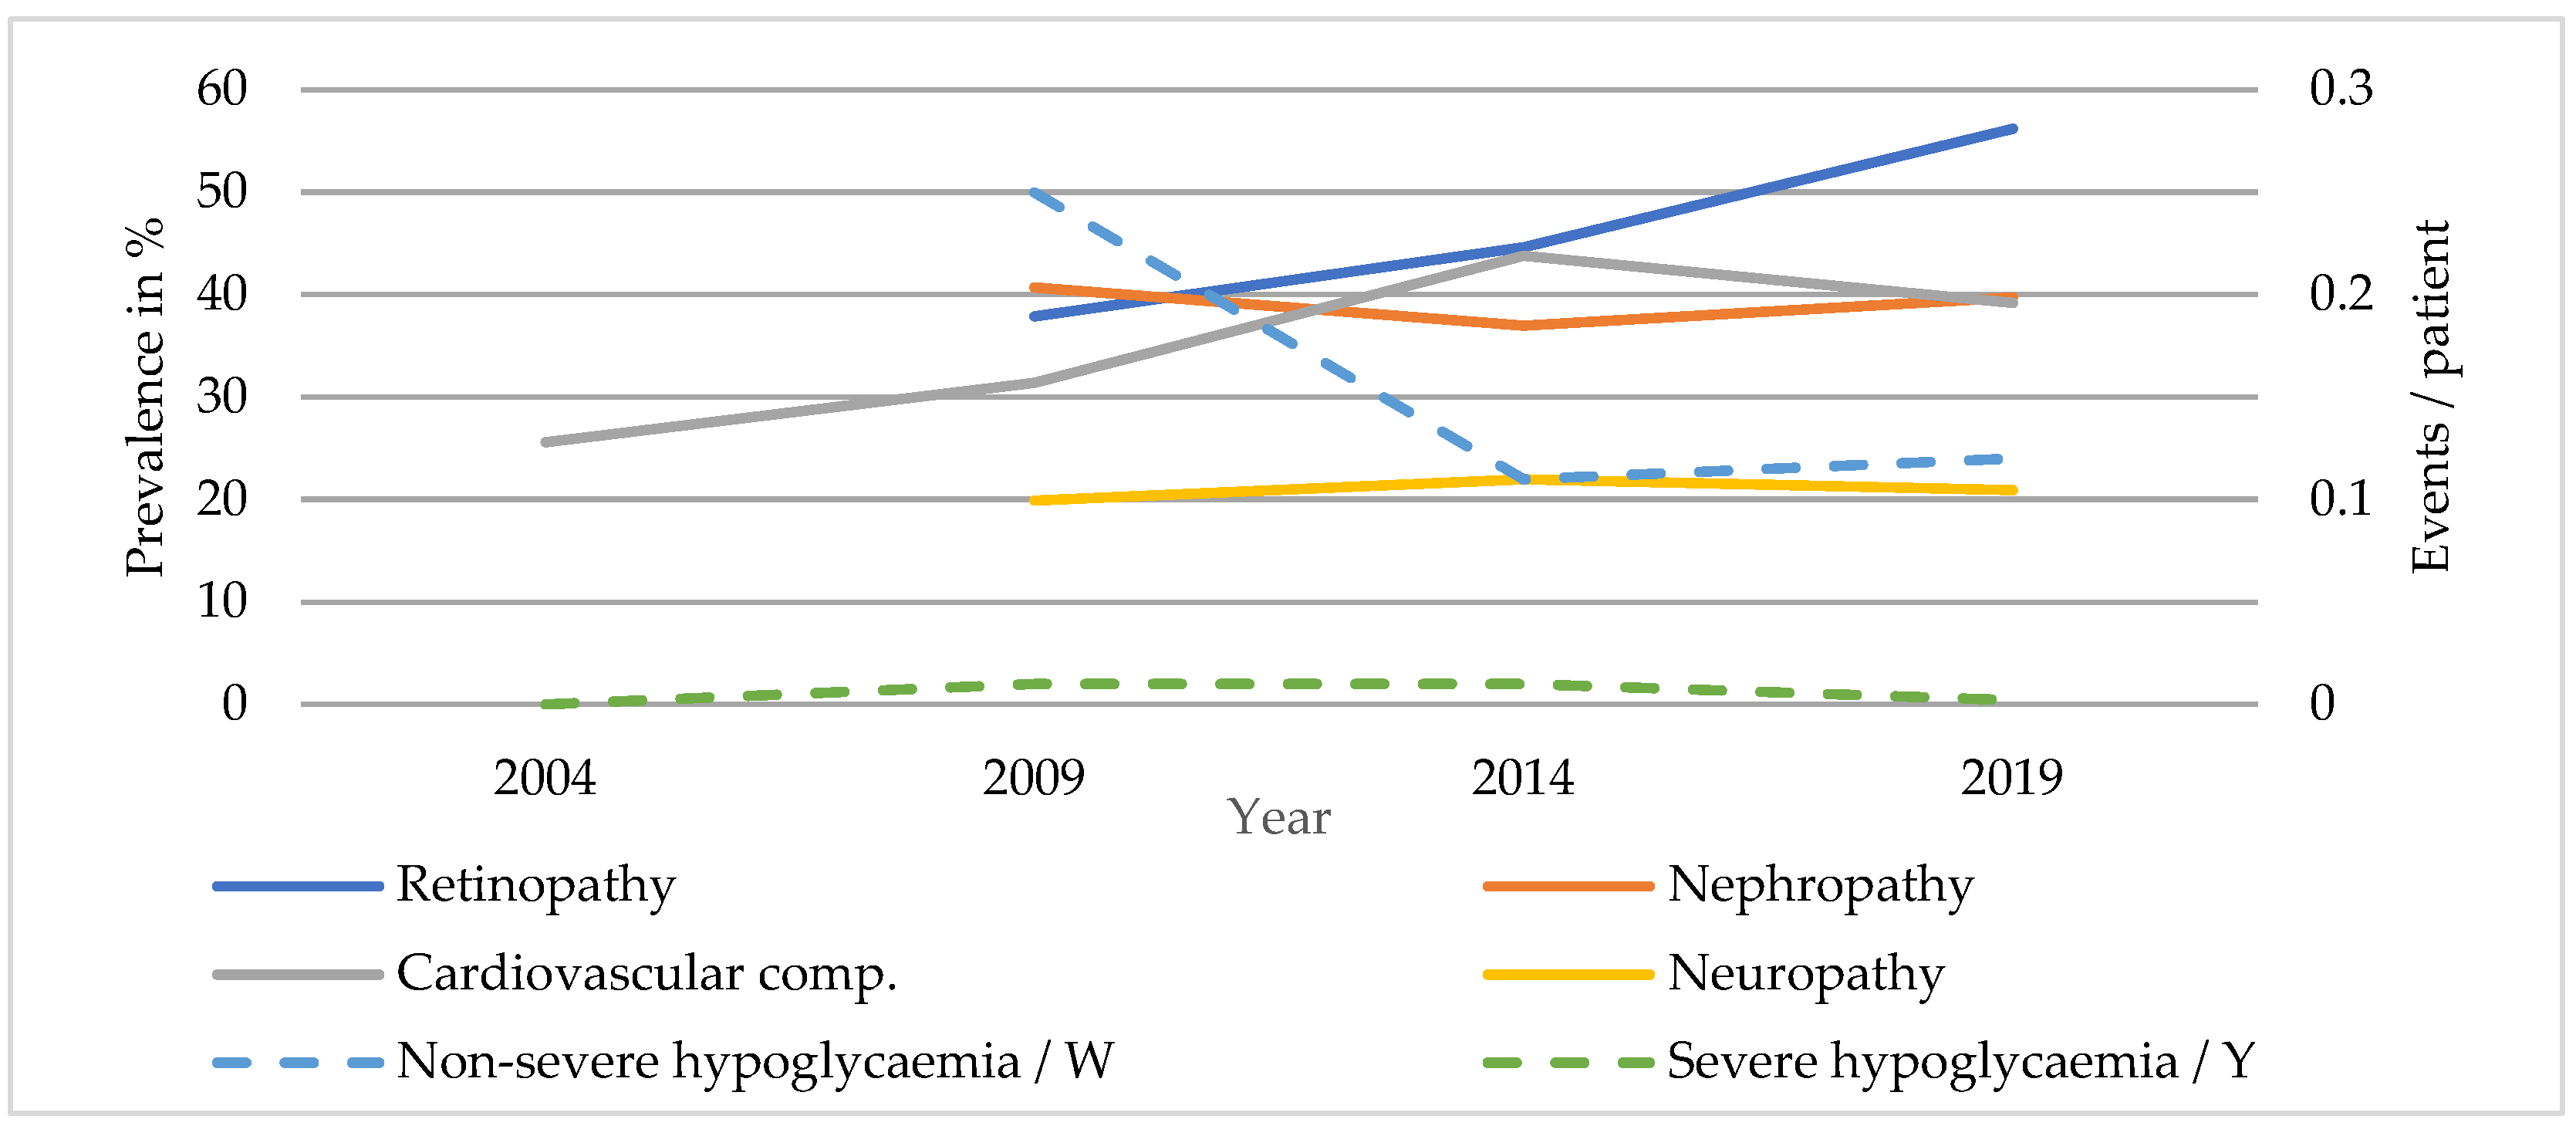
3.2.1. T1DM
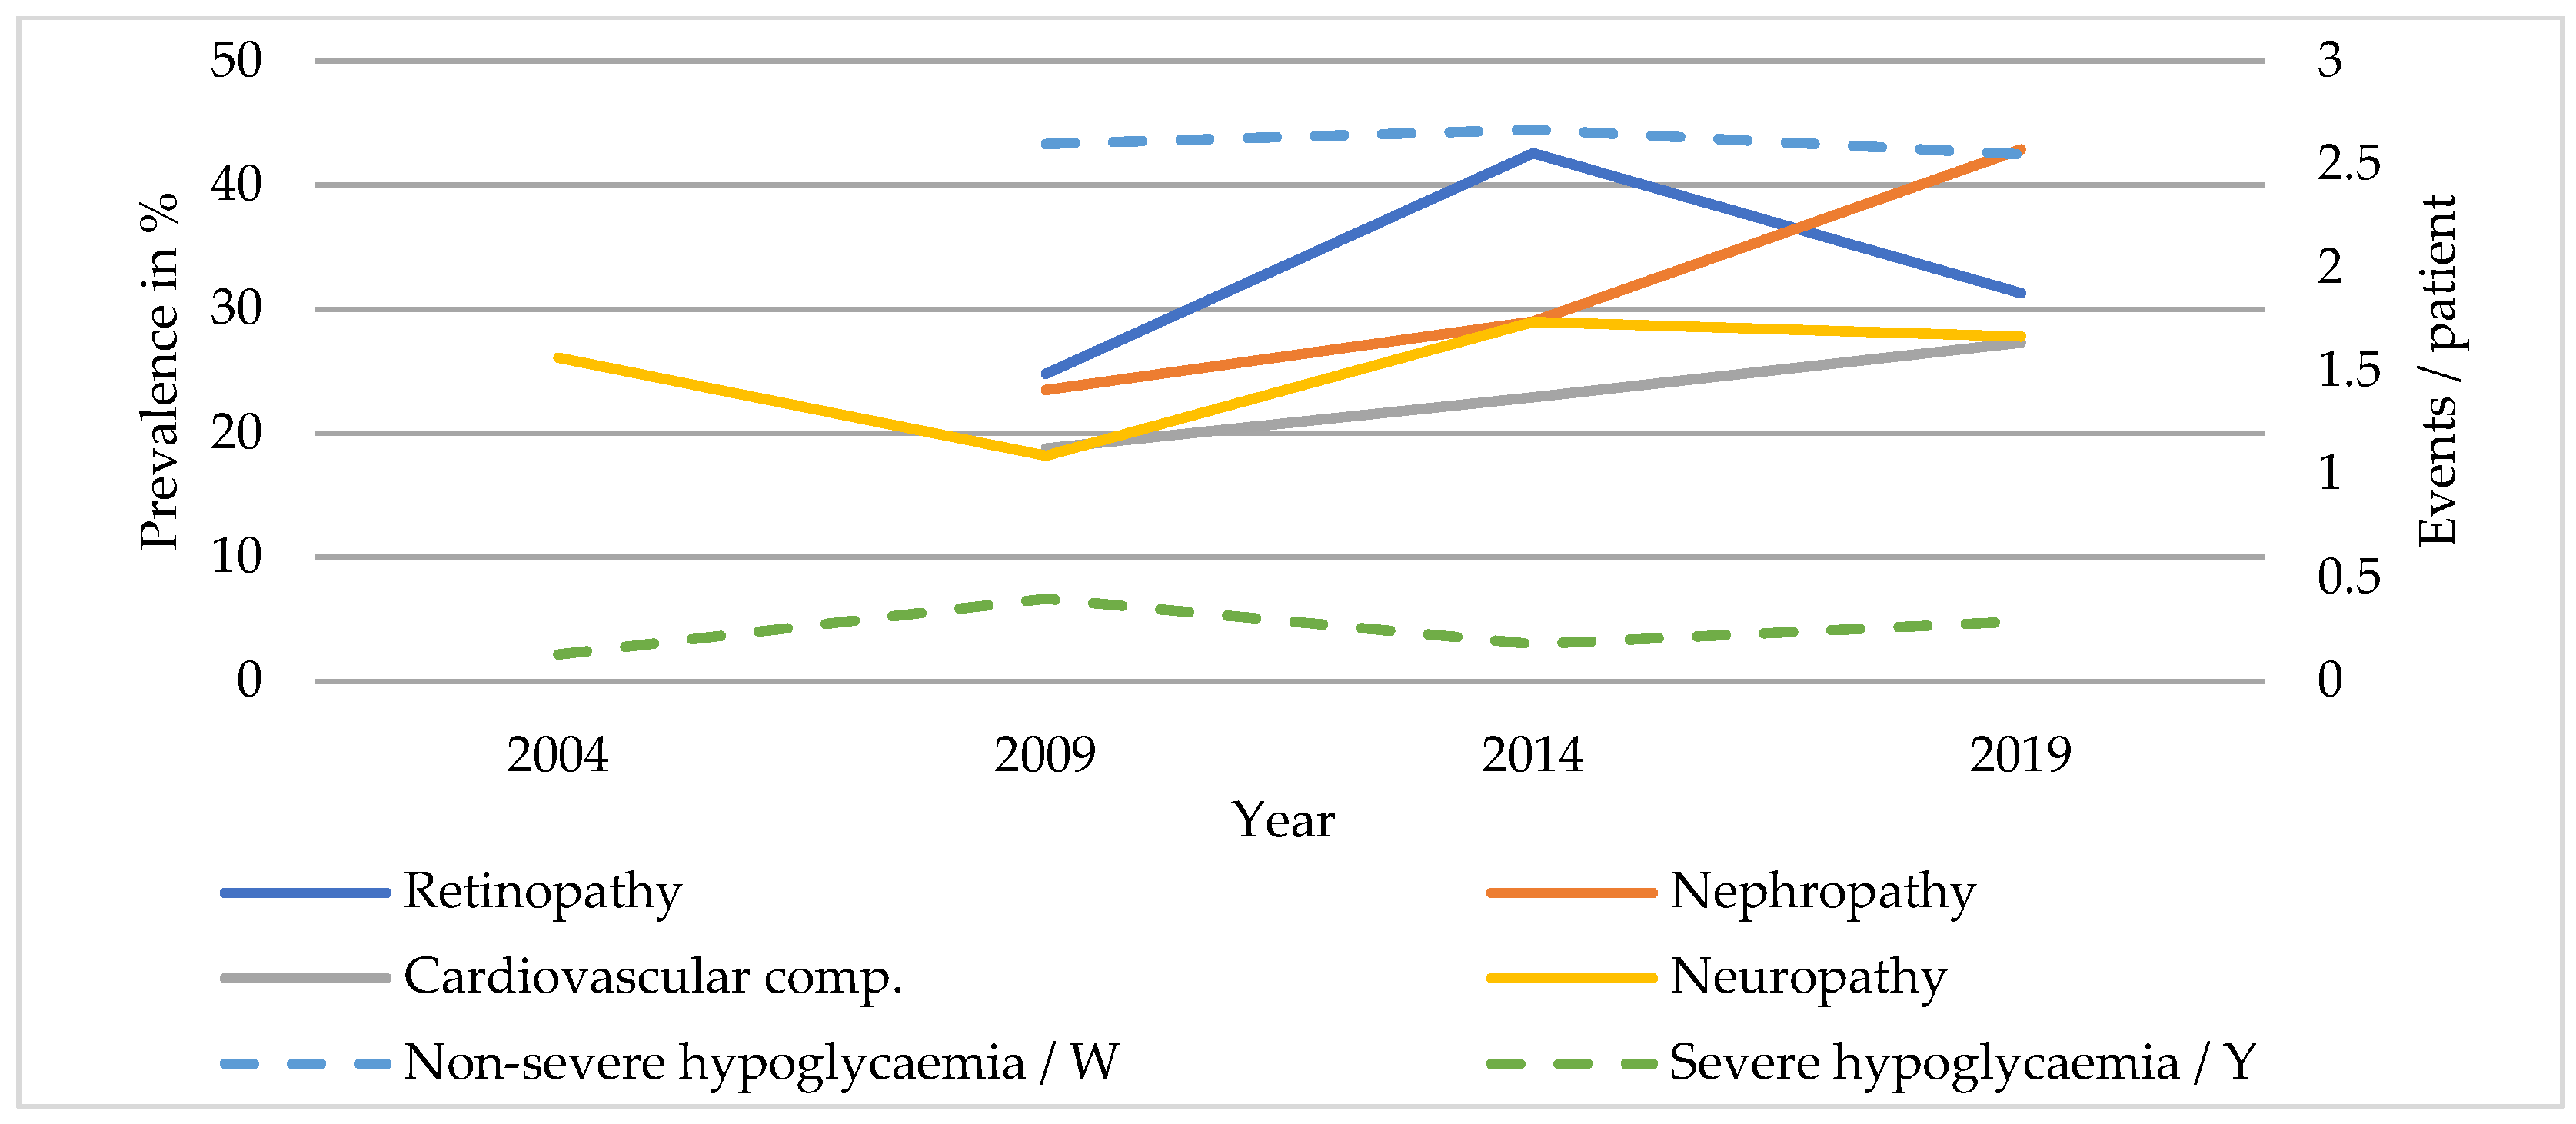
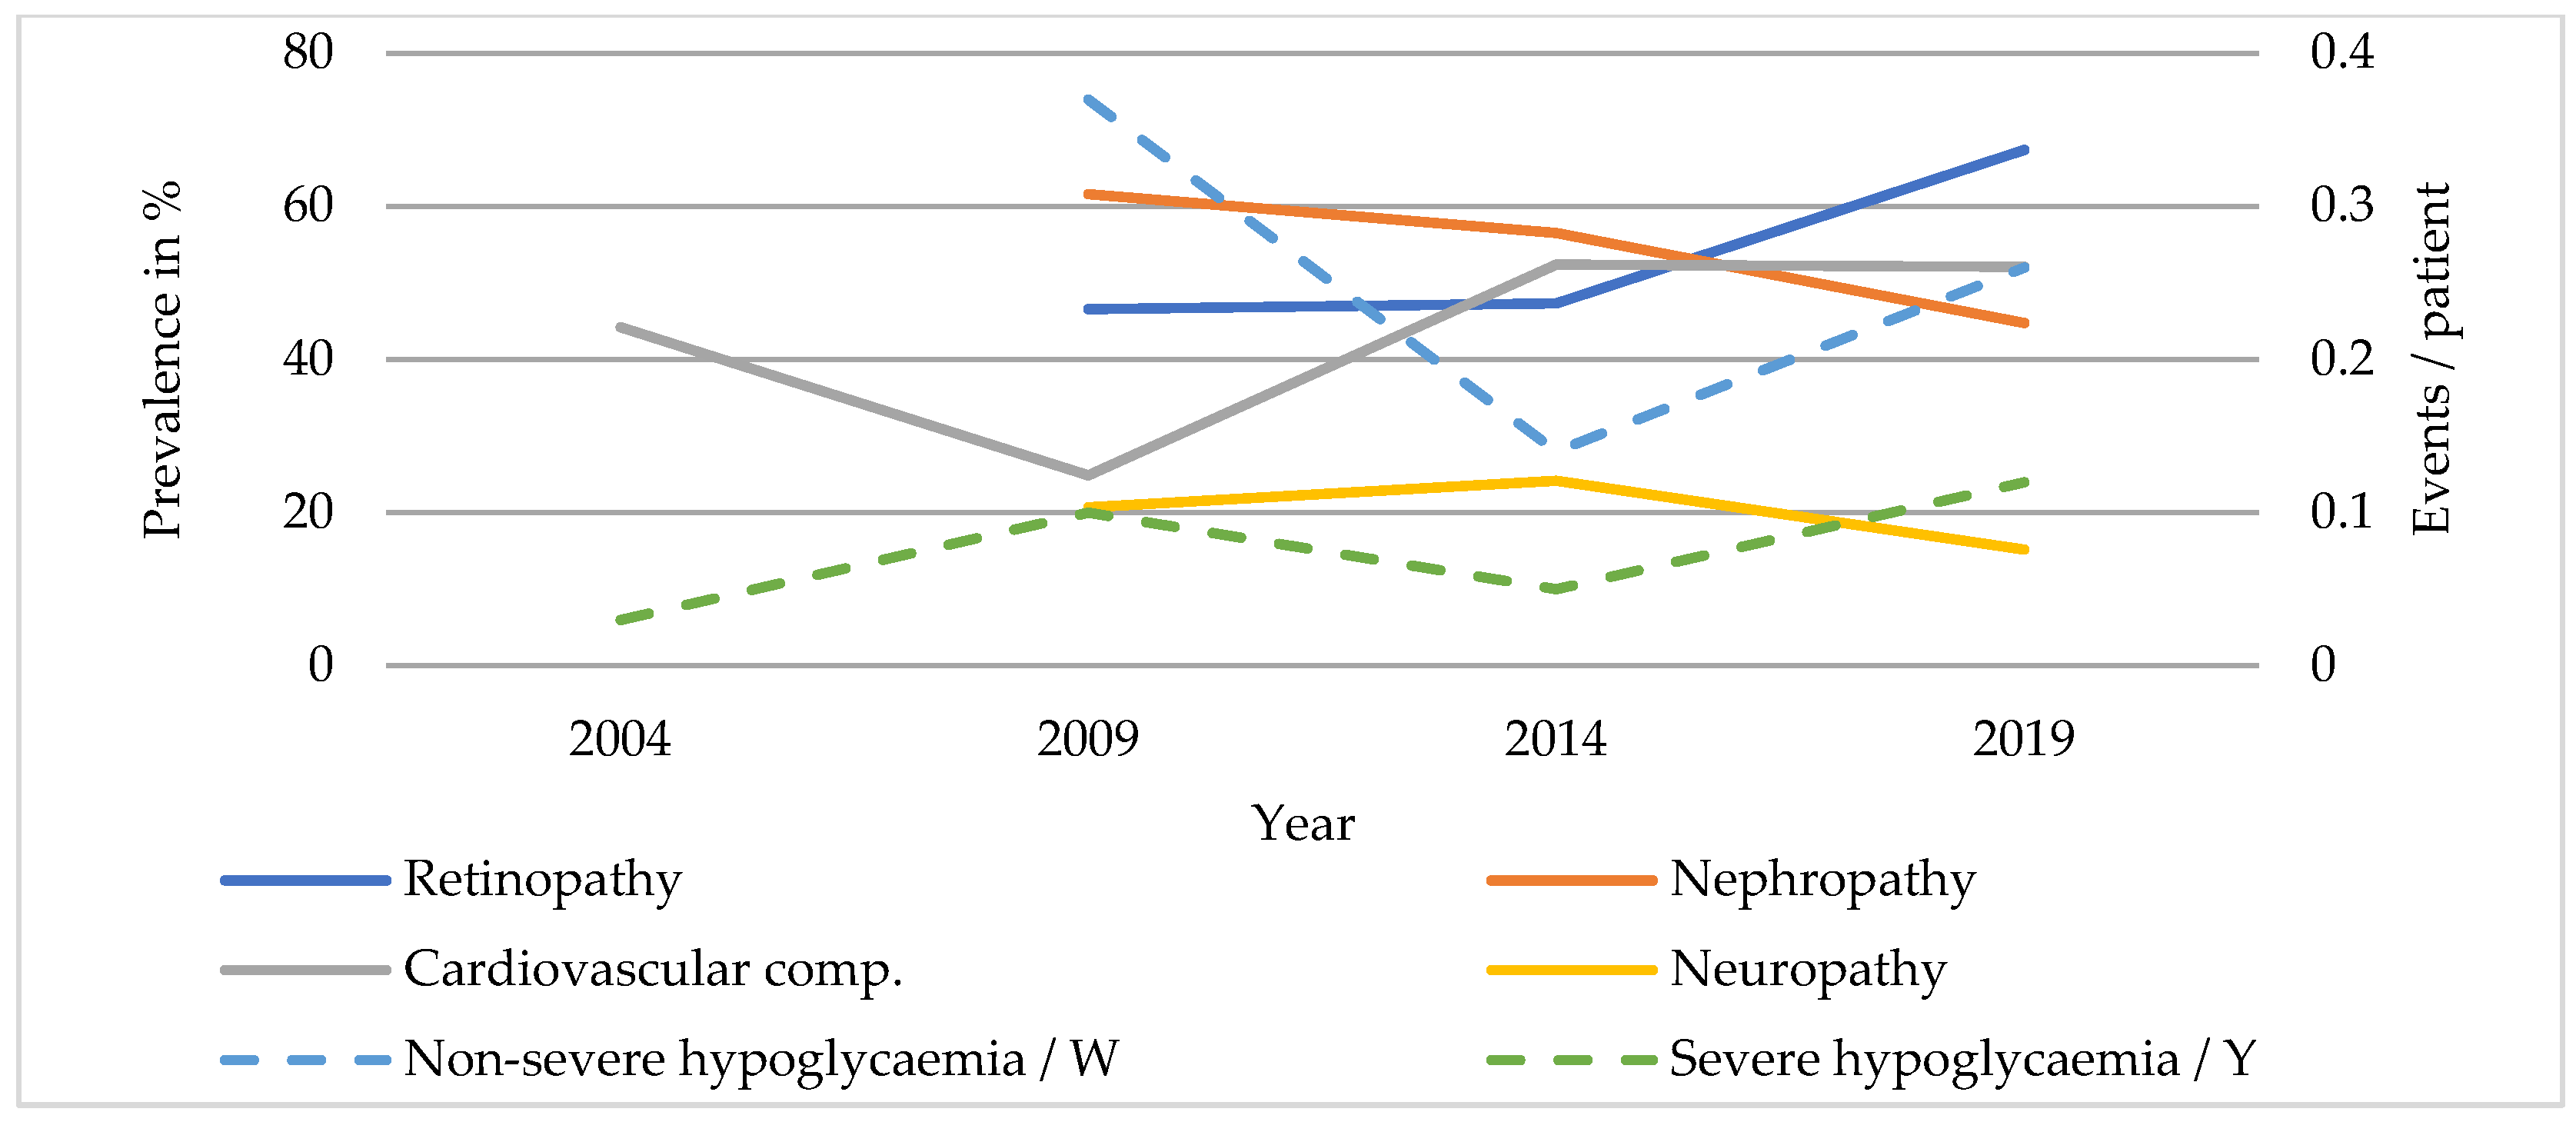
3.2.2. T2DM
3.3. Antidiabetic Drug Therapy
3.3.1. T1DM
3.3.2. T2DM
3.4. Comparison of T1DM Patients Treated with Either ICT or CSII
4. Discussion
4.1. Characteristics and Metabolic Control
4.2. Complications and Comorbidity
4.3. Antidiabetic Drug Therapy
5. Conclusions
Author Contributions
Funding
Institutional Review Board Statement
Informed Consent Statement
Data Availability Statement
Conflicts of Interest
References
- Higgins, V.; Piercy, J.; Roughley, A.; Milligan, G.; Leith, A.; Siddall, J.; Benford, M. Trends in medication use in patients with type 2 diabetes mellitus: A long-term view of real-world treatment between 2000 and 2015. Diabetes Metab. Syndr. Obes. Targets Ther. 2016, 9, 371–380. [Google Scholar] [CrossRef]
- Mearns, E.S.; Saulsberry, W.J.; White, C.M.; Kohn, C.G.; Lemieux, S.; Sihabout, A.; Salamucha, I.; Coleman, C.I. Efficacy and safety of antihyperglycaemic drug regimens added to metformin and sulphonylurea therapy in Type 2 diabetes: A network meta-analysis. Diabet. Med. 2015, 32, 1530–1540. [Google Scholar] [CrossRef] [PubMed]
- Action to Control Cardiovascular Risk in Diabetes Study Group; Gerstein, H.C.; Miller, M.E.; Byington, R.P.; Goff, D.C., Jr.; Bigger, J.T.; Buse, J.B.; Cushman, W.C.; Genuth, S.; Ismail-Beigi, F.; et al. Effects of intensive glucose lowering in type 2 diabetes. N. Engl. J. Med. 2008, 8, 2545–2559. [Google Scholar] [CrossRef]
- Inzucchi, S.E.; Bergenstal, R.M.; Buse, J.B.; Diamant, M.; Ferrannini, E.; Nauck, M.; Peters, A.L.; Tsapas, A.; Wender, R.; Matthews, D.R.; et al. Management of hyperglycemia in type 2 diabetes: A patient-centered approach: Position statement of the American Diabetes Association (ADA) and the European Association for the Study of Diabetes (EASD). Diabetes Care 2012, 35, 1364–1379. [Google Scholar] [CrossRef] [PubMed]
- Bundesärztekammer (BÄK); Kassenärztliche Bundesvereinigung (KBV); Arbeitsgemeinschaft der Wissenschaftlichen Medizinischen Fachgesellschaften (AWMF). Nationale VersorgungsLeitlinie Therapie des Typ-2-Diabetes—Langfassung, 1. Auflage. Version 4. 2013, Zuletzt Geändert: November 2014. Available online: www.dm-therapie.versorgungsleitlinien.de (accessed on 5 January 2022).
- Deutsche Diabetes Gesellschaft; Deutsche Diabetes-Hilfe. Deutscher Gesundheitsbericht Diabetes 2021—Die Bestandsaufnahme. Available online: https://www.deutsche-diabetes-gesellschaft.de/fileadmin/user_upload/06_Gesundheitspolitik/03_Veroeffentlichungen/05_Gesundheitsbericht/20201107_Gesundheitsbericht2021.pdf (accessed on 14 December 2021).
- Bohn, B.; Kerner, W.; Seufert, J.; Kempe, H.-P.; Jehle, P.M.; Best, F.; Füchtenbusch, M.; Knauerhase, A.; Hofer, M.; Rosenbauer, J.; et al. Trend of antihyperglycaemic therapy and glycaemic control in 184,864 adults with type 1 or 2 diabetes between 2002 and 2014: Analysis of real-life data from the DPV registry from Germany and Austria. Diabetes Res. Clin. Pract. 2016, 115, 31–38. [Google Scholar] [CrossRef] [PubMed]
- Fuchs, S.; Henschke, C.; Blümel, M.; Busse, R. Disease Management Programs for Type 2 Diabetes in Germany. Dtsch. Ärzteblatt Int. 2014, 111, 453–463. [Google Scholar] [CrossRef] [PubMed]
- Kostev, K.; Rockel, T.; Jacob, L. Impact of Disease Management Programs on HbA1c Values in Type 2 Diabetes Patients in Germany. J. Diabetes Sci. Technol. 2016, 11, 117–122. [Google Scholar] [CrossRef] [PubMed]
- Gregg, E.W.; Hora, I.; Benoit, S.R. Resurgence in Diabetes-Related Complications. JAMA 2019, 321, 1867–1868. [Google Scholar] [CrossRef]
- Gregg, E.W.; Sattar, N.; Ali, M.K. The changing face of diabetes complications. Lancet Diabetes Endocrinol. 2016, 4, 537–547. [Google Scholar] [CrossRef]
- DCCT Research Group. The effect of intensive treatment of diabetes on the development and progression of long-term complications in insulin-dependent diabetes mellitus. N. Engl. J. Med. 1993, 329, 977–986. [Google Scholar] [CrossRef]
- Levey, A.S.; Stevens, L.A.; Schmid, C.H.; Zhang, Y.L.; Castro, A.F., III; Feldman, H.I.; Kusek, J.W.; Eggers, P.; Van Lente, F.; Greene, T.; et al. A New Equation to Estimate Glomerular Filtration Rate. Ann. Intern. Med. 2009, 150, 604–612. [Google Scholar] [CrossRef] [PubMed]
- World Health Organisation. Obesity: Preventing and managing the global epidemic. Report of a WHO consultation. World Health Organ. Tech. Rep. Ser. 2000, 894, 1–253. [Google Scholar]
- Topp, C.W.; Østergaard, S.D.; Søndergaard, S.; Bech, P. The WHO-5 Well-Being Index: A systematic review of the literature. Psychother. Psychosom. 2015, 84, 167–176. [Google Scholar] [CrossRef] [PubMed]
- (BfArM), B.f.A.u.M. ATC-Klassifikation mit definierten Tagesdosen DDD. Available online: https://www.dimdi.de/dynamic/.downloads/arzneimittel/atcddd/atc-ddd-amtlich-2021.pdf (accessed on 11 December 2021).
- Koopman, R.J.; Mainous, A.G.; Diaz, V.A.; Geesey, M.E. Changes in Age at Diagnosis of Type 2 Diabetes Mellitus in the United States, 1988 to 2000. Ann. Fam. Med. 2005, 3, 60–63. [Google Scholar] [CrossRef]
- Heidemann, C.; Scheidt-Nave, C. Prevalence, incidence and mortality of diabetes mellitus in adults in Germany—A review in the framework of the Diabetes Surveillance. J. Health Monit. 2017, 2, 98–121. [Google Scholar] [CrossRef]
- Peralta, M.; Ramos, M.; Lipert, A.; Martins, J.; Marques, A. Prevalence and trends of overweight and obesity in older adults from 10 European countries from 2005 to 2013. Scand. J. Public Health 2018, 46, 522–529. [Google Scholar] [CrossRef]
- Heller, T.; Blum, M.; Spraul, M.; Wolf, G.; Müller, U.A. Folgeerkrankungen des Diabetes mellitus: Prävalenzen in der Bundesrepublik Deutschland. DMW Dtsch. Med. Wochenschr. 2014, 139, 786–791. [Google Scholar] [CrossRef]
- Arbeitsgemeinschaft der Wissenschaftli-chen Medizinischen Fachgesellschaften (AWMF). Indikationen für eine Stationäre Einweisung. Available online: https://www.awmf.org/uploads/tx_szleitlinien/057-014.pdf (accessed on 15 May 2022).
- Zentralinstitut für die kassenärztliche Versorgung in der Bundesrepublik Deutschland. DMP-Atlas Nordrhein-Westfalen, Regionalisierte Darstellung der Disease-Management-Programme. Available online: https://www.zi-dmp.de/dmp-atlas_nrw/ (accessed on 12 July 2022).
- Stone, M.A.; Wilkinson, J.C.; Charpentier, G.; Clochard, N.; Grassi, G.; Lindblad, U.; Muller, U.A.; Nolan, J.; Rutten, G.E.; Khunti, K.; et al. Evaluation and comparison of guidelines for the management of people with type 2 diabetes from eight European countries. Diabetes Res Clin Pract. 2010, 87, 252–260. [Google Scholar] [CrossRef]
- Deutsche Diabetes Gesellschaft (DDG). S3-Leitlinie Therapie des Typ-1-Diabetes 2. Auflage. Available online: https://www.awmf.org/uploads/tx_szleitlinien/057-013l_S3-Therapie-Typ-1-Diabetes_2018-08.pdf (accessed on 24 January 2022).
- Bundesärztekammer (BÄK); Kassenärztliche Bundesvereinigung (KBV); Arbeitsgemeinschaft der Wissenschaftli-chen Medizinischen Fachgesellschaften (AWMF). Nationale VersorgungsLeitlinie Typ-2-Diabetes–Teilpublika-tion der Langfassung, 2. Auflage. Version 1. Available online: www.leitlinien.de/diabetes (accessed on 16 May 2022).
- Song, Y.; Liu, X.; Zhu, X.; Zhao, B.; Hu, B.; Sheng, X.; Chen, L.; Yu, M.; Yang, T.; Zhao, J. Increasing trend of diabetes combined with hypertension or hypercholesterolemia: NHANES data analysis 1999–2012. Sci. Rep. 2016, 6, 36093. [Google Scholar] [CrossRef]
- Hermanns, N.; Kulzer, B.; Krichbaum, M.; Kubiak, T.; Haak, T. How to screen for depression and emotional problems in patients with diabetes: Comparison of screening characteristics of depression questionnaires, measurement of diabetes-specific emotional problems and standard clinical assessment. Diabetologia 2006, 49, 469–477. [Google Scholar] [CrossRef]
- Redekop, W.K.; Koopmanschap, M.A.; Stolk, R.P.; Rutten, G.E.; Wolffenbuttel, B.H.; Niessen, L.W. Health-related quality of life and treatment satisfaction in Dutch patients with type 2 diabetes. Diabetes Care 2002, 25, 458–463. [Google Scholar] [CrossRef] [Green Version]
- Andel, M.; Grzeszczak, W.; Michalek, J.; Medvescek, M.; Norkus, A.; Rasa, I.; Niewada, M.; Kaminski, B.; Kraml, P.; Madacsy, L.; et al. A multinational, multi-centre, observational, cross-sectional survey assessing diabetes secondary care in Central and Eastern Europe (DEPAC Survey). Diabet. Med. 2008, 25, 1195–1203. [Google Scholar] [CrossRef] [PubMed]
- Wolf, G.; Muller, N.; Tschauner, T.; Muller, U.A. Prävalenz der Niereninsuffizienz im Diabetes TÜV der Deutschen BKK 2000–2004. Med. Klin. Intensiv. Und Notf. 2006, 101, 441–447. [Google Scholar] [CrossRef]
- Merker, L.; Bautsch, B.-W.; Ebert, T.; Guthoff, M.; Isermann, B. Nephropathy in Diabetes. Exp. Clin. Endocrinol. Diabetes 2021, 129, S60–S63. [Google Scholar] [CrossRef] [PubMed]
- Hammes, H.P.; Welp, R.; Kempe, H.P.; Wagner, C.; Siegel, E.; Holl, R.W.; Mellitus, D.P.V.I.-G.B.C.N.D. Risk Factors for Retinopathy and DME in Type 2 Diabetes-Results from the German/Austrian DPV Database. PLoS ONE 2015, 10, e0132492. [Google Scholar] [CrossRef] [PubMed]
- Hammes, H.P.; Kerner, W.; Hofer, S.; Kordonouri, O.; Raile, K.; Holl, R.W.; Group, D.P.-W.S. Diabetic retinopathy in type 1 diabetes-a contemporary analysis of 8,784 patients. Diabetologia 2011, 54, 1977–1984. [Google Scholar] [CrossRef] [PubMed]
- Gregg, E.W.; Li, Y.; Wang, J.; Rios Burrows, N.; Ali, M.K.; Rolka, D.; Williams, D.E.; Geiss, L. Changes in Diabetes-Related Complications in the United States, 1990–2010. N. Engl. J. Med. 2014, 370, 1514–1523. [Google Scholar] [CrossRef]
- Ziegler, D.; Keller, J.; Maier, C.; Pannek, J. Diabetic Neuropathy. Exp. Clin. Endocrinol. Diabetes 2021, 129, S70–S81. [Google Scholar] [CrossRef]
- Sämann, A.; Tajiyeva, O.; Müller, N.; Tschauner, T.; Hoyer, H.; Wolf, G.; Müller, U.A. Prevalence of the diabetic foot syndrome at the primary care level in Germany: A cross-sectional study. Diabet. Med. 2008, 25, 557–563. [Google Scholar] [CrossRef]
- Hwang, Y.T.; Davies, G. ‘Insulin neuritis’ to ‘treatment-induced neuropathy of diabetes’: New name, same mystery. Pract. Neurol. 2015, 16, 53–55. [Google Scholar] [CrossRef]
- Bongaerts, B.W.; Rathmann, W.; Heier, M.; Kowall, B.; Herder, C.; Stockl, D.; Meisinger, C.; Ziegler, D. Older subjects with diabetes and prediabetes are frequently unaware of having distal sensorimotor polyneuropathy: The KORA F4 study. Diabetes Care 2013, 36, 1141–1146. [Google Scholar] [CrossRef] [PubMed] [Green Version]
- Wolf, G.; Müller, N.; Busch, M.; Eidner, G.; Kloos, C.; Hunger-Battefeld, W.; A Müller, U. Diabetic foot syndrome and renal function in type 1 and 2 diabetes mellitus show close association. Nephrol. Dial. Transplant. 2009, 24, 1896–1901. [Google Scholar] [CrossRef] [PubMed]
- Morbach, S.; Lobmann, R.; Eckhard, M.; Müller, E.; Reike, H.; Risse, A.; Rümenapf, G.; Spraul, M. Diabetic Foot Syndrome. Exp. Clin. Endocrinol. Diabetes 2020, 129, S82–S90. [Google Scholar] [CrossRef] [PubMed]
- Armstrong, D.G.; Boulton, A.J.M.; Bus, S.A. Diabetic Foot Ulcers and Their Recurrence. N. Engl. J. Med. 2017, 376, 2367–2375. [Google Scholar] [CrossRef]
- Donnelly, L.A.; Morris, A.D.; Frier, B.M.; Ellis, J.D.; Donnan, P.T.; Durrant, R.; Band, M.M.; Reekie, G.; Leese, G.P. Frequency and predictors of hypoglycaemia in Type 1 and insulin-treated Type 2 diabetes: A population-based study. Diabet. Med. 2005, 22, 749–755. [Google Scholar] [CrossRef]
- Amiel, S.A. Hypoglycemia: From the laboratory to the clinic. Diabetes Care 2009, 32, 1364–1371. [Google Scholar] [CrossRef]
- Kloos, C.; Burghardt, K.; Müller, U.A.; Kramer, G.; Müller, N.; Wolf, G.; Kuniss, N. Reduction of Severe Hypoglycaemia in People with Type 2 Diabetes after a Structured Inpatient Intervention. Exp. Clin. Endocrinol. Diabetes 2019, 129, 587–592. [Google Scholar] [CrossRef]
- Misso, M.L.; Egberts, K.J.; Page, M.; O’Connor, D.; Shaw, J. Continuous subcutaneous insulin infusion (CSII) versus multiple insulin injections for type 1 diabetes mellitus. Cochrane Database Syst. Rev. 2010, CD005103. [Google Scholar] [CrossRef]
- Pickup, J.C.; Sutton, A.J. Severe hypoglycaemia and glycaemic control in Type1 diabetes: Meta-analysis of multiple daily insulin injections compared with continuous subcutaneous insulin infusion. Diabet. Med. 2008, 25, 765–774. [Google Scholar] [CrossRef]
- Schwabe, U.; Ludwig, W. Arzneiverordnungs-Report 2020; Aktuelle Daten, Kosten, Trends und Kommentare; Springer-Verlag GmbH: Berlin, Germany, 2020. [Google Scholar] [CrossRef]
- Fullerton, B.; Siebenhofer, A.; Jeitler, K.; Horvath, K.; Semlitsch, T.; Berghold, A.; Plank, J.; Pieber, T.R.; Gerlach, F.M. Short-acting insulin analogues versus regular human insulin for adults with type 1 diabetes mellitus. Cochrane Database Syst. Rev. 2016, 2019, CD012161. [Google Scholar] [CrossRef]
- Jacob, S. Insulintherapie bei Typ-2-Diabetes—so spät wie möglich! DMW Dtsch. Med. Wochenschr. 2016, 141, 579–580. [Google Scholar] [CrossRef] [PubMed]
- Marso, S.P.; Daniels, G.H.; Brown-Frandsen, K.; Kristensen, P.; Mann, J.F.E.; Nauck, M.A.; Nissen, S.E.; Pocock, S.; Poulter, N.R.; Ravn, L.S.; et al. Liraglutide and Cardiovascular Outcomes in Type 2 Diabetes. N. Engl. J. Med. 2016, 375, 311–322. [Google Scholar] [CrossRef] [PubMed]
- Zinman, B.; Wanner, C.; Lachin, J.M.; Fitchett, D.; Bluhmki, E.; Hantel, S.; Mattheus, M.; Devins, T.; Johansen, O.E.; Woerle, H.J.; et al. Empagliflozin, Cardiovascular Outcomes, and Mortality in Type 2 Diabetes. N. Engl. J. Med. 2015, 373, 2117–2128. [Google Scholar] [CrossRef] [PubMed] [Green Version]


| Type 1 Diabetes (T1DM) | 2004 | 2009 | 2014 | 2019 | Total | p-Value for Trend |
|---|---|---|---|---|---|---|
| Number of data sets n (%) | 283 (23.7) | 327 (27.4) | 299 (25.1) | 283 (23.7) | 1192 | |
| Female n (%) | 151 (53.4) | 182 (55.7) | 162 (54.2) | 147 (51.9) | 642 (53.9) | |
| Age (years) | 45.7 (14.8) | 47.3 (16.2) * | 51.4 (16.9) * | 53.3 (17.6) * | 49.3 (16.6) | <0.001 |
| Diabetes duration (years) | 19.0 (12.4) | 19.7 (12.9) * | 22.4 (13.5) * | 24.8 (14.3) * | 21.4 (13.4) | <0.001 |
| BMI (kg/m2) | 26.6 (3.9) | 26.8 (4.7) * | 27.3 (5.0) * | 27.6 (5.1) | 27.1 (4.7) | <0.001 |
| HbA1c (%) | 7.3 (1.1) | 7.5 (1.0) * | 7.1 (1.1) * | 7.4 (1.1) * | 7.3 (1.1) | 0.118 |
| BP systolic (mmHg) | 138.0 (18.3) | 138.6 (19.2) | 136.2 (19.2) | 139.3 (19.2) * | 138.0 (19.0) | 0.312 |
| BP diastolic (mmHg) | 79.0 (9.8) | 83.3 (11.6) * | 79.9 (11.89) * | 81.2 (12.1) | 80.9 (11.5) | 0.619 |
| eGFR (mL/min/1.73 m2) | n.a. | 83.1 (23.5) | 87.0 (25.7) | 81.0 (26.2) * | 83.9 (25.3) | <0.001 |
| WHO-5 (range 0–25) | n.a. | 14.9 (5.1) | 15.4 (5.2) | 15.9 (4.5) | 15.5 (4.9) | 0.150 |
| Type 2 Diabetes (T2DM) | ||||||
| Number of data sets n (%) | 933 (21.3) | 1195 (27.3) | 1143 (26.1) | 1108 (25.3) | 4379 | |
| Female n (%) | 435 (46.6) | 554 (46.4) | 511 (44.7) | 491 (44.3) | 1991 (45.5) | |
| Age (years) | 63.5 (11.6) | 65.2 (11.8) * | 66.9 (11.8) * | 67.5 (12.0) * | 65.8 (11.99 | <0.001 |
| Diabetes duration (years) | 12.7 (9.0) | 13.4 (9.4) * | 15.6 (10.3) * | 15.5 (10.6) * | 14.3 (9.9) | <0.001 |
| BMI (kg/m2) | 31.7 (5.9) | 32.3 (6.3) * | 32.7 (6.8) | 32.6 (7.4) | 32.4 (6.6) | 0.002 |
| WHO class 1 obesity n (%) | 310 (34.1) | 375 (32.5) | 318 (30.2) | 306 (30.3) | 1309 (31.7) | 0.071 |
| WHO class 2 obesity n (%) | 139 (15.3) | 202 (17.5) | 181 (17.2) | 153 (15.1) | 675 (16.4) | 0.799 |
| WHO class 3 obesity n (%) | 76 (8.4) | 123 (10.6) | 141 (13.4) | 145 (14.3) | 485 (11.8) | <0.001 |
| HbA1c (%) | 7.1 (1.1) | 7.1 (1.0) | 6.9 (1.1) * | 7.0 (1.1) * | 7.0 (1.1) | 0.790 |
| BP systolic (mmHg) | 148.0 (22.5) | 145.2 (21.3) * | 140.4 (19.5) * | 144.8 (20.2) * | 144.5 (21.0) | <0.001 |
| BP diastolic (mmHg) | 79.5 (12.3) | 84.8 (12.8) * | 79.6 (12.9) * | 82.9 (12.9) * | 81.8 (13.0) | 0.029 |
| eGFR (mL/min/1.73 m2) | n.a. | 69.5 (21.0) | 69.8 (23.3) * | 67.3 (23.4) * | 68.8 (22.8) | <0.001 |
| WHO-5 (range 0–25) | n.a. | 13.8 (6.1) | 15.5 (5.5) * | 15.8 (5.1) | 15.3 (5.5) | <0.001 |
| Type 1 Diabetes (T1DM) | 2004 | 2009 | 2014 | 2019 | Total | p-Value for Trend |
|---|---|---|---|---|---|---|
| Number of data sets n (%) | 119 (22.9) | 136 (26.2) | 131 (25.2) | 133 (25.6) | 519 | |
| Female n (%) | 69 (58.5) | 76 (55.9) | 75 (57.3) | 73 (54.9) | 293 (56.6) | |
| Age (years) | 45.5 (18.9) | 41.3 (15.5) * | 44.3 (16.9) * | 47.2 (19.7) * | 44.5 (17.8) | <0.001 |
| Diabetes duration (years) | 17.5 (14.1) | 16.0 (13.1) * | 19.5 (12.1) * | 20.2 (12.8) * | 18.2 (13.1) | <0.001 |
| BMI (kg/m2) | 25.8 (3.7) | 25.9 (4.6) | 27.0 (5.4) | 27.2 (6.1) | 26.5 (5.1) | 0.005 |
| HbA1c (%) | 7.9 (1.8) | 7.9 (1.8) | 7.3 (1.6) * | 7.8 (1.8) | 7.7 (1.7) | 0.251 |
| BP systolic (mmHg) | 133.8 (19.0) | 132.2 (19.1) | 136.0 (19.9) | 131.3 (16.6) | 133.3 (18.8) | 0.682 |
| BP diastolic (mmHg) | 76.0 (11.7) | 80.2 (11.2) * | 82.0 (11.4) | 79.1 (12.0) | 79.4 (11.7) | 0.025 |
| eGFR (mL/min/1.73 m2) | 90.0 (30.1) | 88.5 (22.4) | 89.7 (30.0) | 83.3 (30.9) * | 87.6 (28.5) | 0.005 |
| WHO-5 (range 0–25) | n.a. | 12.8 (6.5) | 10.8 (6.2) | 14.0 (6.1) | 13.4 (6.2) | 0.299 |
| Type 2 Diabetes (T2DM) | ||||||
| Number of data sets n (%) | 380 (25.6) | 365 (24.6) | 338 (22.8) | 399 (26.9) | 1482 | |
| Female n (%) | 214 (56.6) | 202 (55.3) | 174 (51.5) | 170 (42.6) | 760 (51.4) | |
| Age (years) | 69.4 (13.8) | 67.9 (14.2) * | 70.6 (14.0) * | 69.9 (13.9) * | 69.4 (14.0) | <0.001 |
| Diabetes duration (years) | 13.0 (10.1) | 14.0 (10.2) | 14.5 (11.6) * | 14.7 (11.7) * | 14.1 (10.9) | <0.001 |
| BMI (kg/m2) | 30.6 (6.5) | 33.1 (7.5) * | 32.1 (7.1) | 31.7 (7.3) | 31.8 (7.1) | 0.018 |
| WHO class 1 obesity n (%) | 81 (26.0) | 82 (28.9) | 83 (27.9) | 90 (27.9) | 336 (27.6) | 0.666 |
| WHO class 2 obesity n (%) | 39 (12.5) | 50 (17.6) | 53 (17.8) | 51 (15.8) | 193 (15.9) | 0.279 |
| WHO class 3 obesity n (%) | 30 (9.6) | 44 (15.5) | 34 (11.4) | 34 (10.5) | 142 (11.7) | 0.911 |
| HbA1c (%) | 8.1 (2.0) | 7.9 (1.7) | 7.6 (1.8) | 7.5 (1.9) | 7.6 (1.9) | 0.002 |
| BP systolic (mmHg) | 140.6 (23.3) | 138.3 (24.1) | 142.7 (22.7) | 136.4 (21.7) * | 139.5 (23.1) | 0.139 |
| BP diastolic (mmHg) | 74.0 (14.1) | 77.0 (15.4) * | 77.7 (13.2) | 78.4 (13.7) | 76.8 (14.2) | <0.001 |
| eGFR (mL/min/1.73 m2) | 65.7 (27.4) | 63.9 (24.2) | 62.7 (29.5) | 60.8 (26.4) | 62.2 (27.1) | 0.017 |
| WHO-5 (range 0–25) | n.a. | 10.7 (6.4) | 13.4 (6.0) | 14.0 (6.2) | 13.5 (6.3) | <0.001 |
| Type 1 Diabetes (T1DM) | 2004 | 2009 | 2014 | 2019 | Total | p-Value for Trend |
|---|---|---|---|---|---|---|
| Nephropathy n (%) | n.a. | 74 (22.6) | 76 (25.4) | 107 (37.8) * | 278 (23.3) | <0.001 |
| Neuropathy n (%) | 43 (15.2) | 45 (13.8) | 84 (28.1) * | 78 (27.6) | 250 (21.0) | <0.001 |
| Retinopathy n (%) | n.a. | 81 (34.3) | 90 (41.7) | 84 (37.8) | 255 (37.8) | 0.156 |
| Non-severe hypoglycaemia (events/week) | n.a. | 1.82 (2.11) | 1.65 (2.06) | 1.69 (2.63) | 1.71 (2.28) | 0.329 |
| Severe hypoglycaemia (events/year) | 0.11 (0.51) | 0.14 (0.63) | 0.03 (0.20) | 0.16 (0.63) | 0.11 (0.53) | 0.834 |
| New foot-related complications n (%) | n.a. | 10 (4.8) | 7 (2.9) | 7 (3.4) | 25 (3.3) | 0.645 |
| New amputations n (%) | 0 | 1 (0.3) | 0 | 0 | 1 (0.1) | 0.969 |
| Hypertension n (%) | n.a. | 129 (54.7) | 118 (54.6) | 126 (56.8) | 373 (55.3) | 0.364 |
| Cardiovascular complications n (%) | n.a. | 45 (19.1) | 47 (21.8) | 57 (25.7) | 149 (22.1) | 0.044 |
| Type 2 Diabetes (T2DM) | ||||||
| Nephropathy n (%) | n.a. | 453 (37.9) | 510 (44.6) * | 623 (56.2) * | 1668 (38.1) | <0.001 |
| Neuropathy n (%) | 239 (25.6) | 375 (31.4) * | 501 (43.8) * | 434 (39.2) | 1549 (35.4) | <0.001 |
| Retinopathy n (%) | n.a. | 187 (19.9) | 192 (22.0) | 183 (20.9) | 562 (20.9) | 0.146 |
| Non-severe hypoglycaemia | n.a. | 0.25 (0.66) | 0.11 (0.49) | 0.12 (0.66) | 0.12 (0.60) | <0.001 |
| Severe hypoglycaemia | 0.00 (0.07) | 0.01 (0.15) | 0.01 (0.10) | 0.02 (0.29) | 0.01 (0.18) | 0.311 |
| New foot-related complications n (%) | n.a. | 110 (13.0) | 83 (9.3) | 79 (10.3) | 288 (10.3) | 0.126 |
| New amputations n (%) | 8 (0.9) | 13 (1.1) | 13 (1.1) | 4 (0.4) | 38 (0.9) | 0.733 |
| Hypertension n (%) | n.a. | 786 (83.4) | 758 (86.9) * | 768 (87.6) | 2312 (85.9) | 0.006 |
| Cardiovascular complications n (%) | n.a. | 383 (40.7) | 323 (37.0) | 348 (39.7) | 1054 (39.2) | 0.519 |
| Type 1 Diabetes (T1DM) | 2004 | 2009 | 2014 | 2019 | Total | p-Value |
|---|---|---|---|---|---|---|
| Nephropathy n (%) | n.a. | 32 (23.5) | 38 (29.0) | 57 (42.9) * | 140 (27.0) | 0.001 |
| Neuropathy n (%) | 31 (26.1) | 30 (18.2) * | 38 (29.0) * | 37 (27.8) | 113 (21.8) | 0.060 |
| Retinopathy n (%) | n.a. | 41 (24.8) | 80 (42.6) * | 50 (31.3) | 171 (33.3) | 0.130 |
| Non-severe hypoglycaemia (events/week) | n.a. | 2.6 (2.83) | 2.67 (2.78) | 2.55 (4.04) | 2.60 (3.31) | 0.875 |
| Severe hypoglycaemia (events/year) | 0.13 (0.50) | 0.40 (2.77) | 0.18 (0.64) | 0.29 (0.92) | 0.25 (1.55) | 0.516 |
| New foot-related complications n (%) | n.a. | 3 (4.3) | 8 (7.2) | 5 (4.7) | 16 (5.6) | 0.987 |
| New amputations n (%) | 0 | 1 (0.7) | 1 (0.8) | 0 | 2 (0.4) | 0.993 |
| Hypertension n (%) | n.a. | 82 (49.7) | 101 (53.7) | 81 (50.3) | 264 (51.4) | 0.653 |
| Cardiovascular complications n (%) | n.a. | 31 (18.8) | 43 (22.9) | 44 (27.3) | 118 (23.0) | 0.056 |
| Type 2 Diabetes (T2DM) | ||||||
| Nephropathy n (%) | n.a. | 170 (46.6) | 160 (47.3) | 269 (67.4) * | 624 (42.1) | <0.001 |
| Neuropathy n (%) | 168 (44.2) | 91 (24.9) * | 177 (52.4) * | 208 (52.1) | 644 (43.5) | <0.001 |
| Retinopathy n (%) | n.a. | 89 (20.7) | 99 (24.2) | 56 (15.2) * | 244 (20.2) | 0.162 |
| Non-severe hypoglycaemia (events/week) | n.a. | 0.37 (1.20) | 0.14 (0.61) | 0.26 (0.84) | 0.23 (0.85) | 0.928 |
| Severe hypoglycaemia (events/year) | 0.03 (0.17) | 0.10 (0.42) | 0.05 (0.28) | 0.12 (0.62) | 0.08 (0.43) | 0.060 |
| New foot-related complications n (%) | n.a. | 44 (29.1) | 77 (28.8) | 86 (29.3) | 207 (29.1) | 0.963 |
| New amputations n (%) | 11 (2.9) | 11 (3.0) | 14 (4.1) | 10 (2.5) | 46 (3.1) | 0.974 |
| Hypertension n (%) | n.a. | 364 (84.7) | 338 (82.6) | 312 (84.8) | 1014 (84.0) | 0.954 |
| Cardiovascular complications n (%) | n.a. | 265 (61.6) | 231 (56.5) | 165 (44.8) * | 661 (54.8) | <0.001 |
| Type 1 Diabetes (T1DM) | 2004 | 2009 | 2014 | 2019 | Total | p-Value |
|---|---|---|---|---|---|---|
| Human insulin n (%) | 202 (71.4) | 173 (52.9) * | 134 (44.8) | 106 (37.5) | 615 (51.6) | <0.001 |
| Insulin analogues n (%) | 67 (23.7) | 145 (44.3) * | 170 (56.9) * | 197 (69.6) * | 579 (48.6) | <0.001 |
| CSII n (%) | 69 (25.4) | 75 (25.1) | 70 (25.1) | 72 (30.4) | 286 (26.3) | <0.001 |
| Antihypertensive drugs n (%) | 125 (44.2) | 166 (50.8) | 171 (57.2) | 166 (58.7) | 628 (52.7) | <0.001 |
| Antihyperlipidaemic drugs n (%) | 38 (13.4) | 74 (22.6) * | 86 (28.8) | 81 (28.6) | 279 (23.4) | <0.001 |
| Total number of medications (n)2 | 4.0 (3.7–4.3) | 4.8 (4.4–5.2) * | 5.2 (4.7–5.6) * | 5.5 (5.0–6.0) * | 4.9 (4.6–5.1) | <0.001 |
| Type 2 Diabetes (T2DM) | ||||||
| Antidiabetic drugs n (%) | 747 (80.1) | 991 (82.9) | 891 (78.0) * | 845 (76.3) | 3474 (79.3) | 0.019 |
| Insulin n (%) | 598 (64.1) | 705 (59.0) | 625 (54.7) | 502 (45.3) * | 2430 (55.5) | <0.001 |
| Metformin n (%) | 223 (23.9) | 477 (39.9) * | 477 (41.7) | 526 (47.5) * | 1703 (38.9) | <0.001 |
| Sulfonylureas n (%) | 71 (7.6) | 96 (8.0) | 87 (7.6) | 83 (7.5) | 337 (7.7) | 0.468 |
| DPP-4 inhibitors n (%) | 0 | 27 (2.3) | 70 (6.1) * | 60 (5.4) | 157 (3.6) | <0.001 |
| SGLT-2 inhibitors n (%) | 0 | 0 | 13 (1.1) | 123 (11.1) * | 136 (3.1) | <0.001 |
| GLP-1 receptor agonists n (%) | 0 | 11 (0.9) | 13 (1.1) | 71 (6.4) * | 95 (2.2) | <0.001 |
| Dual therapy n (%) | 31 (3.3) | 77 (6.4) * | 121 (10.6) * | 185 (16.7) * | 414 (9.5) | <0.001 |
| Triple therapy n (%) | 0 | 7 (0.6) | 23 (2.0) | 18 (1.6) | 48 (1.1) | 0.17 |
| Antihypertensive drugs n (%) | 774 (83.0) | 1050 (87.9) * | 951 (83.2) * | 912 (82.3) | 3687 (84.2) | 0.357 |
| Antihyperlipidaemic drugs n (%) | 378 (40.5) | 605 (50.6) * | 571 (50.0) | 548 (49.5) | 2102 (48.0) | <0.001 |
| Total number of medications (n)2 | 6.1 (5.9–6.3) | 7.0 (6.8–7.2) * | 7.4 (7.2–7.6) * | 7.9 (7.7–8.2) * | 7.1 (7.0–7.2) | <0.001 |
| Type 1 Diabetes (T1DM) | 2004 | 2009 | 2014 | 2019 | Total | p-Value for Trend |
|---|---|---|---|---|---|---|
| Human insulin n (%) | 82 (68.9) | 57 (41.9) * | 22 (16.8) * | 26 (19.5) | 187 (36.0) | <0.001 |
| Insulin analogues n (%) | 21 (17.6) | 76 (55.9) * | 101 (77.1) * | 103 (77.4) | 301 (58.0) | <0.001 |
| CSII n (%) | 17 (15.7) | 39 (33.1) * | 37 (30.3) | 28 (32.2) | 121 (27.8) | 0.023 |
| Antihypertensive drugs n (%) | 64 (53.8) | 39 (28.7) * | 37 (28.2) | 51 (38.3) | 191 (36.8) | 0.029 |
| Antihyperlipidaemic drugs n (%) | 22 (18.5) | 11 (8.1) | 20 (15.3) | 22 (16.5) | 75 (14.5) | 0.839 |
| Total number of medications (n) | 5.1 (4.5–5.8) | 3.6 (2.9–4.2) * | 3.6 (2.9–4.3) | 5.0 (4.1–5.9) * | 4.3 (4.0–4.7) | 0.751 |
| Type 2 Diabetes (T2DM) | ||||||
| Antidiabetic drugs n (%) | 297 (78.2) | 281 (77.0) | 199 (58.9) * | 280 (70.2) * | 1057 (71.3) | <0.001 |
| Insulin n (%) | 243 (63.9) | 203 (55.6) | 158 (46.7) | 201 (50.4) | 805 (54.3) | <0.001 |
| Metformin n (%) | 44 (11.6) | 86 (23.6) * | 62 (18.3) | 125 (31.3) * | 317 (21.4) | <0.001 |
| Sulfonylureas n (%) | 38 (10.0) | 41 (11.2) | 4 (1.2) * | 12 (3.0) | 95 (6.4) | <0.001 |
| DPP-4 inhibitors n (%) | 0 | 5 (1.4) | 26 (7.7) * | 27 (6.8) | 58 (3.9) | <0.001 |
| SGLT-2 inhibitors n (%) | 0 | 0 | 4 (1.2) | 26 (6.5) | 30 (2.0) | 0.005 |
| GLP-1 receptor agonists n (%) | 0 | 9 (2.5) | 7 (2.1) | 27 (6.8) | 43 (2.9) | 0.017 |
| Dual therapy n (%) | 8 (2.1) | 22 (6.0) | 27 (8.0) | 48 (12.0) | 105 (7.1) | <0.001 |
| Triple therapy n (%) | 0 | 2 (0.5) | 6 (1.8) | 5 (1.3) | 13 (0.9) | 0.517 |
| Antihypertensive drugs n (%) | 221 (61.9) | 261 (75.7) * | 198 (78.9) * | 298 (88.2) * | 978 (75.8) | <0.001 |
| Antihyperlipidaemic drugs n (%) | 79 (20.8) | 137 (37.5) * | 111 (32.8) | 167 (41.9) * | 494 (33.3) | <0.001 |
| Total number of medications (n) | 5.6 (5.2–6.1) | 7.2 (6.7–7.6) * | 7.4 (6.8–7.9) | 9.2 (8.7–9.7) * | 7.3 (7.1–7.6) | <0.001 |
| Number of T1DM Patients n (%) | 2004 | 2009 | 2014 | 2019 | Total | p for Trend | p between ICT and CSII 2019 |
|---|---|---|---|---|---|---|---|
| ICT | 197 (72.4) | 216 (72.2) | 200 (71.7) | 160 (67.5) | 773 (71.1) | 0.008 | |
| CSII | 69 (25.4) | 75 (25.1) | 70 (25.1) | 72 (30.4) | 286 (26.3) | <0.001 | |
| HbA1c (%) | 0.037 | ||||||
| ICT | 7.3 (1.1) | 7.5 (1.1) * | 7.2 (1.1) * | 7.5 (1.1) | 7.4 (1.1) | 0.558 | |
| CSII | 7.2 (0.9) | 7.5 (0.9) * | 6.8 (1.1) * | 7.2 (0.9) * | 7.2 (1.0) | 0.225 | |
| Non-severe hypoglycaemia (events/week) | 0.002 | ||||||
| ICT | n.a. | 1.75 (2.22) | 1.52 (1.90) | 1.32 (2.00) | 1.53 (2.02) | 0.047 | |
| CSII | n.a. | 2.25 (1.78) | 2.18 (2.43) | 2.22 (2.21) | 2.20 (2.19) | 0.942 | |
| Severe hypoglycaemia (events/year) | 0.216 | ||||||
| ICT | 0.12 (0.58) | 0.14 (0.62) | 0.04 (0.19) | 0.17 0.67) | 0.12 (0.55) | 0.895 | |
| CSII | 0.07 (0.25) | 0.18 (0.68) | 0 | 0.09 (0.37) | 0.08 (0.41) | 0.627 |
| Number of T1DM Patients n (%) | 2004 | 2009 | 2014 | 2019 | Total | p for Trend | p between ICT and CSII 2019 |
|---|---|---|---|---|---|---|---|
| ICT | 85 (78.7) | 70 (59.3) | 72 (59.0) | 58 (66.7) | 285 (65.5) | 0.063 | |
| CSII | 17 (15.7) | 39 (33.1) * | 37 (30.3) | 28 (32.2) | 121 (27.8) | 0.004 | |
| HbA1c (%) | 0.399 | ||||||
| ICT | 8.0 (1.9) | 7.8 (1.5) | 7.4 (1.4) | 8.0 (1.8) | 7.7 (1.6) | 0.673 | |
| CSII | 6.9 (1.1) | 7.7 (1.3) | 6.9 (1.2) | 7.6 (1.5) | 7.3 (1.3) | 0.771 | |
| Non-severe hypoglycaemia (events/week) | 0.507 | ||||||
| ICT | n.a. | 2.25 (2.88) | 2.35 (2.66) | 2.12 (3.12) | 2.24 (2.84) | 0.550 | |
| CSII | n.a. | 3.71 (1.34) | 3.09 (2.43) | 2.59 (2.65) | 3.06 (2.40) | 0.089 | |
| Severe hypoglycaemia (events/year) | 0.133 | ||||||
| ICT | 0.14 (0.54) | 0.18 (0.69) | 0.22 (0.76) | 0.44 (1.12) | 0.23 (0.80) | 0.581 | |
| CSII | 0.06 (0.25) | 0.18 (0.82) | 0.16 (0.5) | 0.15 (0.54) | 0.15 (0.61) | 0.759 |
Disclaimer/Publisher’s Note: The statements, opinions and data contained in all publications are solely those of the individual author(s) and contributor(s) and not of MDPI and/or the editor(s). MDPI and/or the editor(s) disclaim responsibility for any injury to people or property resulting from any ideas, methods, instructions or products referred to in the content. |
© 2023 by the authors. Licensee MDPI, Basel, Switzerland. This article is an open access article distributed under the terms and conditions of the Creative Commons Attribution (CC BY) license (https://creativecommons.org/licenses/by/4.0/).
Share and Cite
Roth, M.; Lehmann, T.; Kloos, C.; Schmidt, S.; Kellner, C.; Wolf, G.; Müller, N. Metabolic Control, Diabetic Complications and Drug Therapy in a Cohort of Patients with Type 1 and Type 2 Diabetes in Secondary and Tertiary Care between 2004 and 2019. Int. J. Environ. Res. Public Health 2023, 20, 2631. https://doi.org/10.3390/ijerph20032631
Roth M, Lehmann T, Kloos C, Schmidt S, Kellner C, Wolf G, Müller N. Metabolic Control, Diabetic Complications and Drug Therapy in a Cohort of Patients with Type 1 and Type 2 Diabetes in Secondary and Tertiary Care between 2004 and 2019. International Journal of Environmental Research and Public Health. 2023; 20(3):2631. https://doi.org/10.3390/ijerph20032631
Chicago/Turabian StyleRoth, Matthias, Thomas Lehmann, Christof Kloos, Sebastian Schmidt, Christiane Kellner, Gunter Wolf, and Nicolle Müller. 2023. "Metabolic Control, Diabetic Complications and Drug Therapy in a Cohort of Patients with Type 1 and Type 2 Diabetes in Secondary and Tertiary Care between 2004 and 2019" International Journal of Environmental Research and Public Health 20, no. 3: 2631. https://doi.org/10.3390/ijerph20032631