
Delineating the Intrinsic, Long-Term Path of Land Degradation: A Spatially Explicit Transition Matrix for Italy, 1960–2010
 ,
,  , ,
, , 
Abstract
:1. Introduction
2. Materials and Methods
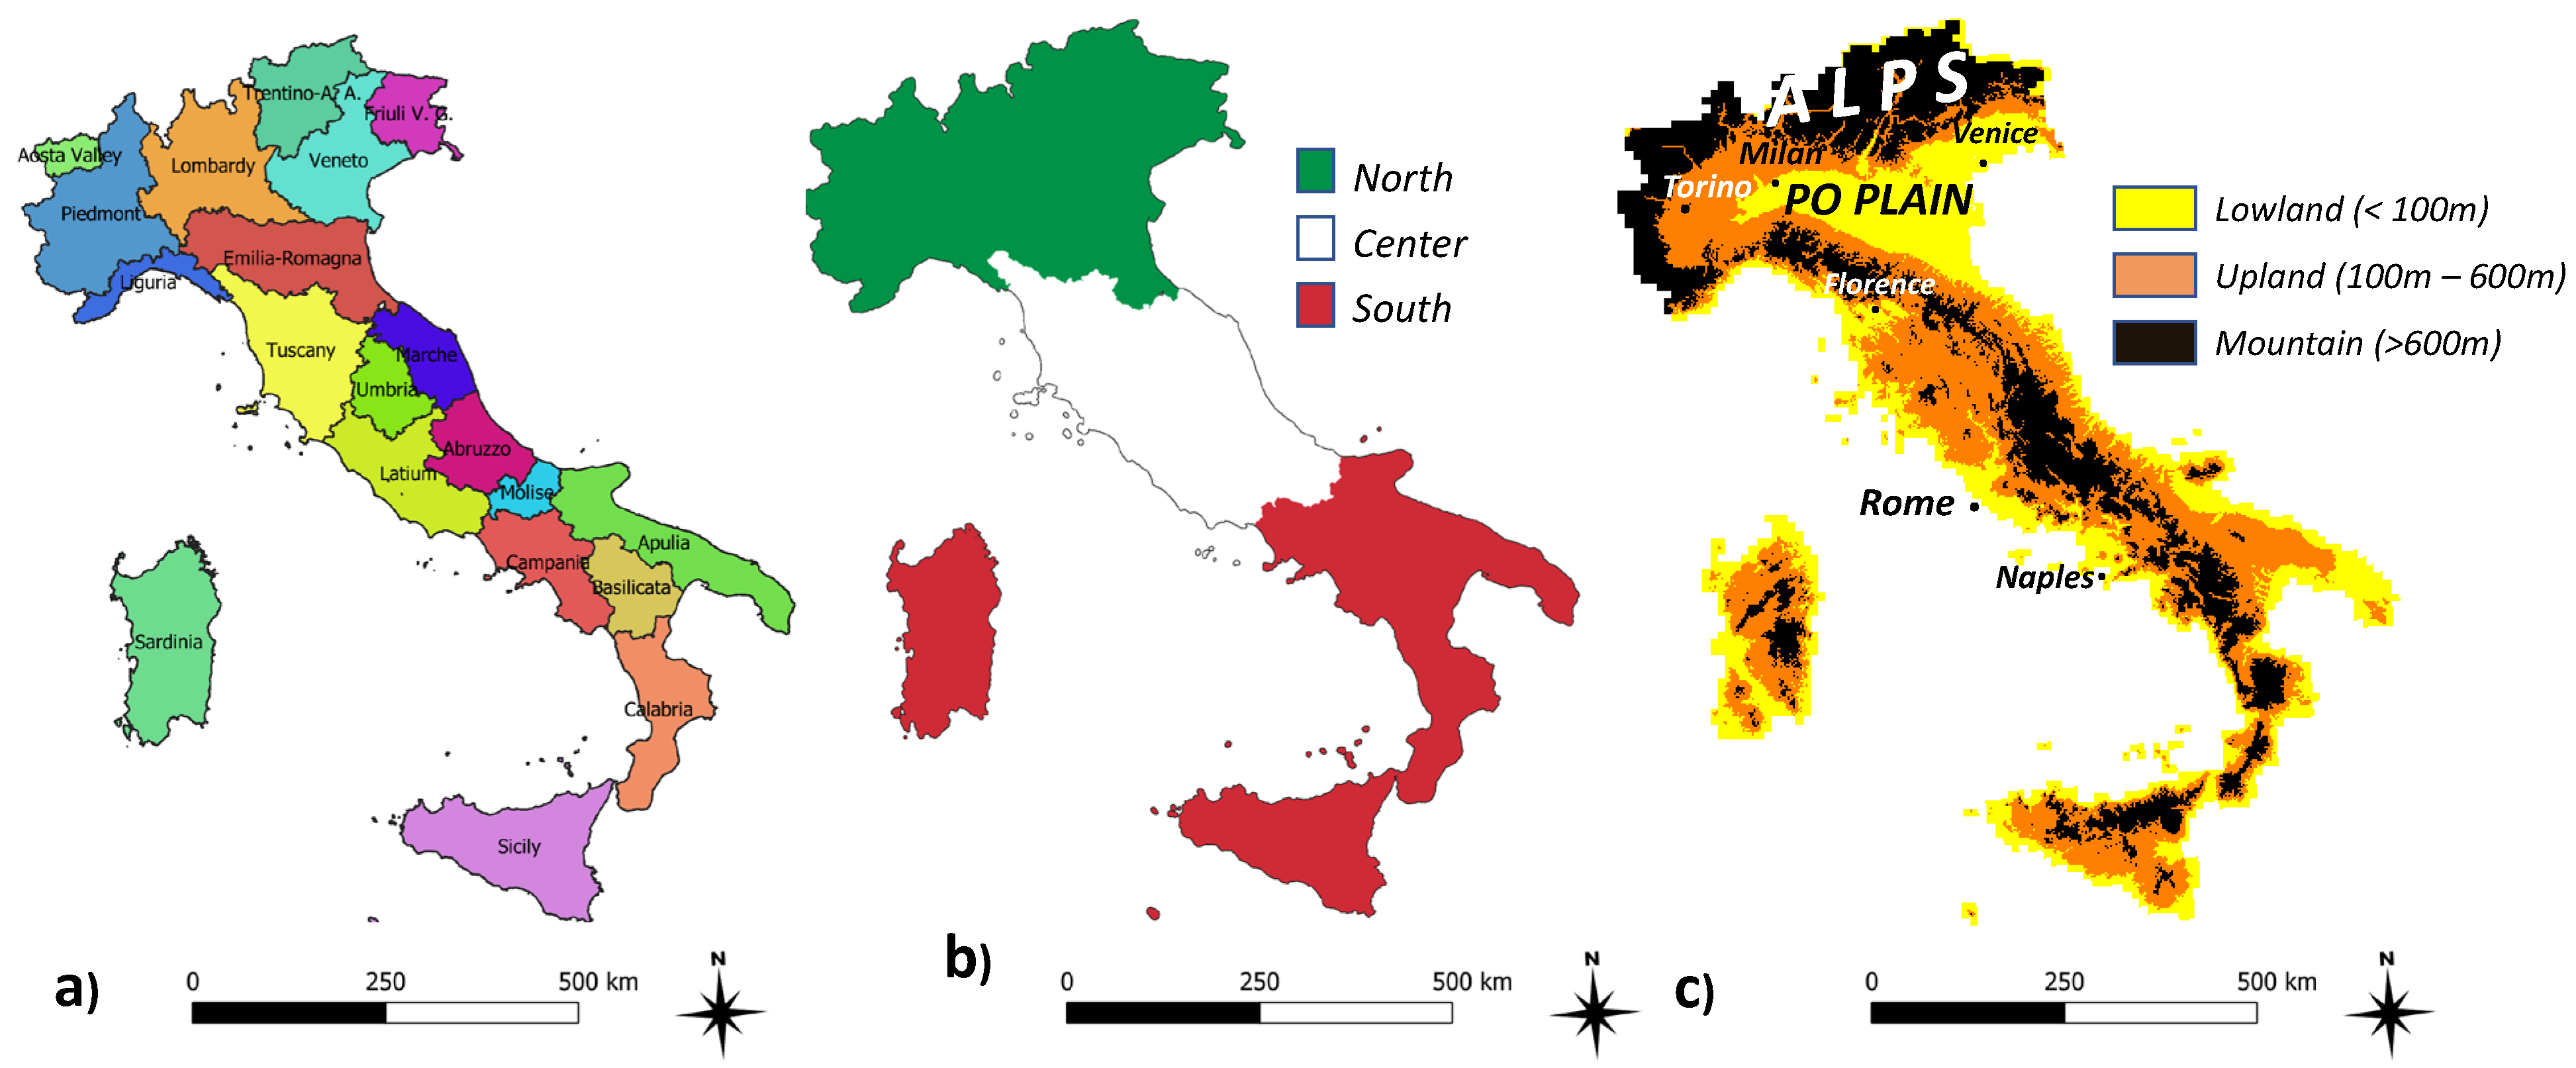
2.1. Investigated Area
2.2. Input Data and Variables in the ESA Model
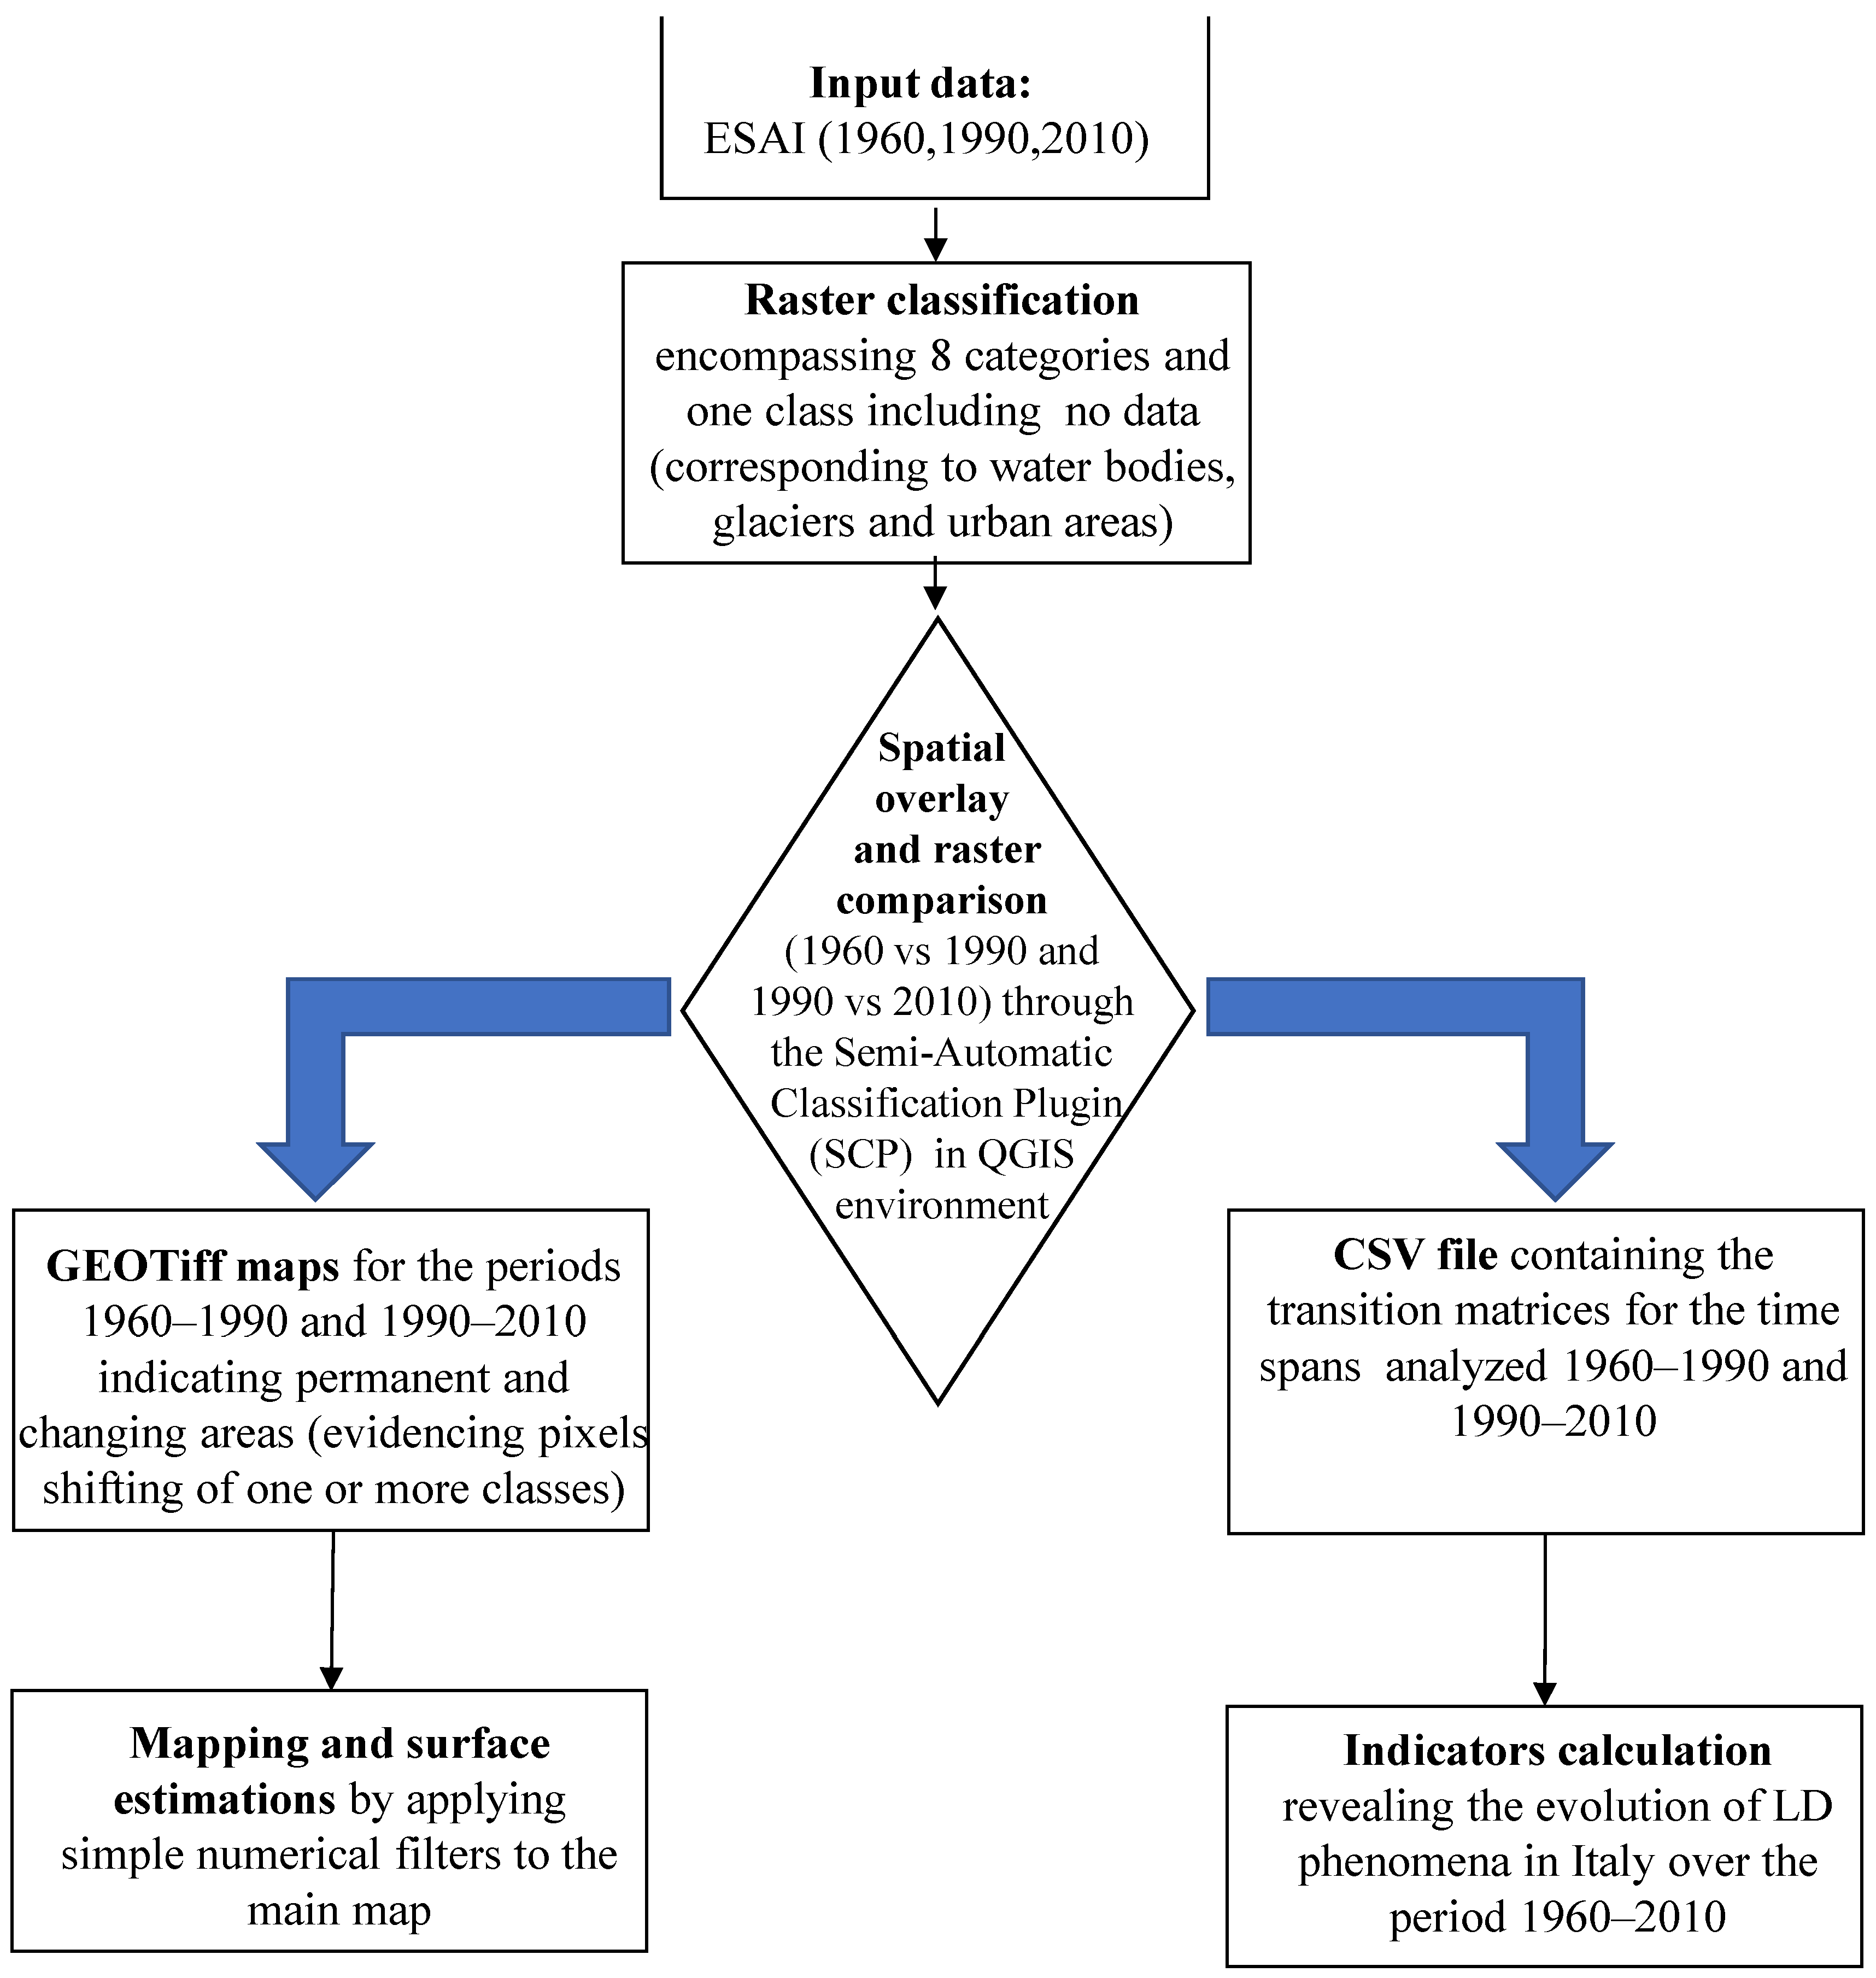
2.3. Procedure
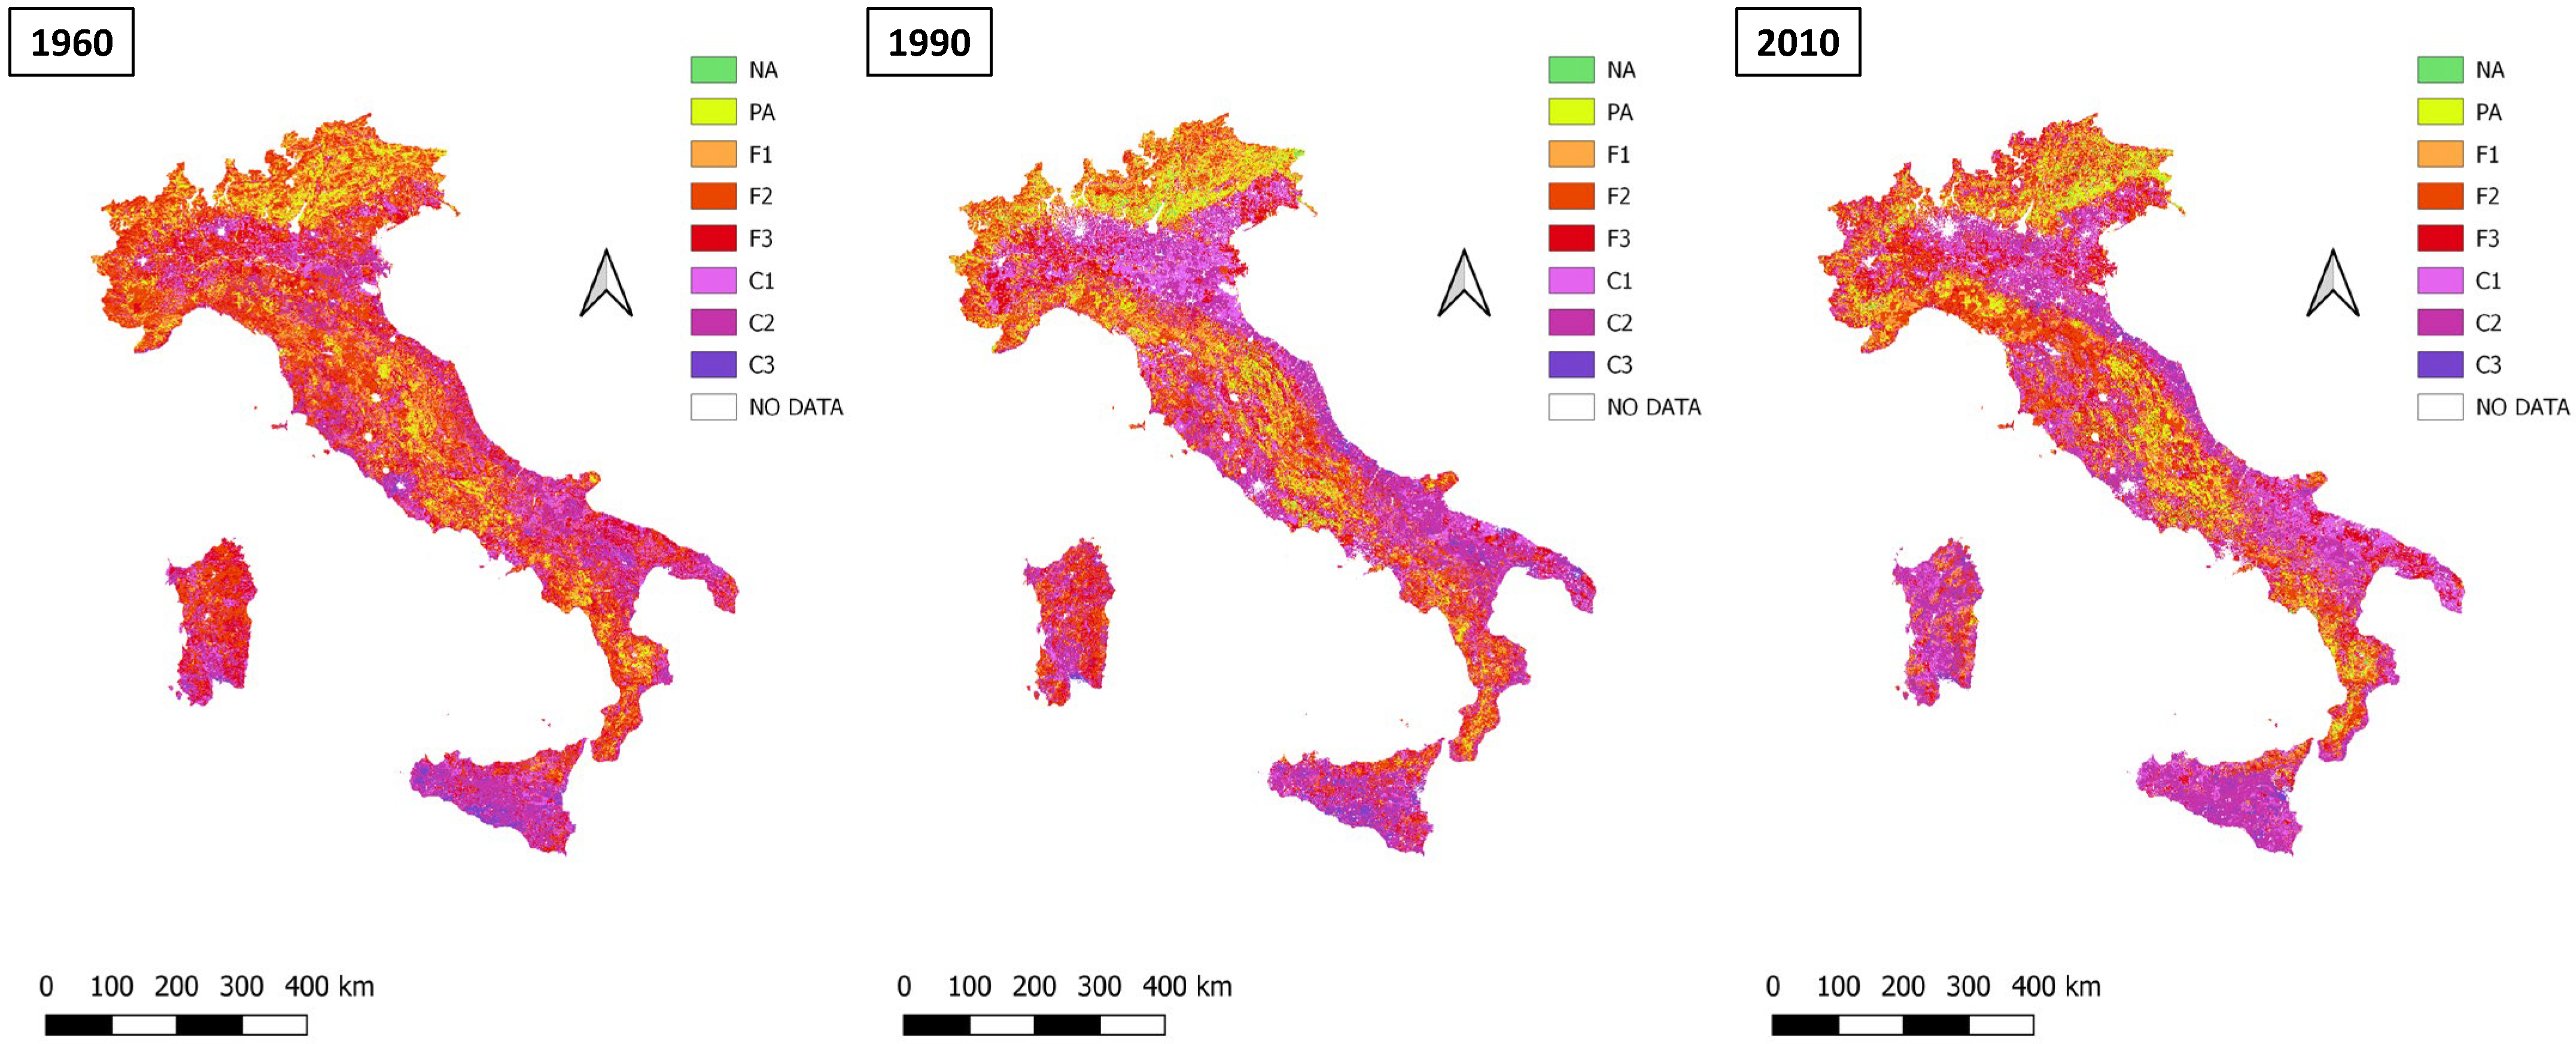
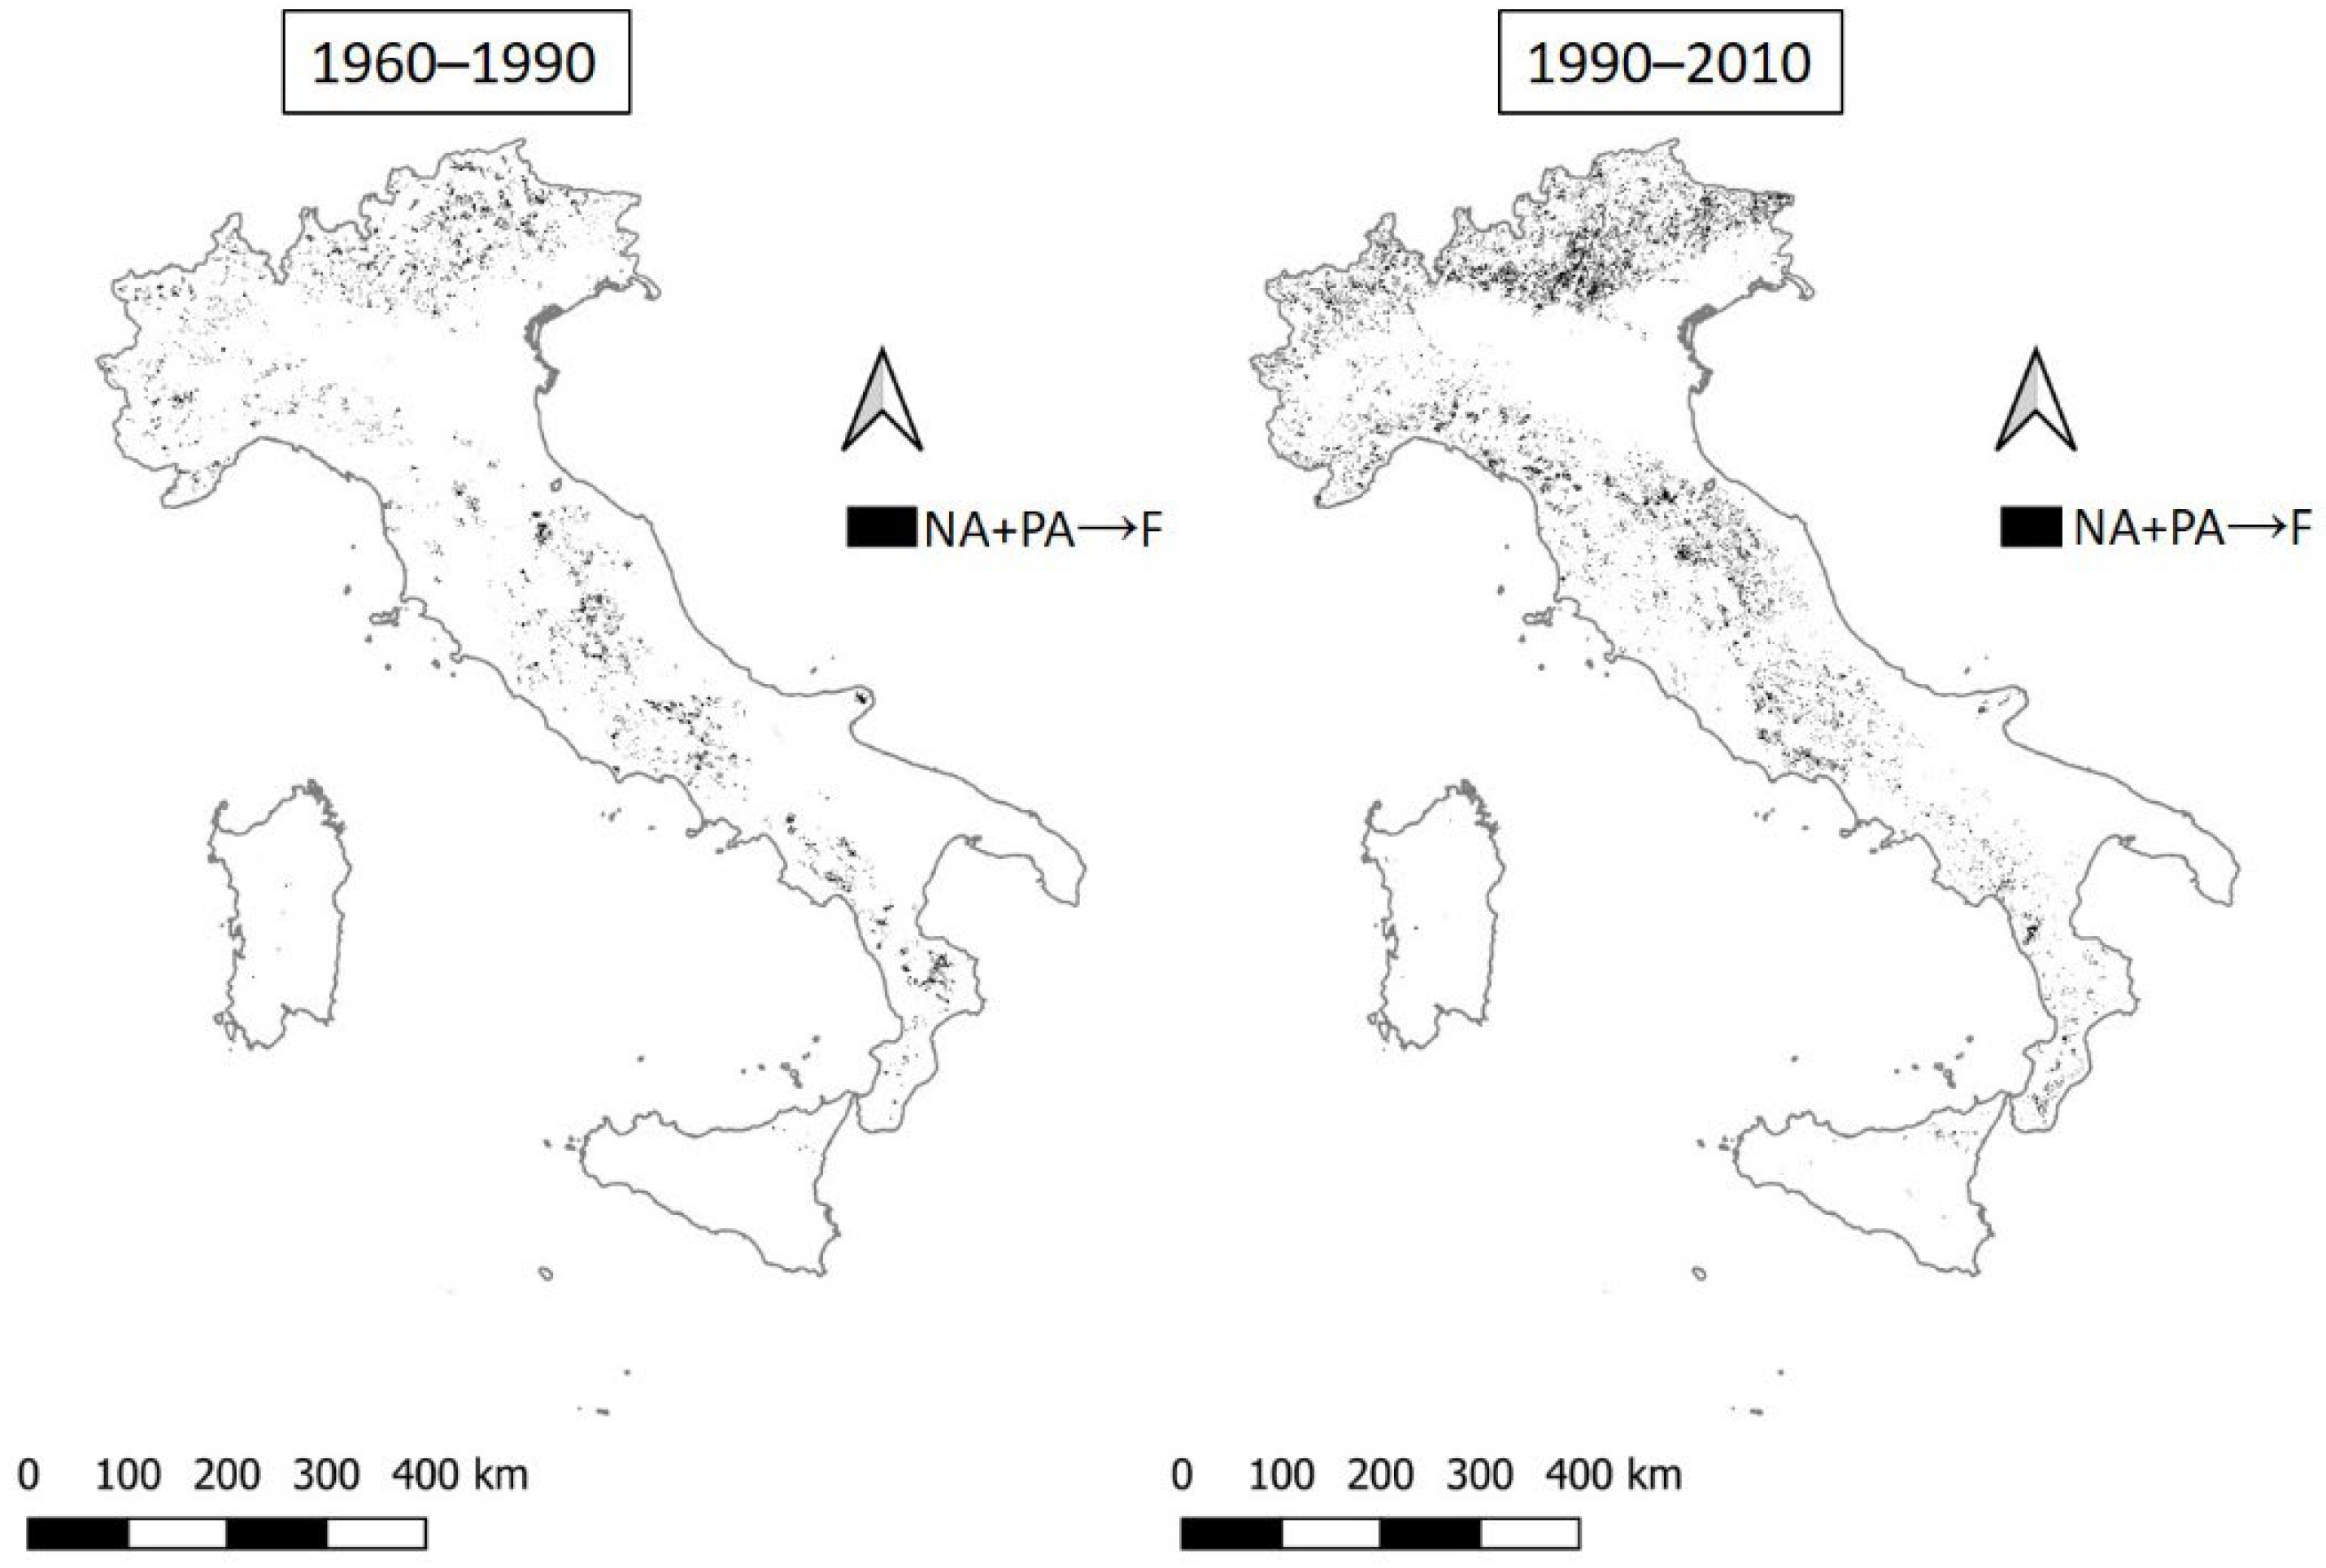
3. Results
4. Discussion
5. Conclusions
Author Contributions
Funding
Institutional Review Board Statement
Informed Consent Statement
Data Availability Statement
Conflicts of Interest
References
- Millennium Ecosystem Assessment—MEA. Ecosystems and Human Well-Being: Wetlands and Water Synthesis; World Resources Institute: Washington, DC, USA, 2005. [Google Scholar]
- Joint Research Centre (European Commission); Hill, J.; Von Maltitz, G.; Sommer, S.; Reynolds, J.; Hutchinson, C.; Cherlet, M. World Atlas of Desertification: Rethinking Land Degradation and Sustainable Land Management; Publications Office of the European Union: Luxembourg, 2018. [Google Scholar]
- Vicente-Serrano, S.M.; Cabello, D.; Tomás-Burguera, M.; Martín-Hernández, N.; Beguería, S.; Azorin-Molina, C.; Kenawy, A.E. Drought variability and land degradation in semiarid regions: Assessment using remote sensing data and drought indices (1982–2011). Remote Sens. 2015, 7, 4391–4423. [Google Scholar] [CrossRef] [Green Version]
- Albano, R.; Samela, C.; Crăciun, I.; Manfreda, S.; Adamowski, J.; Sole, A.; Sivertun, Å.; Ozunu, A. Large scale flood risk mapping in data scarce environments: An application for Romania. Water 2020, 12, 1834. [Google Scholar] [CrossRef]
- Achour, Y.; Saidani, Z.; Touati, R.; Pham, Q.B.; Pal, S.C.; Mustafa, F.; Balik Sanli, F. Assessing landslide susceptibility using a machine learning-based approach to achieving land degradation neutrality. Environ. Earth Sci. 2021, 80, 575. [Google Scholar] [CrossRef]
- Samela, C.; Coluzzi, R.; Imbrenda, V.; Manfreda, S.; Lanfredi, M. Satellite flood detection integrating hydrogeomorphic and spectral indices. GISci. Remote Sens. 2022, 59, 1997–2018. [Google Scholar] [CrossRef]
- Seto, K.C.; Fragkias, M.; Güneralp, B.; Reilly, M.K. A meta-analysis of global urban land expansion. PLoS ONE 2011, 6, e23777. [Google Scholar] [CrossRef]
- Bianchini, L.; Egidi, G.; Alhuseen, A.; Sateriano, A.; Cividino, S.; Clemente, M.; Imbrenda, V. Toward a dualistic growth? Population increase and land-use change in Rome, Italy. Land 2021, 10, 749. [Google Scholar] [CrossRef]
- Imbrenda, V.; Quaranta, G.; Salvia, R.; Egidi, G.; Salvati, L.; Prokopovà, M.; Coluzzi, R.; Lanfredi, M. Land degradation and metropolitan expansion in a peri-urban environment. Geomat. Nat. Hazards Risk 2021, 12, 1797–1818. [Google Scholar] [CrossRef]
- Nickayin, S.S.; Salvati, L.; Coluzzi, R.; Lanfredi, M.; Halbac-Cotoara-Zamfir, R.; Salvia, R.; Quaranta, G.; Alhuseen, A.; Gaburova, L. What happens in the city when long-term urban expansion and (un)sustainable fringe development occur: The case study of Rome. ISPRS Int. J. Geo-Inf. 2021, 10, 231. [Google Scholar] [CrossRef]
- Jie, C.; Jing-zhang, C.; Man-zhi, T.; Zi-tong, G. Soil degradation: A global problem endangering sustainable development. J. Geogr. Sci. 2002, 12, 243–252. [Google Scholar] [CrossRef]
- Keesstra, S.; Mol, G.; De Leeuw, J.; Okx, J.; Molenaar, C.; De Cleen, M.; Visser, S. Soil-related sustainable development goals: Four concepts to make land degradation neutrality and restoration work. Land 2018, 7, 133. [Google Scholar] [CrossRef]
- Bakr, N.; Weindorf, D.C.; Bahnassy, M.H.; El-Badawi, M.M. Multi-temporal assessment of land sensitivity to desertification in a fragile agro-ecosystem: Environmental indicators. Ecol. Indic. 2012, 15, 271–280. [Google Scholar] [CrossRef]
- Basso, B.; De Simone, L.; Cammarano, D.; Martin, E.C.; Margiotta, S.; Grace, P.R.; Yeh, M.L.; Chou, T.Y. Evaluating responses to land degradation mitigation measures in Southern Italy. Int. J. Environ. Res. 2012, 6, 367–380. [Google Scholar] [CrossRef]
- Imeson, A. Desertification, Land Degradation and Sustainability; John Wiley & Sons: Chichester, UK, 2011. [Google Scholar]
- Symeonakis, E.; Karathanasis, N.; Koukoulas, S.; Panagopoulos, G. Monitoring sensitivity to land degradation and desertification with the environmentally sensitive area index: The case of Lesvos Island. Land Degrad. Dev. 2016, 27, 1562–1573. [Google Scholar] [CrossRef] [Green Version]
- Prăvălie, R.; Patriche, C.; Bandoc, G. Quantification of land degradation sensitivity areas in southern and central southeastern Europe. new results based on improving DISMED methodology with new climate data. Catena 2017, 158, 309–320. [Google Scholar] [CrossRef]
- Geist, H.J.; Lambin, E.F. Dynamic causal patterns of desertification. BioScience 2004, 54, 817–829. [Google Scholar] [CrossRef] [Green Version]
- Gisladottir, G.; Stocking, M. Land degradation control and its global environmental benefits. Land Degrad. Dev. 2005, 16, 99–112. [Google Scholar] [CrossRef]
- Herrmann, S.M.; Hutchinson, C.F. The changing contexts of the desertification debate. J. Arid Environ. 2005, 63, 538–555. [Google Scholar] [CrossRef]
- Warren, A. Land degradation is contextual. Land Degrad. Dev. 2002, 13, 449–459. [Google Scholar] [CrossRef]
- Cowie, A.L.; Orr, B.J.; Castillo Sanchez, V.M.; Chasek, P.; Crossman, N.D.; Erlewein, A.; Louwagie, G.; Maron, M.; Metternicht, G.I.; Minelli, S.; et al. Land in balance: The scientific conceptual framework for land degradation neutrality. Environ. Sci. Policy 2018, 79, 25–35. [Google Scholar] [CrossRef]
- Rosa, W. (Ed.) Transforming our world: The 2030 agenda for sustainable development. In A New Era in Global Health; Springer Publishing Company: New York, NY, USA, 2017. [Google Scholar]
- Montanarella, L.; Panagos, P. The Relevance of sustainable soil management within the European green deal. Land Use Policy 2021, 100, 104950. [Google Scholar] [CrossRef]
- Zambon, I.; Benedetti, A.; Ferrara, C.; Salvati, L. Soil matters? A multivariate analysis of socioeconomic constraints to urban expansion in Mediterranean Europe. Ecol. Econ. 2018, 146, 173–183. [Google Scholar] [CrossRef]
- Lahmar, R.; Ruellan, A. Soil degradation in the Mediterranean region and cooperative strategies. Cah. Agric. 2007, 16, 318. [Google Scholar]
- Panagos, P.; Ballabio, C.; Poesen, J.; Lugato, E.; Scarpa, S.; Montanarella, L.; Borrelli, P. A soil erosion indicator for supporting agricultural, environmental and climate policies in the European Union. Remote Sens. 2020, 12, 1365. [Google Scholar] [CrossRef]
- Aguilera, E.; Lassaletta, L.; Sanz-Cobena, A.; Garnier, J.; Vallejo, A. The potential of organic fertilizers and water management to reduce N2O emissions in Mediterranean climate cropping systems. A review. Agric. Ecosyst. Environ. 2013, 164, 32–52. [Google Scholar] [CrossRef] [Green Version]
- Lagacherie, P.; Álvaro-Fuentes, J.; Annabi, M.; Bernoux, M.; Bouarfa, S.; Douaoui, A.; Grünberger, O.; Hammani, A.; Montanarella, L.; Mrabet, R.; et al. Managing Mediterranean Soil Resources under Global Change: Expected Trends and Mitigation Strategies. Available online: https://publications.jrc.ec.europa.eu/repository/handle/JRC107116 (accessed on 7 December 2022).
- Guittonny-Philippe, A.; Masotti, V.; Höhener, P.; Boudenne, J.-L.; Viglione, J.; Laffont-Schwob, I. Constructed wetlands to reduce metal pollution from industrial catchments in aquatic Mediterranean ecosystems: A review to overcome obstacles and suggest potential solutions. Environ. Int. 2014, 64, 1–16. [Google Scholar] [CrossRef] [PubMed]
- Shukla, P.R.; Skeg, J.; Buendia, E.C.; Masson-Delmotte, V.; Pörtner, H.-O.; Roberts, D.C.; Zhai, P.; Slade, R.; Connors, S.; van Diemen, S.; et al. Climate Change and Land: An IPCC Special Report on Climate Change, Desertification, Land Degradation, Sustainable Land Management, Food Security, and Greenhouse Gas Fluxes in Terrestrial Ecosystems; International Plant Protection Convention: Rome, Italy, 2019. [Google Scholar]
- Caloiero, T.; Veltri, S.; Caloiero, P.; Frustaci, F. Drought analysis in Europe and in the Mediterranean basin using the standardized precipitation index. Water 2018, 10, 1043. [Google Scholar] [CrossRef] [Green Version]
- Lanfredi, M.; Coluzzi, R.; Imbrenda, V.; Macchiato, M.; Simoniello, T. Analyzing space–time coherence in precipitation seasonality across different European climates. Remote Sens. 2020, 12, 171. [Google Scholar] [CrossRef] [Green Version]
- Spinoni, J.; Naumann, G.; Vogt, J.; Barbosa, P. Meteorological Droughts in Europe: Events and Impacts: Past Trends and Future Projections; European Union, Publications Office of the European Union: Luxembourg, 2016; p. 134. [Google Scholar]
- Coluzzi, R.; Fascetti, S.; Imbrenda, V.; Italiano, S.S.P.; Ripullone, F.; Lanfredi, M. Exploring the use of sentinel-2 data to monitor heterogeneous effects of contextual drought and heatwaves on Mediterranean forests. Land 2020, 9, 325. [Google Scholar] [CrossRef]
- Coluzzi, R.; Bianchini, L.; Egidi, G.; Cudlin, P.; Imbrenda, V.; Salvati, L.; Lanfredi, M. Density matters? Settlement expansion and land degradation in peri-urban and rural districts of Italy. Environ. Impact Assess. Rev. 2022, 92, 106703. [Google Scholar] [CrossRef]
- Lanfredi, M.; Egidi, G.; Bianchini, L.; Salvati, L. One size does not fit all: A tale of polycentric development and land degradation in Italy. Ecol. Econ. 2022, 192, 107256. [Google Scholar] [CrossRef]
- Nickayin, S.S.; Coluzzi, R.; Marucci, A.; Bianchini, L.; Salvati, L.; Cudlin, P.; Imbrenda, V. Desertification risk fuels spatial polarization in ‘affected’ and ‘unaffected’ landscapes in Italy. Sci. Rep. 2022, 12, 747. [Google Scholar] [CrossRef] [PubMed]
- Rubio, J.L.; Bochet, E. Desertification indicators as diagnosis criteria for desertification risk assessment in Europe. J. Arid Environ. 1998, 39, 113–120. [Google Scholar] [CrossRef]
- Hoffman, M.T.; Todd, S. A national review of land degradation in South Africa: The influence of biophysical and socio-economic factors. J. S. Afr. Stud. 2000, 26, 743–758. [Google Scholar] [CrossRef]
- Chabrillat, S. Land degradation indicators: Spectral indices. Ann. Arid Zone 2006, 45, 331–354. [Google Scholar]
- Wessels, K.J.; van den Bergh, F.; Scholes, R.J. Limits to detectability of land degradation by trend analysis of vegetation index data. Remote Sens. Environ. 2012, 125, 10–22. [Google Scholar] [CrossRef]
- Vu, Q.M.; Le, Q.B.; Frossard, E.; Vlek, P.L.G. Socio-economic and biophysical determinants of land degradation in Vietnam: An integrated causal analysis at the national level. Land Use Policy 2014, 36, 605–617. [Google Scholar] [CrossRef]
- Higginbottom, T.P.; Symeonakis, E. Assessing land degradation and desertification using vegetation index data: Current frameworks and future directions. Remote Sens. 2014, 6, 9552–9575. [Google Scholar] [CrossRef] [Green Version]
- Pignatti, S.; Acito, N.; Amato, U.; Casa, R.; Castaldi, F.; Coluzzi, R.; De Bonis, R.; Diani, M.; Imbrenda, V.; Laneve, G. Environmental Products Overview of the Italian Hyperspectral Prisma Mission: The SAP4PRISMA Project; IEEE: Piscataway, NJ, USA, 2015; pp. 3997–4000. [Google Scholar]
- Lorenz, K.; Lal, R.; Ehlers, K. Soil organic carbon stock as an indicator for monitoring land and soil degradation in relation to United Nations’ sustainable development goals. Land Degrad. Dev. 2019, 30, 824–838. [Google Scholar] [CrossRef]
- Feng, S.; Zhao, W.; Zhan, T.; Yan, Y.; Pereira, P. Land degradation neutrality: A review of progress and perspectives. Ecol. Indic. 2022, 144, 109530. [Google Scholar] [CrossRef]
- Contador, J.F.L.; Schnabel, S.; Gutiérrez, A.G.; Fernández, M.P. Mapping sensitivity to land degradation in Extremadura. SW Spain. Land Degrad. Dev. 2009, 20, 129–144. [Google Scholar] [CrossRef]
- Budak, M.; Günal, H.; Çelik, İ.; Yıldız, H.; Acir, N.; Acar, M. Environmental sensitivity to desertification in Northern Mesopotamia; application of modified MEDALUS by using analytical hierarchy process. Arab. J. Geosci. 2018, 11, 481. [Google Scholar] [CrossRef]
- Uzuner, C.; Dengïz, O. Desertification risk assessment in Turkey based on environmentally sensitive areas. Ecol. Indic. 2020, 114, 106295. [Google Scholar] [CrossRef]
- Perović, V.; Kadović, R.; Đurđević, V.; Pavlović, D.; Pavlović, M.; Čakmak, D.; Mitrović, M.; Pavlović, P. Major drivers of land degradation risk in Western Serbia: Current trends and future scenarios. Ecol. Indic. 2021, 123, 107377. [Google Scholar] [CrossRef]
- Imbrenda, V.; D’Emilio, M.; Lanfredi, M.; Ragosta, M.; Simoniello, T. Indicators of land degradation vulnerability due to anthropic factors: Tools for an efficient planning. In Geographic Information Analysis for Sustainable Development and Economic Planning: New Technologies; IGI Global: Hershey, PA, USA, 2013; pp. 87–1011. [Google Scholar]
- Salvati, L.; Zitti, M. Land degradation in the Mediterranean Basin: Linking bio-physical and economic factors into an ecological. Biota 2005, 5, 67–77. [Google Scholar]
- Meza Mori, G.; Torres Guzmán, C.; Oliva-Cruz, M.; Salas López, R.; Marlo, G.; Barboza, E. Spatial analysis of environmentally sensitive areas to soil degradation using MEDALUS model and GIS in Amazonas (Peru): An alternative for ecological restoration. Sustainability 2022, 14, 14866. [Google Scholar] [CrossRef]
- Elnashar, A.; Zeng, H.; Wu, B.; Gebremicael, T.G.; Marie, K. Assessment of environmentally sensitive areas to desertification in the Blue Nile Basin driven by the MEDALUS-GEE framework. Sci. Total Environ. 2022, 815, 152925. [Google Scholar] [CrossRef]
- Fernández, R.J. Do humans create deserts? Trends Ecol. Evol. 2002, 17, 6–7. [Google Scholar] [CrossRef]
- Drake, N.A.; Vafeidis, A. Review of spatial and temporal methods for assessing land degradation in the Mediterranean. Adv. Environ. Monit. Model. 2008, 1, 15–51. [Google Scholar]
- Johnson, D.L.; Lewis, L.A. Land Degradation: Creation and Destruction; Rowman & Littlefield: Lanham, MD, USA, 2007. [Google Scholar]
- Ibáñez, J.; Valderrama, J.M.; Puigdefábregas, J. Assessing desertification risk using system stability condition analysis. Ecol. Model. 2008, 213, 180–190. [Google Scholar] [CrossRef] [Green Version]
- Symeonakis, E.; Calvo-Cases, A.; Arnau-Rosalen, E. Land use change and land degradation in Southeastern Mediterranean Spain. Environ. Manag. 2007, 40, 80–94. [Google Scholar] [CrossRef]
- Kosmas, C.; Karamesouti, M.; Kounalaki, K.; Detsis, V.; Vassiliou, P.; Salvati, L. Land degradation and long-term changes in agro-pastoral systems: An empirical analysis of ecological resilience in Asteroussia—Crete (Greece). CATENA 2016, 147, 196–204. [Google Scholar] [CrossRef]
- Delfanti, L.; Colantoni, A.; Recanatesi, F.; Bencardino, M.; Sateriano, A.; Zambon, I.; Salvati, L. Solar Plants, Environmental degradation and local socioeconomic contexts: A case study in a Mediterranean country. Environ. Impact Assess. Rev. 2016, 61, 88–93. [Google Scholar] [CrossRef]
- Salvati, L.; Zitti, M. Territorial disparities, natural resource distribution, and land degradation: A case study in Southern Europe. GeoJournal 2007, 70, 185–194. [Google Scholar] [CrossRef]
- Bajocco, S.; Salvati, L.; Ricotta, C. Land degradation versus fire: A spiral process? Prog. Phys. Geogr. Earth Environ. 2011, 35, 3–18. [Google Scholar] [CrossRef]
- Salvati, L.; Zitti, M. The environmental “risky” region: Identifying land degradation processes through integration of socio-economic and ecological indicators in a multivariate regionalization model. Environ. Manag. 2009, 44, 888–898. [Google Scholar] [CrossRef] [PubMed]
- Chelli, F.M.; Ciommi, M.; Emili, A.; Gigliarano, C.; Taralli, S. Assessing the equitable and sustainable well-being of the Italian provinces. Int. J. Uncertain. Fuzziness Knowl.-Based Syst. 2016, 24, 39–62. [Google Scholar] [CrossRef]
- Ciommi, M.; Chelli, F.M.; Carlucci, M.; Salvati, L. Urban growth and demographic dynamics in Southern Europe: Toward a new statistical approach to regional science. Sustainability 2018, 10, 2765. [Google Scholar] [CrossRef] [Green Version]
- Ciommi, M.; Gentili, A.; Ermini, B.; Gigliarano, C.; Chelli, F.M.; Gallegati, M. Have your cake and eat it too: The well-being of the Italians (1861–2011). Soc. Indic. Res. 2017, 134, 473–509. [Google Scholar] [CrossRef]
- Costantini, E.A.C.; Barbetti, M.; Fantappié, G.; L’Abate, G.; Lorenzetti, R. The soil map of Italy: A hierarchy of geodatabases, from soil regions to sub-systems. In Global Soil Map; Taylor & Francis: London, UK, 2014; pp. 109–112. [Google Scholar]
- Lanfredi, M.; Coppola, R.; D’Emilio, M.; Imbrenda, V.; Macchiato, M.; Simoniello, T. A geostatistics-assisted approach to the deterministic approximation of climate data. Environ. Model. Softw. 2015, 66, 69–77. [Google Scholar] [CrossRef]
- Beck, H.E.; Zimmermann, N.E.; McVicar, T.R.; Vergopolan, N.; Berg, A.; Wood, E.F. Present and future Köppen-Geiger climate classification maps at 1-km resolution. Sci. Data 2018, 5, 180214. [Google Scholar] [CrossRef] [Green Version]
- Blasi, C.; Filibeck, G.; Frondoni, R.; Rosati, L.; Smiraglia, D. The map of the vegetation series of Italy. Fitosociologia 2004, 41, 21–25. [Google Scholar]
- Salvati, L.; Petitta, M.; Ceccarelli, T.; Perini, L.; Battista, F.D.; Scarascia, M.E.V. Italy’s renewable water resources as estimated on the basis of the monthly water balance. Irrig. Drain. 2008, 57, 507–515. [Google Scholar] [CrossRef]
- Zambon, I.; Colantoni, A.; Carlucci, M.; Morrow, N.; Sateriano, A.; Salvati, L. Land quality, sustainable development and environmental degradation in agricultural districts: A computational approach based on entropy indexes. Environ. Impact Assess. Rev. 2017, 64, 37–46. [Google Scholar] [CrossRef]
- Kosmas, C.; Ferrara, A.; Briassouli, H.; Imeson, A. Methodology for mapping environmentally sensitive areas (ESAs) to desertification. In The Medalus Project—Mediterranean Desertification and Land Use. Manual on Key Indicators of Desertification and Mapping Environmentally Sensitive Areas to Desertification; European Commission: Luxembourg, 1999; pp. 31–47. [Google Scholar]
- Ferrara, A.; Salvati, L.; Sateriano, A.; Nolè, A. Performance evaluation and cost assessment of a key indicator system to monitor desertification vulnerability. Ecol. Indic. 2012, 23, 123–129. [Google Scholar] [CrossRef]
- Kairis, O.; Karavitis, C.; Salvati, L.; Kounalaki, A.; Kosmas, K. Exploring the impact of overgrazing on soil erosion and land degradation in a dry Mediterranean agro-forest landscape (Crete, Greece). Arid Land Res. Manag. 2015, 29, 360–374. [Google Scholar] [CrossRef]
- Karamesouti, M.; Detsis, V.; Kounalaki, A.; Vasiliou, P.; Salvati, L.; Kosmas, C. Land-use and land degradation processes affecting soil resources: Evidence from a traditional Mediterranean cropland (Greece). CATENA 2015, 132, 45–55. [Google Scholar] [CrossRef]
- Recanatesi, F.; Clemente, M.; Grigoriadis, E.; Ranalli, F.; Zitti, M.; Salvati, L. A fifty-year sustainability assessment of Italian agro-forest districts. Sustainability 2016, 8, 32. [Google Scholar] [CrossRef] [Green Version]
- Bajocco, S.; De Angelis, A.; Salvati, L. A satellite-based green index as a proxy for vegetation cover quality in a Mediterranean region. Ecol. Indic. 2012, 23, 578–587. [Google Scholar] [CrossRef]
- Salvati, L.; Zitti, M.; Perini, L. Fifty years on: Long-term patterns of land sensitivity to desertification in Italy. Land Degrad. Dev. 2016, 27, 97–107. [Google Scholar] [CrossRef]
- Smiraglia, D.; Ceccarelli, T.; Bajocco, S.; Salvati, L.; Perini, L. Linking trajectories of land change, land degradation processes and ecosystem services. Environ. Res. 2016, 147, 590–600. [Google Scholar] [CrossRef]
- Bajocco, S.; Ceccarelli, T.; Smiraglia, D.; Salvati, L.; Ricotta, C. Modeling the ecological niche of long-term land use changes: The role of biophysical factors. Ecol. Indic. 2016, 60, 231–236. [Google Scholar] [CrossRef]
- Scarascia, M.E.V.; Battista, F.D.; Salvati, L. Water resources in Italy: Availability and agricultural uses. Irrig. Drain. 2006, 55, 115–127. [Google Scholar] [CrossRef]
- Incerti, G.; Feoli, E.; Salvati, L.; Brunetti, A.; Giovacchini, A. Analysis of bioclimatic time series and their neural network-based classification to characterise drought risk patterns in South Italy. Int. J. Biometeorol. 2007, 51, 253–263. [Google Scholar] [CrossRef] [PubMed]
- Santini, M.; Caccamo, G.; Laurenti, A.; Noce, S.; Valentini, R. A multi-component GIS framework for desertification risk assessment by an integrated index. Appl. Geogr. 2010, 30, 394–415. [Google Scholar] [CrossRef]
- Vogt, J.V.; Safriel, U.; Von Maltitz, G.; Sokona, Y.; Zougmore, R.; Bastin, G.; Hill, J. Monitoring and assessment of land degradation and desertification: Towards new conceptual and integrated approaches. Land Degrad. Dev. 2011, 22, 150–165. [Google Scholar] [CrossRef]
- Büttner, G. CORINE land cover and land cover change products. In Land Use and Land Cover Mapping in Europe: Practices & Trends; Manakos, I., Braun, M., Eds.; Remote Sensing and Digital Image Processing; Springer Netherlands: Dordrecht, The Netherlands, 2014; pp. 55–74. [Google Scholar]
- Otto, R.; Krüsi, B.O.; Kienast, F. Degradation of an arid coastal landscape in relation to land use changes in Southern Tenerife (Canary Islands). J. Arid Environ. 2007, 70, 527–539. [Google Scholar] [CrossRef]
- Cecchini, M.; Zambon, I.; Pontrandolfi, A.; Turco, R.; Colantoni, A.; Mavrakis, A.; Salvati, L. Urban sprawl and the ‘olive’ landscape: Sustainable land management for ‘crisis’ cities. GeoJournal 2019, 84, 237–255. [Google Scholar] [CrossRef]
- Ciommi, M.; Chelli, F.M.; Salvati, L. Integrating parametric and non-parametric multivariate analysis of urban growth and commuting patterns in a European metropolitan area. Qual. Quant. 2019, 53, 957–979. [Google Scholar] [CrossRef]
- Salvati, L. Toward a ‘sustainable’ land degradation? Vulnerability degree and component balance in a rapidly changing environment. Environ. Dev. Sustain. 2014, 16, 239–254. [Google Scholar] [CrossRef]
- Nickayin, S.S.; Quaranta, G.; Salvia, R.; Cividino, S.; Cudlin, P.; Salvati, L. Reporting land degradation sensitivity through multiple indicators: Does scale matter? Ecol. Indic. 2021, 125, 107560. [Google Scholar] [CrossRef]
- Congedo, L. Semi-automatic classification plugin: A python tool for the download and processing of remote sensing images in QGIS. J. Open Source Softw. 2021, 6, 3172. [Google Scholar] [CrossRef]
- Imbrenda, V.; Coluzzi, R.; Di Stefano, V.; Egidi, G.; Salvati, L.; Samela, C.; Simoniello, T.; Lanfredi, M. Modeling spatio-temporal divergence in land vulnerability to desertification with local regressions. Sustainability 2022, 14, 10906. [Google Scholar] [CrossRef]
- Kefalas, G.; Poirazidis, K.; Xofis, P.; Kalogirou, S.; Chalkias, C. Landscape dynamics on insular environments of southeast Mediterranean Europe. Geocarto Int. 2022, 37, 1813–1832. [Google Scholar] [CrossRef]
- Abuzaid, A.S.; Abdelatif, A.D. Assessment of desertification using modified MEDALUS model in the North Nile delta, Egypt. Geoderma 2022, 405, 115400. [Google Scholar] [CrossRef]
- Salvati, L.; Gemmiti, R.; Perini, L. Land degradation in Mediterranean urban areas: An unexplored link with planning? Area 2012, 44, 317–325. [Google Scholar] [CrossRef]
- Imbrenda, V.; Lanfredi, M.; Coluzzi, R.; Simoniello, T. A smart procedure for assessing the health status of terrestrial habitats in protected areas: The case of the natura 2000 ecological network in Basilicata (Southern Italy). Remote Sens. 2022, 14, 2699. [Google Scholar] [CrossRef]
- Singh, R.B.; Ajai. A Composite method to identify desertification ‘hotspots’ and ‘brightspots’. Land Degrad. Dev. 2019, 30, 1025–1039. [Google Scholar] [CrossRef]
- Halbac-Cotoara-Zamfir, R.; Smiraglia, D.; Quaranta, G.; Salvia, R.; Salvati, L.; Giménez-Morera, A. Land degradation and mitigation policies in the Mediterranean region: A brief commentary. Sustainability 2020, 12, 8313. [Google Scholar] [CrossRef]
- Wong, D.W.S. The modifiable areal unit problem (MAUP). In WorldMinds: Geographical Perspectives on 100 Problems: Commemorating the 100th Anniversary of the Association of American Geographers 1904–2004; Janelle, D.G., Warf, B., Hansen, K., Eds.; Springer Netherlands: Dordrecht, The Netherlands, 2004; pp. 571–575. [Google Scholar]


| ESAI Class | ESAI Score | Vulnerability Class | Area Description |
|---|---|---|---|
| Not affected | <1.17 | Not affected | Non-threatened areas |
| Potentially affected | 1.17–1.22 | Potentially affected | Low vulnerability areas to be considered at risk only in the case of a severe worsening of climate and land management conditions. |
| Fragile 1 | 1.23–1.26 | Fragile | Medium vulnerability areas in which any change altering the balance between natural and anthropogenic activities (e.g., climate change, occurrence of natural disaster, land use/cover changes) can trigger land degradation. |
| Fragile 2 | 1.27–1.32 | ||
| Fragile 3 | 1.33–1.37 | ||
| Critical 1 | 1.38–1.41 | Critical | Degraded areas (e.g., sparse vegetated zones characterized by erosional processes) influencing surrounding areas. |
| Critical 2 | 1.42–1.53 | ||
| Critical 3 | >1.53 |
| Vulnerability Class | 2010 (%) | 1990 (%) | 1960 (%) |
|---|---|---|---|
| Not affected + potentially affected | 9.468 | 9.048 | 5.002 |
| Fragile | 47.376 | 48.256 | 64.416 |
| Critical | 43.156 | 42.696 | 30.582 |
| Total | 100 | 100 | 100 |
| Vulnerability Class | 2010 (%) | 1990 (%) | 1960 (%) |
|---|---|---|---|
| Not affected | 0.979 | 0.851 | 0.008 |
| Potentially affected | 8.488 | 8.197 | 4.994 |
| Fragile 1 | 11.006 | 12.068 | 13.528 |
| Fragile 2 | 18.940 | 19.932 | 29.796 |
| Fragile 3 | 17.429 | 16.256 | 21.093 |
| Critical 1 | 16.827 | 15.896 | 13.229 |
| Critical 2 | 24.895 | 24.913 | 16.252 |
| Critical 3 | 1.434 | 1.887 | 1.101 |
| Total | 100 | 100 | 100 |
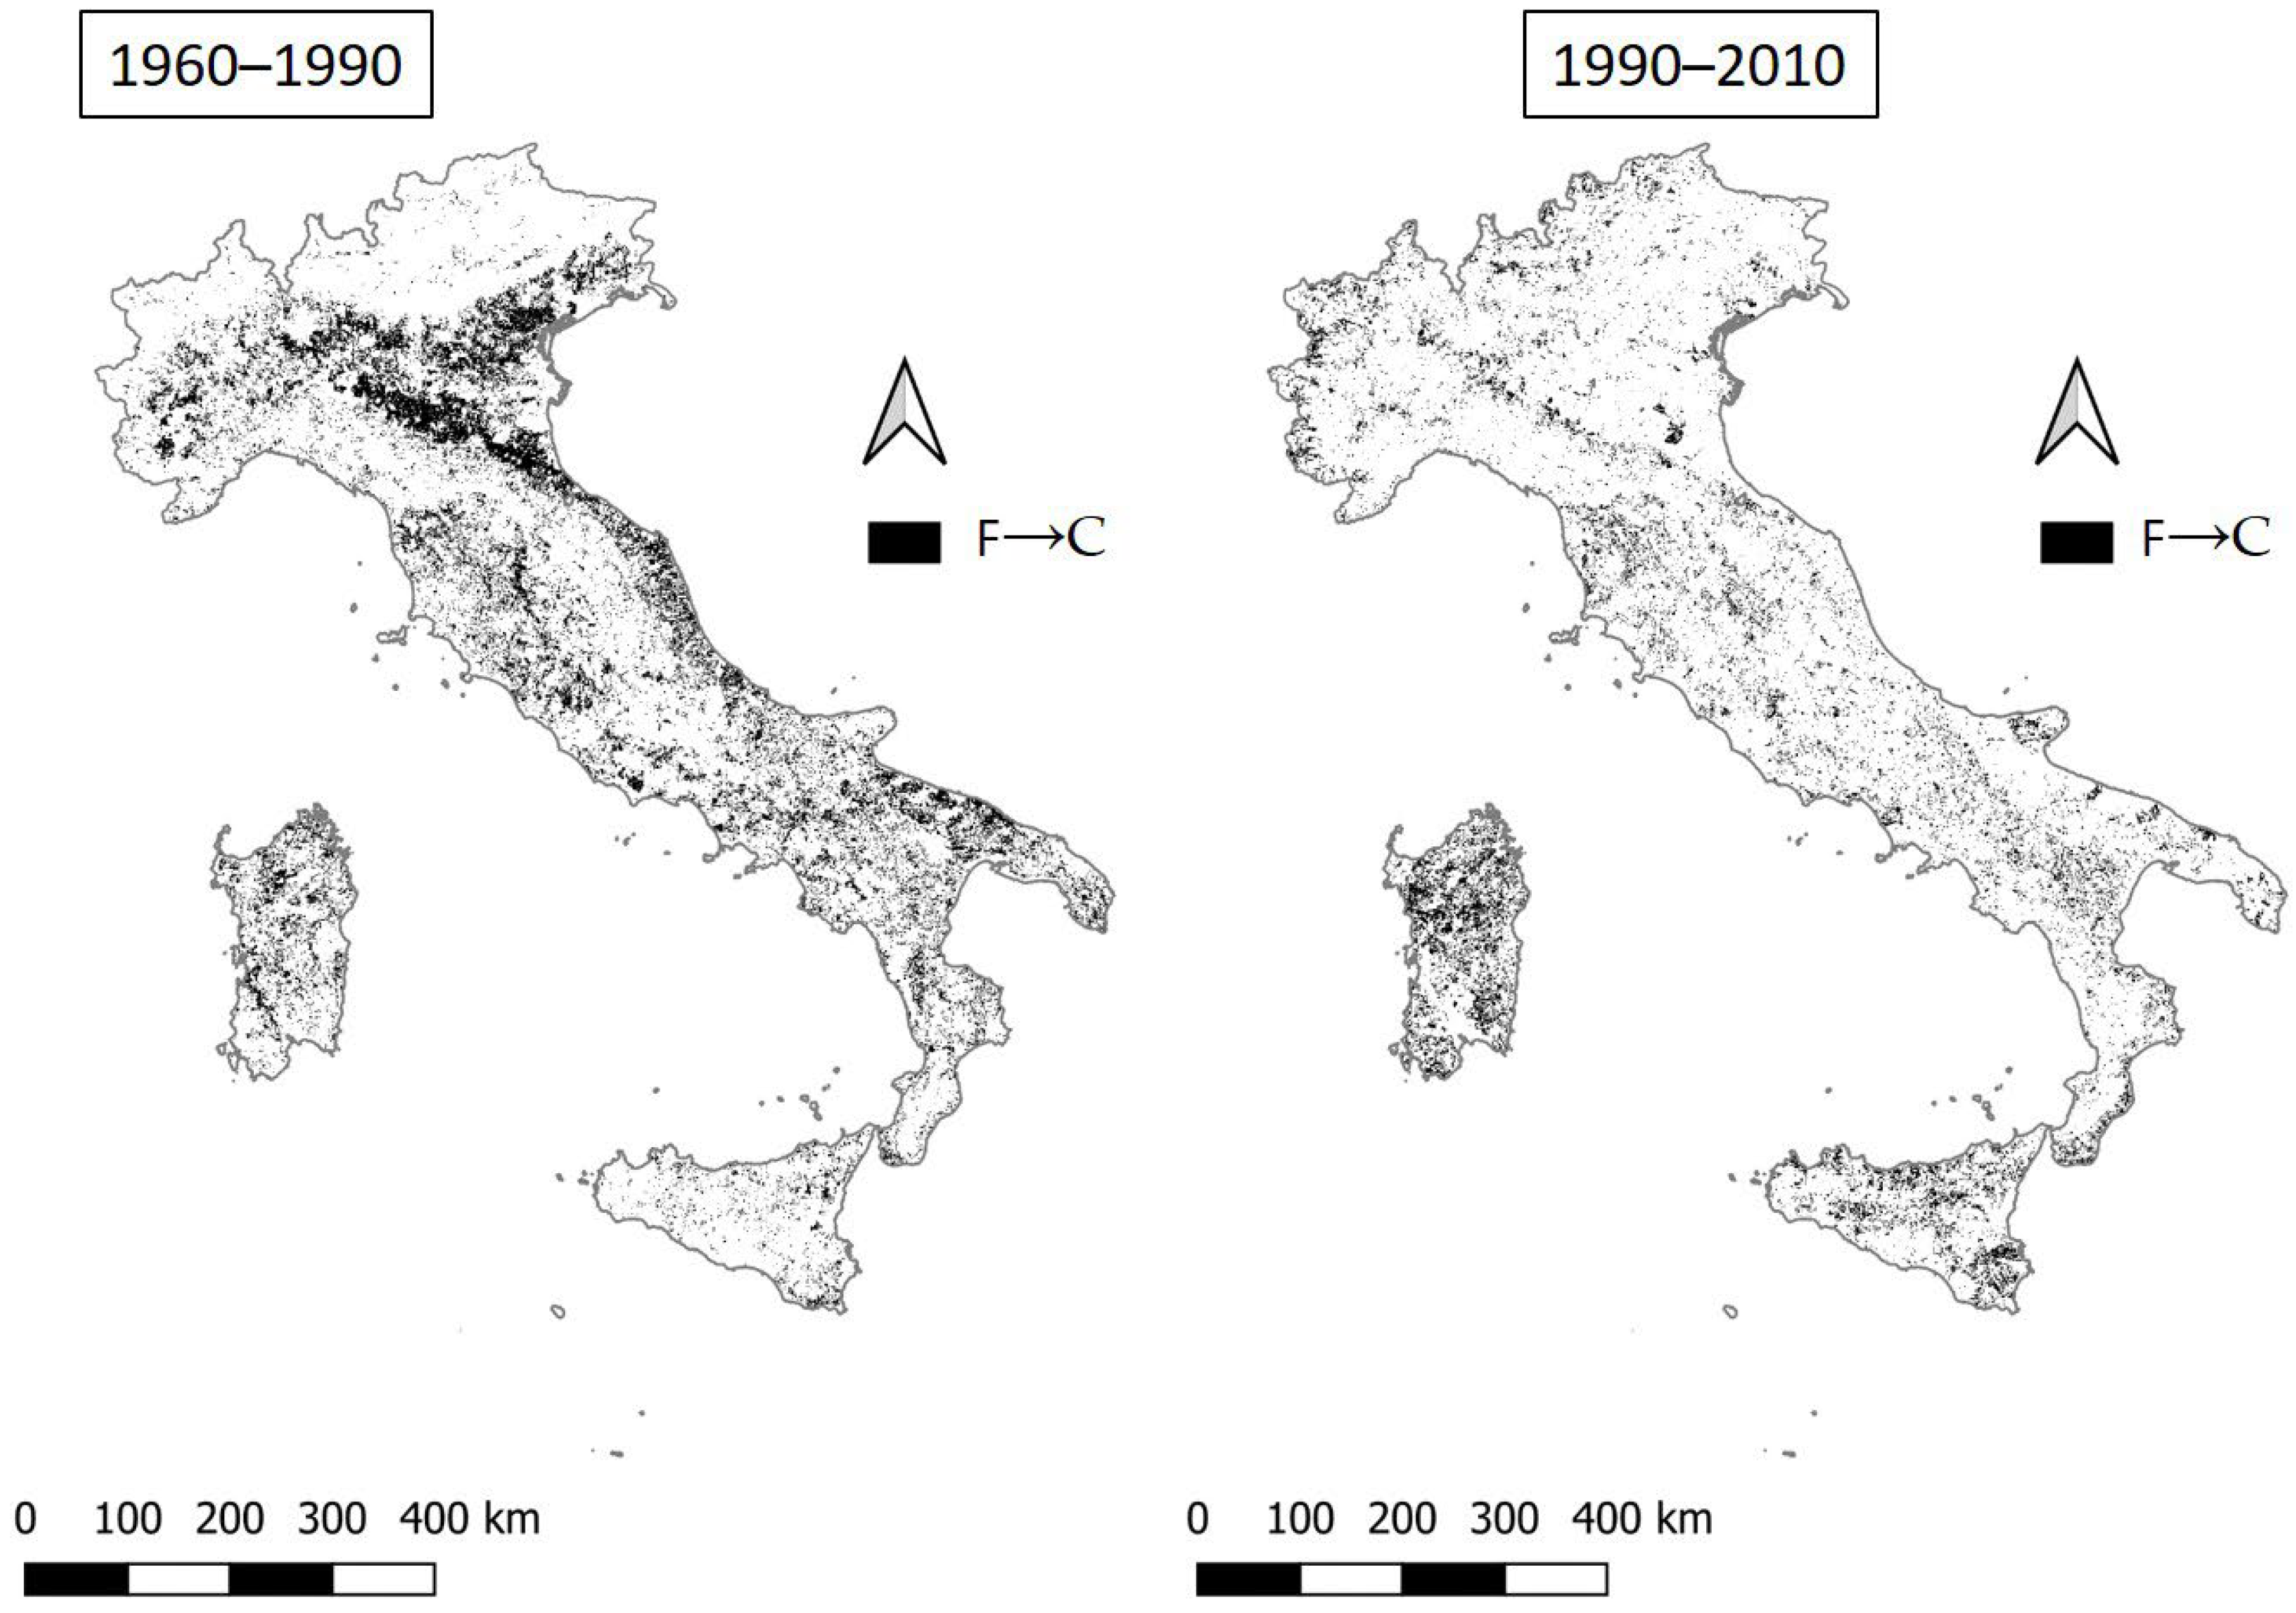
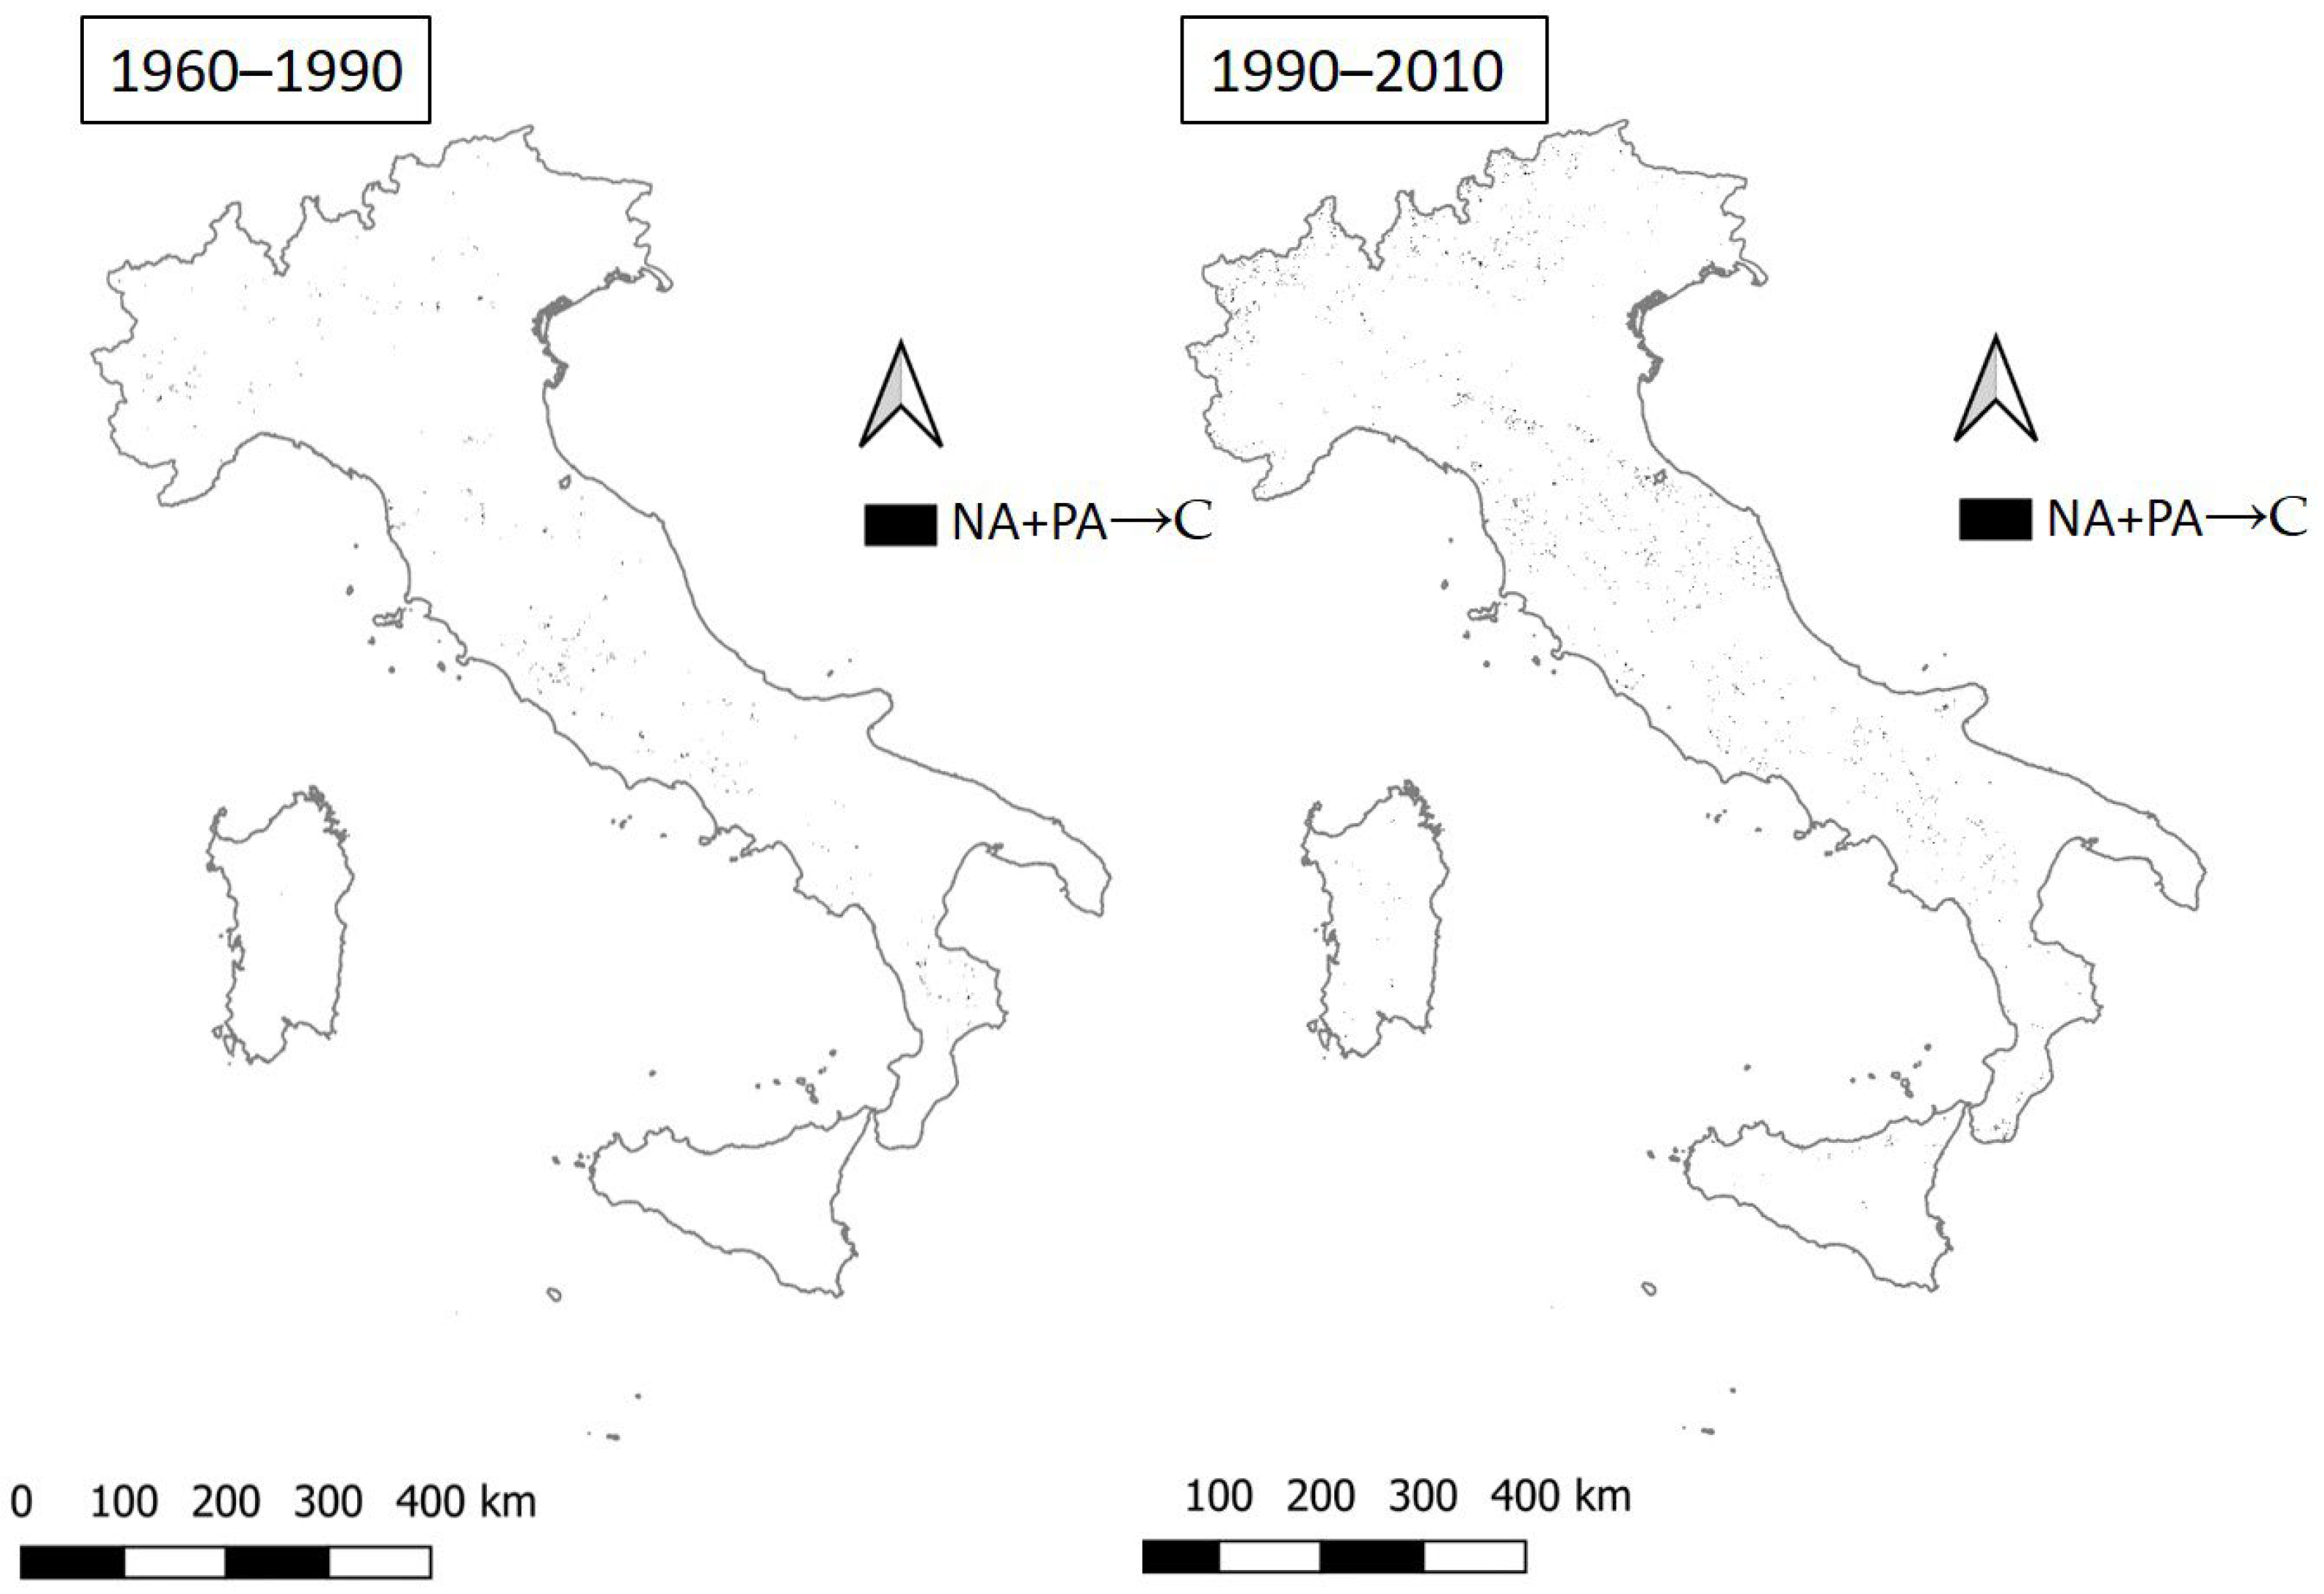
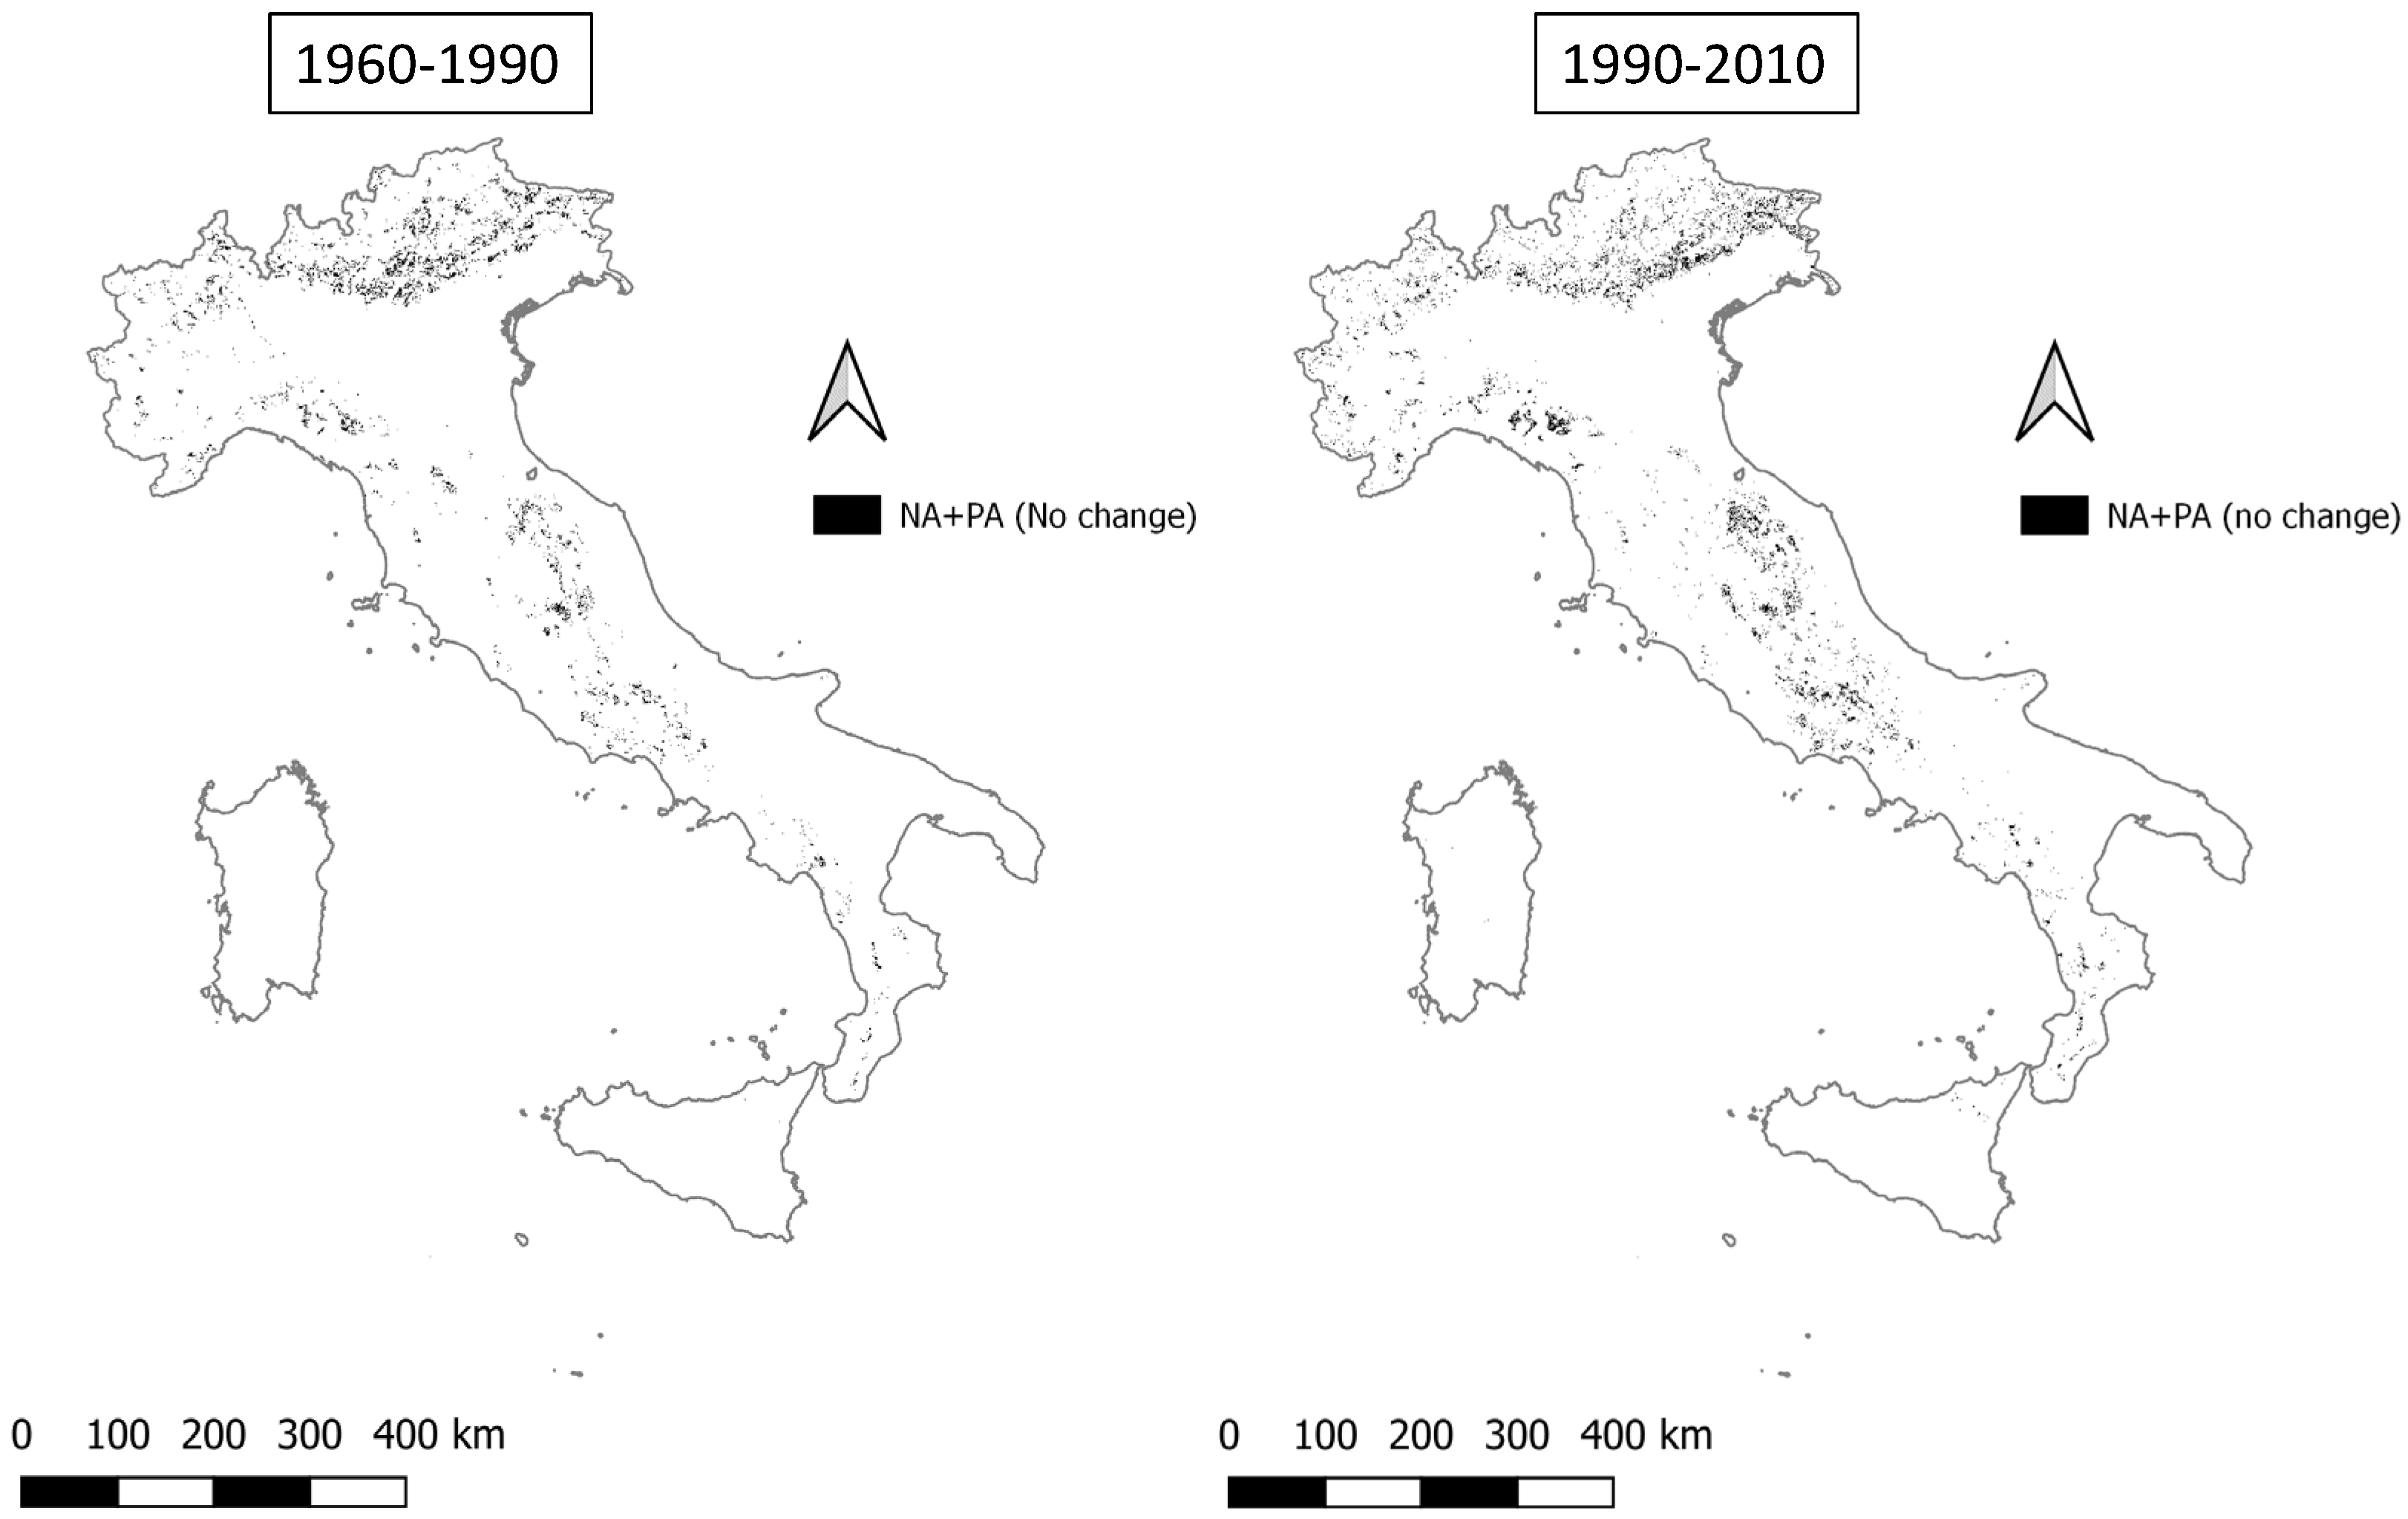
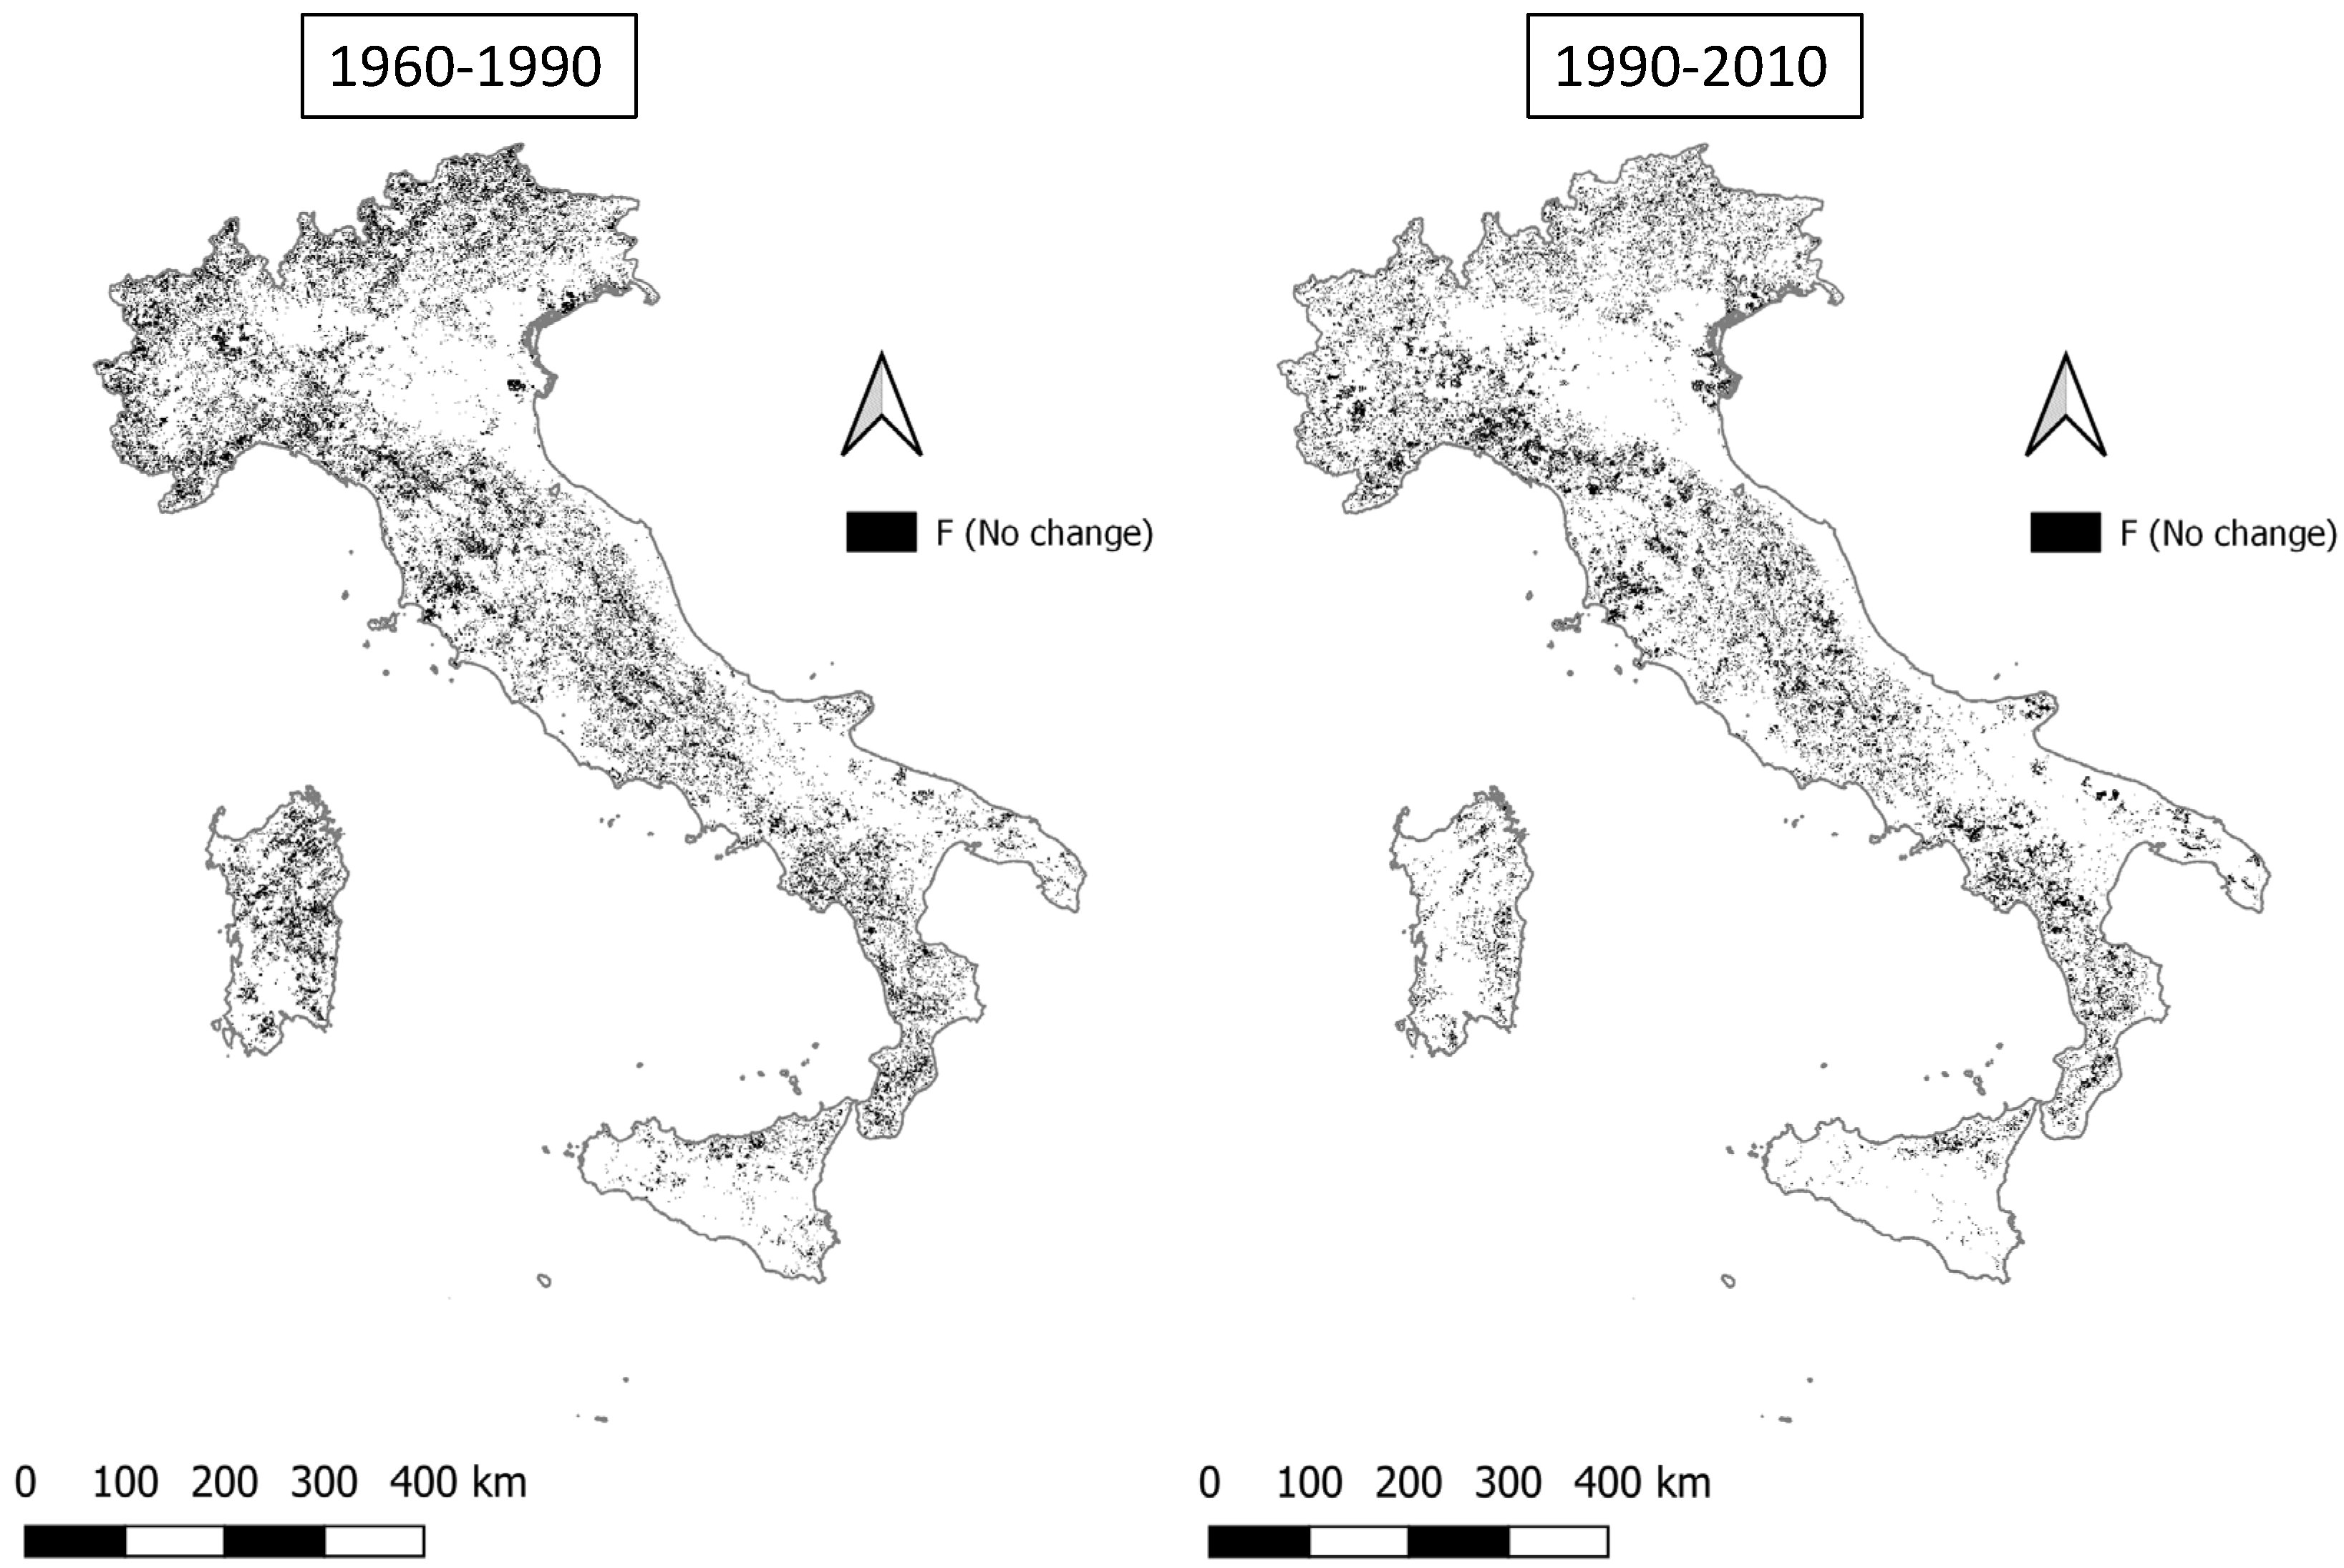
| Class Transition | 1960–1990 (%) | 1990–2010 (%) |
|---|---|---|
| NA+PA→F | 2.47 | 5.30 |
| F→C | 18.6 | 11.32 |
| NA+PA→C | 0.15 | 0.03 |
| NA+PA (no change) | 1.96 | 2.45 |
| F (no change) | 17.68 | 13.62 |
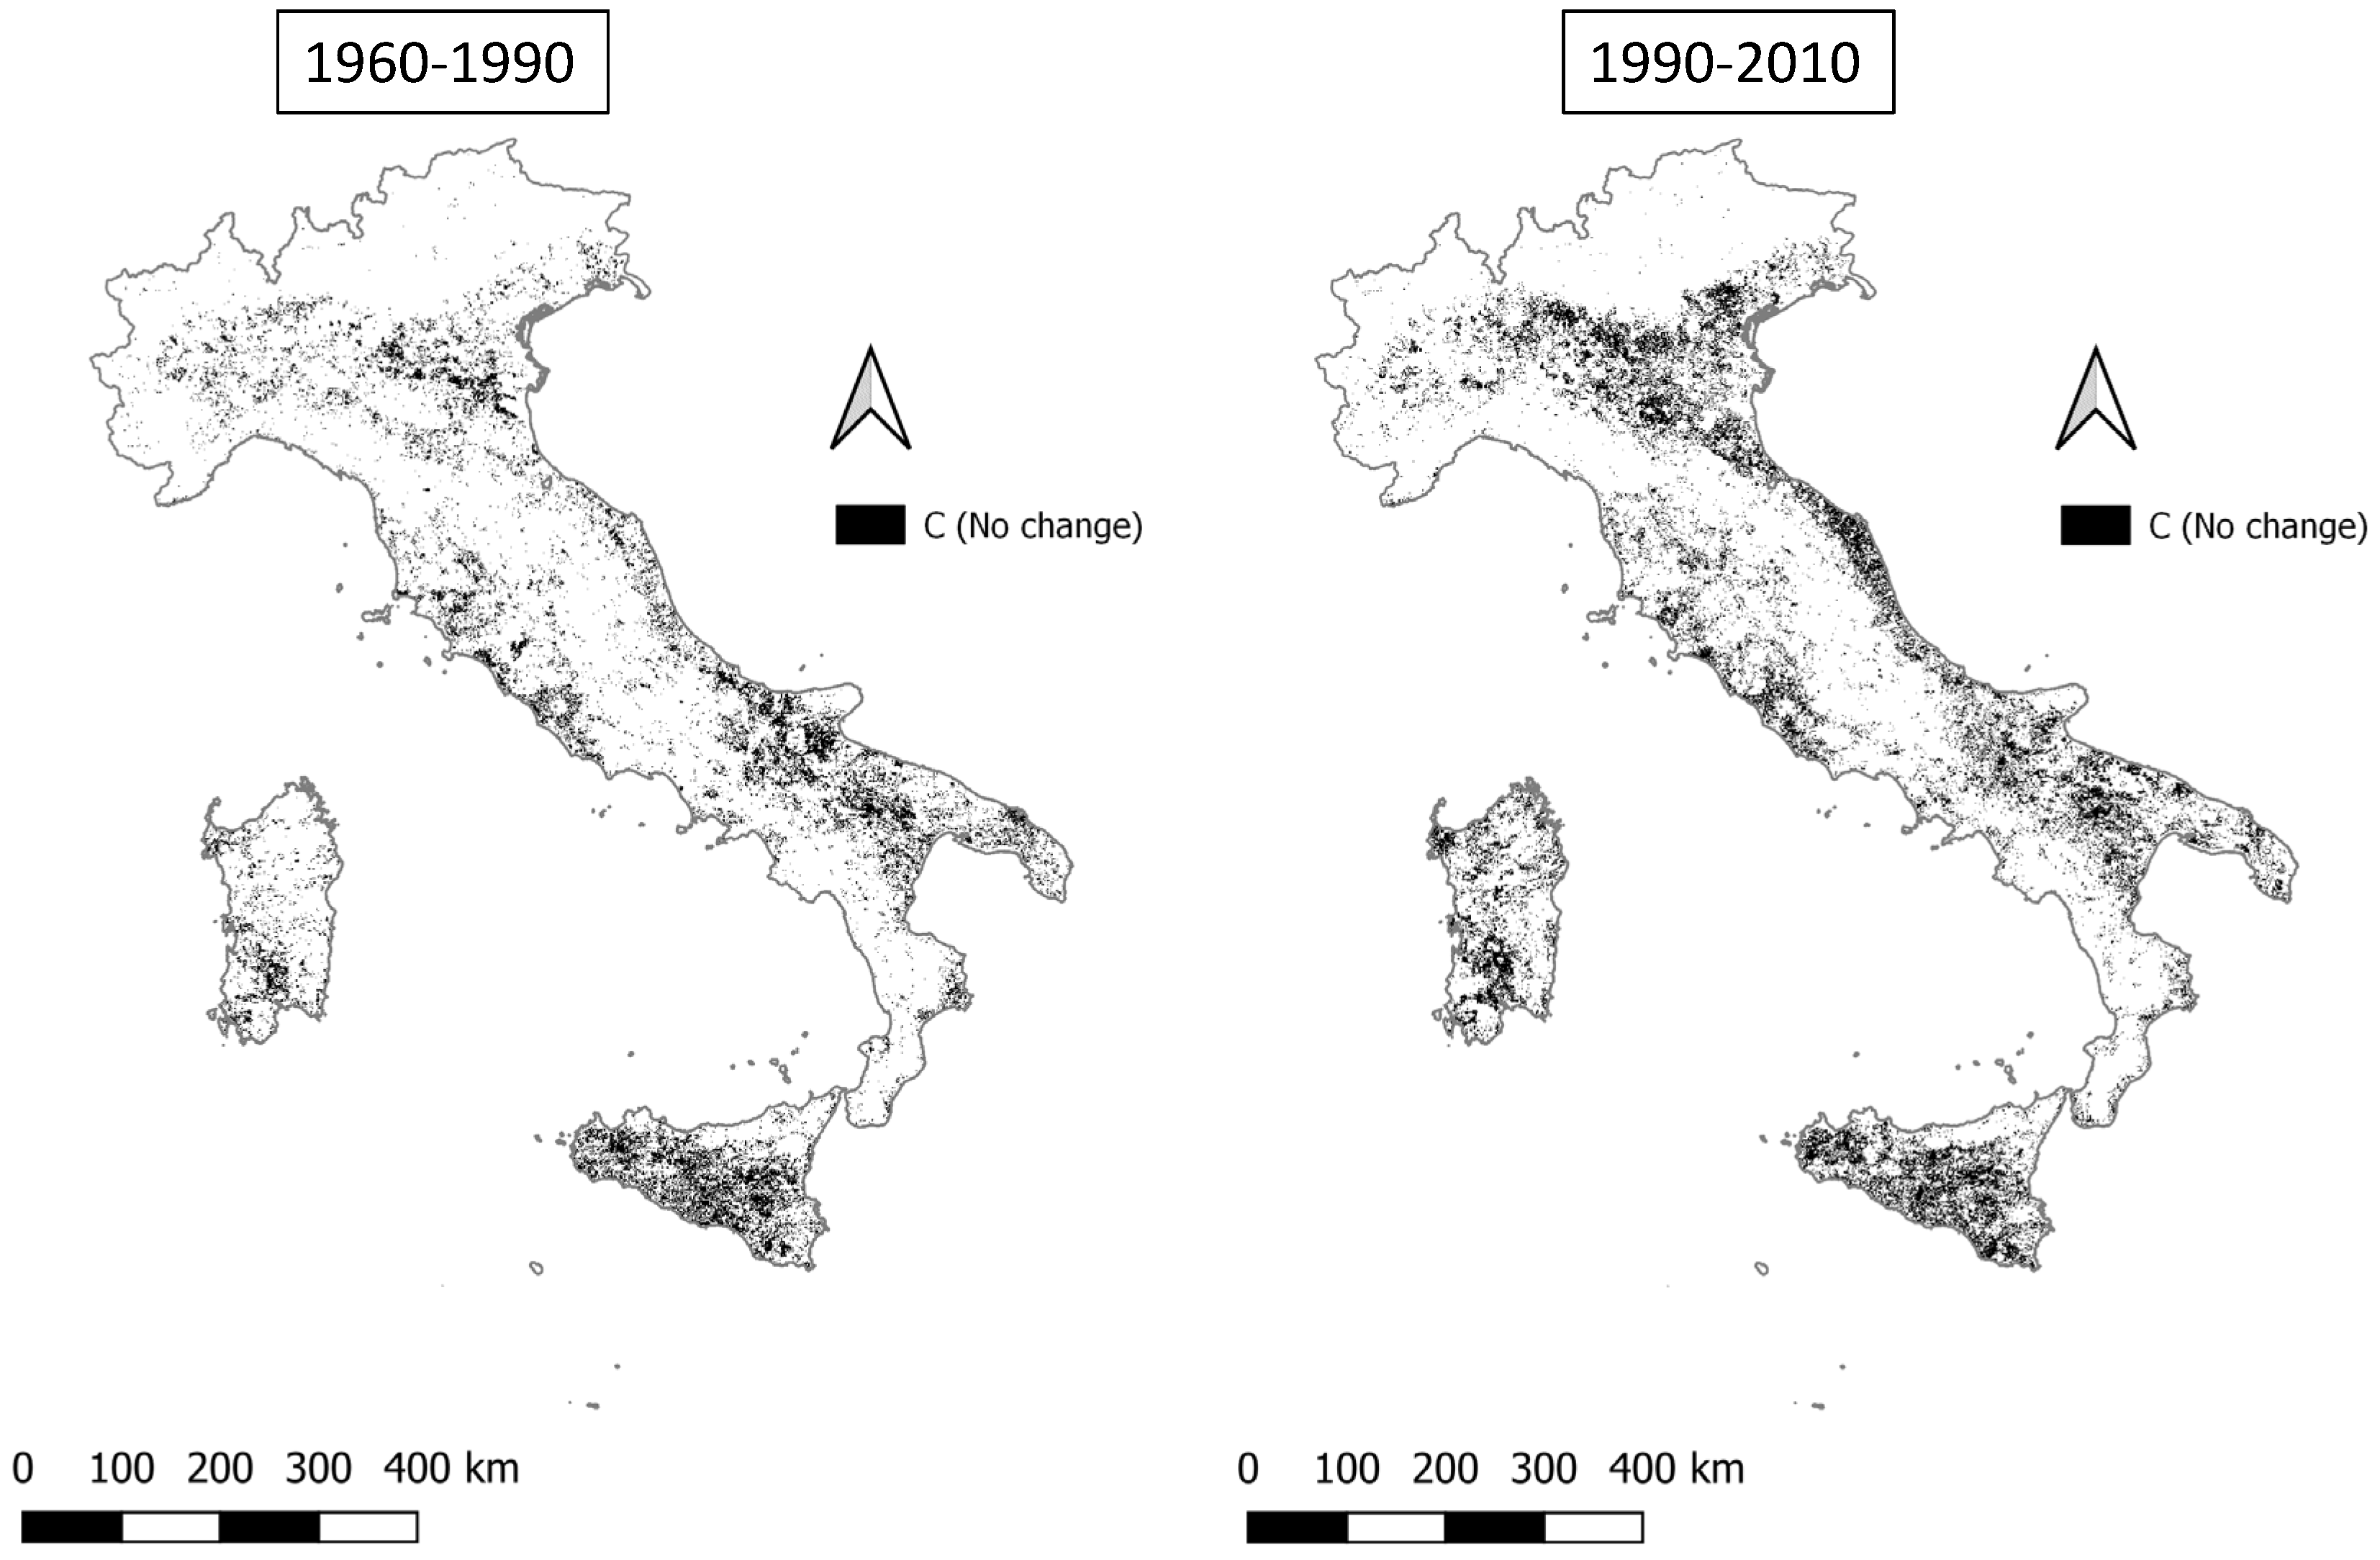
| C (no change) | 12.37 | 17.20 |
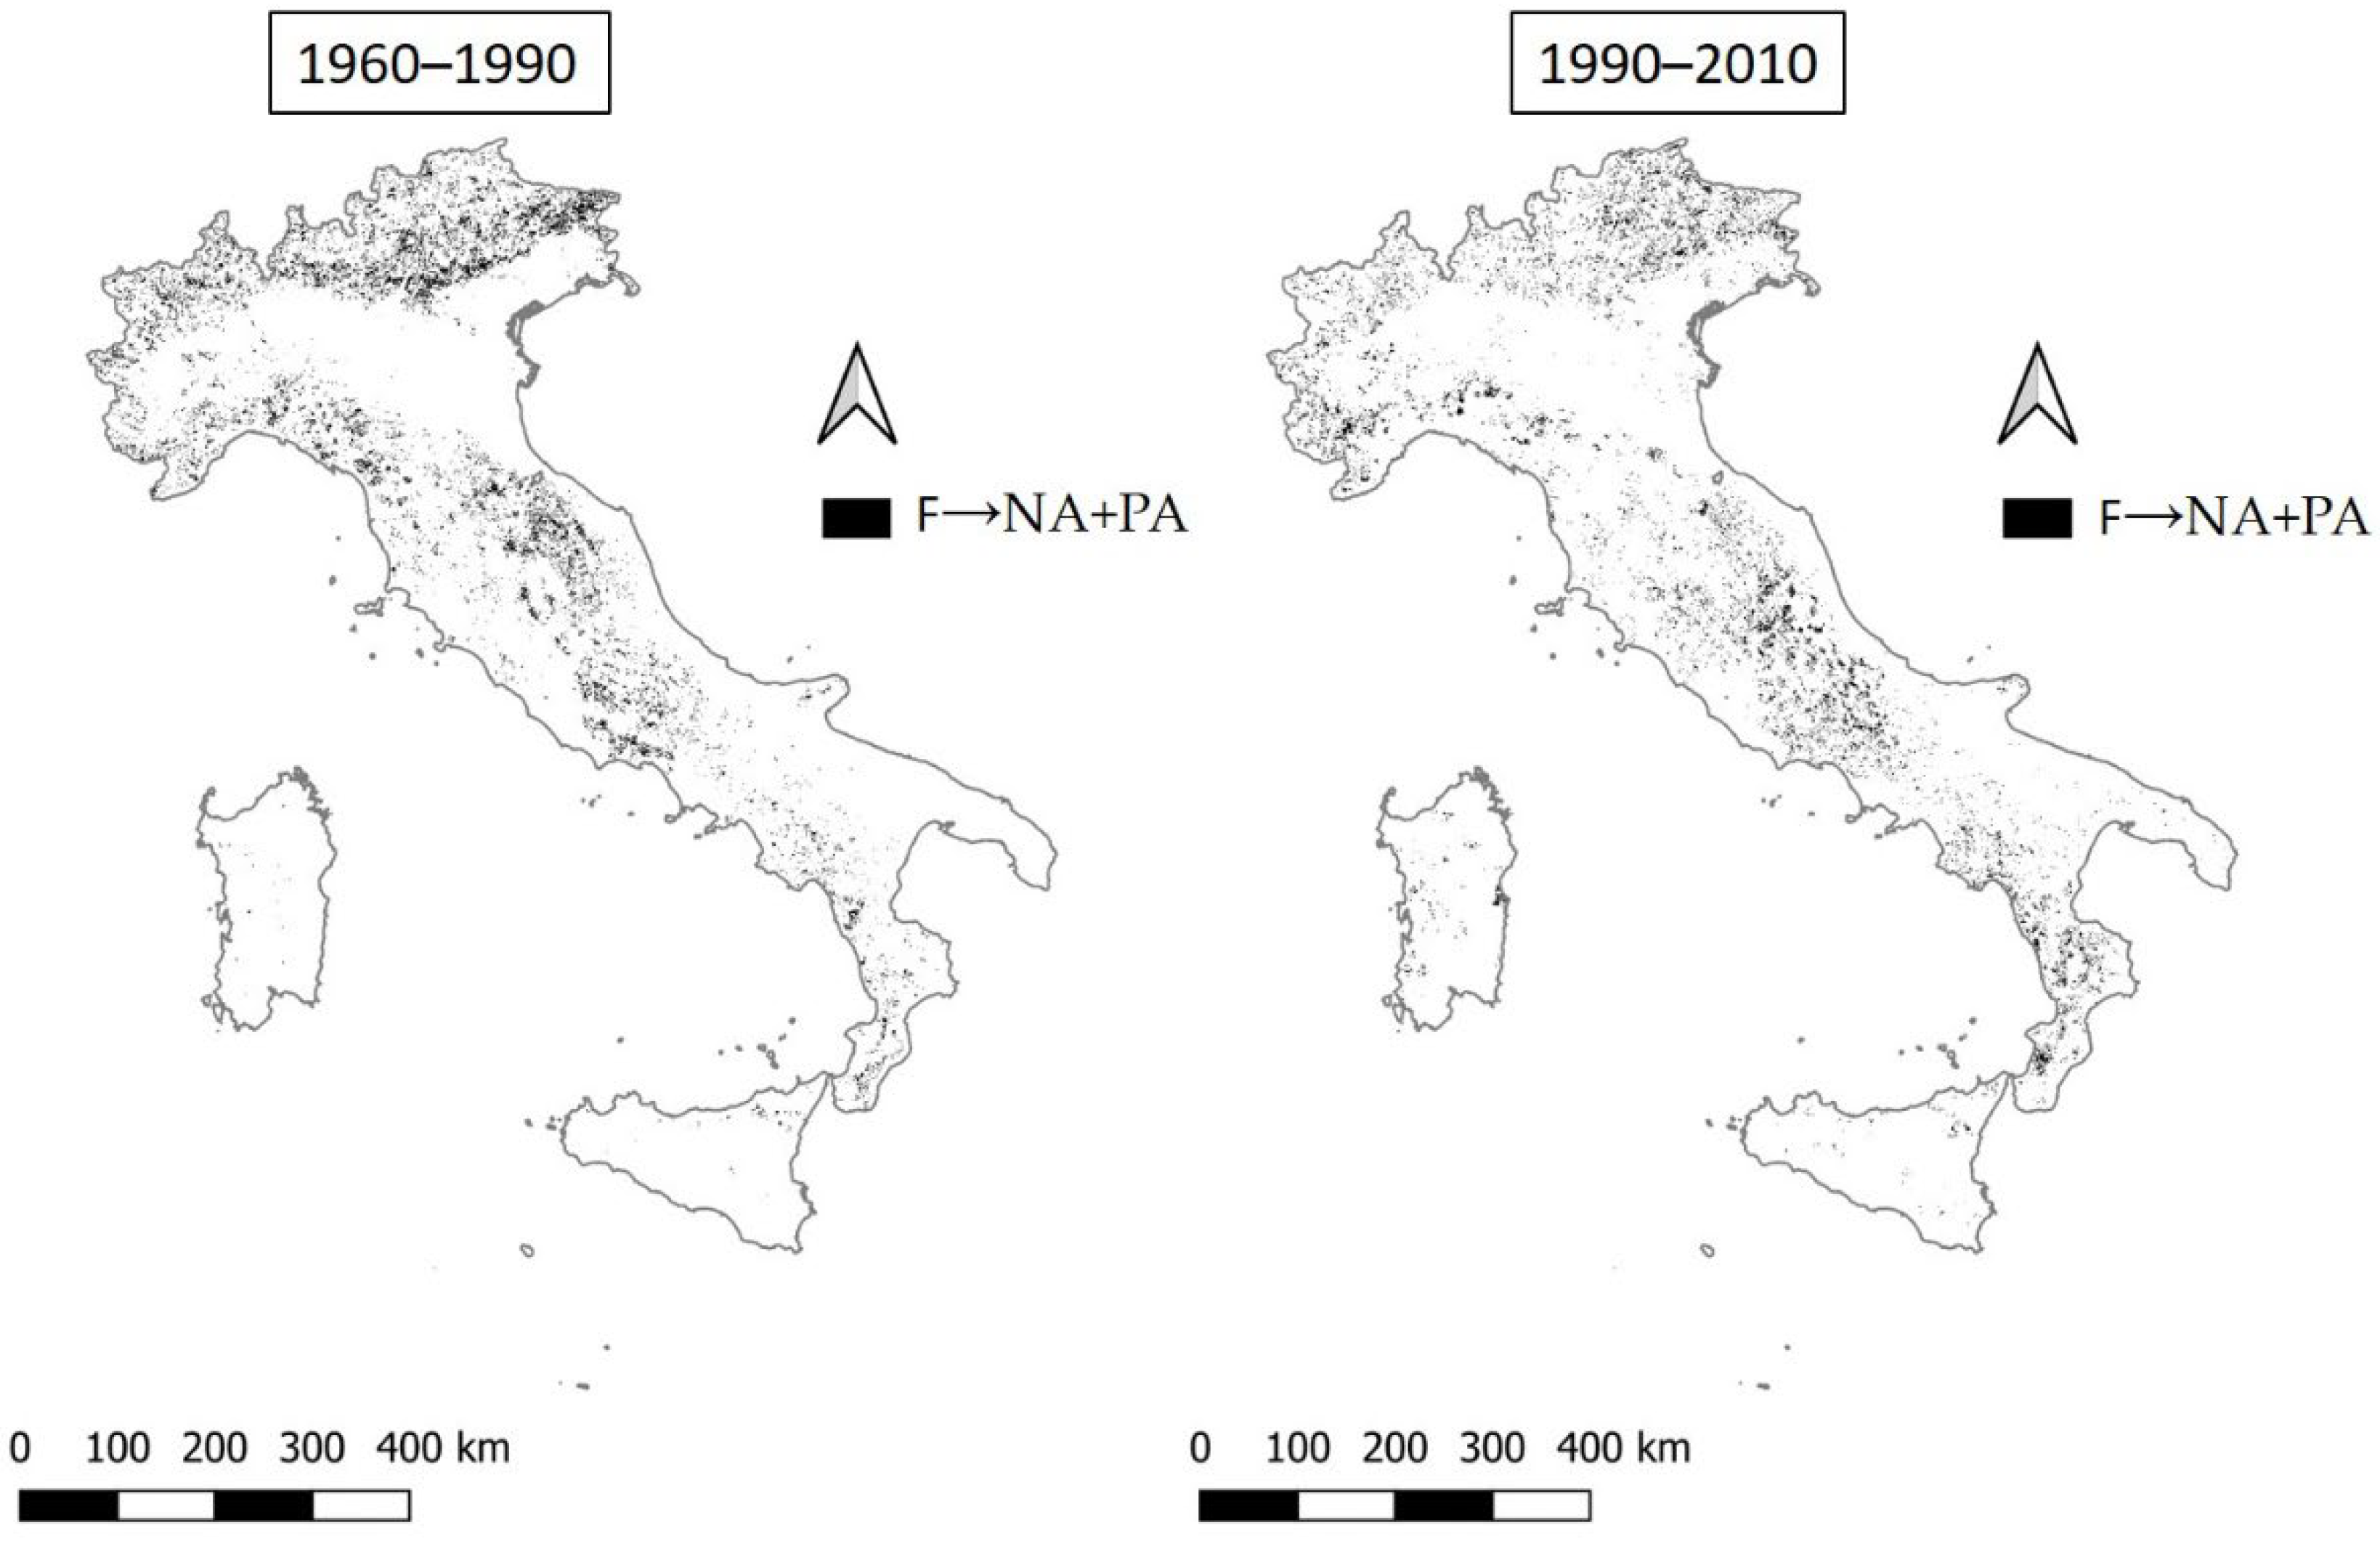
| F→NA+PA | 6.10 | 5.21 |
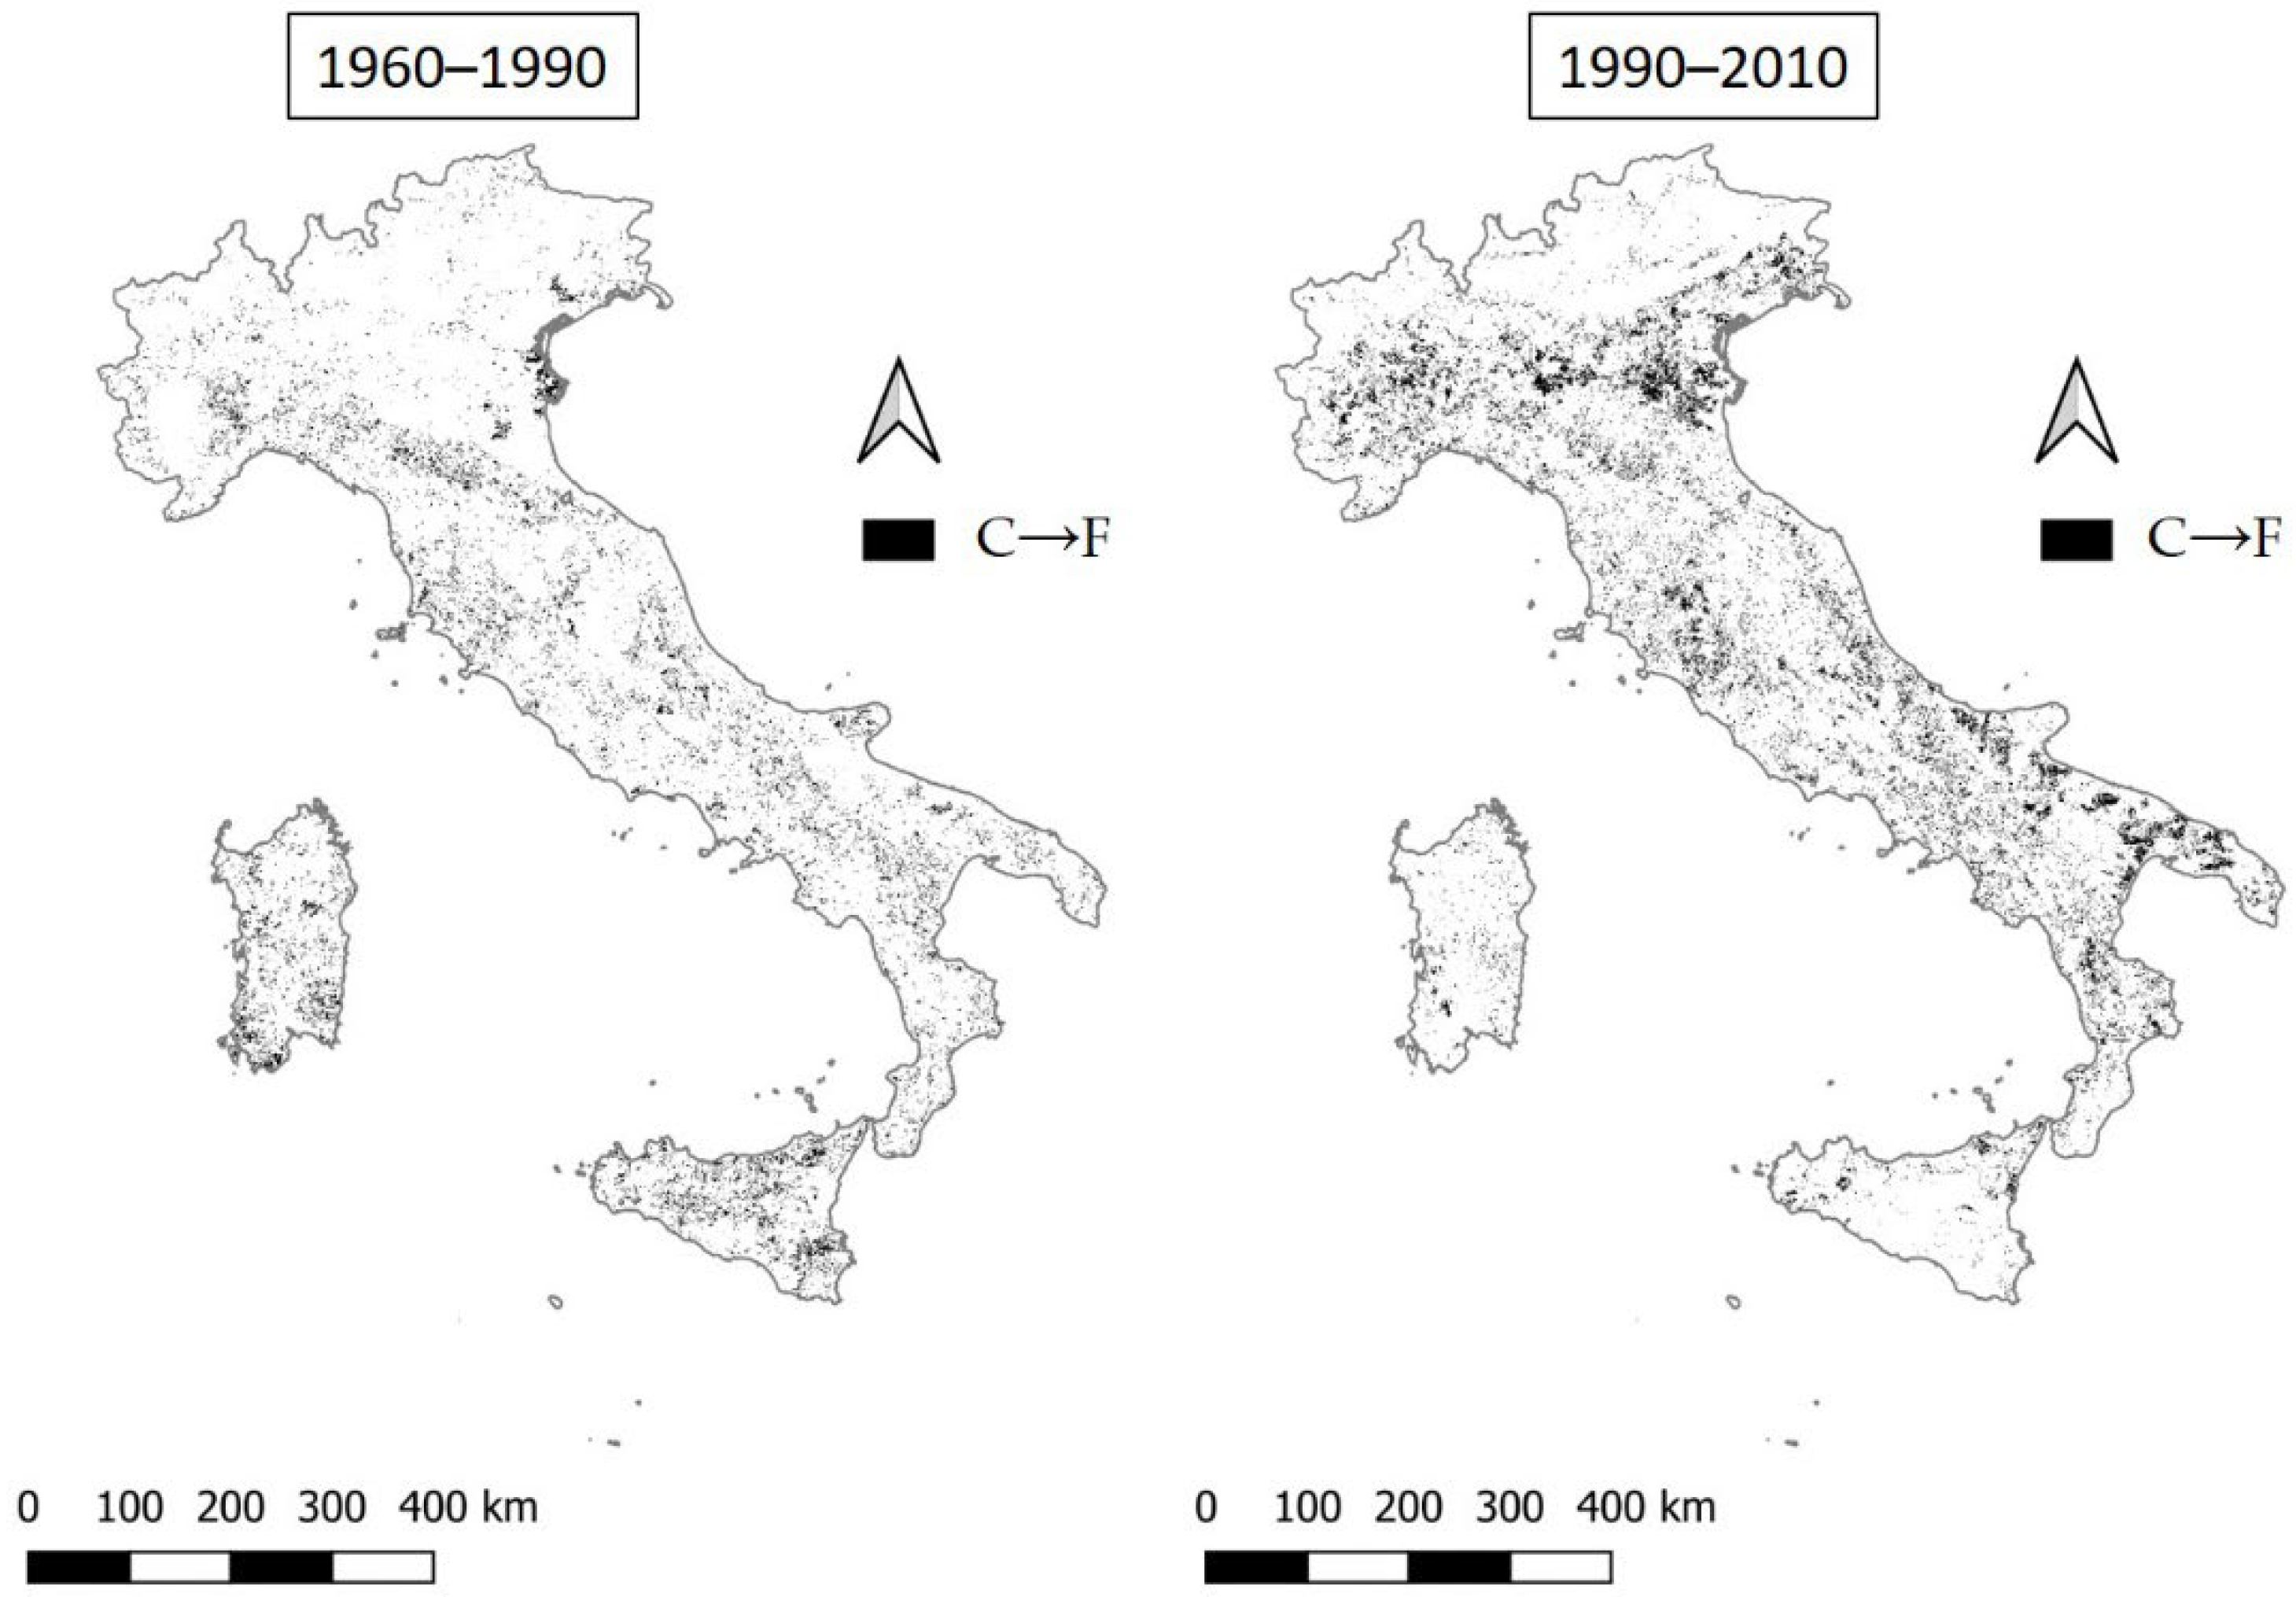
| C→F | 6.61 | 10.23 |
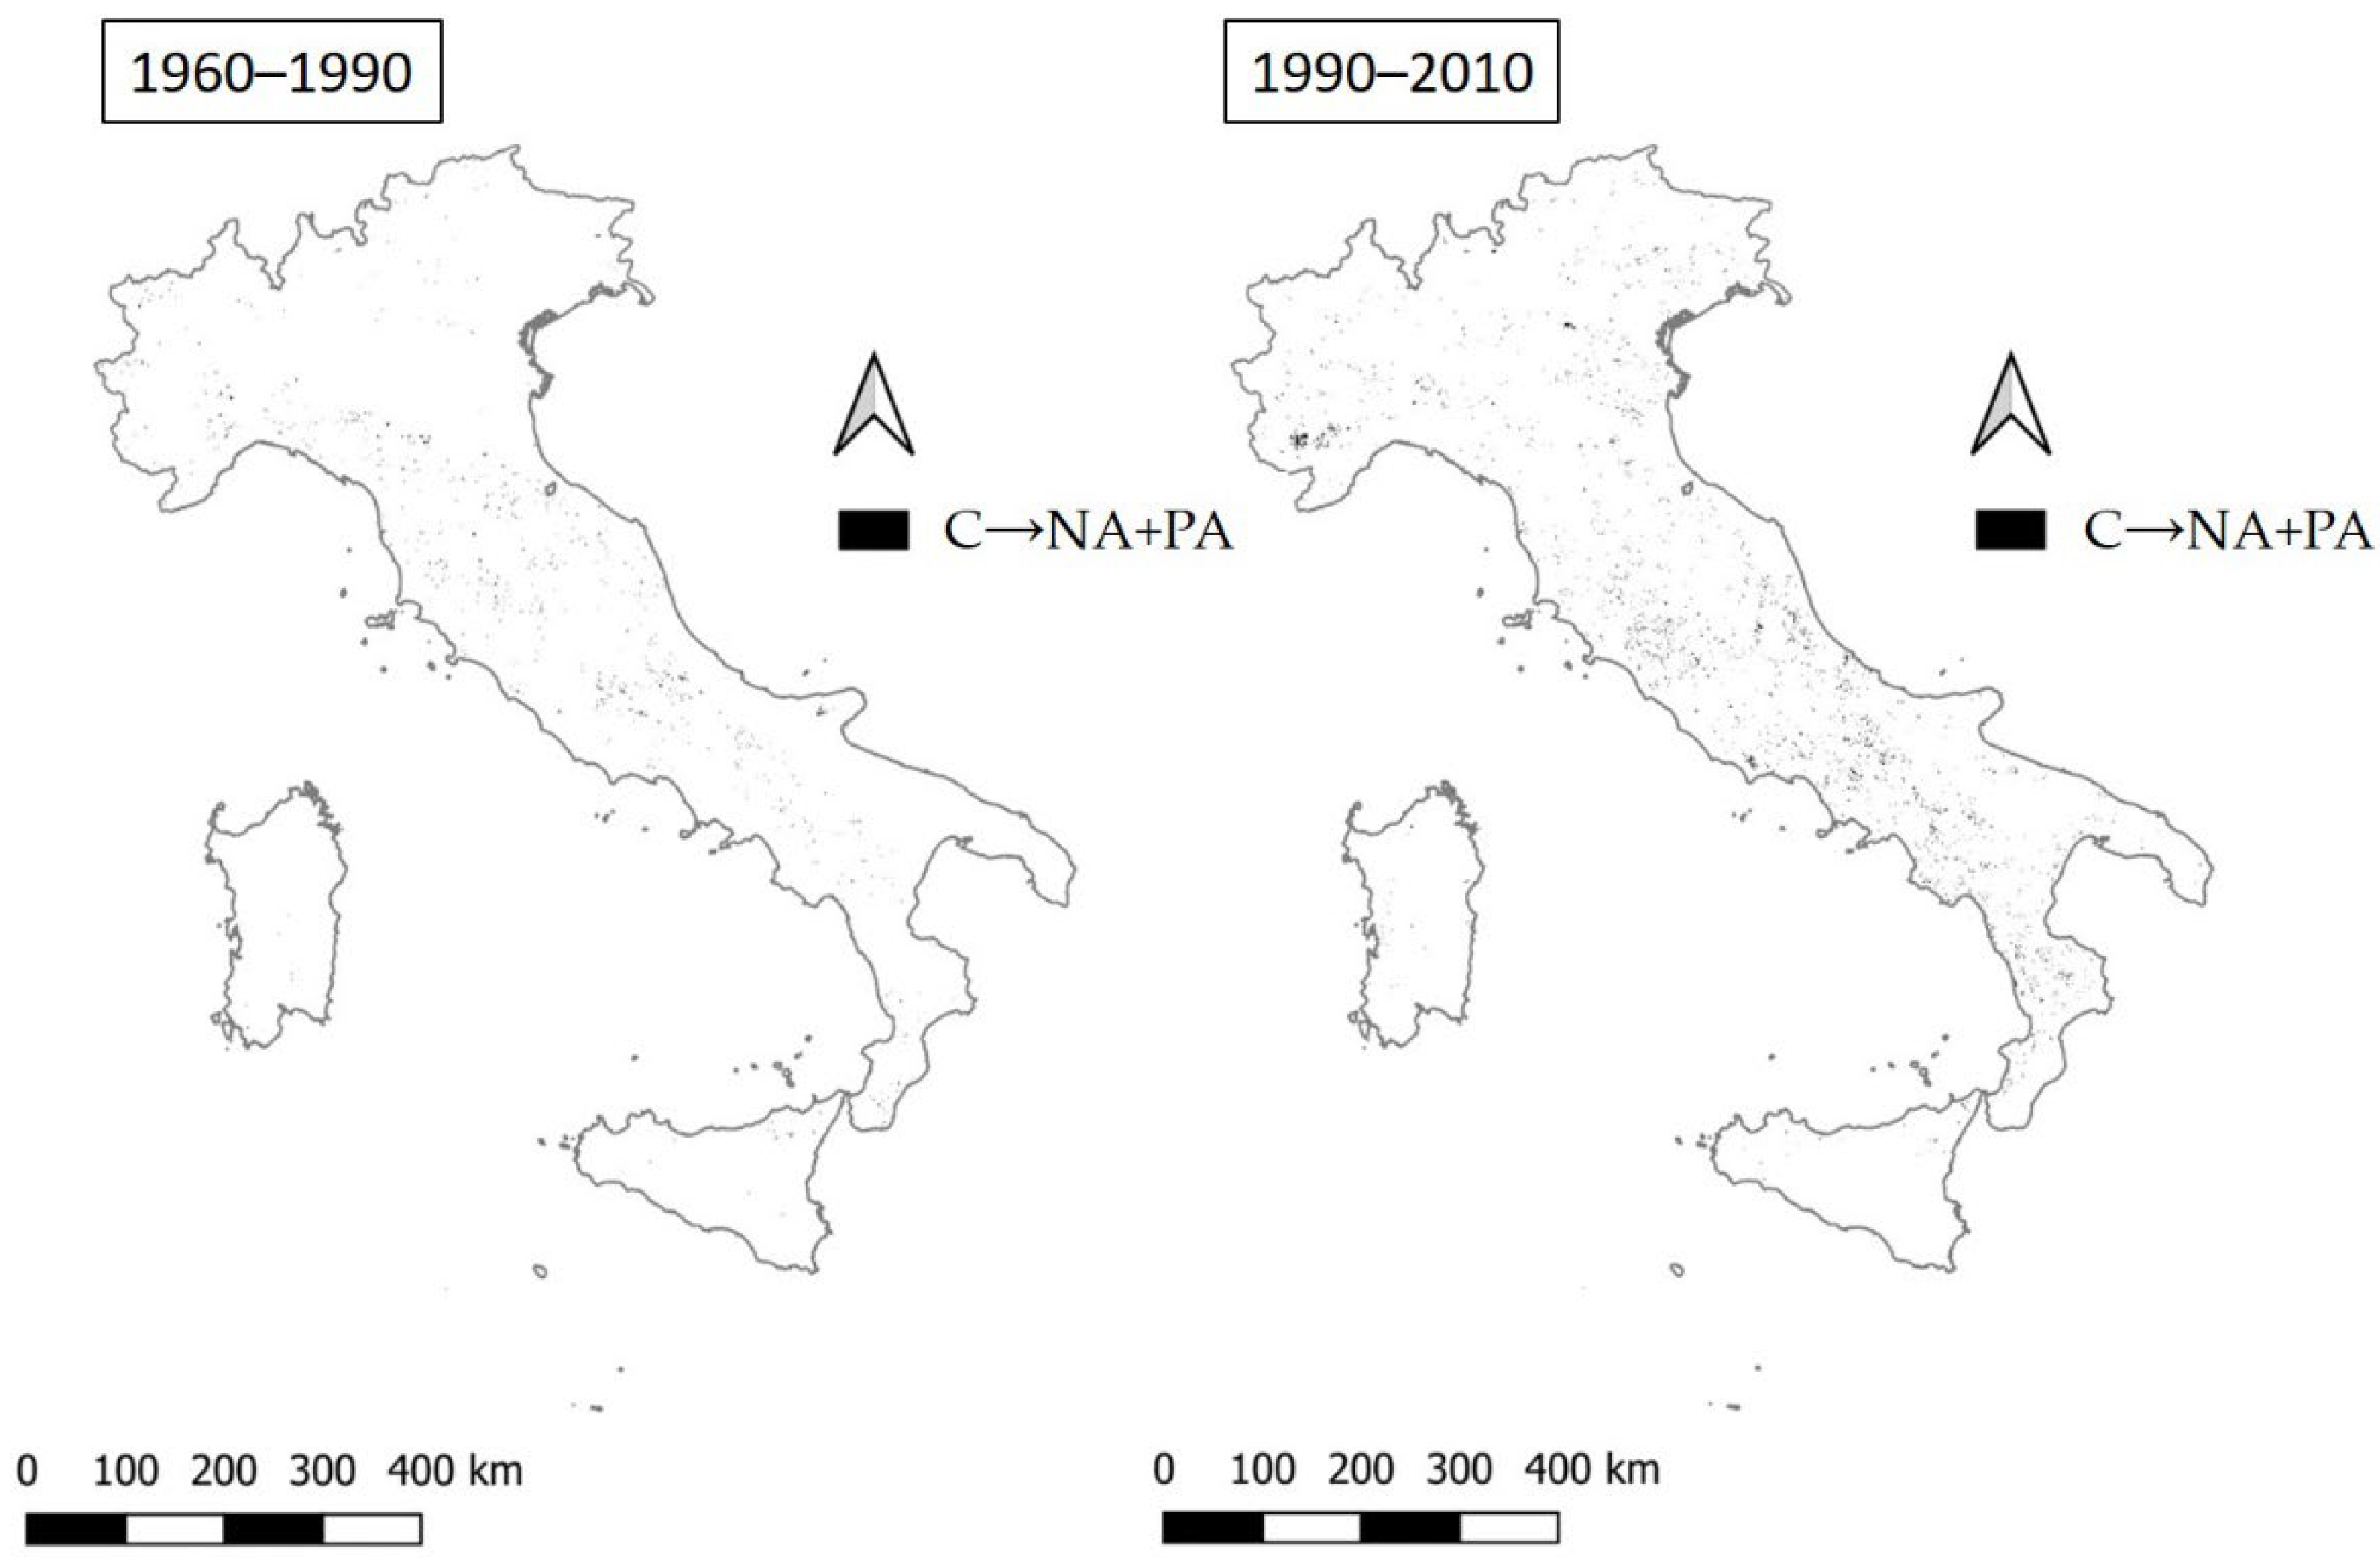
| C→NA+PA | 0.30 | 0.96 |
Disclaimer/Publisher’s Note: The statements, opinions and data contained in all publications are solely those of the individual author(s) and contributor(s) and not of MDPI and/or the editor(s). MDPI and/or the editor(s) disclaim responsibility for any injury to people or property resulting from any ideas, methods, instructions or products referred to in the content. |
© 2023 by the authors. Licensee MDPI, Basel, Switzerland. This article is an open access article distributed under the terms and conditions of the Creative Commons Attribution (CC BY) license (https://creativecommons.org/licenses/by/4.0/).
Share and Cite
Pace, L.; Imbrenda, V.; Lanfredi, M.; Cudlín, P.; Simoniello, T.; Salvati, L.; Coluzzi, R. Delineating the Intrinsic, Long-Term Path of Land Degradation: A Spatially Explicit Transition Matrix for Italy, 1960–2010. Int. J. Environ. Res. Public Health 2023, 20, 2402. https://doi.org/10.3390/ijerph20032402
Pace L, Imbrenda V, Lanfredi M, Cudlín P, Simoniello T, Salvati L, Coluzzi R. Delineating the Intrinsic, Long-Term Path of Land Degradation: A Spatially Explicit Transition Matrix for Italy, 1960–2010. International Journal of Environmental Research and Public Health. 2023; 20(3):2402. https://doi.org/10.3390/ijerph20032402
Chicago/Turabian StylePace, Letizia, Vito Imbrenda, Maria Lanfredi, Pavel Cudlín, Tiziana Simoniello, Luca Salvati, and Rosa Coluzzi. 2023. "Delineating the Intrinsic, Long-Term Path of Land Degradation: A Spatially Explicit Transition Matrix for Italy, 1960–2010" International Journal of Environmental Research and Public Health 20, no. 3: 2402. https://doi.org/10.3390/ijerph20032402