
Analysis of Postural Stability Following the Application of Myofascial Release Techniques for Low Back Pain—A Randomized-Controlled Trial

Abstract
:1. Introduction
2. Methods
2.1. Study Design
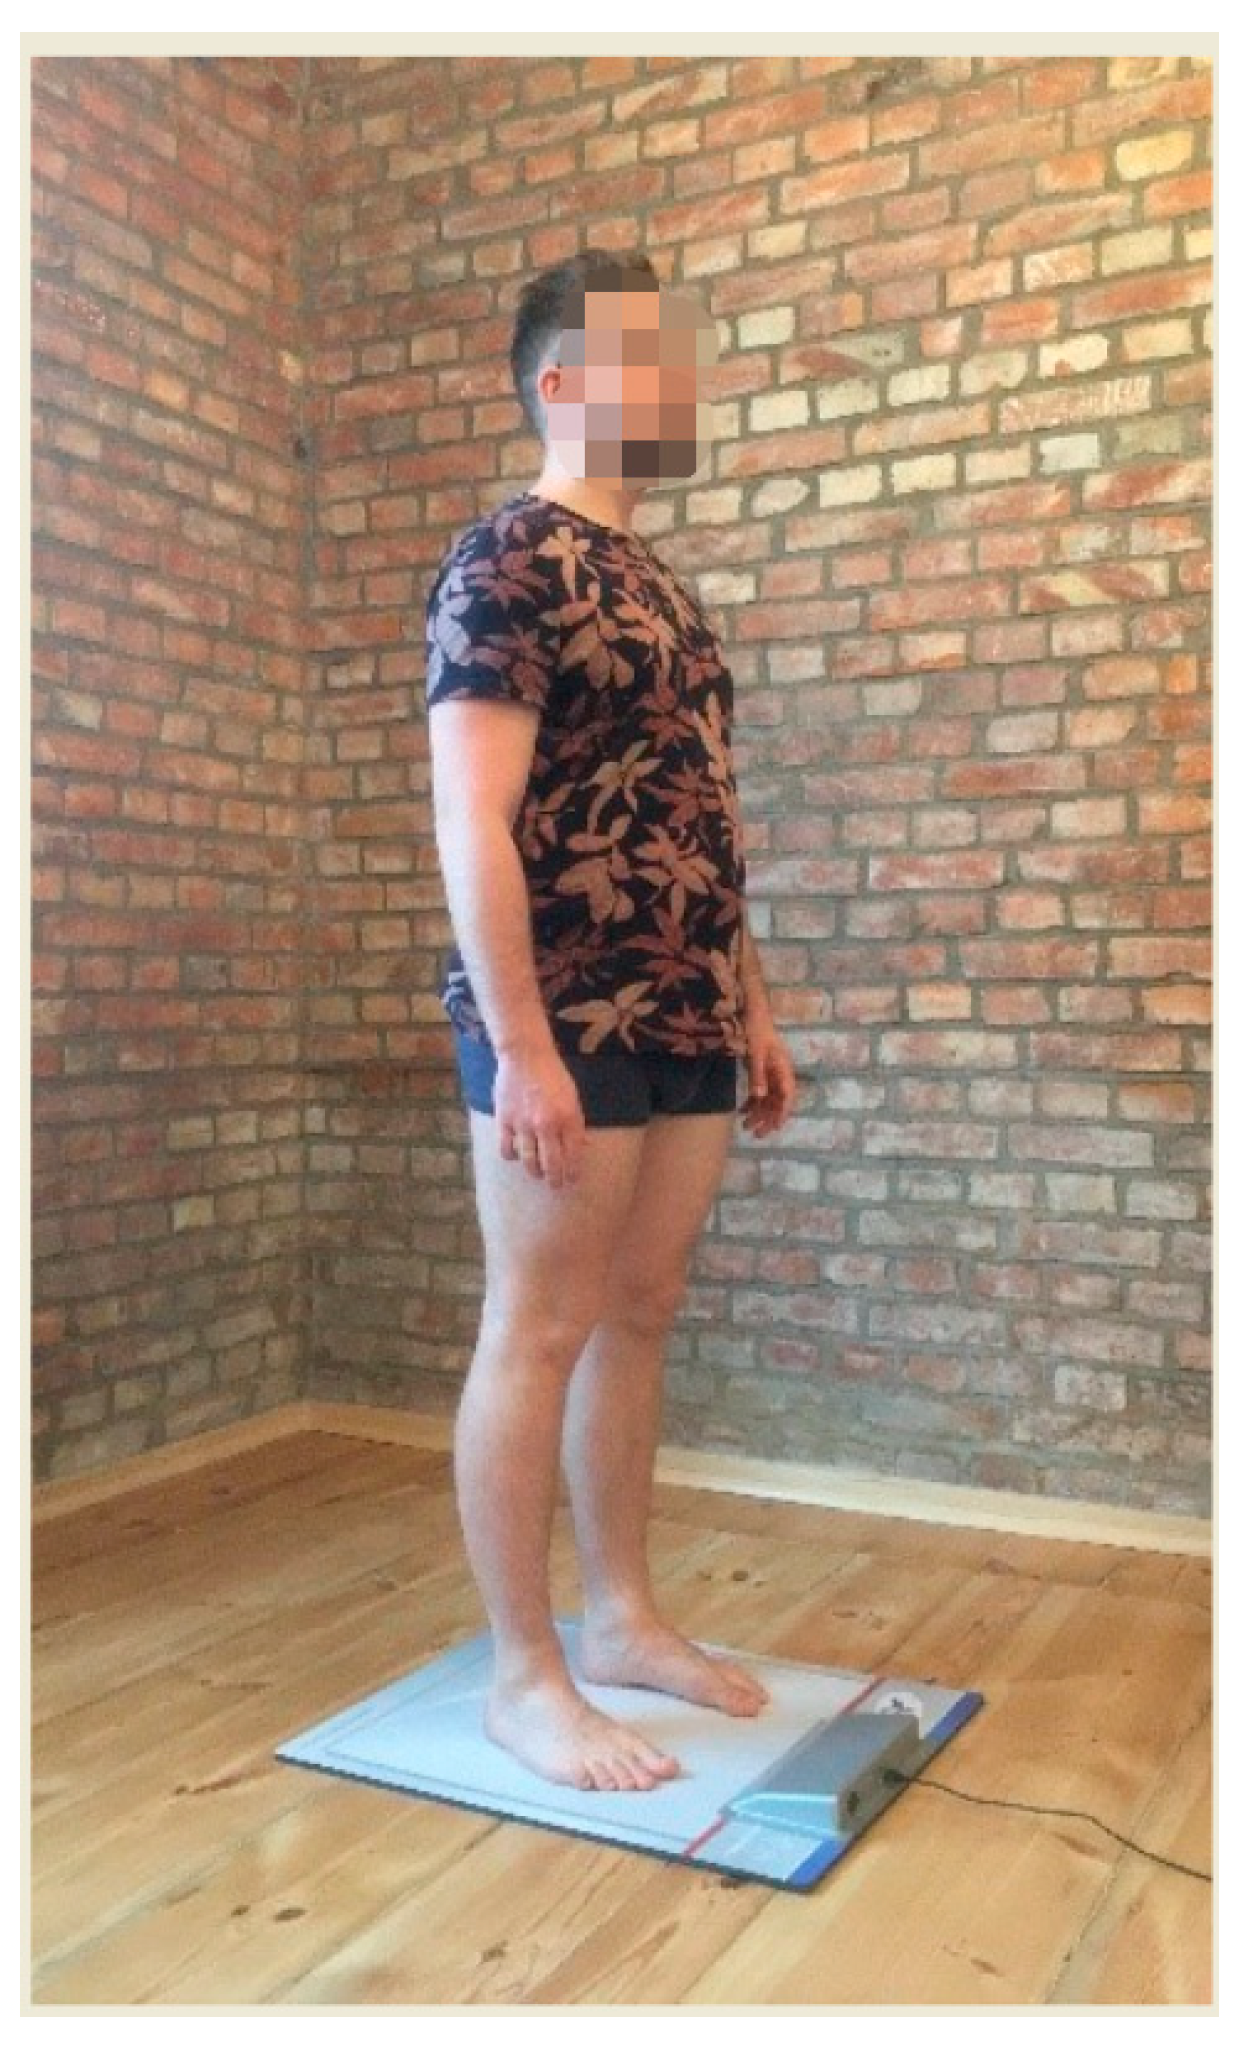
2.2. Measurements
2.3. Intervention
2.4. Statistical Analyses
3. Results
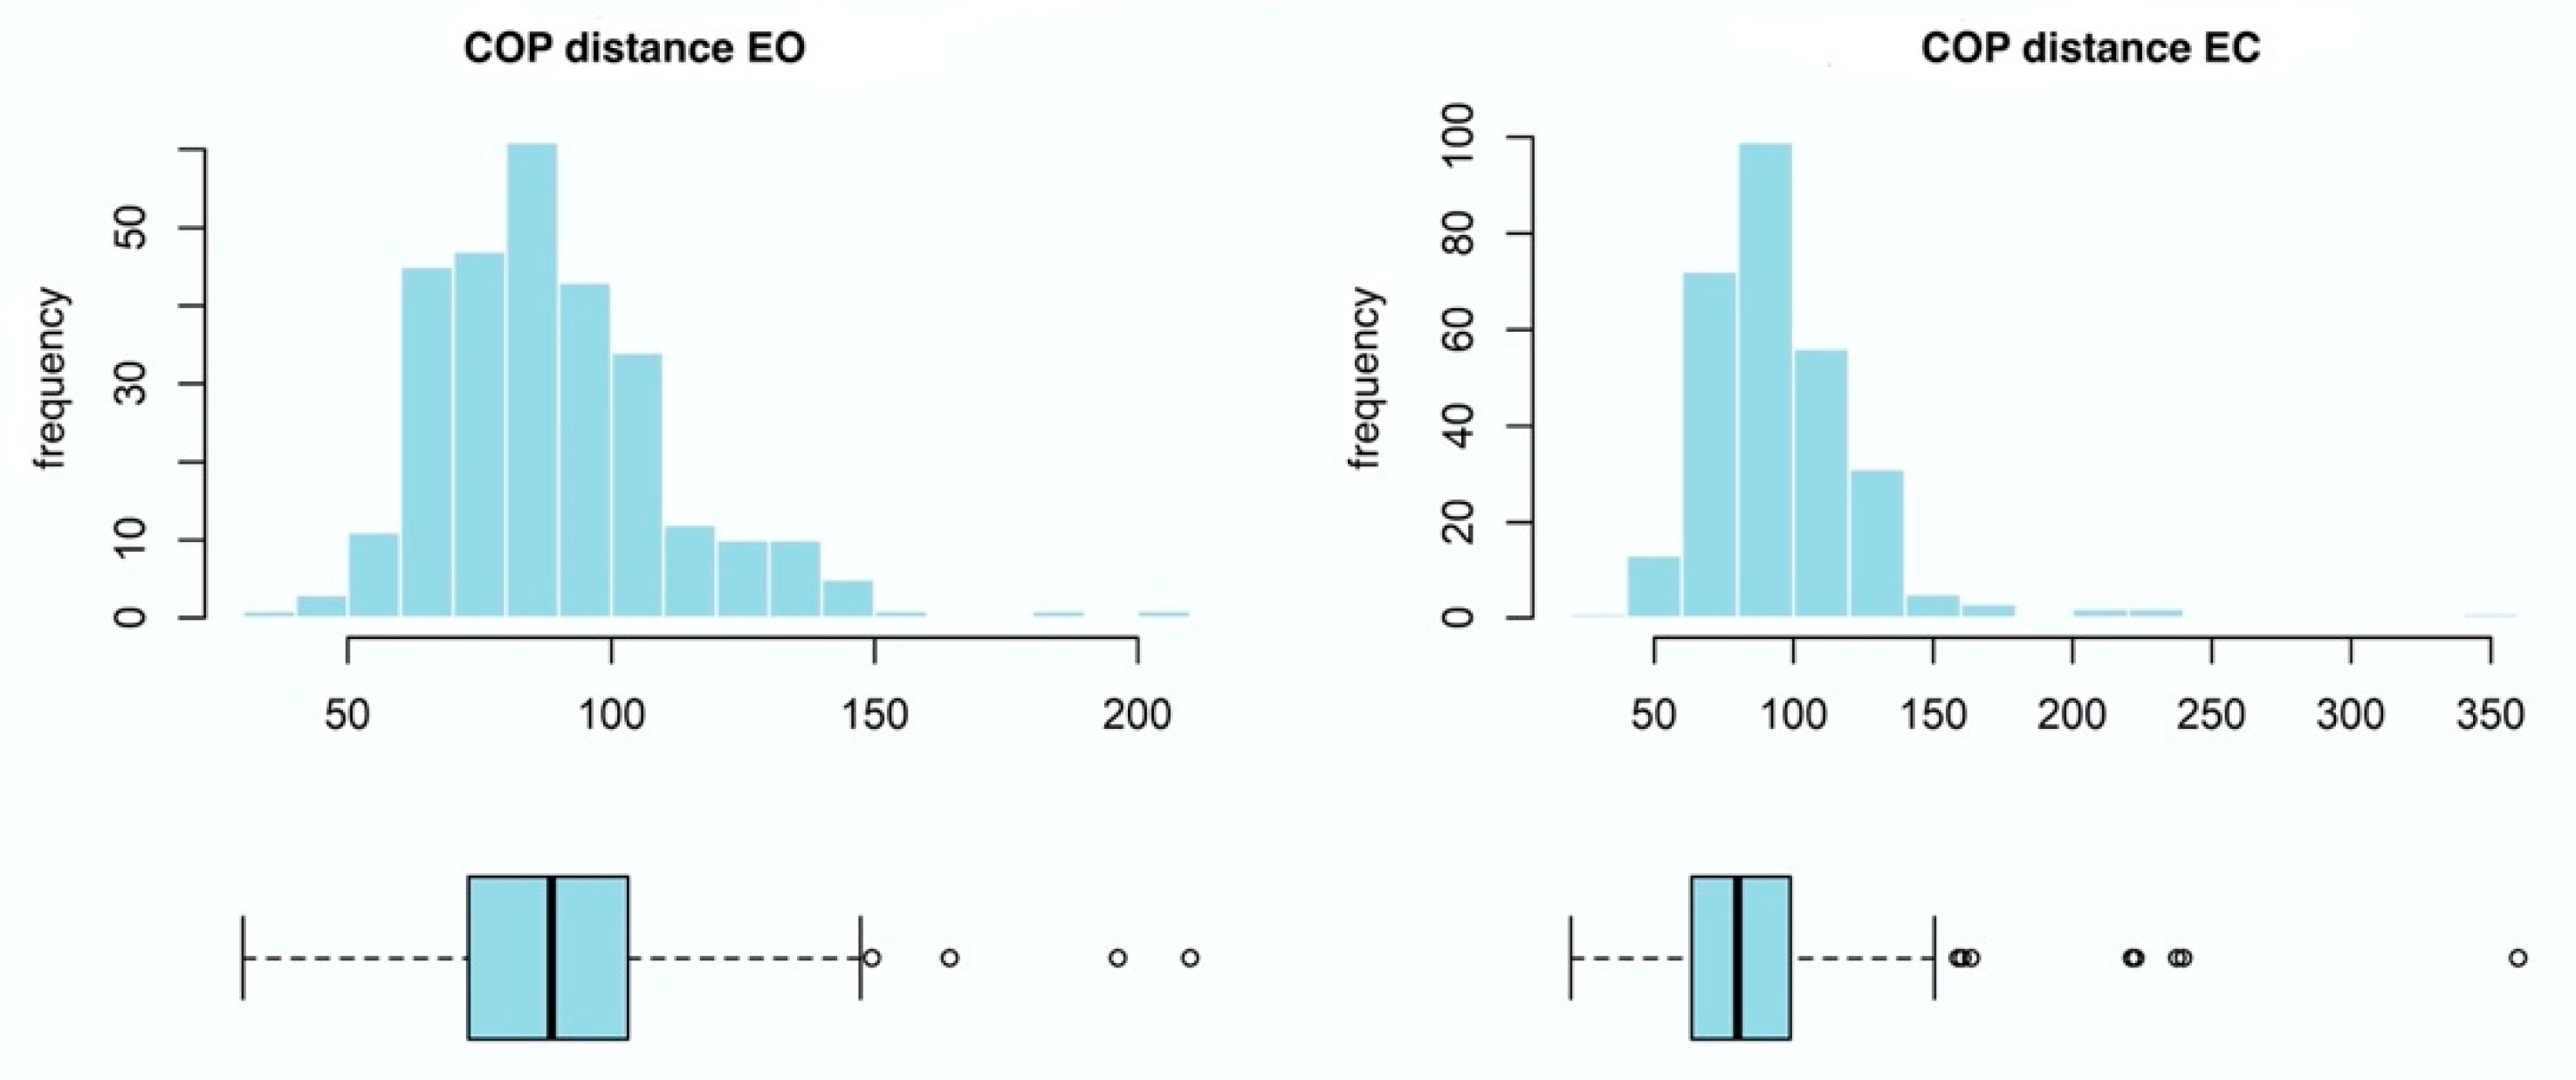
3.1. COP Distance
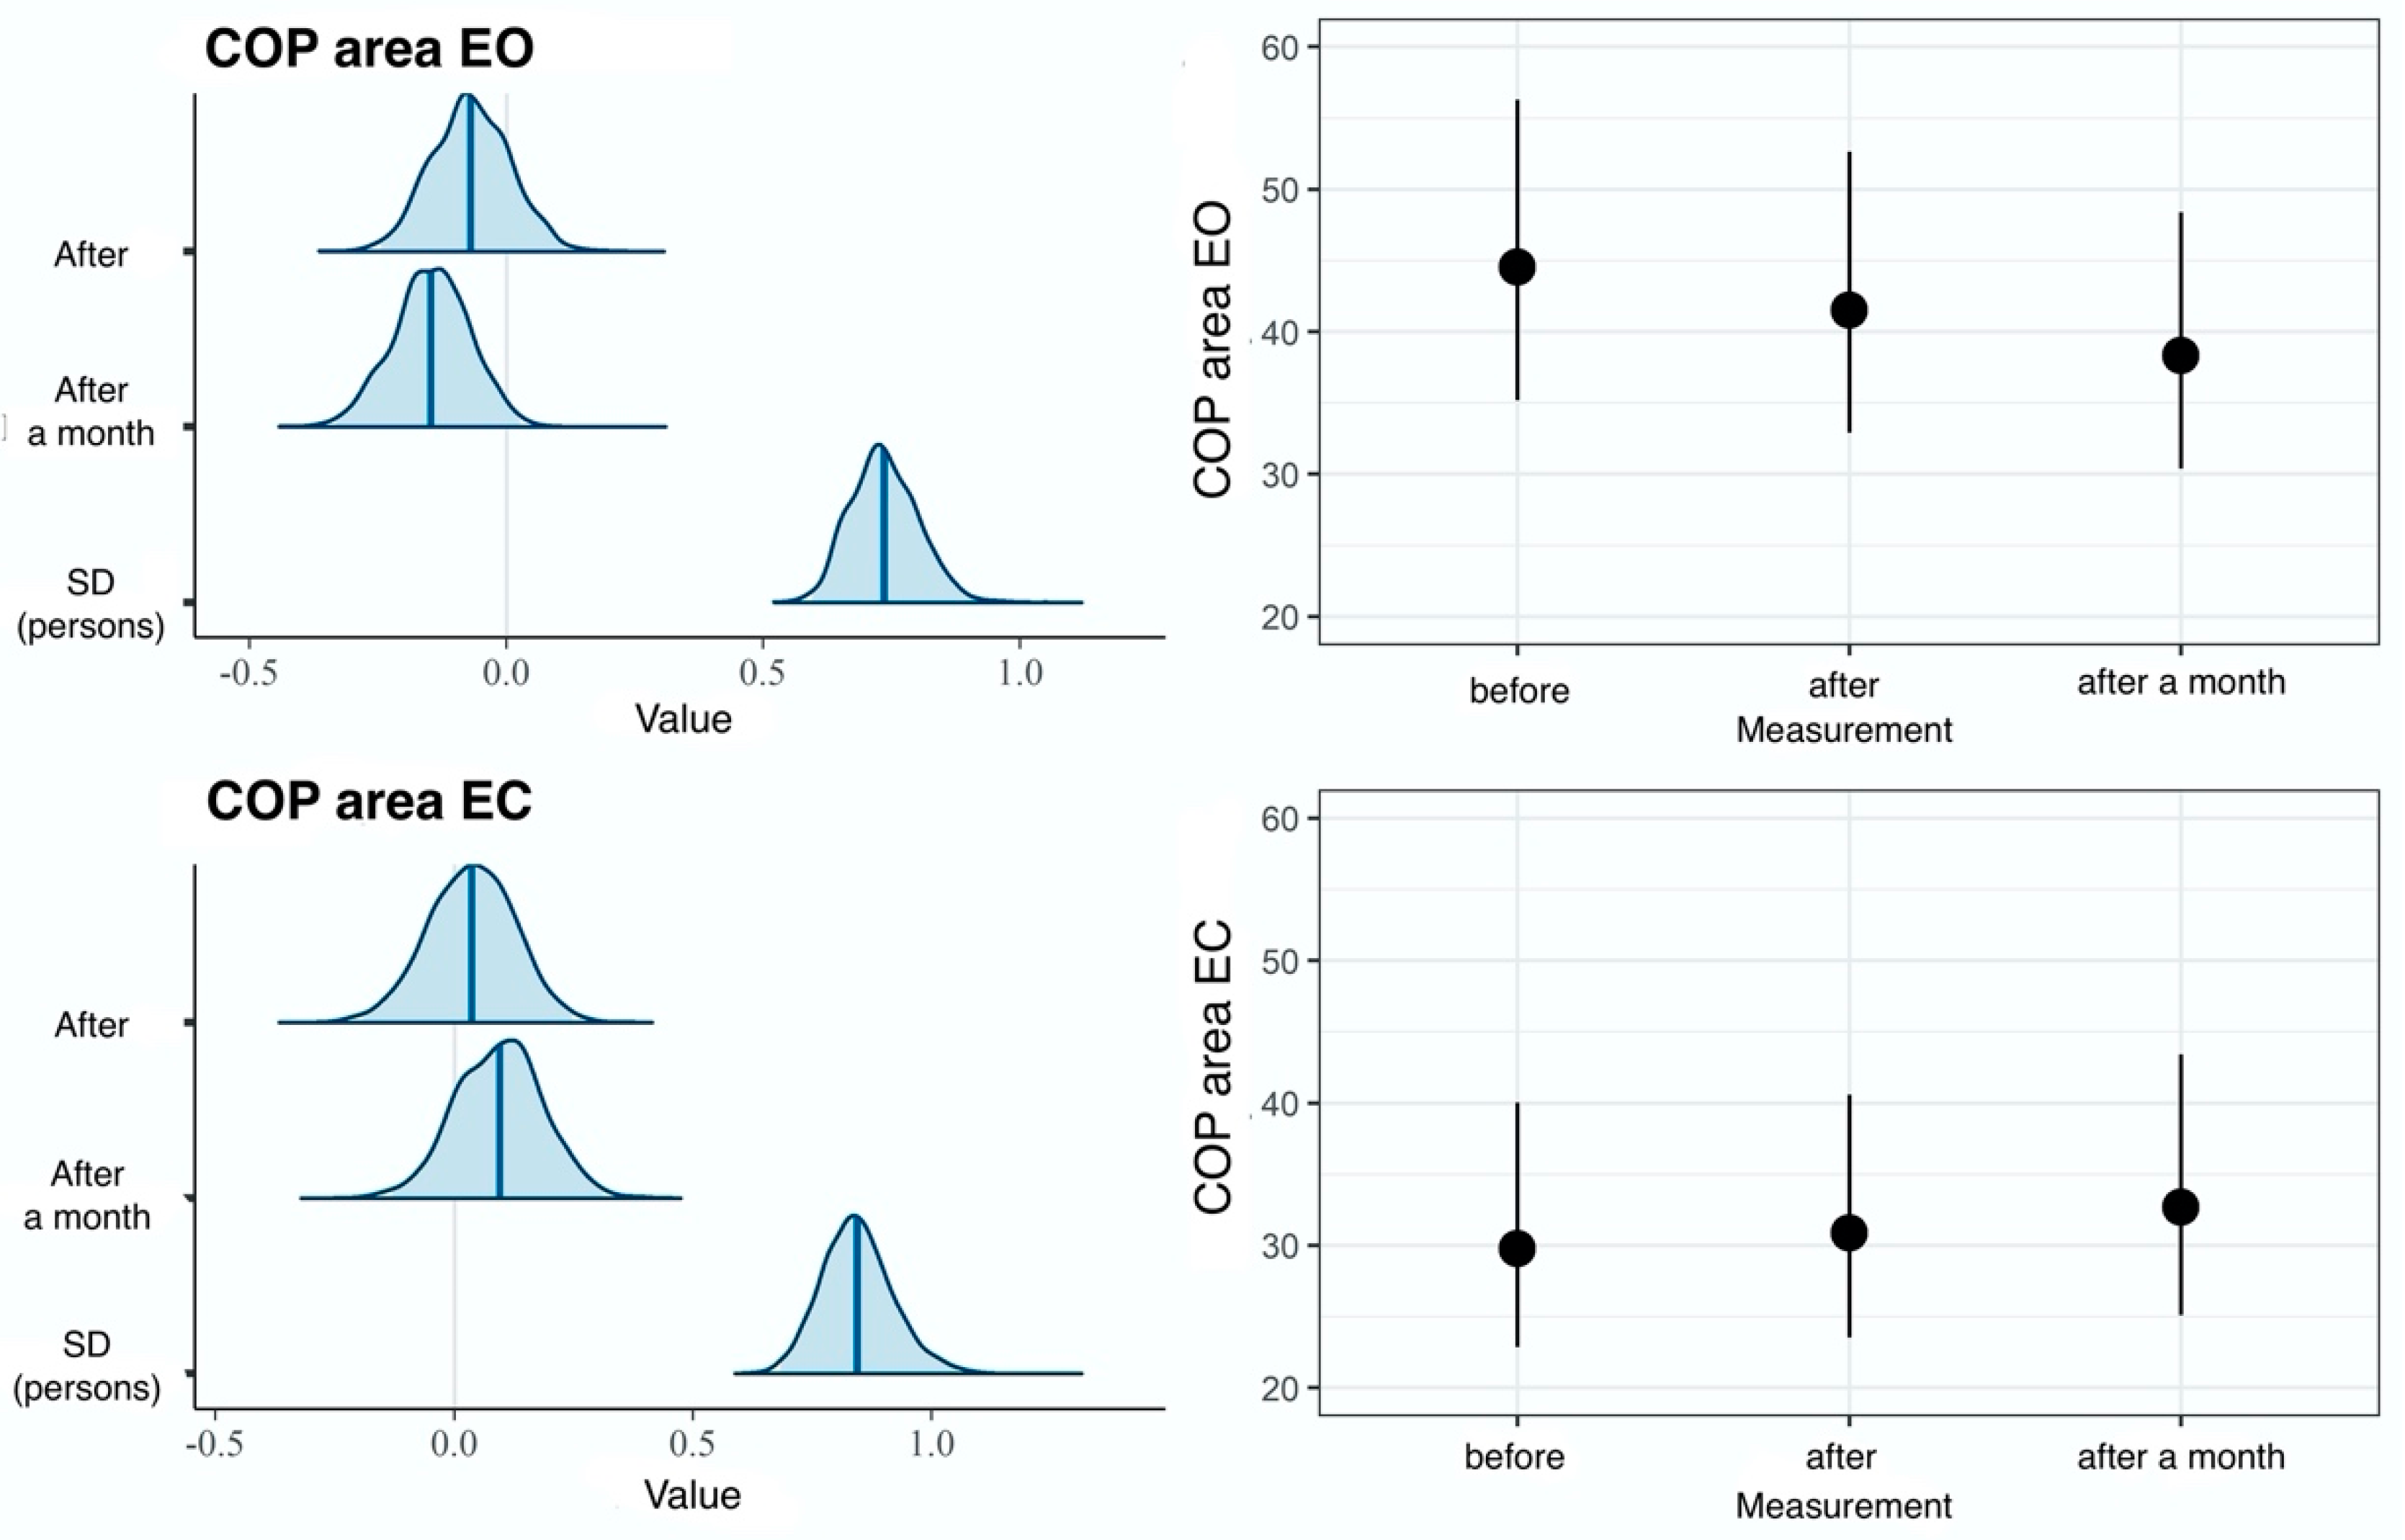
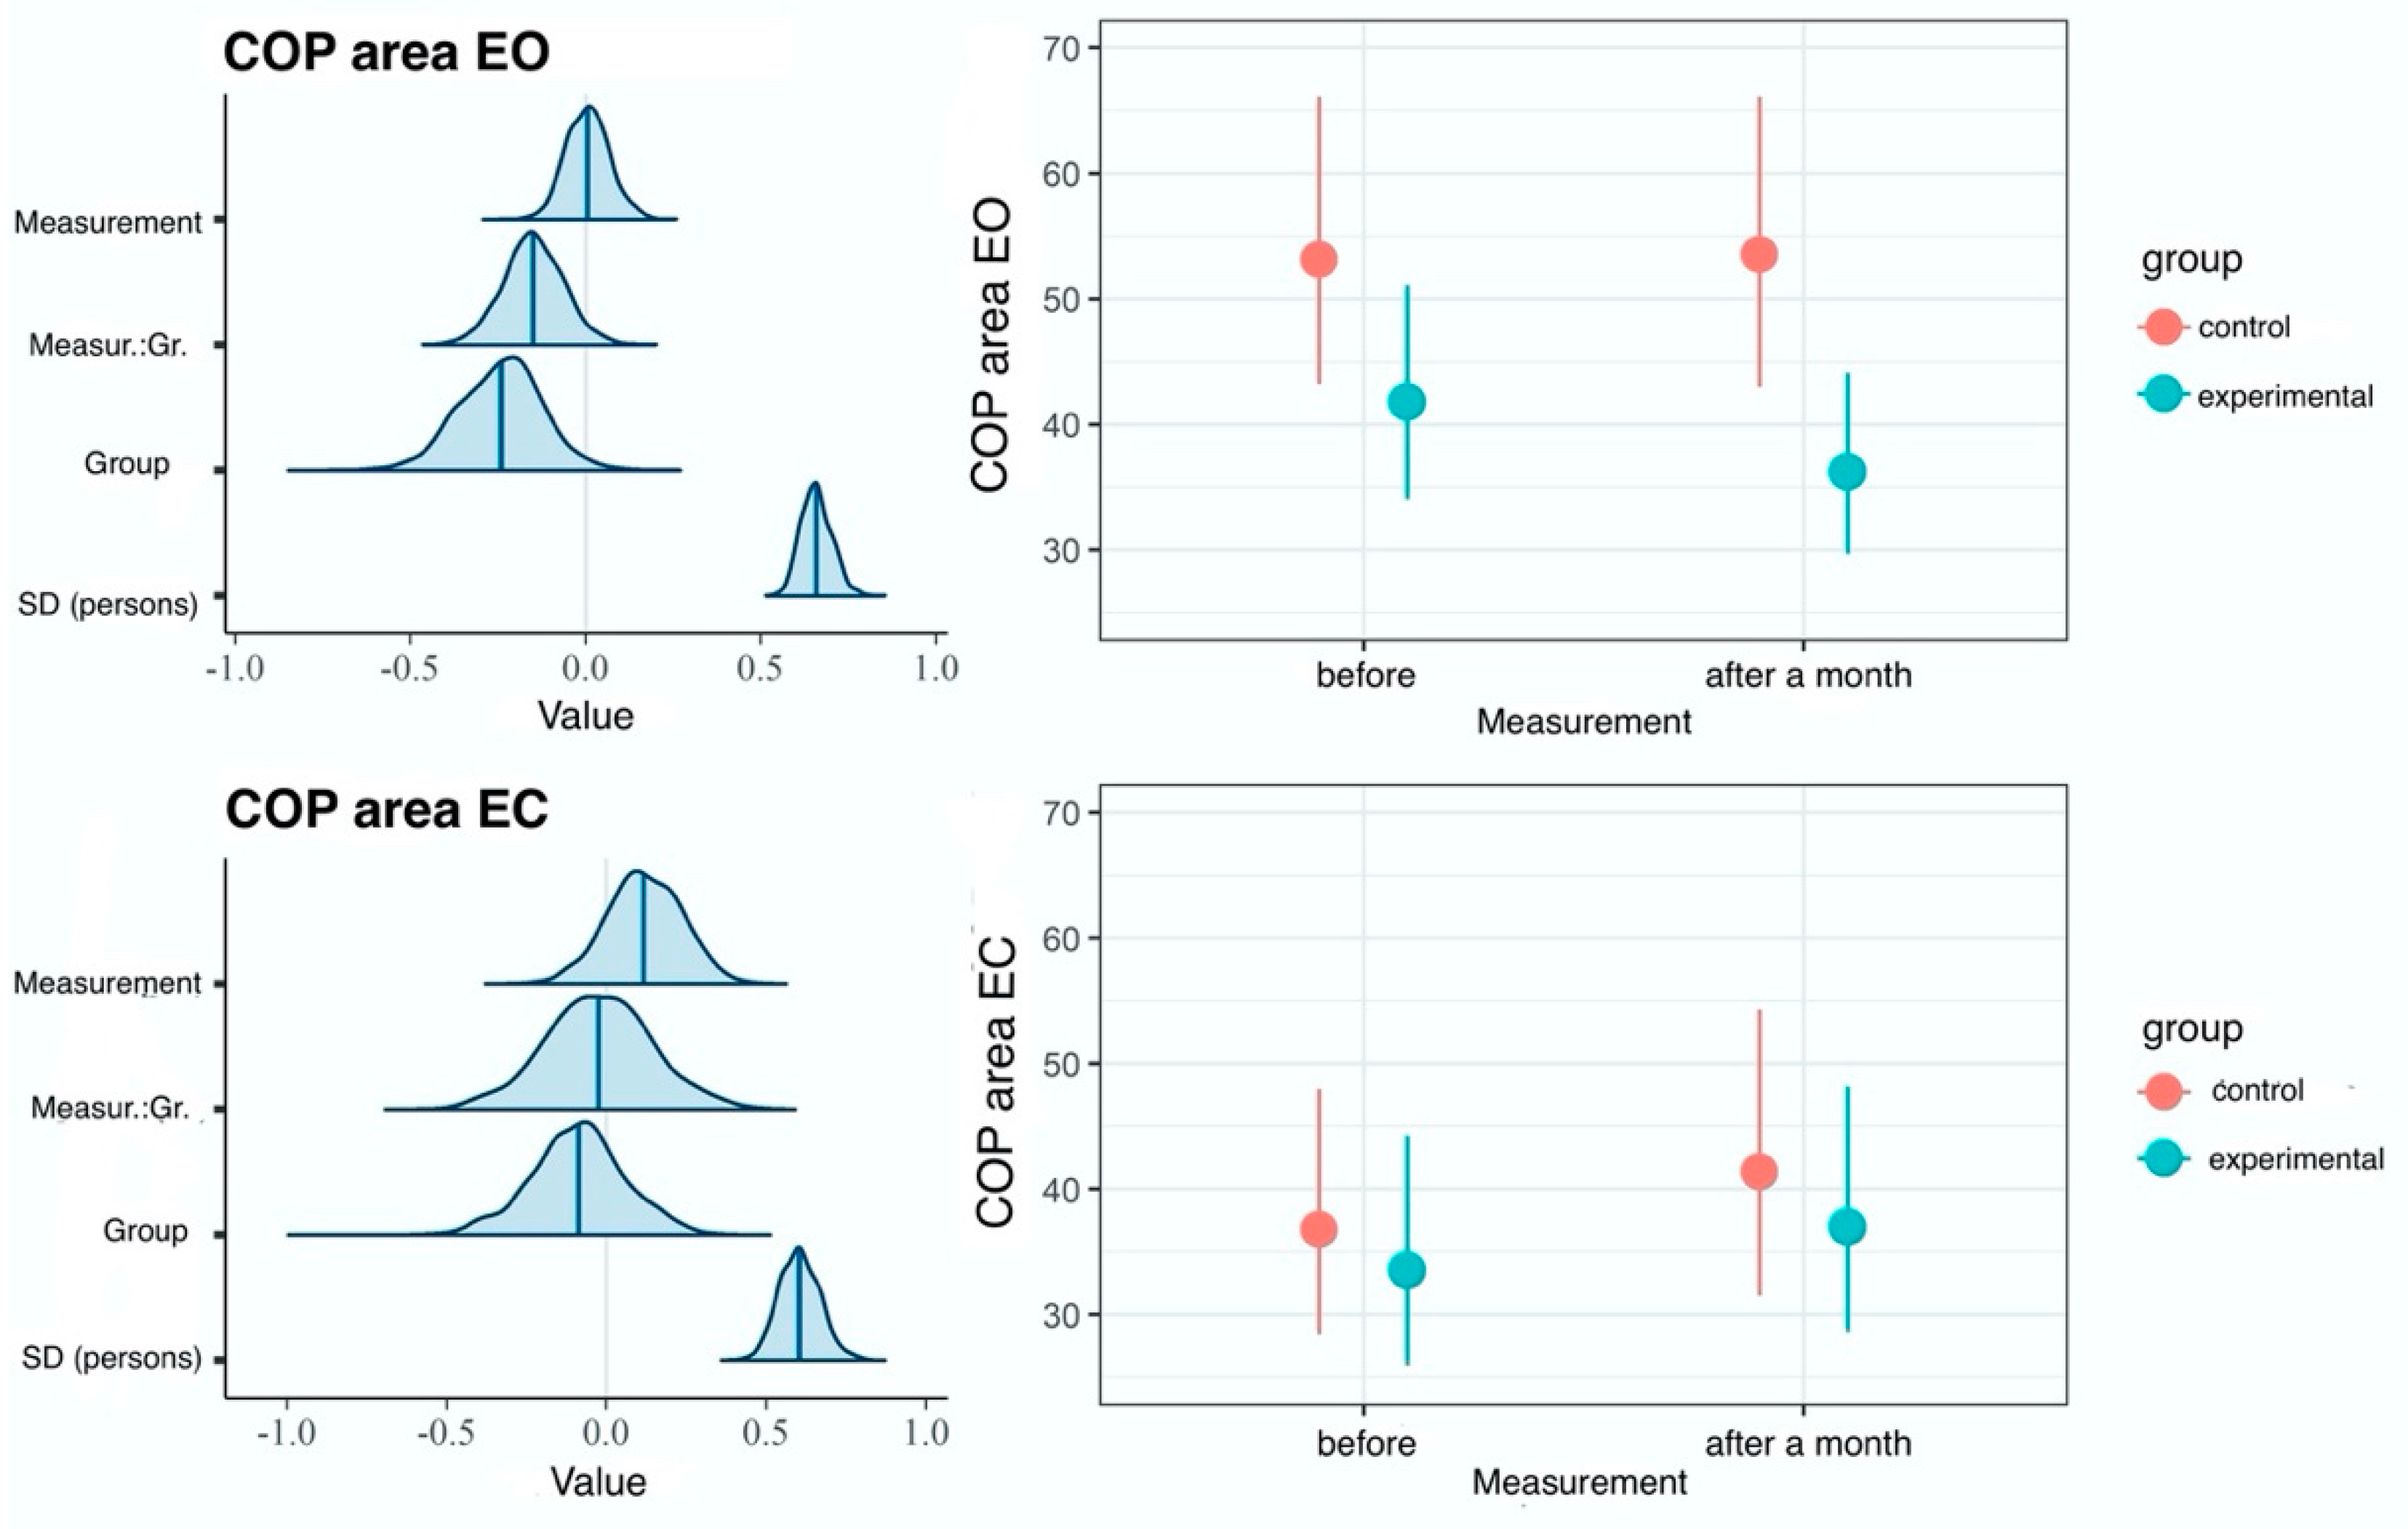
3.2. COP Sway Area
3.3. COP Sway Velocity
4. Discussion
5. Study Limitations
6. Conclusions
Author Contributions
Funding
Institutional Review Board Statement
Informed Consent Statement
Data Availability Statement
Conflicts of Interest
References
- Shmagel, A.; Foley, R.; Ibrahim, H. Epidemiology of Chronic Low Back Pain in US Adults: Data from the 2009–2010 National Health and Nutrition Examination Survey. Arthritis Care Res 2016, 68, 1688–1694. [Google Scholar] [CrossRef] [PubMed] [Green Version]
- DePalma, M.J.; Ketchum, J.M.; Saullo, T. What is the source of Chronic Low Back Pain and does age Play a Role? Pain Med. 2011, 12, 224–233. [Google Scholar] [CrossRef] [PubMed] [Green Version]
- Maher, C.; Underwood, M.; Buchbinder, R. Non-specific low back pain. Lancet 2017, 389, 736–747. [Google Scholar] [CrossRef] [PubMed] [Green Version]
- Deyo, R.A.; Weinstein, J.N. Low Back Pain. N. Engl. J. Med. 2001, 344, 363–370. [Google Scholar] [CrossRef] [PubMed]
- Henschke, N.; Maher, C.G.; Refshauge, K.M.; Herbert, R.D.; Cumming, R.G.; Bleasel, J.; York, J.; Das, A.; McAuley, J.H. Prevalence of and screening for serious spinal pathology in patients presenting to primary care settings with acute low back pain. Arthritis Rheum. 2009, 60, 3072–3080. [Google Scholar] [CrossRef] [PubMed]
- Enthoven, W.T.; Geuze, J.; Scheele, J.; Bierma-Zeinstra, S.M.; Bueving, H.J.; Bohnen, A.M.; Peul, W.C.; van Tulder, M.W.; Berger, M.Y.; Koes, B.W.; et al. Prevalence and “Red Flags” Regarding Specified Causes of Back Pain in Older Adults Presenting in General Practice. Phys. Ther. 2016, 96, 305–312. [Google Scholar] [CrossRef] [Green Version]
- Downie, A.; Williams, C.M.; Henschke, N.; Hancock, M.J.; Ostelo, R.W.; de Vet, H.C.; Macaskill, P.; Irwig, L.; van Tulder, M.W.; Koes, B.W.; et al. Red flags to screen for malignancy and fracture in patients with low back pain: Systematic review. BMJ 2013, 347, f7095. [Google Scholar] [CrossRef] [Green Version]
- Iglesias-Gonzalez, J.; Munoz-Garcia, M.; Rodrigues-de-Souza, D.P.; Alburquerque- Sendin, F.; Fernandez-de-las-Penas, C. Myofascial trigger points, pain, disability, and sleep quality in patients with chronic nonspecific low back pain. Pain Med. 2013, 14, 1964–1970. [Google Scholar] [CrossRef]
- Calvo-Lobo, C.; Diez-Vega, I.; Martínez-Pascual, B.; Fernández-Martínez, S.; de la Cueva-Reguera, M.; Garrosa-Martín, G.; Rodríguez-Sanz, D. Tensiomyography, sonoelastography, and mechanosensitivity differences between active, latent, and control low back myofascial trigger points: A cross-sectional study. Medicine 2017, 96, e6287. [Google Scholar] [CrossRef]
- Cooper, N.A.; Scavo, K.M.; Strickland, K.J.; Tipayamongkol, N.; Nicholson, J.D.; Bewyer, D.C.; Sluka, K.A. Prevalence of gluteus medius weakness in people with chronic low back pain compared to healthy controls. Eur. Spine J. 2016, 25, 1258–1265. [Google Scholar] [CrossRef]
- Hides, J.A.; Oostenbroek, T.; Franettovich Smith, M.M.; Mendis, M.D. The effect of low back pain on trunk muscle size/function and hip strength in elite football (soccer) players. J. Sport. Sci. 2016, 34, 2303–2311. [Google Scholar] [CrossRef]
- Embaby, E.; Abdallah, A. Trunk and gluteus-medius muscles ’fatigability during occupational standing in clinical instructors with low back pain. Br. J. Sport. Med. 2013, 47, e3. [Google Scholar] [CrossRef] [Green Version]
- Langevin, H.M.; Fox, J.R.; Koptiuch, C.; Badger, G.J.; Greenan-Naumann, A.C.; Bouffard, N.A.; Konofagou, E.E.; Lee, W.N.; Triano, J.J.; Henry, S.M. Reduced thoracolumbar fascia shear strain in human chronic low back pain. BMC Musculoskelet Disord. 2011, 12, 203. [Google Scholar] [CrossRef]
- Ranger, T.A.; Teichtahl, A.J.; Cicuttini, F.M.; Wang, Y.; Wluka, A.E.; O’Sullivan, R.; Jones, G.; Urquhart, D.M. Shorter Lumbar Paraspinal Fascia Is Associated with High Intensity Low Back Pain and Disability. Spine 2016, 41, E489-9. [Google Scholar] [CrossRef] [Green Version]
- Ruhe, A.; Fejer, R.; Walker, B. Is there a relationship between pain intensity and postural sway in patients with non-specific low back pain? BMC Musculoskelet Disord. 2011, 12, 162. [Google Scholar] [CrossRef] [Green Version]
- Mann, L.; Kleinpaul, J.F.; Pereira Moro, A.R.; Mota, C.B.; Carpes, F.P. Effect of low back pain on postural stability in younger women: Influence of visual deprivation. J. Bodyw. Mov. Ther. 2010, 14, 361–366. [Google Scholar] [CrossRef]
- Lafond, D.; Champagne, A.; Descarreaux, M.; Dubois, J.D.; Prado, J.M.; Duarte, M. Postural control during prolonged standing in persons with chronic low back pain. Gait. Posture. 2009, 29, 421–427. [Google Scholar] [CrossRef]
- Salavati, M.; Hadian, M.R.; Mazaheri, M.; Negahban, H.; Ebrahimi, I.; Talebian, S.; Jafari, A.H.; Sanjari, M.A.; Sohani, S.M.; Parnianpour, M. Test-retest reliability [corrected] of center of pressure measures of postural stability during quiet standing in a group with musculoskeletal disorders consisting of low back pain, anterior cruciate ligament injury and functional ankle instability. Gait. Posture 2009, 29, 460–464. [Google Scholar] [CrossRef]
- Thakkar, H.H.; E Senthil, K. Static and dynamic postural stability in subjects with and without chronic low back pain. Int. J. Res. Med. Sci. 2015, 3, 2405–2409. [Google Scholar] [CrossRef]
- Popa, T.; Bonifazi, M.; Della Volpe, R.; Rossi, A.; Mazzocchio, R. Adaptive changes in postural strategy selection in chronic low back pain. Exp. Brain Res. 2007, 177, 411–418. [Google Scholar] [CrossRef]
- Hamaoui, A.; Do, M.C.; Bouisset, S. Postural sway increase in low back pain subjects is not related to reduced spine range of motion. Neurosci. Lett. 2004, 357, 135–138. [Google Scholar] [CrossRef] [PubMed]
- George, S.Z.; Fritz, J.M.; Silfies, S.P.; Schneider, M.J.; Beneciuk, J.M.; Lentz, T.A.; Gilliam, J.R.; Hendren, S.; Norman, K.S. Interventions for the Management of Acute and Chronic Low Back Pain: Revision 2021. J. Orthop. Sport. Phys. Ther. 2021, 51, CPG1–CPG60. [Google Scholar] [CrossRef] [PubMed]
- Tozzi, P.; Bongiorno, D.; Vitturini, C. Fascial release effects on patients with non-specific cervical or lumbar pain. J. Bodyw. Mov. Ther. 2011, 15, 405–416. [Google Scholar] [CrossRef] [PubMed]
- van der Wal, J. The architecture of the connective tissue in the musculoskeletal system-an often overlooked functional parameter as to proprioception in the locomotor apparatus. Int. J. Massage Bodywork. 2009, 2, 9–23. [Google Scholar] [CrossRef] [PubMed] [Green Version]
- Pérez-Palomares, S.; Jiménez-Sánchez, C.; Serrano-Herrero, I.; Herrero, P.; Calvo, S. Is Instrumental Compression Equally Effective and Comfortable for Physiotherapists and Physiotherapy Students than Manual Compression? A Comparative Cross-Sectional Study. Int. J. Environ. Res. Public Health 2021, 18, 12121. [Google Scholar] [CrossRef]
- Marizeiro, D.F.; Florêncio, A.C.L.; Nunes, A.C.L.; Campos, N.G.; Lima, P.O.P. Immediate effects of diaphragmatic myofascial release on the physical and functional outcomes in sedentary women: A randomized placebo-controlled trial. J. Bodyw. Mov. Ther. 2018, 22, 924–929. [Google Scholar] [CrossRef]
- Ożóg, P.; Weber-Rajek, M.; Radzimińska, A.; Goch, A. Analysis of Muscle Activity following the Application of Myofascial Release Techniques for Low-Back Pain—A Randomized-Controlled Trial. J. Clin. Med. 2021, 10, 4039. [Google Scholar] [CrossRef]
- Shah, Y.; Arkesteijn, M.; Thomas, D.; Whyman, J.; Passfield, L. The acute effects of integrated myofascial techniques on lumbar paraspinal blood flow compared with kinesio-taping: A pilot study. J. Bodyw. Mov. Ther. 2017, 21, 459–467. [Google Scholar] [CrossRef] [Green Version]
- Manheim, C.J.; Lavett, D.K. The Myofascial Release Manual, 4th ed.; Slack, Inc.: Thorofare, NJ, USA, 2008. [Google Scholar]
- Ajimsha, M.S.; Daniel, B.; Chithra, S. Effectiveness of myofascial release in the management of chronic low back pain in nursing professionals. J. Bodyw. Mov. Ther. 2014, 18, 273–281. [Google Scholar] [CrossRef]
- Arguisuelas, M.D.; Lisón, J.F.; Sánchez-Zuriaga, D.; Martínez-Hurtado, I.; Doménech-Fernández, J. Effects of Myofascial Release in Nonspecific Chronic Low Back Pain: A Randomized Clinical Trial. Spine 2017, 42, 627–634. [Google Scholar] [CrossRef]
- Wang, X.; Ji, X. Sample Size Estimation in Clinical Research: From Randomized Controlled Trials to Observational Studies. Chest 2020, 158, 12–20. [Google Scholar] [CrossRef]
- Suresh, K. An overview of randomization techniques: An unbiased assessment of outcome in clinical research. J. Hum. Reprod. Sci. 2011, 4, 8–11. [Google Scholar] [CrossRef]
- Diallo, S.; Cour, F.; Josephson, A.; Vidart, A.; Botto, H.; Lebret, T.; Bonan, B. Evaluating single- incision slings in female stress urinary incontinence: The usefulness of the CONSORT statement criteria. Urology 2012, 80, 535–541. [Google Scholar] [CrossRef]
- Le Clair, K.; Riach, C. Postural stability measures: What to measure and for how long. Clin. Biomech. 1996, 11, 176–178. [Google Scholar] [CrossRef]
- Wulf, G.; Landers, M.; Lewthwaite, R.; Töllner, T. External focus instructions reduce postural instability in individuals with Parkinson disease. Phys. Ther. 2009, 89, 162–168. [Google Scholar] [CrossRef] [Green Version]
- Bauer, C.M.; Gröger, I.; Rupprecht, R.; Tibesku, C.O.; Gassmann, K.G. Reliability of static posturography in elderly persons. Z. Gerontol. Geriatr. 2010, 43, 245–248. [Google Scholar] [CrossRef]
- Luchau, T. Advanced Myofascial Techniques—Volume 2: Neck, Head, Spine and Ribs, 1st ed.; Handspring Publishing Limited, Fountainhall: Scotland, UK, 2017; pp. 3–29. [Google Scholar]
- Myers, T.W. Anatomy Trains. Myofascial Meridians for Manual and Movement Therapist, 2nd ed.; Churchill Livingstone Elsevier: London, UK, 2009; pp. 13–65. [Google Scholar]
- Riggs, A. Deep Tissue Massage, Revised Edition: A Visual Guide to Techniques; North Atlantic Books: Berkeley, CA, USA, 2007. [Google Scholar]
- Earls, J.; Myers, T.W. Fascial Release for Structural Balance; Lotus Publishing: Chichester, UK, 2017; pp. 25–48. [Google Scholar]
- Wickham, H.; Averick, M.; Bryan, J.; Chang, W.; McGowan, L.; François, R.; Grolemund, G.; Hayes, A.; Henry, L.; Hester, J.; et al. Welcome to the Tidyverse. J. Open Source Softw. 2019, 4, 1686. [Google Scholar] [CrossRef] [Green Version]
- Bürkner, P.C. Brms: An R Package for Bayesian Multilevel Models Using Stan. J. Stat. Softw. 2017, 80, 1–28. [Google Scholar] [CrossRef] [Green Version]
- Vehtari, A.; Gelman, A.; Gabry, J. Practical Bayesian model evaluation using leave-one-out cross-validation and WAIC. Stat. Comput. 2017, 27, 1413–1432. [Google Scholar] [CrossRef] [Green Version]
- Burnham, K.; Anderson, D. Model Selection and Multi-Model Inference; Springer: New York, NY, USA, 2002. [Google Scholar]
- Gelman, A.; Goodrich, B.; Gabry, J.; Vehtari, A. R-squared for Bayesian Regression Models. Am. Stat. 2018, 73, 307–309. [Google Scholar] [CrossRef]
- Jones, S.L.; Henry, S.M.; Raasch, C.C.; Hitt, J.R.; Bunn, J.Y. Individuals with non-specific low back pain use a trunk stiffening strategy to maintain upright posture. J. Electromyogr. Kinesiol. 2012, 22, 13–20. [Google Scholar] [CrossRef] [PubMed] [Green Version]
- Nelson-Wong, E.; Callaghan, J.P. Changes in muscle activation patterns and subjective low back pain ratings during prolonged standing in response to an exercise intervention. J. Electromyogr. Kinesiol. 2010, 20, 1125–1133. [Google Scholar] [CrossRef] [PubMed]
- Langevin, H.M.; Sherman, K.J. Pathophysiological model for chronic low back pain integrating connective tissue and nervous system mechanisms. Med. Hypotheses 2007, 68, 74–80. [Google Scholar] [CrossRef] [PubMed]
- Nijs, J.; Daenen, L.; Cras, P.; Struyf, F.; Roussel, N.; Oostendorp, R.A. Nociception affects motor output: A review on sensory-motor interaction with focus on clinical implications. Clin. J. Pain. 2012, 28, 175–181. [Google Scholar] [CrossRef]
- Lund, I.; Ge, Y.; Yu, L.C.; Uvnas-Moberg, K.; Wang, J.; Yu, C.; Kurosawa, M.; Agren, G.; Rosén, A.; Lekman, M.; et al. Repeated massage-like stimulation induces long-term effects on nociception: Contribution of oxytocinergic mechanisms. Eur. J. Neurosci. 2002, 16, 330–338. [Google Scholar] [CrossRef]
- Stecco, A.; Gesi, M.; Stecco, C.; Stern, R. Fascial components of the myofascial pain syndrome. Curr. Pain. Headache Rep. 2013, 17, 352. [Google Scholar] [CrossRef]
- Mavajian, M.; Fakhari, Z.; Naghdi, S.; Bagheri, H.; Jalaie, S. A pilot study on the short-term effects of myofascial release and core stability exercises on balance in chronic low back pain. Aud. Vestib. Res. 2020, 29, 109–116. [Google Scholar] [CrossRef]
- Ozsoy, G.; Ilcin, N.; Ozsoy, I.; Gurpinar, B.; Buyukturan, O.; Buyukturan, B.; Kararti, C.; Sas, S. The Effects of Myofascial Release Technique Combined with Core Stabilization Exercise in Elderly with Non-Specific Low Back Pain: A Randomized Controlled, Single-Blind Study. Clin. Interv. Aging 2019, 9, 1729–1740. [Google Scholar] [CrossRef] [Green Version]


| Dependent Variable | Model | LOOIC/KFOLDIC | Dependent Variable 2 | R-Squared EG | Total R-Squared |
|---|---|---|---|---|---|
| COP distance | null model | 3106 | EO | - | - |
| EC | |||||
| measurement | 3062 | EO | 0.07 [0.04, 0.12] | 0.64 [0.54, 0.71] | |
| EC | 0.01 [0.00, 0.03] | 0.51 [0.39, 0.61] | |||
| COP sway area | null model | 3087 | EO | - | - |
| EC | |||||
| measurement | 3082 | EO | 0.01 [0.00, 0.02] | 0.70 [0.60, 0.76] | |
| EC | 0 [0.00, 0.01] | 0.58 [0.46, 0.67] | |||
| COP velocity | null model | 656 | EO | - | - |
| EC | |||||
| measurement | 647 | EO | 0.07 [0.02, 0.13] | 0.30 [0.16, 0.42] | |
| EC | 0.01 [0.00, 0.04] | 0.23 [0.10, 0.36] |
| Dependent Variable | Model | LOOIC/KFOLDIC | Dependent Variable 2 | R-Squared EG | Total R-Squared |
|---|---|---|---|---|---|
| COP distance | null model | 4130 | EO | - | - |
| EC | |||||
| EG | 4127 | EO | 0.03 [0.01, 0.07] | 0.49 [0.36, 0.60] | |
| EC | 0.02 [0.00, 0.07] | 0.50 [0.39, 0.59] | |||
| EGI | 4129 | EO | 0.04 [0.01, 0.08] | 0.52 [0.39, 0.62] | |
| EC | 0.03 [0.00, 0.07] | 0.51 [0.39, 0.60] | |||
| COP sway area | null model | 4329 | EO | - | - |
| EC | |||||
| EG | 4329 | EO | 0.01 [0.00, 0.03] | 0.32 [0.22, 0.47] | |
| EC | 0.01 [0.00, 0.03] | 0.34 [0.20, 0.5] | |||
| EGI | 4332 | EO | 0.01 [0.00, 0.03] | 0.33 [0.22, 0.47] | |
| EC | 0.01 [0.00, 0.03] | 0.34 [0.20, 0.5] | |||
| COP velocity | null model | 877 | EO | - | - |
| EC | |||||
| EG | 881 | EO | 0.02 [0.00, 0.05] | 0.04 [0.00, 0.12] | |
| EC | 0.01 [0.00, 0.04] | 0.05 [0.00, 0.14] | |||
| EGI | 874 | EO | 0.06 [0.02, 0.13] | 0.09 [0.03, 0.18] | |
| EC | 0.02 [0.00, 0.05] | 0.05 [0.01, 0.15] |
Disclaimer/Publisher’s Note: The statements, opinions and data contained in all publications are solely those of the individual author(s) and contributor(s) and not of MDPI and/or the editor(s). MDPI and/or the editor(s) disclaim responsibility for any injury to people or property resulting from any ideas, methods, instructions or products referred to in the content. |
© 2023 by the authors. Licensee MDPI, Basel, Switzerland. This article is an open access article distributed under the terms and conditions of the Creative Commons Attribution (CC BY) license (https://creativecommons.org/licenses/by/4.0/).
Share and Cite
Ożóg, P.; Weber-Rajek, M.; Radzimińska, A.; Goch, A. Analysis of Postural Stability Following the Application of Myofascial Release Techniques for Low Back Pain—A Randomized-Controlled Trial. Int. J. Environ. Res. Public Health 2023, 20, 2198. https://doi.org/10.3390/ijerph20032198
Ożóg P, Weber-Rajek M, Radzimińska A, Goch A. Analysis of Postural Stability Following the Application of Myofascial Release Techniques for Low Back Pain—A Randomized-Controlled Trial. International Journal of Environmental Research and Public Health. 2023; 20(3):2198. https://doi.org/10.3390/ijerph20032198
Chicago/Turabian StyleOżóg, Piotr, Magdalena Weber-Rajek, Agnieszka Radzimińska, and Aleksander Goch. 2023. "Analysis of Postural Stability Following the Application of Myofascial Release Techniques for Low Back Pain—A Randomized-Controlled Trial" International Journal of Environmental Research and Public Health 20, no. 3: 2198. https://doi.org/10.3390/ijerph20032198