
Green Economy and Waste Management as Determinants of Modeling Green Capital of Districts in Poland in 2010–2020

Abstract
:1. Introduction
2. Literature Review
3. Materials and Methods
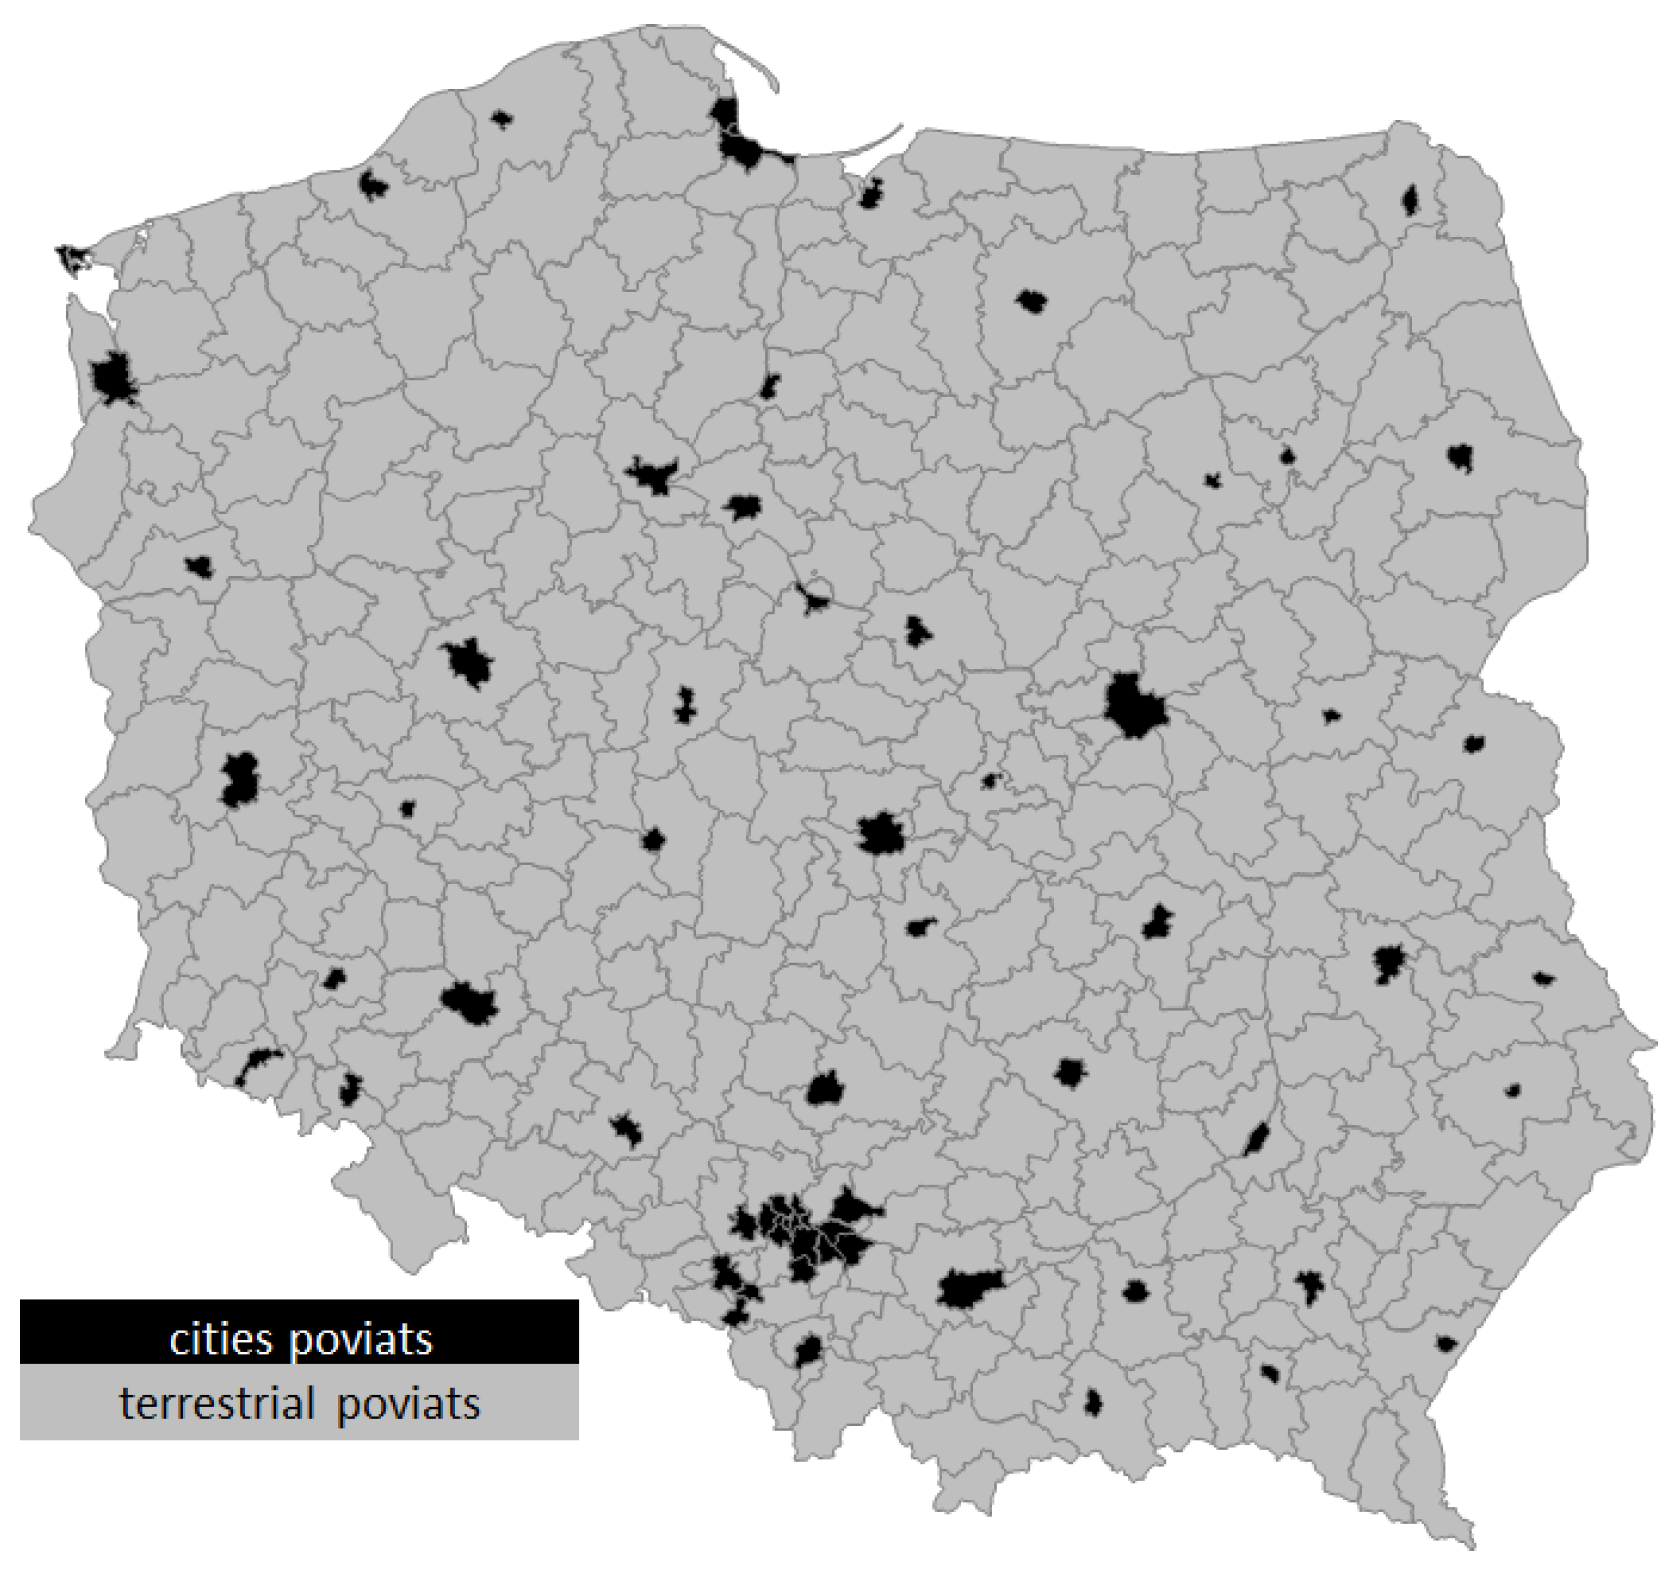
- Determination of the set of diagnostic variables and the study area.
- Reduction in the space of diagnostic variables (elimination of almost constant variables) verification in terms of statistics and content.
- Normalization of variables—method of unitarization to zero and determination of the direction of preferences of variables in relation to the main criterion.
- Determination of the value of the synthetic measure based on the formula selected for the aggregation of the diagnostic variables.
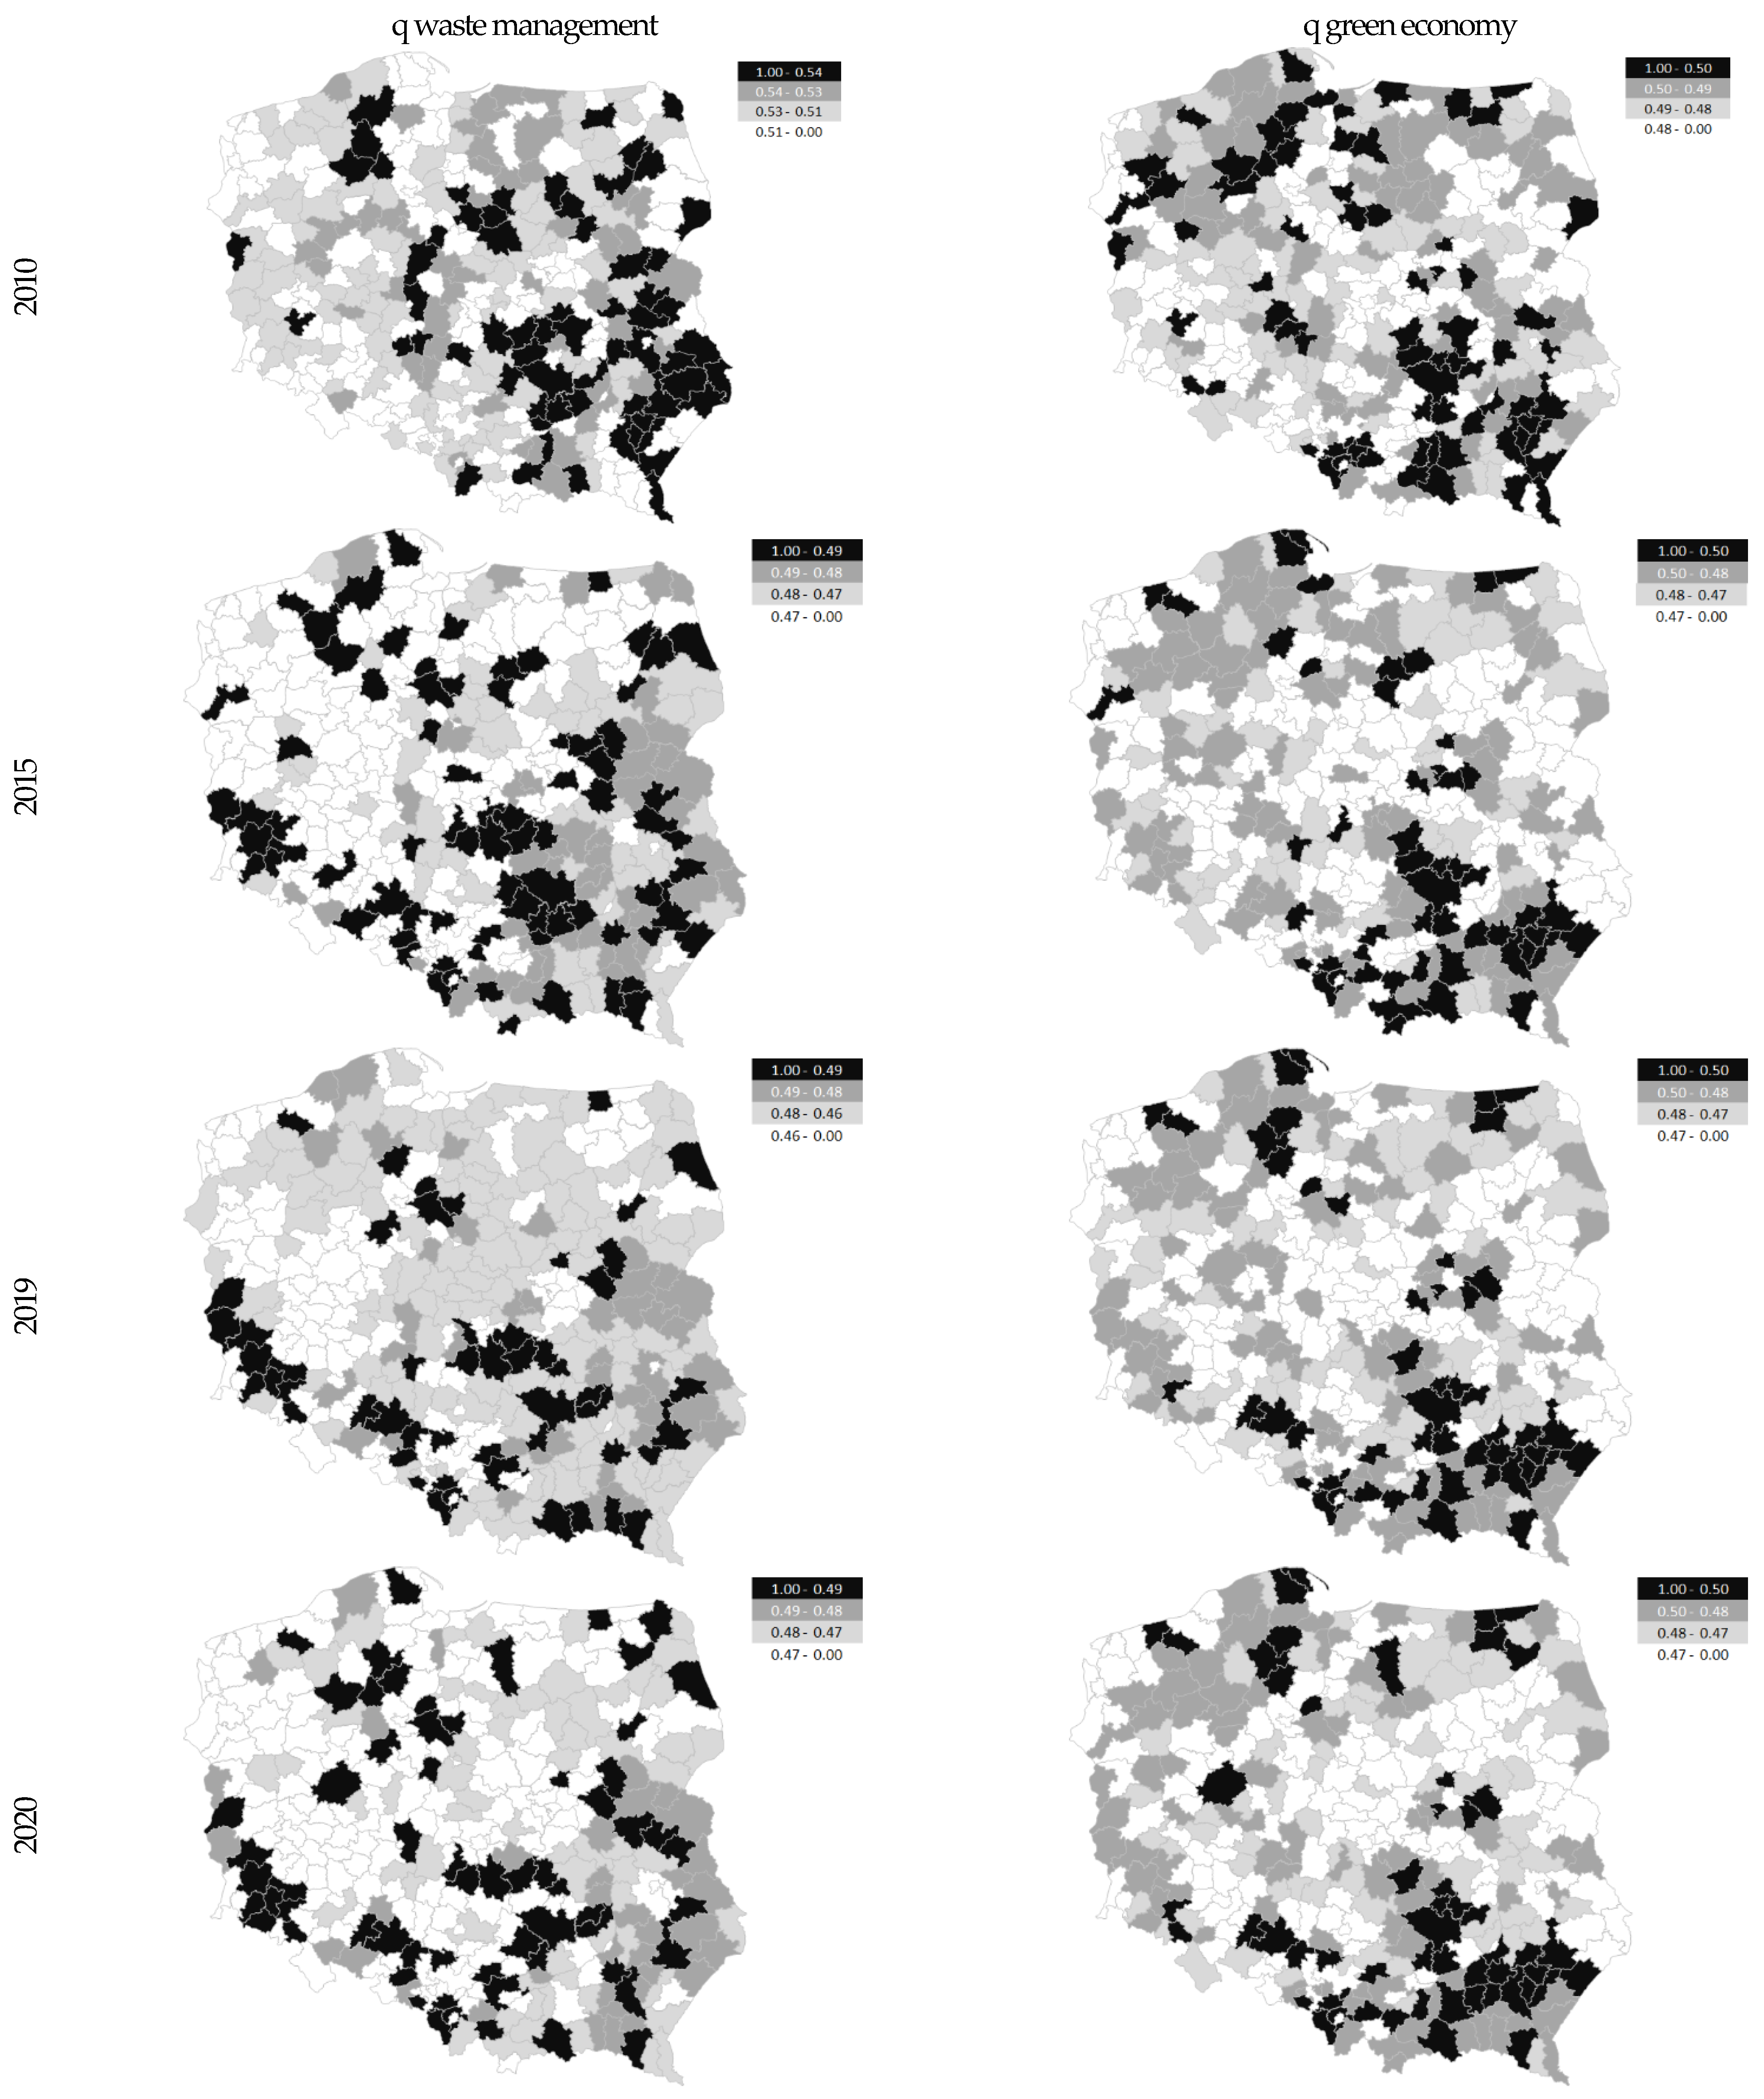
- The linear arrangement of objects. Identification of typological classes for the whole range of variability of the synthetic measure, measures of descriptive statistics, and values of measures of similarity (similarity/dissimilarity matrix) were determined (Table 1, Table 3 and Table 4).

| Stage | Description of Stage | |
|---|---|---|
| stage 4 | The Technique for Order Preference by Similarity to an Ideal Solution (TOPSIS) method is a reference method in which two reference points are determined—the standard and the anti-standard. Determining the Euclidean distances of objects from the pattern and anti-pattern, according to the formulas:
| |
| (8) | ||
| ||
| (9) | ||
|
where n—denotes the number of variables forming the pattern or anti-pattern, —denotes the unitized value of the j-th feature for the tested unit (or the normalized value of the j-th variable of the object), —denotes the template or anti-template object. Determining the synthetic measure (according to the TOPSIS method) according to the formula: | ||
| (10) | ||
| wherein: ∈ [0; 1]; means the distance of the object from the anti-pattern (from 0), means the distance of the object from the pattern (from 1). A higher value of the measure indicates a better situation of an individual in the analyzed area [52,53,54,63,65]. | ||
| stage 5 | Division of the studied units into typological groups. The first, second and third quartiles were adopted as threshold values. The size of the synthetic measure in the first group means a better unit, and in the following groups—weaker units. The similarity matrix was determined in the PQStat program. The Euclidean distance is a metric and is given by the formula: | |
| (11) | ||
|
where A = (x a, y a), B = (x b, y b). Distance equal to 0 when they are identical. The farther away the objects are, the more dissimilar they are (=1). The similarity matrix was determined in the PQStat program. For the analysis and evaluation of the strength of the relationship between the variables and the synthetic measure of the studied areas, Pearson’s linear correlation coefficients (performed in the Grtel program) were used, expressed by the formula: | ||
| (12) | ||
| where, r xy—Pearson’s linear correlation coefficient, x and y are measurable statistical features x = (1,2,… n), y = (1,2,… n), and
are the arithmetic means of the features x and y. The Gini coefficient is a measure of the inequality of the distribution of the examined variable, it takes a value between 0 and 1 (the concentration coefficient was calculated in the Ststistica program). The Gini coefficient is expressed by the formula: | ||
| G(y) = | (13) | |
| where yi is the value of the ith observation and a is the average value of all yi observations [69]. | ||
4. Results
5. Discussion
6. Conclusions
Author Contributions
Funding
Institutional Review Board Statement
Informed Consent Statement
Data Availability Statement
Conflicts of Interest
References
- Gorka, K.; Poskrobko, B.; Radecki, W. Ochrona Środowiska. Problemy Społeczne, Ekonomiczne i Prawne; Wyd. III: Warszawa, Poland, 2001. [Google Scholar]
- Czubak, A.W.; Pawłowski, K.P. Sustainable Economic Development of Farms in Central and Eastern European Countries Driven by Pro—Investment Mechanisms of the Common Agricultural Policy. Agriculture 2020, 10, 93. [Google Scholar] [CrossRef] [Green Version]
- UNEP. Towards a Green Economy: Pathway to Sustainable Development and Poverty Reduction; A Synthesis for Policy Makers; UNEP: Nairobi, Kenya, 2011. [Google Scholar]
- Poskrobko, B. Zarządzanie Środowiskiem; Polskie Wydawnictwo Ekonomiczne: Warszawa, Poland, 2007. [Google Scholar]
- Ivković, A.F.; Ham, M.; Mijoč, J. Measuring Objective Well-Being and Sustainable Development Management. J. Knowl. Manag. Econ. Inf. Technol. 2014, 4, 1–8. [Google Scholar]
- Choi, J.K.; Thangamani, D.; Kissock, K. A systematic methodology for improving resource efficiency in small and medium-sized enterprises. Resour. Conserv. Recycl. 2019, 147, 19–27. [Google Scholar] [CrossRef] [Green Version]
- Mesjasz-Lech, A. Filozofia zero odpadów a strategie środowiskowe miast. Zesz. Nauk. Politech. Śląskiej 2018, 127. [Google Scholar] [CrossRef]
- Binda, J.; Łapińska, H. The 2030 Agenda for Sustainable Development and improvements in quality of life in Poland. ASEJ Sci. J. Bielsk.-Biala Sch. Financ. Law 2019, 22, 5–10. [Google Scholar] [CrossRef]
- OECD. Inclusive Green Growth: For the Future We Want; OECD: Paris, France, 2012. [Google Scholar]
- OECD. Towards Green Growth; OECD: Paris, France, 2011. [Google Scholar]
- Ponte, S. Green Capital Accumulation: Business and Sustainability Management in a World of Global Value Chains. New Polit. Econ. 2020, 25, 72–84. [Google Scholar] [CrossRef]
- Ustawa z Dnia 5 Czerwca 1998 r. o Samorządzie Powiatowym, Dz. U. z 2020 r. poz. 920. Available online: https://isap.sejm.gov.pl/isap.nsf/DocDetails.xsp?id=WDU20200000920 (accessed on 4 March 2022).
- Piontek, B. Współczesne Uwarunkowania Rozwoju Społeczno-Gospodarczego; ATH: Bielsko-Biała, Poland, 2006. [Google Scholar]
- Richert-Kaźmierska, A. Osoby w wieku powyżej 55 lat jako potencjał rozwojowy regionu oraz możliwości jego wykorzystania. ZN Inst. Spraw. Publicznych UJ Zarządzanie Publiczne 2010, 12, 71–82. [Google Scholar]
- Wojewódzka-Wiewiórska, A.; Kłoczko-Gajewska, A.; Sulewski, P. Between the Social and Economic Dimensions of Sustainability in Rural Areas—In Search of Farmers’ Quality of Life. Sustainability 2020, 12, 148. [Google Scholar] [CrossRef] [Green Version]
- Wróblewski, Ł. Peryferyjność geograficzna a peryferyjność ekonomiczna regionu przygranicznego. Biul. Instyt. Zach. 2012, 113, 1–5. [Google Scholar]
- Kowacka, E.; Malik, K. Koncepcja „zero odpadów” jako element społecznej odpowiedzialności biznesu. Zesz. Nauk. Politech. Poznańskiej Organ. I Zarządzanie 2013, 60, 43–53. [Google Scholar]
- Folmer, H.; Gabel, L.; Opschoor, H. Ekonomia Środowiska i Zasobów Naturalnych; Wyd. Krupski i S-ka: Warszawa, Poland, 1996. [Google Scholar]
- Riccioli, F.; Cozzi, M. Modelling the Economic, Social and Environmental Components of Natural Resources for Sustainable Management. Sustainability 2021, 13, 8941. [Google Scholar] [CrossRef]
- Zębek, E. Zasady Gospodarki Odpadami w Ujęciu Prawnym i środowiskowym. Kortowski Przegląd Praw. Monogr. (KPP Monogr.) . 2018. Available online: http://uwm.edu.pl/kpp/files/numery_kpp/kpp_monografie_zasady_gospodarki_odpadami.pdf (accessed on 30 June 2018).
- Vardopoulos, I.; Konstantopoulos, I.; Zorpas, A.A.; Limousy, L.; Bennici, S.; Inglezakis, V.J.; Voukkali, I. Sustainable metropolitan areas perspectives through assessment of the existing waste management strategies. Environ. Sci. Pollut. Res. 2020, 28, 24305–24320. [Google Scholar] [CrossRef] [PubMed]
- Krugman, P. The Return of Depression Economics and the Crisis of 2008; W.W. Norton & Company: New York, NY, USA; London, UK, 2009. [Google Scholar]
- Gorzelak, G. (Ed.) Geografia Polskiego Kryzysu. Kryzys Peryferii Czy Peryferia Kryzysu? RSA—Sekcja Polska: Warszawa, Poland, 2009. [Google Scholar]
- OECD and Green Growth, OECD 2009. Available online: https://www.oecd.org/greengrowth/44273385.pdf (accessed on 15 November 2022).
- Green Economy and Trade (Environment & Trade Hub). Available online: https://www.unep.org/resources/policy-and-strategy/green-economy-and-trade-environment-trade-hub (accessed on 15 November 2022).
- European Commission, 2010. Europe 2020: A Strategy for Smart, Sustainable and Inclusive Growth. COM(2010) 2020 Final. Available online: http://eur-lex.europa.eu/LexUriServ/LexUriServ.do?uri=COM:2010:2020:FIN:EN:PDF (accessed on 15 November 2022).
- Chapple, K.; Hutson, M. Innovating the Green Economy in California Regions; Center for Community Innovation: Berkeley, CA, USA, 2009. [Google Scholar]
- Towards a Green Economy: Pathways to Sustainable Development and Poverty Eradication, UNEP 2011. Available online: https://sustainabledevelopment.un.org/content/documents/126GER_synthesis_en.pdf (accessed on 15 November 2022).
- Szyja, P. Zielona gospodarka w Polsce—Stan obecny i perspektywy. Nierówności Społeczne A Wzrost Gospod. 2015, 41, 432–447. [Google Scholar]
- Drobniak, A.; Janiszek, M.; Plac, K. Zielona gospodarka i zielona infrastruktura jako mechanizmy wzmacniania gospodarczo-środowiskowego wymiaru prężności. Res. Pap. Wrocław Univ. Econ. 2016, 443, 57–69. [Google Scholar]
- Swainson, L.; Mahanty, S. Green economy meets political economy: Lessons from the “Aceh Green” initiative, Indonesia. Glob. Environ. Chang. 2018, 53, 286–295. [Google Scholar] [CrossRef]
- Ryszawska, B. Koncepcja zielonej gospodarki jako odpowiedź na kryzys gospodarczy i środowiskowy. Pr. Nauk. Uniw. Ekon. We Wrocławiu 2013, 318, 47–56. [Google Scholar] [CrossRef] [Green Version]
- Adamowicz, M. Zielona gospodarka, zielony wzrost i zazielenienie jako formy realizacji koncepcji zrównoważonego rozwoju. Wieś I Rol. 2021, 2, 13–33. [Google Scholar] [CrossRef]
- Braccini, A.M.; Margherita, E.G. Exploring Organizational Sustainability of Industry 4.0 under the Triple Bottom Line: The Case of a Manufacturing Company. Sustainability 2019, 11, 36. [Google Scholar] [CrossRef] [Green Version]
- Kasztelan, A. Green Growth, Green Economy and Sustainable Development: Terminological and Relational Discourse. Prague Econ. Pap. 2017, 26, 487–499. [Google Scholar] [CrossRef] [Green Version]
- Vuola, M.; Korkeakoski, M.; Vähäkari, N.; Dwyer, M.B.; Hogarth, N.J.; Kaivooja, J.; Luukkanen, J.; Chea, E.; Thuon, T.; Phonhalath, K. What is a Green Economy? Review of National-Level Green Economy Policies in Cambodia and Lao PDR. Sustainability 2020, 12, 6664. [Google Scholar] [CrossRef]
- Contribution of the European Union to the United Nations Conference on Sustainable Development (“Rio+20”). Available online: https://europeanmovement.eu/wp-content/uploads/2015/05/FA-2012-Res-Rio-20.pdf (accessed on 15 November 2022).
- Cusack, C. Sustainable Development and Quality of Life. In Multidimensional Ap-proach to Quality of Life Issues; Sinha, B., Ed.; Springer: Singapore, 2019. [Google Scholar] [CrossRef]
- Severo, E.A.; Perin, M.M.S.; De Guimarães, J.C.F.; Taufer, E. The relationship between sustainable innovation and product or service innovation: A survey in companies in Rio Grande do Sul. Rev. De Gestão 2020, 27, 319–334. [Google Scholar] [CrossRef]
- Ghisellini, P.; Cialani, C.; Ulgiati, S. A review on circular economy: The expected transition to a balanced interplay of environmental and economic systems. J. Clean. Prod. 2016, 114, 11–32. [Google Scholar] [CrossRef]
- Guo, M.; Nowakowska-Grunt, J.; Gorbanyov, V.; Egorova, M. Green Technology and Sustainable Development: Assessment and Green Growth Frameworks. Sustainability 2020, 12, 6571. [Google Scholar] [CrossRef]
- Kasztelan, A. Zielony wzrost jako nowy kierunek rozwoju gospodarki w warunkach zagrożeń eko-logicznych. Stud. Ekon. (Econ. Stud.) 2015, 2, 185–208. [Google Scholar]
- D’Amato, D.; Korhonen, J. Integrating the green economy, circular economy and bioeconomy in a strategic sustainability framework. Ecol. Econ. 2021, 188, 107143. [Google Scholar] [CrossRef]
- Boom Cárcamo, E.A.; Peñabaena-Niebles, R. Opportunities and challenges for the waste manage-ment in emerging and frontier countries through industrial symbiosis. J. Clean. Prod. 2022, 363, 132607. [Google Scholar] [CrossRef]
- Amaral, R.E.C.; Brito, J.; Buckman, M.; Drake, E.; Ilatova, E.; Rice, P.; Sabbagh, C.; Voronkin, S.; Abraham, Y.S. Waste Management and Operational Energy for Sustainable Buildings: A Review. Sustainability 2020, 12, 5337. [Google Scholar] [CrossRef]
- Khan, S.A.R.; Umar, M.; Asadov, A.; Tanveer, M.; Yu, Z. Technological Revolution and Circular Economy Practices: A Mechanism of Green Economy. Sustainability 2022, 14, 4524. [Google Scholar] [CrossRef]
- Malina, A. Wielowymiarowa Analiza Przestrzennego Zróżnicowania Struktury Gospodarki Polski Według Województw; Wyd. Akademii Ekonomicznej w Krakowie: Kraków, Poland, 2004. [Google Scholar]
- Kukuła, K.; Luty, L. O wyborze metody porządkowania liniowego do oceny gospodarki odpadami w Polsce w ujęciu przestrzennym. Zesz. Nauk. Szkoły Głównej Gospod. Wiej. W Warszawie 2018, 18, 183–192. [Google Scholar] [CrossRef] [Green Version]
- Wysocki, F.; Lira, J. Statystyka Opisowa; Wyd. AR: Poznań, Poland, 2005. [Google Scholar]
- Kukuła, K.; Bogocz, D. Zero Unitarization, Method and Its Application in Ranking Research in Agriculture. Econ. Reg. Stud. 2014, 7, 5–13. [Google Scholar]
- Wójcik-Leń, J.; Leń, P.; Mika, M.; Kryszk, H.; Kotlarz, P. Studies regarding correct selection of statistical methods for the needs of increasing the efficiency of identification of land for consolidation—A case study in Poland. Land Use Policy 2000, 87, 104064. [Google Scholar] [CrossRef]
- Hwang, C.L.; Yoon, K. Multiple Attribute Decision Making. Methods and Applications; Springer: Berlin, Germany, 1981. [Google Scholar]
- Wysocki, F. Metody Taksonomiczne w Rozpoznawaniu Typ ó w Ekonomicznych Rolniczych i Obszar ó w Gospodarstwie Wiejskim; Wyd. Uniwersytetu Przyrodniczego w Poznaniu: Poznań, Poland, 2010. [Google Scholar]
- Greselin, F.; Zitikis, R. From the Classical Gini Index of IncomeInequality to a New Zenga-Type Relative Measure of Risk: A Modeller’s Perspective. Econometrics 2018, 6, 4. [Google Scholar] [CrossRef] [Green Version]
- Młodak, A. Analiza Taksonomiczna w Statystyce Regionalnej; Difin: Warszawa, Poland, 2006. [Google Scholar]
- Malina, A.; Zeliaś, A. O budowie taksonomicznej miary jakości życia. Syntetyczna miara rozwoju jest narzędziem statystycznej analizy porównawczej. Taksonomia 1997, 4, 238. [Google Scholar]
- Nowak, E.; Urbaniak, M. (Eds.) Ekonometryczne Modelowanie Danych Finansowo-Księgowych; UMCS: Lublin, Poland, 1996. [Google Scholar]
- Sobczak, E. Klasyfikacja podregionów polski ze względu na stopień ochrony środowiska. Pr. Nauk. Akad. Ekon. We Wrocławiu 2003, 1009, 107–119. [Google Scholar]
- Solangi, Y.A.; Tan, Q.; Khan, M.W.A.; Mirjat, N.H.; Ahmed, I. The Selection of Wind Power Project Location in the Southeastern Corridor of Pakistan: A Factor Analysis, AHP, and Fuzzy-TOPSIS Application. Energies 2018, 11, 1940. [Google Scholar] [CrossRef] [Green Version]
- Cheba, K. Zastosowanie analizy czynnikowej w badaniu przestrzennego zróżnicowania poziomu życia na przykładzie miast średniej wielkości w Polsce. Folia Pomeranae Univ. Technol. Stetin. Oeconomica 2012, 68, 27–36. [Google Scholar]
- Drozdowski, G.; Dziekański, P. Local Disproportions of Quality of Life and Their Influence on the Process of Green Economy Development in Polish Voivodships in 2010–2020. Int. J. Environ. Res. Public Health 2022, 19, 9185. [Google Scholar] [CrossRef]
- Grabiński, T. Metody określania charakteru zmiennych w wielowymiarowej analizie porównawczej. Zesz. Nauk. Akad. Ekon. W Krakowie 1985, 213, 35–63. [Google Scholar]
- Malina, A. Analiza przestrzennego zróżnicowania poziomu rozwoju społeczno-gospodarczego województw Polski w latach 2005–2017. Soc. Inequalities Econ. Growth 2020, 138–155. [Google Scholar] [CrossRef]
- Tran, Q.-P.; Nguyen, V.-N.; Huang, S.-C. Drilling Process on CFRP: Multi-Criteria Decision-Making with Entropy Weight Using Grey-TOPSIS. Method. Appl. Sci. 2020, 10, 7207. [Google Scholar] [CrossRef]
- Hellwig, Z. Zastosowanie metody taksonomicznej do typologicznego podziału krajów ze względu na poziom ich rozwoju oraz zasoby i strukturę wykwalifikowanych kadr. Prz. Stat. 1968, 4, 307–326. [Google Scholar]
- Wang, Z.; He, X.; Zhang, C.; Xu, J.; Wang, Y. Evaluation of Geological and Ecological Bearing Capacity and Spatial Pattern along Du-Wen Road Based on the Analytic Hierarchy Process (AHP) and the Technique for Order of Preference by Similarity to an Ideal Solution (TOPSIS) Method. ISPRS Int. J. Geo-Inf. 2020, 9, 237. [Google Scholar] [CrossRef]
- You, P.; Guo, S.; Zhao, H.; Zhao, H. Operation Performance Evaluation of Power Grid Enterprise Using a Hybrid BWM-TOPSIS Method. Sustainability 2017, 9, 2329. [Google Scholar] [CrossRef] [Green Version]
- Bieniasz, A.; Gołaś, Z.; Łuczak, A. Zróżnicowanie kondycji finansowej gospodarstw rolnych wyspecjalizowanych w chowie owiec i kóz w krajach Unii Europejskiej. Rocz. Ekon. Rol. I Rozw. Obsz. Wiej. 2013, 100, 1. [Google Scholar]
- Sitorus, A.V.Y.; Arsani, A.M. A comparative study of inter-provincial inclusive economic growth in Indonesia 2010–2015 with approach methods of ADB, WEF, and UNDP. J. Perenc. Pembang. Indones. J. Dev. Plan. 2018, 2, 64–77. [Google Scholar]
- Li, L.; Zeng, Y.; He, Y.; Qin, Q.; Wang, J.; Fu, C. Developing Village-Based Green Economy in an Endogenous Way: A Case Study from China. Int. J. Environ. Res. Public Health 2022, 19, 7580. [Google Scholar] [CrossRef]
- Georgeson, L.; Maslin, M.; Poessinouw, M. The global green economy: A review of concepts, definitions, measurement methodologies and their interactions. Geo Geogr. Environ. 2017, 4, e00036. [Google Scholar] [CrossRef]
- Brand, U. Green economy—The next oxymoron? No lessons learned from failures of implementing sustainable development. GAIA—Ecol. Perspect. Sci. Soc. 2012, 21, 28–32. [Google Scholar] [CrossRef] [Green Version]
- Hickel, J. Less Is More: How Degrowth Will Save the World (Mniej Znaczy Lepiej. O Tym Jak Odejście od Wzrostu Gospodarczego Ocali Świat); Listwan, J.P., Translator; Wyd: Karakter, Poland, 2021. [Google Scholar]
- Gryshova, I.; Kyzym, M.; Khaustova, V.; Korneev, V.; Kramarev, H.V. Assessment of the Indus-trial Structure and its Influence on Sustainable Economic Development and Quality of Life of the Population of Different World Countries. Sustainability 2020, 12, 2072. [Google Scholar] [CrossRef] [Green Version]
- Tapia-Fonllem, C.; Corral-Verdugo, V.; Fraijo-Sing, B. Sustainable Behavior and Quality of Life. In Handbook of Environmental Psychology and Quality of Life Research. International Handbooks of Quality-of-Life; Fleury-Bahi, G., Pol, E., Navarro, O., Eds.; Springer: Cham, Switzerland, 2017. [Google Scholar]
- Vukovic, N.; Pobedinsky, V.; Mityagin, S.; Drozhzhin Mingaleva, Z. A Study on Green Economy Indicators and Modeling: Russian Context. Sustainability 2019, 11, 462. [Google Scholar] [CrossRef] [Green Version]
- Godlewska, J.; Sidorczuk-Pietraszko, E. Taxonomic Assessment of Transition to the Green Economy in Polish Regions. Sustainability 2019, 11, 5098. [Google Scholar] [CrossRef] [Green Version]
- Ciechelska, A. Recykling odpadów komunalnych jako miernik realizacji gospodarki o obiegu zamkniętym na przykładzie Polski i Słowenii. Res. Pa-Pers Wrocław Univ. Econ. 2017, 491, 63–74. [Google Scholar]
- Pearce, D.; Markandya, A.; Barbier, E.B. Blueprint for a Green Economy; Pearce Report; Earthscan: London, UK, 1989. [Google Scholar]
- Pakulska, J. Środowisko przyrodnicze w rozwoju gospodarczym. Pr. I Mater. Inst. Rozw. Gospod. SGH 2002, 72, 295–308. [Google Scholar]
- Pawul, M.; Sobczyk, W. Edukacja ekologiczna w zakresie gospodarki odpadami jako narzędzie realizacji zrównoważonego rozwoju. Probl. Ekorozw.—Probl. Sustain. Dev. 2011, 6, 147–156. [Google Scholar]
- Dyrektywa Parlamentu Europejskiego i Rady 2008/98/WE z dnia 19 listopada 2008 r. w Sprawie Odpadów Oraz Uchylająca Niektóre Dyrektywy. Available online: https://eur-lex.europa.eu/legal-content/PL/TXT/?uri=CELEX:32008L0098 (accessed on 19 November 2008).
- Eriksson, O. at all, Municipal solid waste management from a systems perspective. J. Clean. Prod. 2005, 13, 241–252. [Google Scholar] [CrossRef] [Green Version]
- Zhang, Y. How Economic Performance of OECD economies influences through Green Finance and Renewable Energy Investment Resources? Resour. Policy 2022, 79, 102925. [Google Scholar] [CrossRef]
- Bárcena-Ruiz, J.C.; Casado-Izaga, F.J. Regulation of waste management under spatial competition. J. Clean. Prod. 2015, 92, 216–222. [Google Scholar] [CrossRef] [Green Version]
- Slater, R.; Frederickson, J.; Thomas, C.; Wield, D.; Potter, S. A critical evaluation of partnerships in municipal waste management in England Resources. Conserv. Recycl. 2006, 15, 643–664. [Google Scholar]
- Di Foggia, G.; Beccarello, M. An Overview of Packaging Waste Models in Some European Countries. Recycling 2022, 7, 38. [Google Scholar] [CrossRef]
- Bogusz, M.; Matysik-Pejas, R.; Krasnodębski, A.; Dziekański, P. The Concept of Zero Waste in the Context of Supporting Environmental Protection by Consumers. Energies 2021, 14, 5964. [Google Scholar] [CrossRef]


| Stage | Description of Stage | |
|---|---|---|
| stage 1 | A set of tested, multidimensional objects | |
| Y = {Y 1,… Y n} | (1) | |
| where n is the number of test objects. A set of diagnostic variables | ||
| X = {X 1,… X m} | (2) | |
| where m is the number of studied variables, assuming that m ≥ n. Observation matrix (selected diagnostic variables) Xij: | ||
| , | (3) | |
| where: —denotes the values of the j-th variable for the i-th object, matrix of dnaych objects, i—object number (i = 1, 2,..., n), j—variable number (j = 1, 2,..., m) [47]. | ||
| stage 2 | Determination of the coefficient of variation, written by the formula: | |
| (4) | ||
| where, V i—coefficient of variation for the i-th variable, S i—standard deviation for the i-th variable, is the arithmetic mean of the i-th variable. From the set of variables, features meeting the inequality (critical value of the coefficient of variation = 0.10 were eliminated. Inverted matrix and correlation coefficient analysis, threshold value r* = 0.75 [48,49]. The selection of variables was also based on a factor analysis performed in the Statistca program. | ||
| Nr | Diagnostic Variables | Units | S/D |
|---|---|---|---|
| waste management | |||
| X1 | Division 900—Municipal Management and Environmental Protection | pln/pc | S |
| X2 | Total waste generated during the year per 1000 inhabitants | thousand t | D |
| X3 | recovered per 1000 inhabitants | thousand t | S |
| X4 | neutralized together per 1000 inhabitants | thousand t | S |
| X5 | Waste previously stored (accumulated) in own facilities in total per 1 km2 | thousand t | D |
| X6 | share of recovered waste in the amount of waste generated during the year | % | S |
| X7 | total per capita/Mixed waste collected during the year in total | kg | D |
| X8 | Landfills/active landfills where municipal waste is neutralized—as of 31 December | pcs | D |
| X9 | Non-reclaimed waste storage area per 1 km2 | ha | D |
| X10 | area of active landfills where municipal waste is neutralized—as of 31 December | ha | S |
| X11 | wild landfill area per 100 km2 in total | pcs | D |
| X12 | municipal waste collected during the liquidation of illegal landfills—during the year | vol | D |
| Green economy | |||
| X13 | Expenses in Division 851—Health care | pln/pc | S |
| X14 | Division 900—Municipal Management and Environmental Protection | pln/pc | S |
| X15 | electricity consumption per capita/Electricity in households in cities | kWh | D |
| X16 | electricity consumption per capita/Electricity in households by location of the recipient in the countryside | kWh | D |
| X17 | waterworks Users of installations in% of the total population | % | S |
| X18 | sewers | % | S |
| X19 | Distribution network per 100 km2… water supply network | km | S |
| X20 | sewage network | km | S |
| X21 | gas network | km | S |
| X22 | Yearly sales of heat energy by location, total residential buildings offices and institutions (per 1 inhabitant) | GJ | S |
| X23 | The area of forest land in the total area | % | S |
| X24 | water consumption per capita/Water consumption for the needs of the national economy and population during the year in total | m3 | D |
| X25 | share of industry in total water consumption | % | D |
| X26 | total treated to total discharge Waste water treated during the year | % | S |
| X27 | discharged per capita/Sewage treated during the year | dam3 | D |
| X28 | Population using sewage treatment plants in % of the total population | % | S |
| X29 | share of recovered waste in the amount of waste generated during the year | % | S |
| X30 | total per capita/Total mixed waste collected during the year | kg | D |
| X31 | Municipal sewage treated per 100 km2 | dam3 | D |
| X32 | Share of legally protected areas in the total area | % | S |
| Stage | Description of Stage | |
|---|---|---|
| stage 3 | The normalization of diagnostic variables was performed depending on their types of variables, X j ∈ S according to the formula: | |
| , Z ij = 0 ⇔ x ij = min i x ij; Z ij = 1 ⇔ x ij = max i x ij. | (5) | |
| for the variable X j ∈ D, | ||
| , Z ij =0 ⇔ x ij = max i x ij; Z ij =1 ⇔ x ij = min i x ij, | (6) | |
|
where: Z ij ∈ [0; 1], max i x ij ≠ min i x ij, max i x ij > min i x ij, S-stimulant, D-destimulant, i = 1, 2… n (number of selected variables for analysis); j = 1, 2… m (number of random values of the variable), maxxij—the maximum value of the j-th variable, minxij—the minimum value of the j-th variable, x ij—means the value of the j-th variable for the th object [48,50]. Value matrix of unitary features : | ||
| , | (7) | |
| where Zij ∈ { S} ∪ {D}—unitized value of j-th variables for i-th object; i = 1,..., m, j = 1,..., k, are the normalized values of the jth diagnostic variable for this object. | ||
| q Green Economy | q Waste Management | ||||||
|---|---|---|---|---|---|---|---|
| 2010–2015 | |||||||
| Bielsko district | Kozienice district | Wolow district | Nowy Sącz district | Bydgoszcz district | Polkowice district | ||
| Bielsko district | 0 | 0.16 | 0.13 | Nowy Sącz district | 0 | 0.08 | 0.04 |
| Kozienice district | 0.16 | 0 | 0.06 | Bydgoszcz district | 0.08 | 0 | 0.06 |
| Wolow district | 0.13 | 0.06 | 0 | Polkowice district | 0.04 | 0.06 | 0 |
| 2015–2019 | |||||||
| Bielsko district | 0 | 0.17 | 0.18 | Nowosądecki district | 0 | 0.11 | 0.17 |
| Kozienice district | 0.17 | 0 | 0.01 | Bydgoszcz district | 0.11 | 0 | 0.09 |
| Wołowski district | 0.18 | 0.01 | 0 | Polkowice district | 0.17 | 0.09 | 0 |
| 2019–2020 | |||||||
| Bielsko district | 0 | 0.18 | 0.18 | Nowosądecki district | 0 | 0.18 | 0.23 |
| Kozienice district | 0.18 | 0 | 0.01 | Bydgoszcz district | 0.18 | 0 | 0.08 |
| Wołowski district | 0.18 | 0.01 | 0 | Polkowice district | 0.23 | 0.08 | 0 |
| q Green Economy | q Waste Management | |||||||
|---|---|---|---|---|---|---|---|---|
| 2010 | 2015 | 2019 | 2020 | 2010 | 2015 | 2019 | 2020 | |
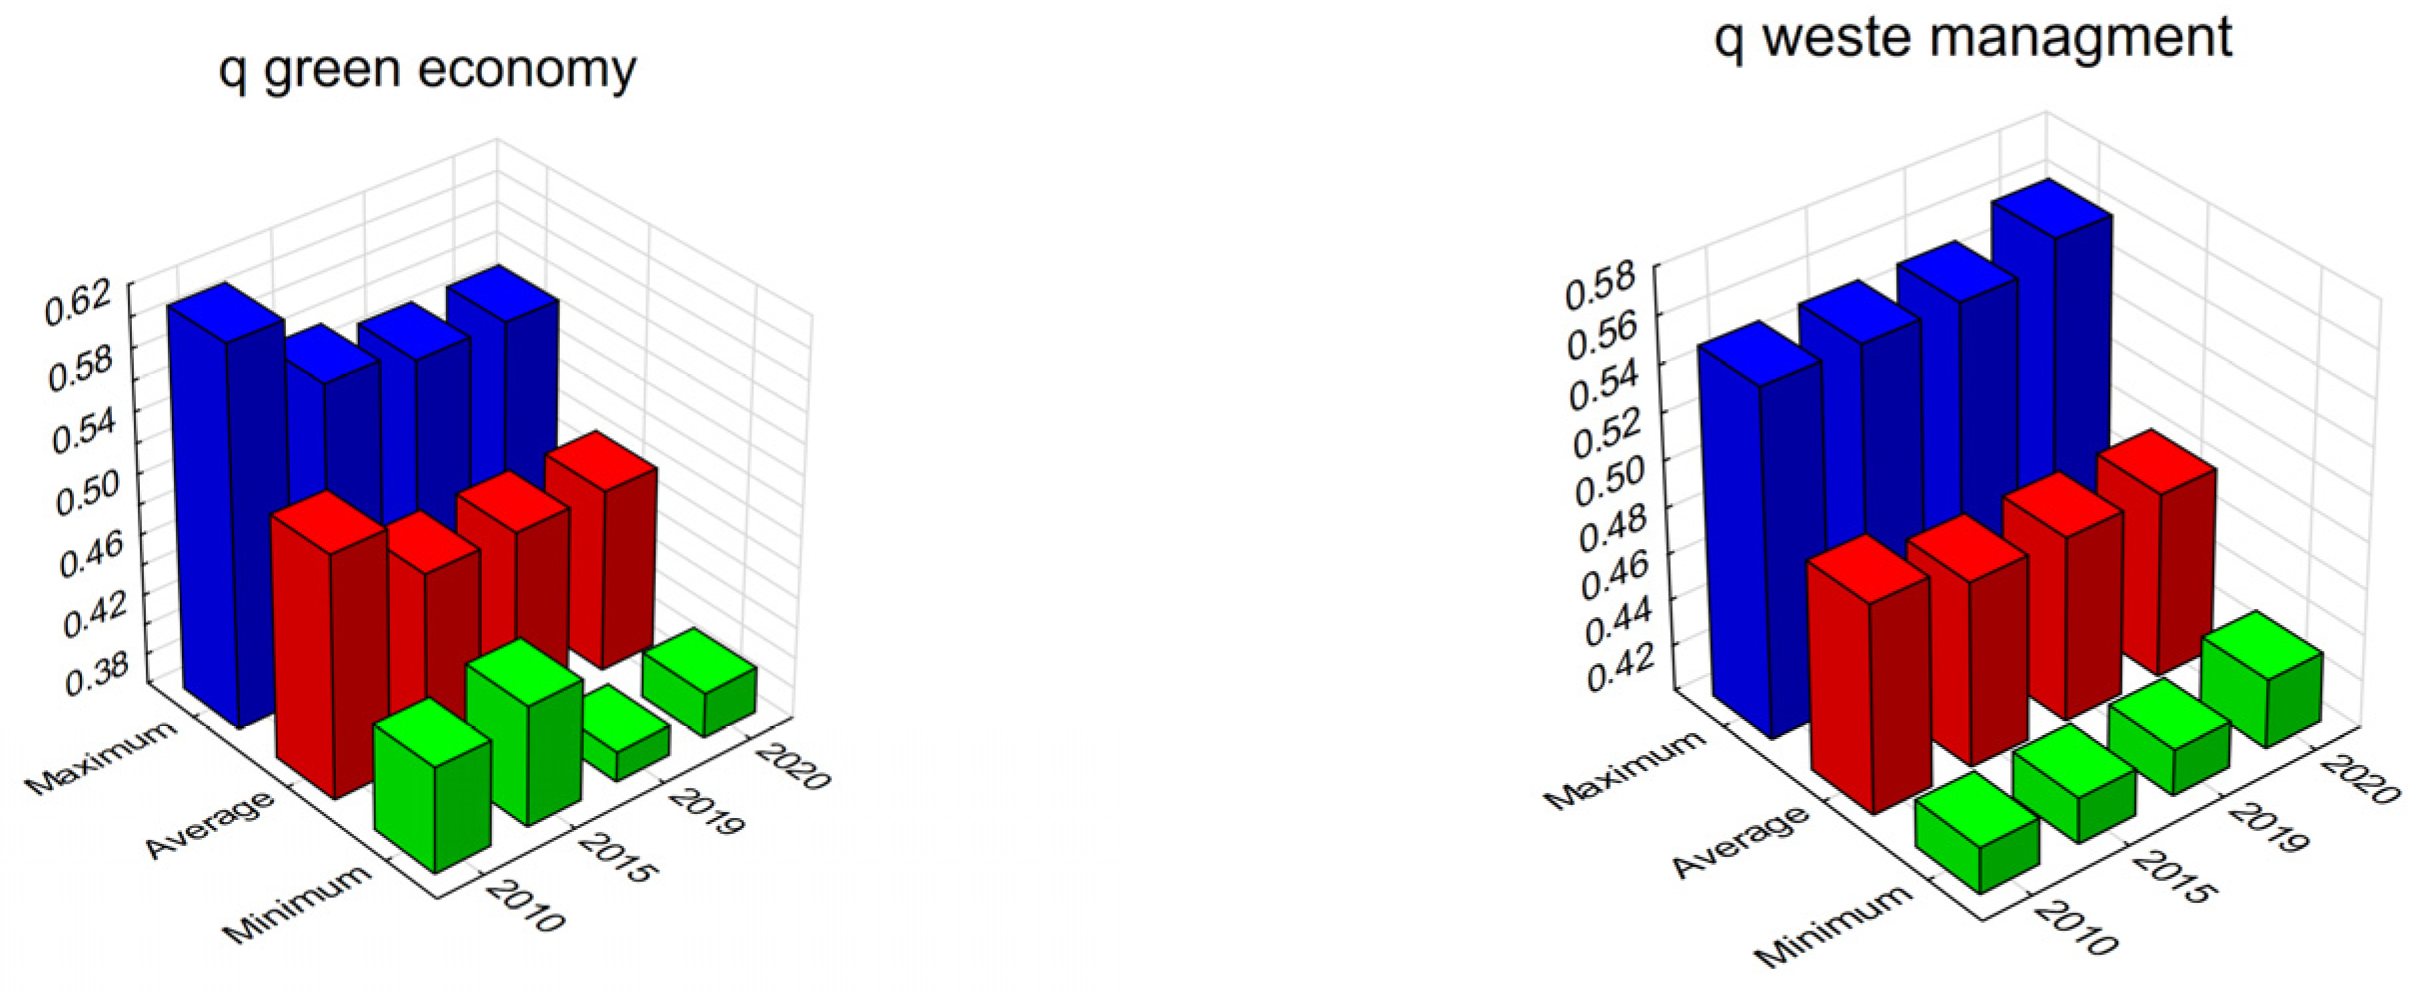
| Mean | 0.52 | 0.48 | 0.48 | 0.48 | 0.49 | 0.48 | 0.48 | 0.48 |
| Median | 0.53 | 0.48 | 0.48 | 0.48 | 0.49 | 0.48 | 0.48 | 0.48 |
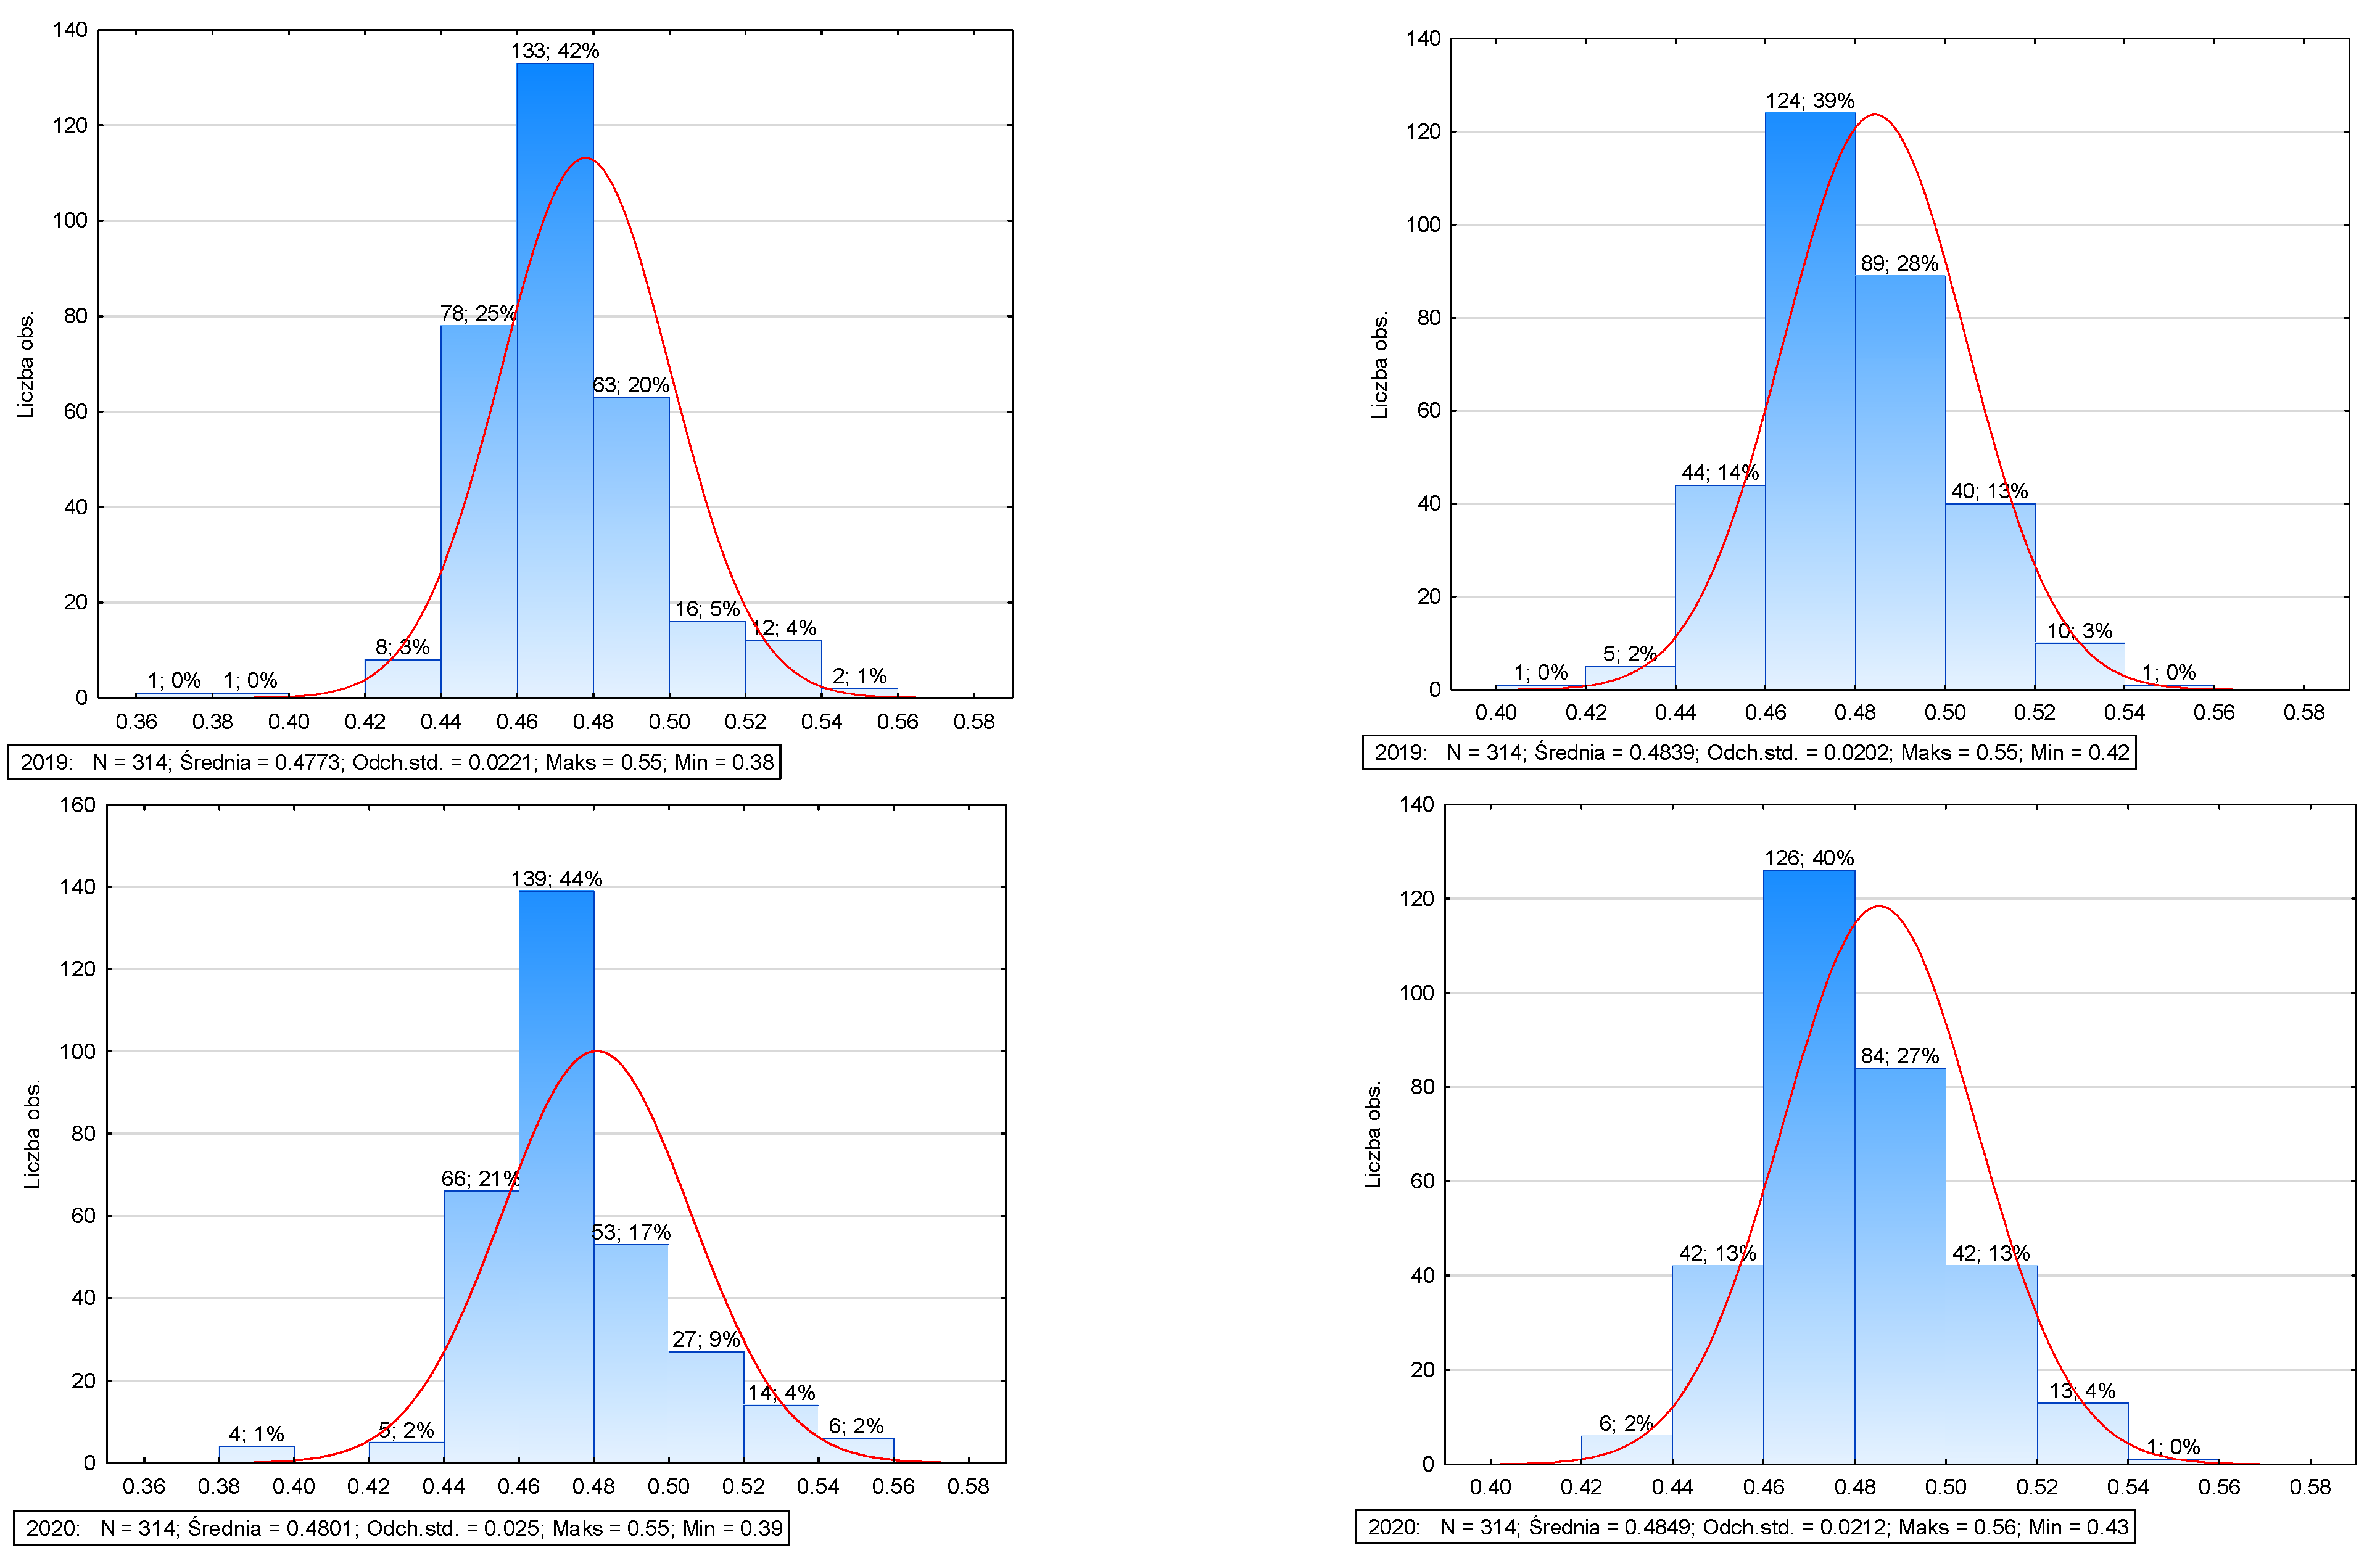
| Minimum | 0.43 | 0.44 | 0.38 | 0.39 | 0.42 | 0.42 | 0.42 | 0.43 |
| Maximum | 0.61 | 0.56 | 0.55 | 0.55 | 0.55 | 0.55 | 0.55 | 0.56 |
| Lower (Quartile) | 0.51 | 0.47 | 0.46 | 0.47 | 0.48 | 0.47 | 0.47 | 0.47 |
| Upper (Quart.) | 0.54 | 0.49 | 0.49 | 0.49 | 0.5 | 0.5 | 0.5 | 0.5 |
| Gap | 0.18 | 0.12 | 0.17 | 0.16 | 0.13 | 0.13 | 0.13 | 0.13 |
| Quartile. (Gap) | 0.03 | 0.02 | 0.03 | 0.02 | 0.02 | 0.03 | 0.03 | 0.03 |
| SD | 0.03 | 0.02 | 0.02 | 0.03 | 0.02 | 0.02 | 0.02 | 0.02 |
| Coefficient of change | 5.18 | 4.91 | 4.64 | 5.21 | 3.76 | 4.19 | 4.18 | 4.36 |
| Skewness | −0.87 | 0.81 | 0.28 | 0.32 | -0.32 | 0.37 | 0.31 | 0.41 |
| Kurtosis | 0.85 | 0.33 | 2.33 | 1.86 | 1.04 | 0.39 | 0.26 | 0.26 |
| Diagnostic Variable/Specification | q Green Economy | q Waste Management |
|---|---|---|
| q waste management | 0.474 | 1.000 |
| recovered per 1 km2 | 0.188 | 0.230 |
| share of recovered waste in the amount of waste generated during the year | 0.496 | 0.757 |
| total per capita/Total mixed waste collected during the year | −0.087 | −0.425 |
| area of illegal dumps per 100 km2 of total area | −0.230 | −0.287 |
| q green economy | 1.000 | 0.474 |
| expenditure in chapter 90003—Clearing towns and villages | 0.081 | −0.243 |
| expenses in chapter 90004—Maintenance of green areas in cities and communes | 0.029 | −0.170 |
| expenses in chapter 90015—Lighting of streets, squares and roads | −0.112 | −0.120 |
| electricity consumption per capita/Electricity in households by location of the recipient in the countryside | −0.196 | −0.203 |
| waterworks Users of installations in% of the total population | −0.039 | −0.162 |
| sewers | 0.396 | −0.146 |
| gas | 0.381 | −0.094 |
| Distribution network per 100 km2… water supply network | 0.254 | −0.005 |
| sewage network | 0.543 | 0.012 |
| gas network | 0.470 | 0.018 |
| The area of forest land in the total area | 0.104 | 0.198 |
| water consumption per capita/Water consumption for the needs of the national economy and population during the year in total | −0.208 | −0.024 |
| industry share in total water consumption | −0.269 | −0.089 |
| total discharged sewage treated during the year/per 1 km2 | 0.330 | −0.133 |
| Population using sewage treatment plants as a percentage of the total population | 0.413 | −0.133 |
| share of recovered waste in the amount of waste generated during the year | 0.496 | 0.757 |
| total per capita/Total mixed waste collected during the year | −0.087 | −0.425 |
| Municipal sewage treated per 100 km2 | 0.330 | −0.133 |
| existing area—as of 31 December | −0.248 | −0.249 |
| Arithmetic mean of the dependent variable | 0.484904 | Standard deviation of dependent variable | 0.021153 |
| Sum of squares residuals | 0.026585 | Residual standard error | 0.009367 |
| Coefficient of determination R-square | 0.810173 | Adjusted R-square | 0.803908 |
| F(10, 303) | 129.3191 | p-values for F-test | 4.88 × 10³ |
| Logarithm of credibility | 1026.613 | Inrom. Crit. Akaike’a | −2031.226 |
| Crit. Bayes. Schwarza | −1989.982 | Crit. Hannana-Quinna | −2014.746 |
Disclaimer/Publisher’s Note: The statements, opinions and data contained in all publications are solely those of the individual author(s) and contributor(s) and not of MDPI and/or the editor(s). MDPI and/or the editor(s) disclaim responsibility for any injury to people or property resulting from any ideas, methods, instructions or products referred to in the content. |
© 2023 by the authors. Licensee MDPI, Basel, Switzerland. This article is an open access article distributed under the terms and conditions of the Creative Commons Attribution (CC BY) license (https://creativecommons.org/licenses/by/4.0/).
Share and Cite
Misztal, P.; Dziekański, P. Green Economy and Waste Management as Determinants of Modeling Green Capital of Districts in Poland in 2010–2020. Int. J. Environ. Res. Public Health 2023, 20, 2112. https://doi.org/10.3390/ijerph20032112
Misztal P, Dziekański P. Green Economy and Waste Management as Determinants of Modeling Green Capital of Districts in Poland in 2010–2020. International Journal of Environmental Research and Public Health. 2023; 20(3):2112. https://doi.org/10.3390/ijerph20032112
Chicago/Turabian StyleMisztal, Piotr, and Paweł Dziekański. 2023. "Green Economy and Waste Management as Determinants of Modeling Green Capital of Districts in Poland in 2010–2020" International Journal of Environmental Research and Public Health 20, no. 3: 2112. https://doi.org/10.3390/ijerph20032112