
Social and Metabolic Determinants of Prevalent Hypertension in Men and Women: A Cluster Analysis from a Population-Based Study

 , , , , , , and
Abstract
:1. Introduction
2. Materials and Methods
Statistical Analysis
3. Results
4. Discussion
5. Conclusions
Author Contributions
Funding
Institutional Review Board Statement
Informed Consent Statement
Data Availability Statement
Acknowledgments
Conflicts of Interest
References
- Zhou, B.; Perel, P.; Mensah, G.A.; Ezzati, M. Global epidemiology, health burden and effective interventions for elevated blood pressure and hypertension. Nat. Rev. Cardiol. 2021, 18, 785–802. [Google Scholar] [CrossRef]
- Kontis, V.; Mathers, C.D.; Rehm, J.; Stevens, G.A.; Shield, K.D.; Bonita, R.; Riley, L.M.; Poznyak, V.; Beaglehole, R.; Ezzati, M. Contribution of six risk factors to achieving the 25×25 non-communicable disease mortality reduction target: A modelling study. Lancet 2014, 384, 427–437. [Google Scholar] [CrossRef]
- Global Burden of Disease Collaborative Network, Global Burden of Disease Study 2019 (GBD 2019) Results (2020, Institute for Health Metrics and Evaluation—IHME). Available online: https://vizhub.healthdata.org/gbd-results/ (accessed on 15 November 2022).
- Verdecchia, P.; Angeli, F.; Reboldi, G. Hypertension and Atrial Fibrillation: Doubts and Certainties From Basic and Clinical Studies. Circ. Res. 2018, 122, 352–368. [Google Scholar] [CrossRef]
- UN General Assembly, Transforming Our World: The 2030 Agenda for Sustainable Development, 21 October 2015, A/RES/70/1. Available online: https://www.refworld.org/docid/57b6e3e44.html (accessed on 21 December 2022).
- NCD Risk Factor Collaboration (NCD-RisC). Worldwide trends in hypertension prevalence and progress in treatment and control from 1990 to 2019: A pooled analysis of 1201 population-representative studies with 104 million participants. Lancet 2021, 398, 957–980. [Google Scholar] [CrossRef] [PubMed]
- Schillaci, G.; Pirro, M.; Vaudo, G.; Gemelli, F.; Marchesi, S.; Porcellati, C.; Mannarino, E. Prognostic value of the metabolic syndrome in essential hypertension. J. Am. Coll. Cardiol. 2004, 43, 1817–1822. [Google Scholar] [CrossRef] [Green Version]
- Nakagomi, A.; Yasufuku, Y.; Ueno, T.; Kondo, K. Social determinants of hypertension in high-income countries: A narrative literature review and future directions. Hypertens. Res. 2022, 45, 1575–1581. [Google Scholar] [CrossRef]
- Echouffo-Tcheugui, J.B.; Batty, G.D.; Kivimäki, M.; Kengne, A.P. Risk models to predict hypertension: A systematic review. PloS ONE 2013, 8, e67370. [Google Scholar] [CrossRef] [PubMed] [Green Version]
- Sun, D.; Liu, J.; Xiao, L.; Liu, Y.; Wang, Z.; Li, C.; Jin, Y.; Zhao, Q.; Wen, S. Recent development of risk-prediction models for incident hypertension: An updated systematic review. PLoS ONE 2017, 12, e0187240. [Google Scholar] [CrossRef] [Green Version]
- Ahmad, T.; Pencina, M.J.; Schulte, P.J.; O’Brien, E.; Whellan, D.; Piña, I.L.; Kitzman, D.W.; Lee, K.L.; O’Connor, C.M.; Felker, G.M. Clinical Implications of Chronic Heart Failure Phenotypes Defined by Cluster Analysis. J. Am. Coll. Cardiol. 2014, 64, 1765–1774. [Google Scholar] [CrossRef] [Green Version]
- Windgassen, S.; Moss-Morris, R.; Goldsmith, K.; Chalder, T. The importance of cluster analysis for enhancing clinical practice: An example from irritable bowel syndrome. J. Ment. Health. 2018, 27, 94–96. [Google Scholar] [CrossRef] [PubMed]
- Cojocaru, C.; Vîjîiac, A.-E.; Gheorghe-Fronea, O.; Mohaiu, T.; Itu, L.; Dorobanțu, M. Nine-Year Trends in Atrial Fibrillation Prevalence among Romanian Adult Hypertensives: A Post-Hoc Analysis of SEPHAR II-IV Surveys. Int. J. Environ. Res. Public Health 2022, 19, 9250. [Google Scholar] [CrossRef]
- Dorobantu, M.; Vijiiac, A.E.; Fronea, O.F.G. The SEPHAR-FUp 2020 Project (Study for the Evaluation of Prevalence of Hypertension and Cardiovascular Risk in Romania—Follow-up 2020). J. Hypertens. Res. 2021, 7, 29–33. [Google Scholar]
- Pop, C.; Gheorghe Fronea, O.F.; Branea, I.A.; Itu, L.M.; Darabont, R.; Parepa, I.; Benedek, T.; Dorobantu, M. Prevalence and Predictors of Renal Disease in a National Representative Sample of the Romanian Adult Population: Data from the SEPHAR IV Survey. Diagnostics 2022, 12, 3199. [Google Scholar] [CrossRef]
- Unger, T.; Borghi, C.; Charchar, F.; Khan, N.A.; Poulter, N.R.; Prabhakaran, D.; Ramirez, A.; Schlaich, M.; Stergiou, G.S.; Tomaszewski, M.; et al. 2020 International Society of Hypertension Global Hypertension Practice Guidelines. Hypertension 2020, 75, 1334–1357. [Google Scholar] [CrossRef] [PubMed]
- Yang, D.; Nie, Z.; Liao, L.; Zhang, S.; Zhou, H.; Sun, X.; Zhong, X.B.; Du, Z.; Zhuang, X.D.; Liao, X. Phenomapping of subgroups in hypertensive patients using unsupervised data-driven cluster analysis: An exploratory study of the SPRINT trial. Eur. J. Prev. Card. 2019, 26, 1693–1706. [Google Scholar] [CrossRef]
- Gelbard, R.; Goldman, O.; Spiegler, I. Investigating diversity of clustering methods: An empirical comparison. Data Knowl. Eng. 2007, 63, 155–166. [Google Scholar] [CrossRef]
- Kent, P.; Jensen, R.K.; Kongsted, A. A comparison of three clustering methods for finding subgroups in MRI, SMS or clinical data: SPSS twostep cluster analysis, latent Gold and SNOB. BMC Med. Res. Methodol. 2014, 14, 113. [Google Scholar] [CrossRef] [Green Version]
- Chiu, T.; Fang, D.; Chen, J.; Wang, Y.; Jeris, C. A robust and scalable clustering algorithm for mixed type attributes in large database environment. In Proceedings of the Seventh ACM SIGKDD International Conference on Knowledge Discovery and Data Mining—KDD ’01, New York, NY, USA, 26–29 August 2001; pp. 263–268. [Google Scholar]
- Carey, R.M.; Muntner, P.; Bosworth, H.B.; Whelton, P.K. Prevention and Control of Hypertension: JACC Health Promotion Series. J. Am. Coll. Cardiol. 2018, 72, 1278–1293. [Google Scholar] [CrossRef]
- Whelton, P.K.; Carey, R.M.; Aronow, W.S.; Casey, D.E.; Collins, K.J.; Dennison Himmelfarb, C.; DePalma, S.M.; Gidding, S.; Jamerson, K.A.; Jones, D.W.; et al. 2017 ACC/AHA/AAPA/ABC/ACPM/AGS/APhA/ASH/ASPC/NMA/PCNA Guideline for the Prevention, Detection, Evaluation, and Management of High Blood Pressure in Adults. J. Am. Coll. Cardiol. 2018, 71, e127–e248. [Google Scholar] [CrossRef]
- Williams, B.; Mancia, G.; Spiering, W.; Agabiti Rosei, E.; Azizi, M.; Burnier, M.; Clement, D.L.; Coca, A.; de Simone, G.; Dominiczak, A.; et al. 2018 ESC/ESH Guidelines for the management of arterial hypertension of the European Society of Cardiology and the European Society of Hypertension: The Task Force for the management of arterial hypertension of the European Society of Cardiology and the European Society of Hypertension. Eur. Heart J. 2018, 39, 3021–3104. [Google Scholar] [CrossRef] [Green Version]
- Dorobantu, M.; Tautu, O.F.; Dimulescu, D.; Sinescu, C.; Gusbeth-Tatomir, P.; Arsenescu-Georgescu, C.; Mitu, F.; Lighezan, D.; Pop, C.; Babes, K.; et al. Perspectives on hypertension’s prevalence, treatment and control in a high cardiovascular risk East European country: Data from the SEPHAR III survey. J. Hypertens. 2018, 36, 690–700. [Google Scholar] [CrossRef] [PubMed]
- Jayedi, A.; Rashidy-Pour, A.; Khorshidi, M.; Shab-Bidar, S. Body mass index, abdominal adiposity, weight gain and risk of developing hypertension: A systematic review and dose-response meta-analysis of more than 2.3 million participants. Obes. Rev. 2018, 19, 654–667. [Google Scholar] [CrossRef] [PubMed]
- Bala, C.; Gheorghe-Fronea, O.; Pop, D.; Pop, C.; Caloian, B.; Comsa, H.; Bozan, C.; Matei, C.; Dorobantu, M. The Association Between Six Surrogate Insulin Resistance Indexes and Hypertension: A Population-Based Study. Metab. Syndr. Relat. Disord. 2019, 17, 328–333. [Google Scholar] [CrossRef]
- Vaura, F.C.; Salomaa, V.V.; Kantola, I.M.; Kaaja, R.; Lahti, L.; Niiranen, T.J. Unsupervised hierarchical clustering identifies a metabolically challenged subgroup of hypertensive individuals. J. Clin. Hypertens. 2020, 22, 1546–1553. [Google Scholar] [CrossRef] [PubMed]
- Tsoi, K.K.F.; Chan, N.B.; Yiu, K.K.L.; Poon, S.K.S.; Lin, B.; Ho, K. Machine Learning Clustering for Blood Pressure Variability Applied to Systolic Blood Pressure Intervention Trial (SPRINT) and the Hong Kong Community Cohort. Hypertension 2020, 76, 569–576. [Google Scholar] [CrossRef] [PubMed]
- Connelly, P.J.; Currie, G.; Delles, C. Sex Differences in the Prevalence, Outcomes and Management of Hypertension. Curr. Hypertens. Rep. 2022, 24, 185–192. [Google Scholar] [CrossRef]
- Leng, B.; Jin, Y.; Li, G.; Chen, L.; Jin, N. Socioeconomic status and hypertension: A meta-analysis. J. Hypertens. 2015, 33, 221–229. [Google Scholar] [CrossRef]
- Commodore-Mensah, Y.; Turkson-Ocran, R.A.; Foti, K.; Cooper, L.A.; Himmelfarb, C.D. Associations Between Social Determinants and Hypertension, Stage 2 Hypertension, and Controlled Blood Pressure Among Men and Women in the United States. Am. J. Hypertens. 2021, 34, 707–717. [Google Scholar] [CrossRef]
- Rohla, M.; Haberfeld, H.; Tscharre, M.; Huber, K.; Weiss, T.W. Awareness, treatment, and control of hypertension in Austria: A multicentre cross-sectional study. J. Hypertens. 2016, 34, 1432–1440. [Google Scholar] [CrossRef]
- de Gaudemaris, R.; Lang, T.; Chatellier, G.; Larabi, L.; Lauwers-Cancès, V.; Maître, A.; Diène, E. Socioeconomic inequalities in hypertension prevalence and care: The IHPAF Study. Hypertension 2002, 39, 1119–1125. [Google Scholar] [CrossRef]
- Gao, Y.; Chen, G.; Tian, H.; Lin, L.; Lu, J.; Weng, J.; Jia, W.; Ji, L.; Xiao, J.; Zhou, Z.; et al. China National Diabetes and Metabolic Disorders Study Group Prevalence of hypertension in China: A cross-sectional study. PLoS ONE 2013, 8, e65938. [Google Scholar] [CrossRef]
- Kuehn, B.M. Hypertension Rates in Rural Areas Outpace Those in Urban Locales. JAMA 2020, 323, 2454. [Google Scholar] [CrossRef]
- Roman, G.; Bala, C.; Creteanu, G.; Graur, M.; Morosanu, M.; Popa, A.; Pircalaboiu, L.; Radulian, G.; Timar, R.; Achimas Cadariu, A. Obesity and Health-Related Lifestyle Factors in the General Population in Romania: A Cross Sectional Study. Acta Endocrinol. 2015, 11, 64–72. [Google Scholar] [CrossRef]
- Institutul National de Statistica. Coordonate Ale Nivelului de Train in Romania. Veniturile si Consumul Populatiei in Anul 2021. Available online: https://insse.ro/cms/sites/default/files/field/publicatii/coordonate_ale_nivelului_de_trai_in_romania_2021.pdf (accessed on 12 January 2023).
- Roman, G.; Rusu, A.; Graur, M.; Creteanu, G.; Morosanu, M.; Radulian, G.; Popa, A.; Timar, R.; Pircalaboiu, L.; Bala, C. Dietary patterns and their association with obesity: A cross-sectional study. Acta Endocrinol. 2019, 5, 86–95. [Google Scholar] [CrossRef] [PubMed]
- Blüher, M. Metabolically Healthy Obesity. Endocr. Rev. 2020, 41, bnaa004. [Google Scholar] [CrossRef] [Green Version]
- Tsatsoulis, A.; Paschou, S.A. Metabolically Healthy Obesity: Criteria, Epidemiology, Controversies, and Consequences. Curr. Obes. Rep. 2020, 9, 109–120. [Google Scholar] [CrossRef]
- Yang, Y.C.; Li, T.; Ji, Y. Impact of social integration on metabolic functions: Evidence from a nationally representative longitudinal study of US older adults. BMC Public Health 2013, 13, 1210. [Google Scholar] [CrossRef] [PubMed] [Green Version]
- Li, Y.Y.; Cao, J.; Li, J.L.; Zhu, J.Y.; Li, Y.M.; Wang, D.P.; Liu, H.; Yang, H.L.; He, Y.F.; Hu, L.Y.; et al. Screening high-risk population of persistent postpartum hypertension in women with preeclampsia using latent class cluster analysis. BMC Pregnancy Childbirth 2022, 22, 687. [Google Scholar] [CrossRef] [PubMed]


| Total N = 798 | Men N = 336 | Women N = 462 | p-Value | |
|---|---|---|---|---|
| Age, years | 52.1 (37.5; 65.3) | 51.2 (33.8; 65.7) | 52.5 (39.0; 64.8) | 0.179 |
| Urban residence, n (%) | 501 (62.8%) | 222 (66.1%) | 279 (60.4%) | 0.103 |
| Education, n (%) No studies Primary school Secondary school University | 2 (0.3%) 59 (7.4%) 388 (48.6%) 349 (43.7%) | 1 (0.3%) 19 (5.7%) 153 (45.5%) 163 (48.5%) | 1 (0.2%) 40 (8.7%) 235 (50.9%) 186 (40.3%) | 0.086 |
| Marital status, n (%) Unmarried Married Factual union Divorced Widow | 182 (22.8%) 482 (60.4%) 49 (6.1%) 61 (7.6%) 24 (3.0%) | 90 (28.8%) 204 (60.7%) 16 (4.8%) 12 (3.6%) 14 (4.2%) | 92 (19.9%) 278 (60.2%) 33 (7.1%) 49 (10.6%) 10 (2.2%) | <0.001 |
| Health insurance, n (%) | 758 (95.0%) | 326 (97.0%) | 432 (93.5%) | 0.032 |
| SBP, mmHg | 127.0 (114.0; 139.0) | 133.0 (123.0; 142.0) | 122.0 (110.0; 134.0) | <0.001 |
| DBP, mmHg | 81.0 (74.0; 89.0) | 83.0 (76.0; 91.0) | 79.0 (72.0; 88.0) | <0.001 |
| Hypertension, n (%) | 338 (42.4%) | 154 (45.8%) | 184 (39.8%) | 0.095 |
| Waist, cm | 97.9 (85.0; 108.0) | 103.0 (92.0; 112.0) | 93.0 (80.0; 103.0) | <0.001 |
| Abdominal obesity, n (%) | 596 (74.7%) | 248 (73.8%) | 348 (75.3%) | 0.680 |
| BMI, kg/m2 | 28.1 (24.2; 31.9) | 28.4 (25.9; 31.4) | 27.5 (23.3; 32.0) | 0.008 |
| Overweight and obesity, n (%) | 562 (70.4%) | 267 (79.5%) | 295 (63.9%) | <0.001 |
| Cholesterol, mg/dl | 198.5 (172.0; 230.0) | 198.0 (174.0; 223.5) | 200.0 (171.0; 233.0) | 0.432 |
| HDL cholesterol, mg/dl | 52.0 (44.0; 63.0) | 48.0 (40.0; 55.0) | 56.0 (47.0; 66.0) | <0.001 |
| LDL cholesterol, mg/dl | 128.5 (100.0; 160.0) | 130.0 (104.5; 160.0) | 127.0 (99.0; 159.0) | 0.385 |
| Triglycerides, mg/dl | 99.5 (68.0; 149.0) | 117.0 (82.5; 175.5) | 90.0 (62.0; 129.0) | <0.001 |
| Fasting glycemia, mg/dl | 95.0 (88.0; 104.5) | 95.5 (89.0; 106.0) | 95.0 (87.0; 104.0) | 0.213 |
| HbA1c, % | 5.5 (5.2; 5.8) | 5.4 (5.2; 5.8) | 5.5 (5.2; 5.9) | 0.017 |
| Glycemic status, n (%) Normoglycemia Intermediate hyperglycemia Diabetes | 464 (58.1%) 251 (31.5%) 83 (10.4%) | 205 (61.0%) 96 (28.6%) 35 (10.4%) | 259 (56.1%) 155 (33.5%) 48 (10.4%) | 0.308 |
| Smoking status, n (%) Never smoker Former smoker Current smoker | 399 (50.0%) 185 (23.2%) 214 (26.8%) | 120 (35.7%) 120 (35.7%) 96 (28.6%) | 279 (60.4%) 65 (14.1%) 118 (25.5%) | <0.001 |
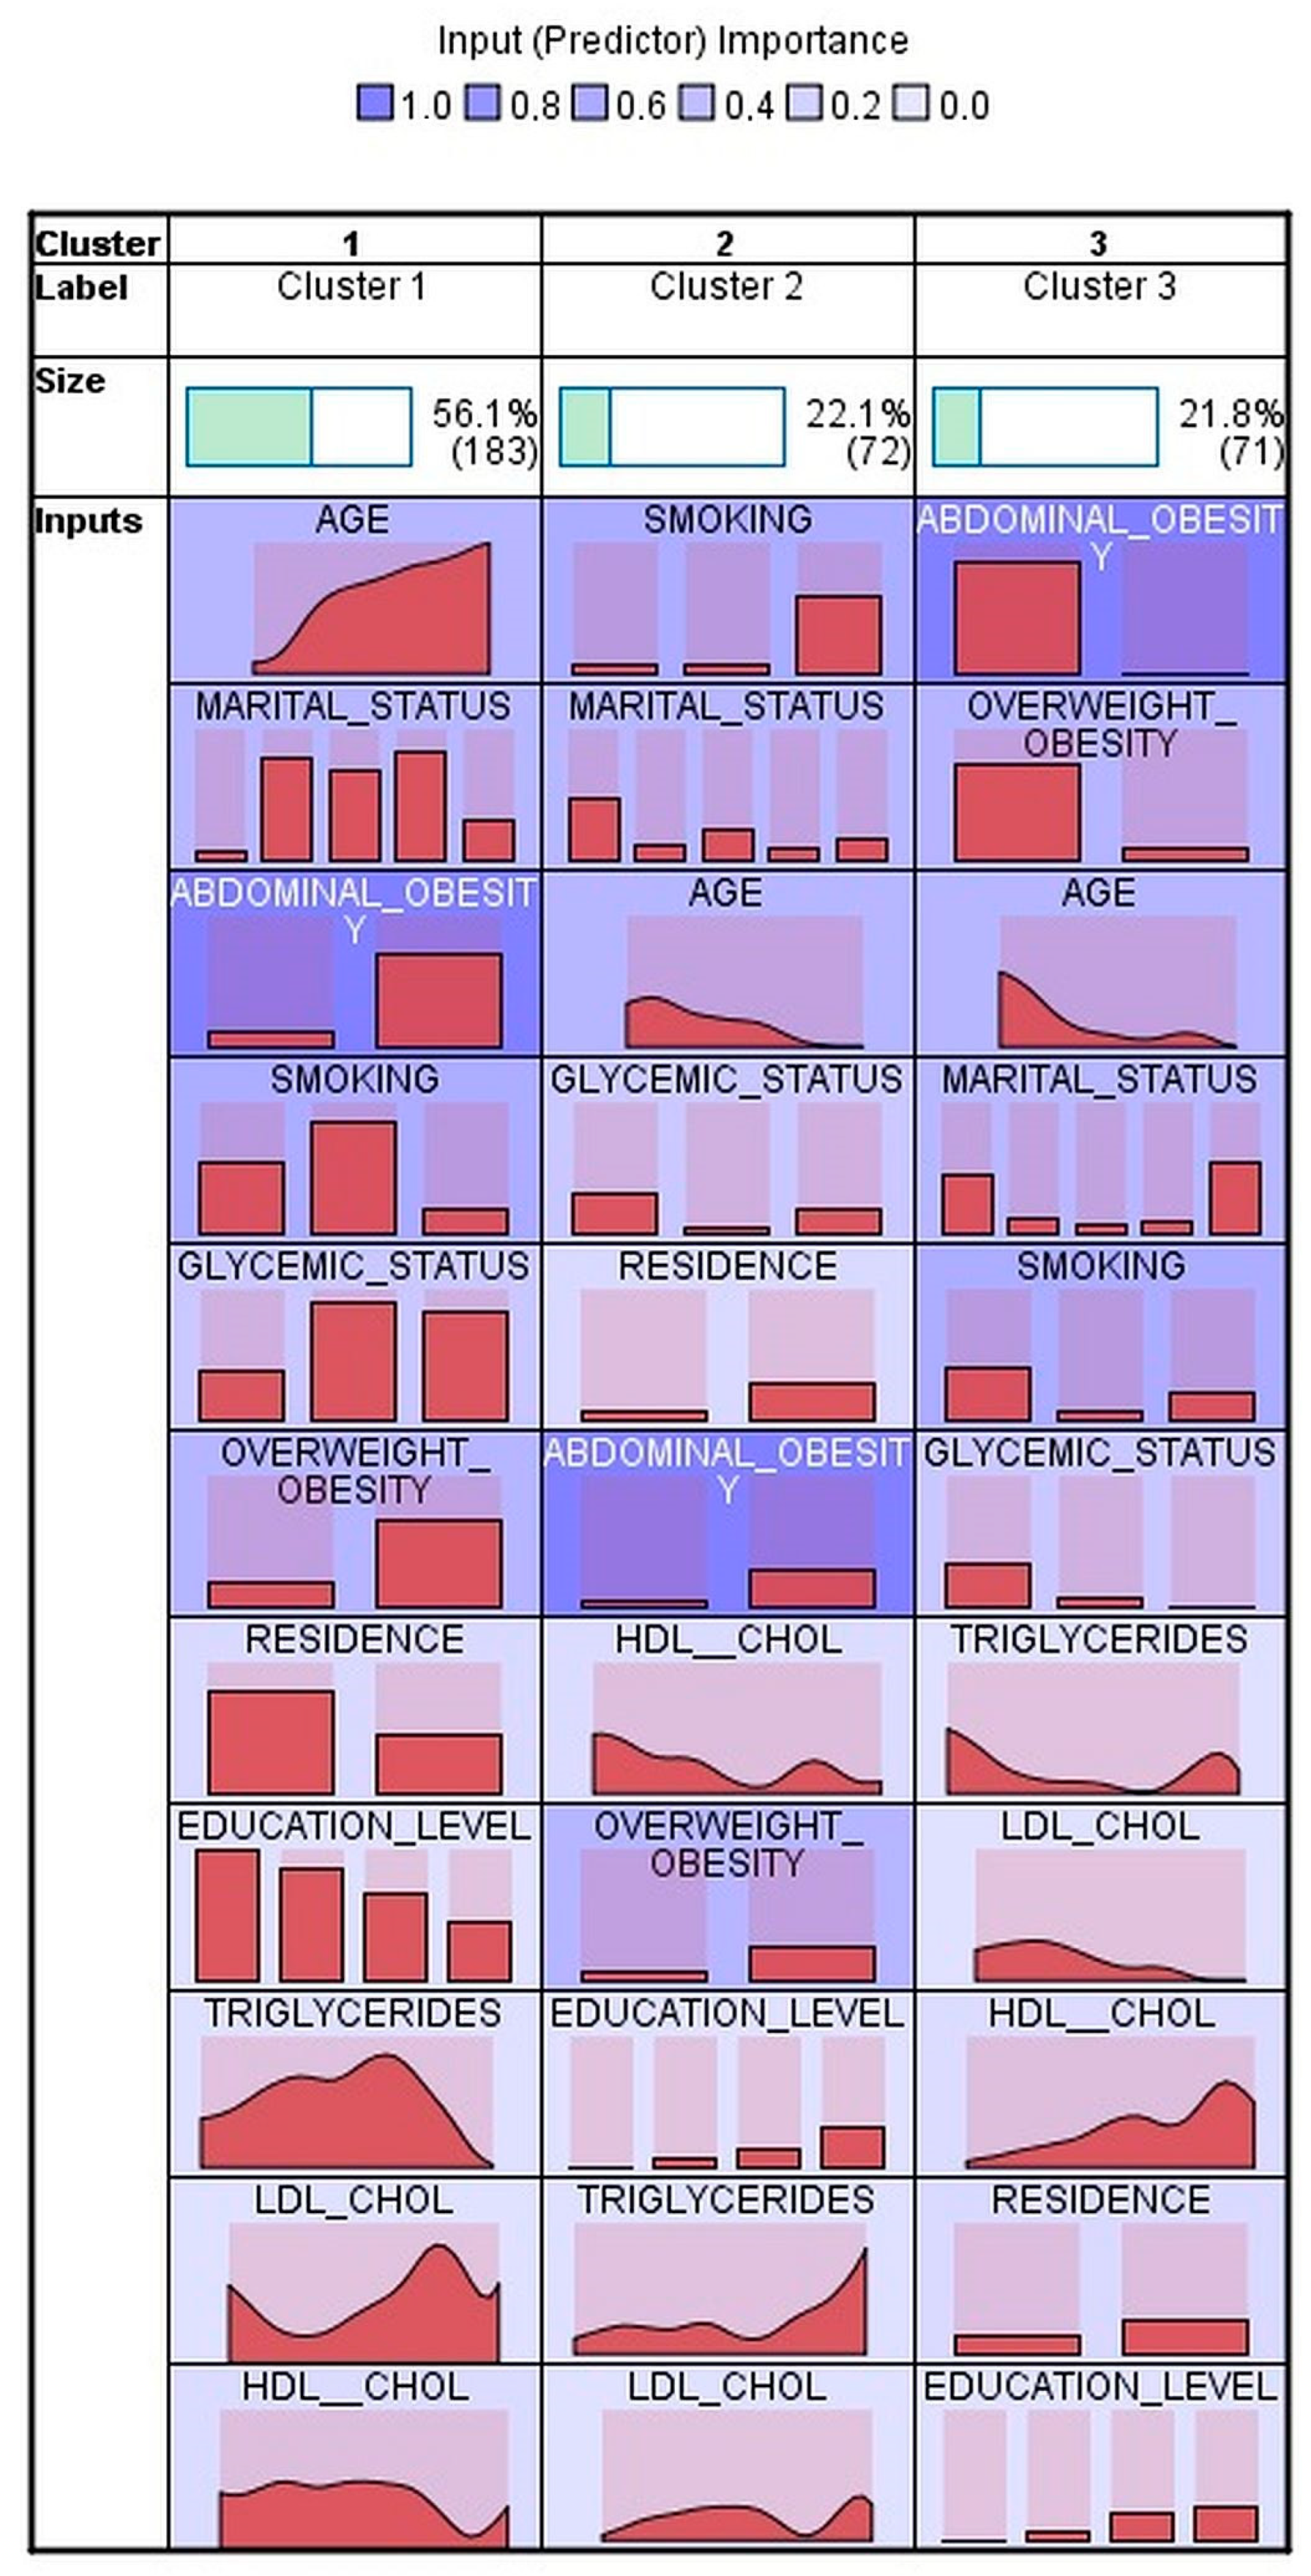
| Men N = 336 | ||||
|---|---|---|---|---|
| Cluster 1 N = 183 | Cluster 2 N = 72 | Cluster 3 N = 71 | p-Value | |
| Age, years | 57.4 (47.5; 69.2) | 36.4 (29.0; 59.1) | 30.5 (25.5; 45.5) | <0.001 |
| Residence, n (%) Rural Urban | 83 (45.4%) 100 (54.6%) | 8 (11.1%) 64 (88.9%) | 16 (22.5%) 55 (77.5%) | <0.001 |
| Education, n (%) No studies Primary school Secondary school University | 1 (0.5%) 11 (6.0%) 99 (54.1%) 72 (39.3%) | 0 (0.0%) 1 (1.4%) 21 (29.2%) 50 (69.4%) | 0 (0.0%) 1 (1.4%) 30 (42.3%) 40 (56.3%) | <0.001 |
| Marital status, n (%) Unmarried Married Factual union Divorced Widow | 6 (3.3%) 155 (84.7%) 9 (4.9%) 9 (4.9%) 4 (2.2%) | 43 (59.7%) 23 (31.9%) 3 (4.2%) 1 (1.4%) 2 (2.8%.) | 41 (57.7%) 21 (29.6%) 1 (1.4%) 1 (1.4%) 7 (9.9%) | <0.001 |
| Abdominal obesity, n (%) | 174 (95.1%) | 68 (94.4%) | 1 (1.4%) | <0.001 |
| Overweight and obesity, n (%) | 171 (93.4%) | 67 (93.1%) | 24 (33.8%) | <0.001 |
| HDL cholesterol, mg/dL | 47.0 (40.0; 54.0) | 45.5 (37.0; 50.0) | 53.0 (46.0; 64.0) | <0.001 |
| LDL cholesterol, mg/dL | 138.0 (107.0; 172.0) | 131.0 (112.25; 151.75) | 113.0 (91.0; 139.0) | 0.001 |
| Triglycerides, mg/dL | 134.0 (90.0; 184.0) | 120.5 (83.5; 183.5) | 84.0 (58.0; 121.0) | <0.001 |
| Glycemic status, n (%) Normoglycemia Intermediate hyperglycemia Diabetes | 76 (41,5%) 79 (43.2%) 28 (15.3%) | 62 (86.1%) 4 (5.6%) 6 (8.3%) | 66 (93.0%) 5 (7.0%) 0 (0%) | <0.001 |
| Smoking status, n (%) Never smoker Former smoker Current smoker | 63 (34.4%) 102 (55.7%) 18 (9.8%) | 7 (9.7%) 9 (12.5%) 56 (77.8%) | 45 (63.4%) 7 (9.9%) 19 (26.8%) | <0.001 |
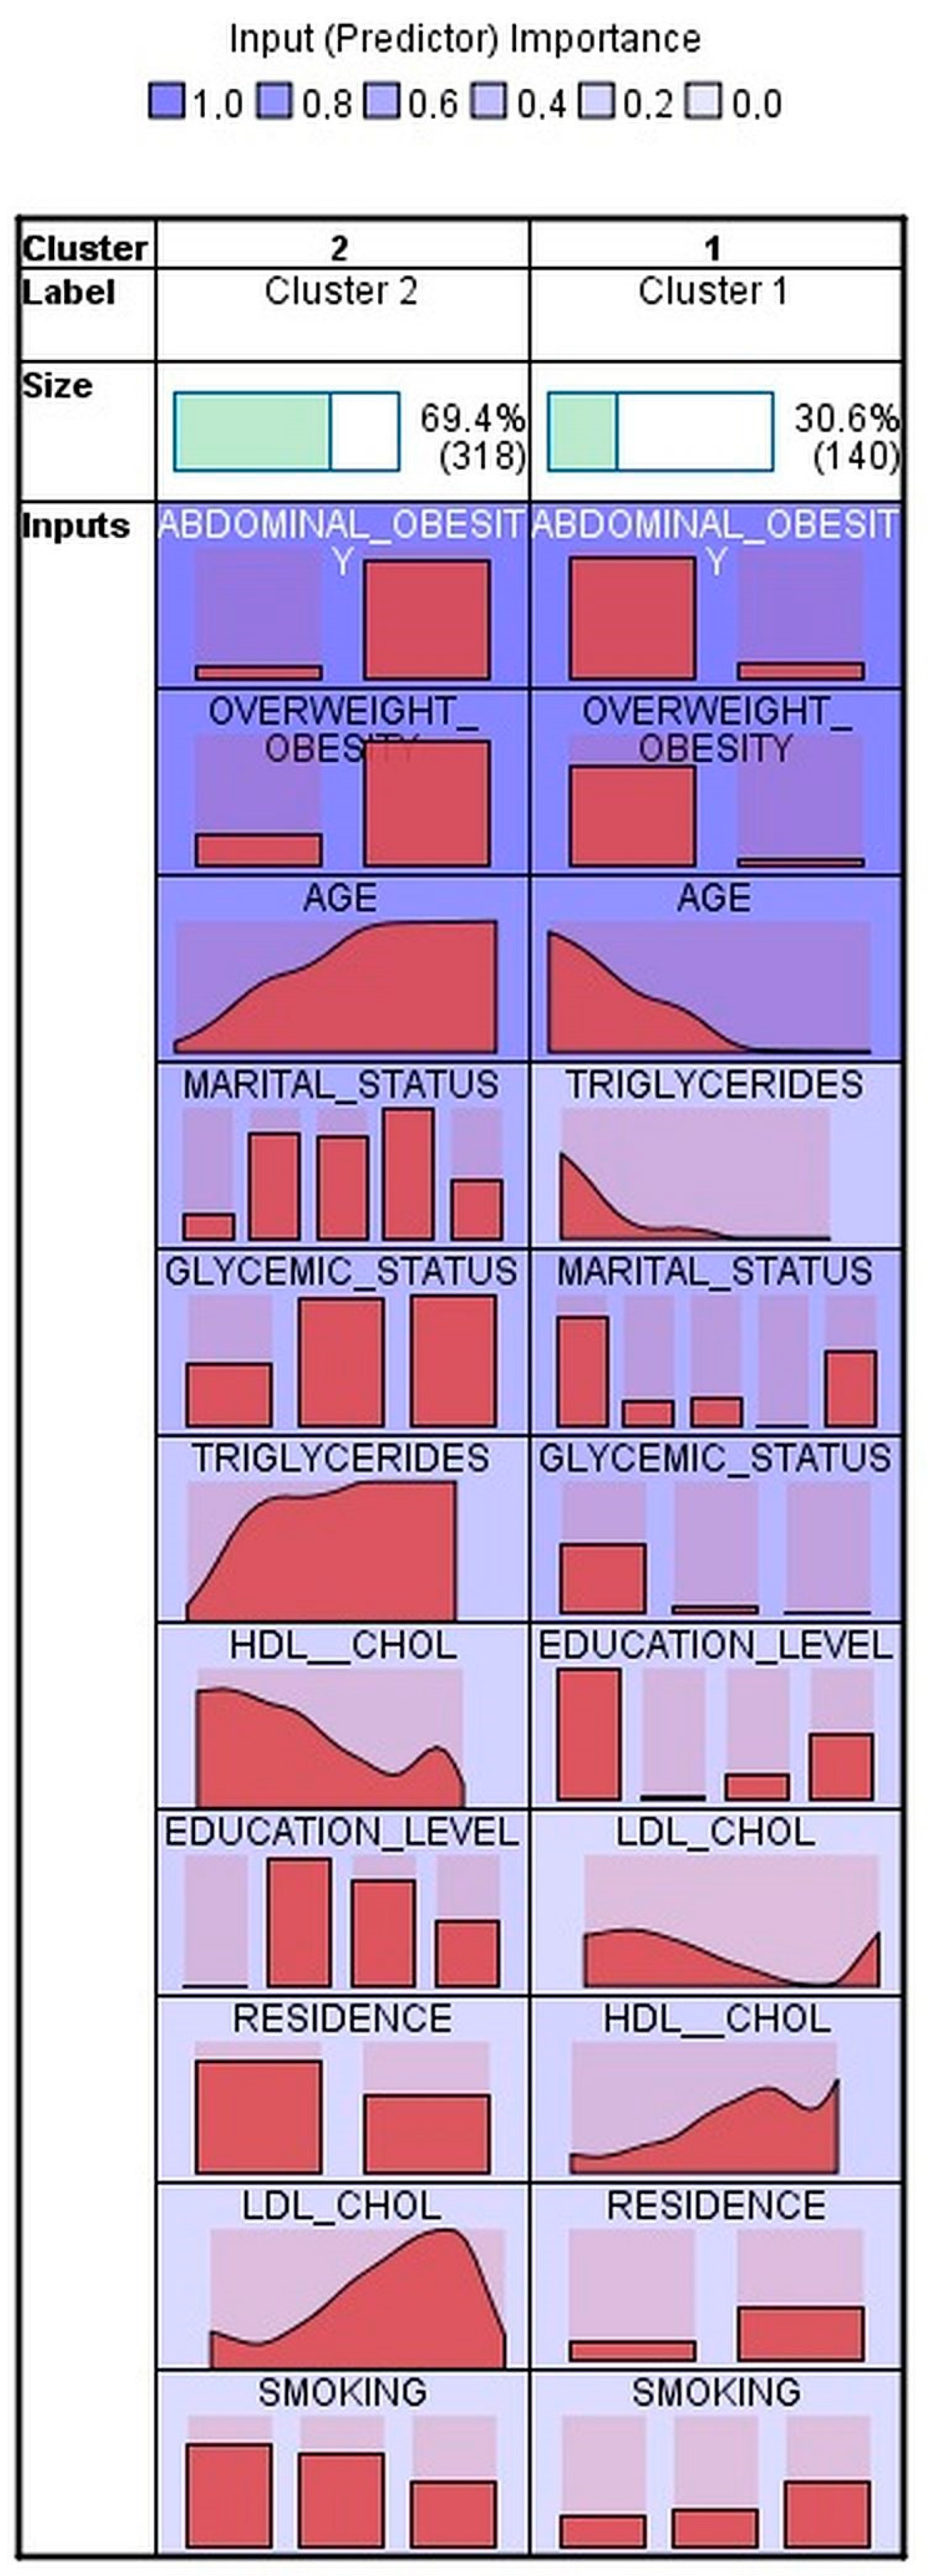
| Women N = 458 | |||
|---|---|---|---|
| Cluster 1 N = 140 | Cluster 2 N = 318 | p-Value | |
| Age, years | 34.4 (29.9: 46.7) | 59.1 (49.6; 69.3) | <0.001 |
| Residence, n (%) Rural Urban | 26 (18.6%) 114 (81.4%) | 153(48.1%) 165 (51.9%) | <0.001 |
| Education, n (%) No studies Primary school Secondary school University | 1 (0.7%) 1 (0.7%) 44 (31.4%) 94 (67.1%) | 0 (0.0%) 38 (11.9%) 188 (59.1%) 92 (28.9%) | <0.001 |
| Marital status, n (%) Unmarried Married Factual union Divorced Widow | 75 (53.6%) 53 (37.9%) 7 (5.0%) 0 (0.0%) 5 (3.6%) | 16 (5.0%) 223 (70.1%) 26 (8.2%) 49 (15.4%) 4 (1.3%) | <0.001 |
| Abdominal obesity, n (%) | 37 (26.4%) | 309 (97.2%) | <0.001 |
| Overweight and obesity, n (%) | 15 (10.7%) | 278 (87.4%) | <0.001 |
| HDL cholesterol, mg/dL | 65.0 (52.3; 73.0) | 53.0 (46.0; 62.0) | <0.001 |
| LDL cholesterol, mg/dL | 112.0 (88.3; 132.0) | 134.0 (105.0; 169.3) | <0.001 |
| Triglycerides, mg/dL | 61.5 (50.3; 81.5) | 104.0 (73.0; 149.8) | <0.001 |
| Glycemic status, n (%) Normoglycemia Intermediate hyperglycemia Diabetes | 134 (95.7%) 6 (4.3%) 0 (0.0%) | 123 (38.7%) 147 (46.2%) 48 (15.1%) | <0.001 |
| Smoking status, n (%) Never smoker Former smoker Current smoker | 63 (45.0%) 19 (13.6%) 58 (41.4%) | 214 (67.3%) 46 (14.5%) 58 (18.2%) | <0.001 |
Disclaimer/Publisher’s Note: The statements, opinions and data contained in all publications are solely those of the individual author(s) and contributor(s) and not of MDPI and/or the editor(s). MDPI and/or the editor(s) disclaim responsibility for any injury to people or property resulting from any ideas, methods, instructions or products referred to in the content. |
© 2023 by the authors. Licensee MDPI, Basel, Switzerland. This article is an open access article distributed under the terms and conditions of the Creative Commons Attribution (CC BY) license (https://creativecommons.org/licenses/by/4.0/).
Share and Cite
Bala, C.; Rusu, A.; Gheorghe-Fronea, O.F.; Benedek, T.; Pop, C.; Vijiiac, A.E.; Stanciulescu, D.; Darabantiu, D.; Roman, G.; Dorobantu, M. Social and Metabolic Determinants of Prevalent Hypertension in Men and Women: A Cluster Analysis from a Population-Based Study. Int. J. Environ. Res. Public Health 2023, 20, 1736. https://doi.org/10.3390/ijerph20031736
Bala C, Rusu A, Gheorghe-Fronea OF, Benedek T, Pop C, Vijiiac AE, Stanciulescu D, Darabantiu D, Roman G, Dorobantu M. Social and Metabolic Determinants of Prevalent Hypertension in Men and Women: A Cluster Analysis from a Population-Based Study. International Journal of Environmental Research and Public Health. 2023; 20(3):1736. https://doi.org/10.3390/ijerph20031736
Chicago/Turabian StyleBala, Cornelia, Adriana Rusu, Oana Florentina Gheorghe-Fronea, Theodora Benedek, Calin Pop, Aura Elena Vijiiac, Diana Stanciulescu, Dan Darabantiu, Gabriela Roman, and Maria Dorobantu. 2023. "Social and Metabolic Determinants of Prevalent Hypertension in Men and Women: A Cluster Analysis from a Population-Based Study" International Journal of Environmental Research and Public Health 20, no. 3: 1736. https://doi.org/10.3390/ijerph20031736