Article

Degradation of Agro-Industrial Wastewater Model Compound by UV-A-Fenton Process: Batch vs. Continuous Mode

1
Escuela Internacional de Doctorado (EIDO), Campus da Auga, Campus Universitário de Ourense, Universidade de Vigo, As Lagoas, 32004 Ourense, Spain
2
Centro de Química de Vila Real (CQVR), Departamento de Química, Universidade de Trás-os-Montes e Alto Douro (UTAD), Quinta de Prados, 5000-801 Vila Real, Portugal
3
Centro de Química de Vila Real (CQVR), Departamento de Física, Universidade de Trás-os-Montes e Alto Douro (UTAD), Quinta de Prados, 5000-801 Vila Real, Portugal
4
Centre for the Research and Technology of Agro-Environmental and Biological Sciences (CITAB), University of Trás-os-Montes and Alto Douro (UTAD), 5000-801 Vila Real, Portugal
*
Author to whom correspondence should be addressed.
Int. J. Environ. Res. Public Health 2023, 20(2), 1276; https://doi.org/10.3390/ijerph20021276
Submission received: 21 December 2022 / Revised: 5 January 2023 / Accepted: 6 January 2023 / Published: 10 January 2023
(This article belongs to the Topic Advanced Oxidation Process: Applications and Prospects)

Abstract

:
The degradation of a model agro-industrial wastewater phenolic compound (caffeic acid, CA) by a UV-A-Fenton system was investigated in this work. Experiments were carried out in order to compare batch and continuous mode. Initially, batch experiments showed that UV-A-Fenton at pH 3.0 (pH of CA solution) achieved a higher generation of HO , leading to high CA degradation (>99.5%). The influence of different operational conditions, such as H2O2 and Fe2+ concentrations, were evaluated. The results fit a pseudo first-order (PFO) kinetic model, and a high kinetic rate of CA removal was observed, with a [CA] = 5.5 × 10⁻⁴ mol/L, [H2O2] = 2.2 × 10⁻³ mol/L and [Fe2+] = 1.1 × 10⁻⁴ mol/L (kCA = 0.694 min−1), with an electric energy per order ( E EO ) of 7.23 kWh m−3 order−1. Under the same operational conditions, experiments in continuous mode were performed under different flow rates. The results showed that CA achieved a steady state with higher space-times (θ = 0.04) in comparison to dissolved organic carbon (DOC) removal (θ = 0–0.020). The results showed that by increasing the flow rate (F) from 1 to 4 mL min−1, the CA and DOC removal rate increased significantly (kCA = 0.468 min−1; kDOC = 0.00896 min−1). It is concluded that continuous modes are advantageous systems that can be adapted to wastewater treatment plants for the treatment of real agro-industrial wastewaters.

1. Introduction

The rapid expansion of the agro-industry in both developed and developing countries is a major contributor of environmental pollution worldwide [1,2]. Agro-industrial wastewater characteristics are much more diverse than domestic wastewater, which is usually qualitatively and quantitatively similar in its composition. This industry produces large quantities of highly polluted wastewater containing toxic substances and organic and inorganic compounds such as: heavy metals, pesticides, phenols, and derivatives [3,4]. In the case of industries such as wine or olive oil production, large volumes of wastewaters are produced from different activities, namely tank washing, transfer, bottling, and filtration [5,6,7]. These wastewaters are characterized by an elevated content of suspended solids, low pH (3–5), and high organic load composed of phenolic compounds, sugars, organic acids, and esters [8,9]. Among these compounds, polyphenols are considered to be hazardous compounds because they are not mineralized by conventional biologic treatments [10,11], among which polyphenolic compounds are found to be the most abundant, including gallic, syringic, protocatechuic, vanillic, and caffeic acids [12,13,14,15]. Caffeic acid (3,4-dihydroxycinnamic acid) is considered to be one of the most refractory phenolic compounds to biologic degradation, because it exhibits high toxicity and antibacterial activity and represents a risk to human health, reaching 100 mg L−1, with a half-life ranging from 21.2 to 26.7 min in natural conditions [12,16,17].
Due to the limitations of conventional wastewater treatment technologies in removing recalcitrant pollutants such as caffeic acid, a more effective treatment is required to achieve a complete mineralization of these organic compounds, such as advanced oxidation processes (AOPs). In the AOPs, there is the generation of hydroxyl radicals ( HO ), which react with organic compounds, oxidizing them to simpler intermediates and possibly to CO2 and H2O [18,19]. The HO radicals are advantageous because they (1) do not generate additional waste, (2) are not toxic and have a very short lifetime, (3) are not corrosive to pieces of equipment, (4) are usually produced by assemblies that are simple to manipulate, and (5) have a high oxidizing potential (E° = 2.80 V) regarding sulfate radical anion (E° = 2.60 V), ozone (E° = 2.08 V), hydrogen peroxide (E° = 1.76), and chlorine (E° = 1.36) [20,21]. Among the AOPs, the photo-Fenton process appears as a suitable treatment process for HO radical production [22]. It employs Fe2+ and H2O2, which are readily available, easy to handle, and environmentally benign [18] and “near-UV to visible region” of light, up to a wavelength of 600 nm [23] to improve the HO radical production and to rapidly reduce the Fe3+ back to Fe2+ [24,25]. Traditional mercury-based UV-C radiation lamps can become very unstable, due to their overheating, decreasing their efficiency and lifetime [26,27]. The UV-A LED lights are a good alternative to UV-C mercury lamps because they have longer lifetimes, lower energy consumption, higher efficiency, do not overheat, and are less harmful to the environment [28,29].
Although batch reactors have been shown to be efficient in contaminant degradation, they are expensive when upscaling the treatment of wastewater; however, to counteract this tendency, most industrial treatment facilities operate in continuous mode [30]. Therefore, the aim of this work was to evaluate the degradation of caffeic acid in batch and continuous mode, in a UV-A LED reactor with a wavelength of 365 nm. It is also intended to evaluate how the different variables (pH, concentration of H2O2, and Fe2+) affect the kinetic rate of CA degradation and energy consumption. The novelty of this work lies in the application of a continuous system coupled with a UV-A reactor to degrade the CA phenolic, which has never been performed before.

2. Materials and Methods

2.1. Reagents

Caffeic acid (3,4-Dihydroxycinnamic acid) was acquired from Sigma-Aldrich, St. Louis, MO, and used as received without further purification. The molecular structure of caffeic acid in non-hydrolyzed form is illustrated in Table 1. Iron (II) sulfate heptahydrate (FeSO4•7H2O) was acquired from Panreac, Barcelona, Spain, and hydrogen peroxide (H2O2 30% w/w) and titanium (IV) oxysulfate solution 1.9–2.1%, for determination of hydrogen peroxide, were acquired from Sigma-Aldrich, St. Louis, MO, USA. Sodium sulfite anhydrous (Na2SO3) was acquired from Merk, Darmstadt, Germany. Trifluoroacetic acid (HPLC grade, ≥99.0%) was acquired from Riedel-de Haën, Seelze, Germany, and acetonitrile (HPLC grade, ≥99.9%) was acquired from Chem-Lab, Zedelgem, Belgium. For pH adjustment, sodium hydroxide (NaOH) from Labkem, Barcelona, Spain, it was used, along with sulfuric acid (H2SO4, 95%) from Scharlau, Barcelona, Spain. Deionized water was used to prepare the respective solutions.

2.2. Analytical Determinations

Different parameters were measured in order to determine the effect of the treatments. The dissolved organic carbon (DOC) in mg C/L and total nitrogen (TN) in mg N/L were determined by direct injection of filtered samples into a Shimadzu TOC-LCSH analyzer (Shimadzu, Kyoto, Japan), equipped with an ASI-L autosampler, provided with an NDIR detector and calibrated with standard solutions of potassium phthalate. The hydrogen peroxide concentration was determined using titanium (IV) oxysulfate (DIN 38 402H15 method) at 410 nm using a portable spectrophotometer from Hach (Loveland, CO, USA), the pH and oxidation reduction potential (ORP) were measured by a 3510 pH meter (Jenway, Cole-Parmer, UK), and the iron concentrations were analyzed by atomic absorption spectroscopy (AAS) using a Thermo Scientific™ iCE™ 3000 Series (Thermo Fisher Scientific, Waltham, MA, USA).
The caffeic acid (CA) eluting peaks were monitored at 280 nm using software Chromeleon™ 7.2.9 (Thermo Fisher Scientific, Waltham, MA, USA). The CA concentration was monitored by a UHPLC Ultimate 3000 (Thermo Fisher Scientific, Waltham, MA, USA), using a C18 reverse phase column (250 × 4.6 mm, 5 μm) with a flowrate of 1 mL min−1 at 25.0 °C. The volume of injection was 10.00 µL, and the eluents used were ultrapure water/trifluoroacetic acid (99.9:0.1, v/v) (solvent A) and acetonitrile/trifluoroacetic acid (99.9:0.1, v/v) (solvent B) upon the linear gradient scheme (t in min; %B): 0, 0%B; 5, 20%B; 10, 100%B; 16, 0%B, 20, 0%B.

2.3. Fenton-Based Experimental Procedure

The Fenton-based batch experiments were performed in a self-designed lab-scale reactor with 500 mL capacity and a solution depth of 1.4 cm (Figure 1). The lab reactor had a rectangular shape with a bottom and mirror walls. The UV-A LEDs system was composed of 12 Indium Gallium Nitride (LnGaN) LEDs lamps (Roithner AP2C1-365E LEDs) with a λmax = 365 nm. 250 mL of CA solution with a concentration of 5.5 × 10⁻⁴ mol L−1 (pH = 3.90 ± 0.19, DOC = 68.7 ± 2.1 mg C L−1), which was constantly agitated (350 rpm) by a L32 Basic Hotplate Magnetic Stirre 20 L (Labinco, Breda, Netherlands) at ambient temperature (298 K) for 15 min. Initially, different AOPs were tested (H2O2, UV-A, Fe2+ + UV-A, H2O2 + UV-A, Fenton, and UV-A-Fenton), then the pH (3.0–7.0), H2O2 concentration (5.5 × 10⁻⁴–8.8 × 10⁻³ mol L−1), and Fe2+ concentration (0.18 × 10⁻⁴–11 × 10−4 mol L−1) were varied.
For the Fenton-based continuous experiments, a reservoir filled with CA with a concentration of 5.5 × 10⁻⁴ mol L−1 and H2O2 was pumped by a peristaltic pump (Shenchen, Hvidovre, Denmark) into the UV-A reactor, in which different flow rates (1–4 mL min−1) were applied to the aqueous mean, with a hydraulic retention time (HRT) of 15 min (Figure 1). The H2O2 was added in continuous mode to prevent radical scavenging and to enhance CA degradation.
To determine the CA and DOC removal, Equation (1) was applied [32].
Removal   ( % ) =   C 0     C t C 0   ×   100
where C0 and Ct are the initial and final concentrations of CA and DOC.

2.4. Electrical Energy Determination

Assuming the degradation of CA as a pseudo-first order (PFO) kinetic model (ln[CA]t = −kt + ln[CA]0), the electrical energy per order ( E EO ) can be determined by conversion of the units of the first order kinetic constants to min−1, which results in Equation (2) [33]:
E EO = 38 . 4   ×   10 3 P 1000 V k obs
where P is the nominal power of the reactor (kW), V is the volume (m3), and kobs is the pseudo-first order kinetic observed (min−1).
All the CA removal experiments were performed in triplicate, and the observed standard deviation was always less than 5% of the reported values. Differences among means were determined by analysis of variance (ANOVA) using OriginLab 2019 software (Northampton, MA, USA), and the Tukey’s test was used for the comparison of means, which were considerate different when p < 0.05, and the data are presented as mean and standard deviation (mean ± SD).

3. Results

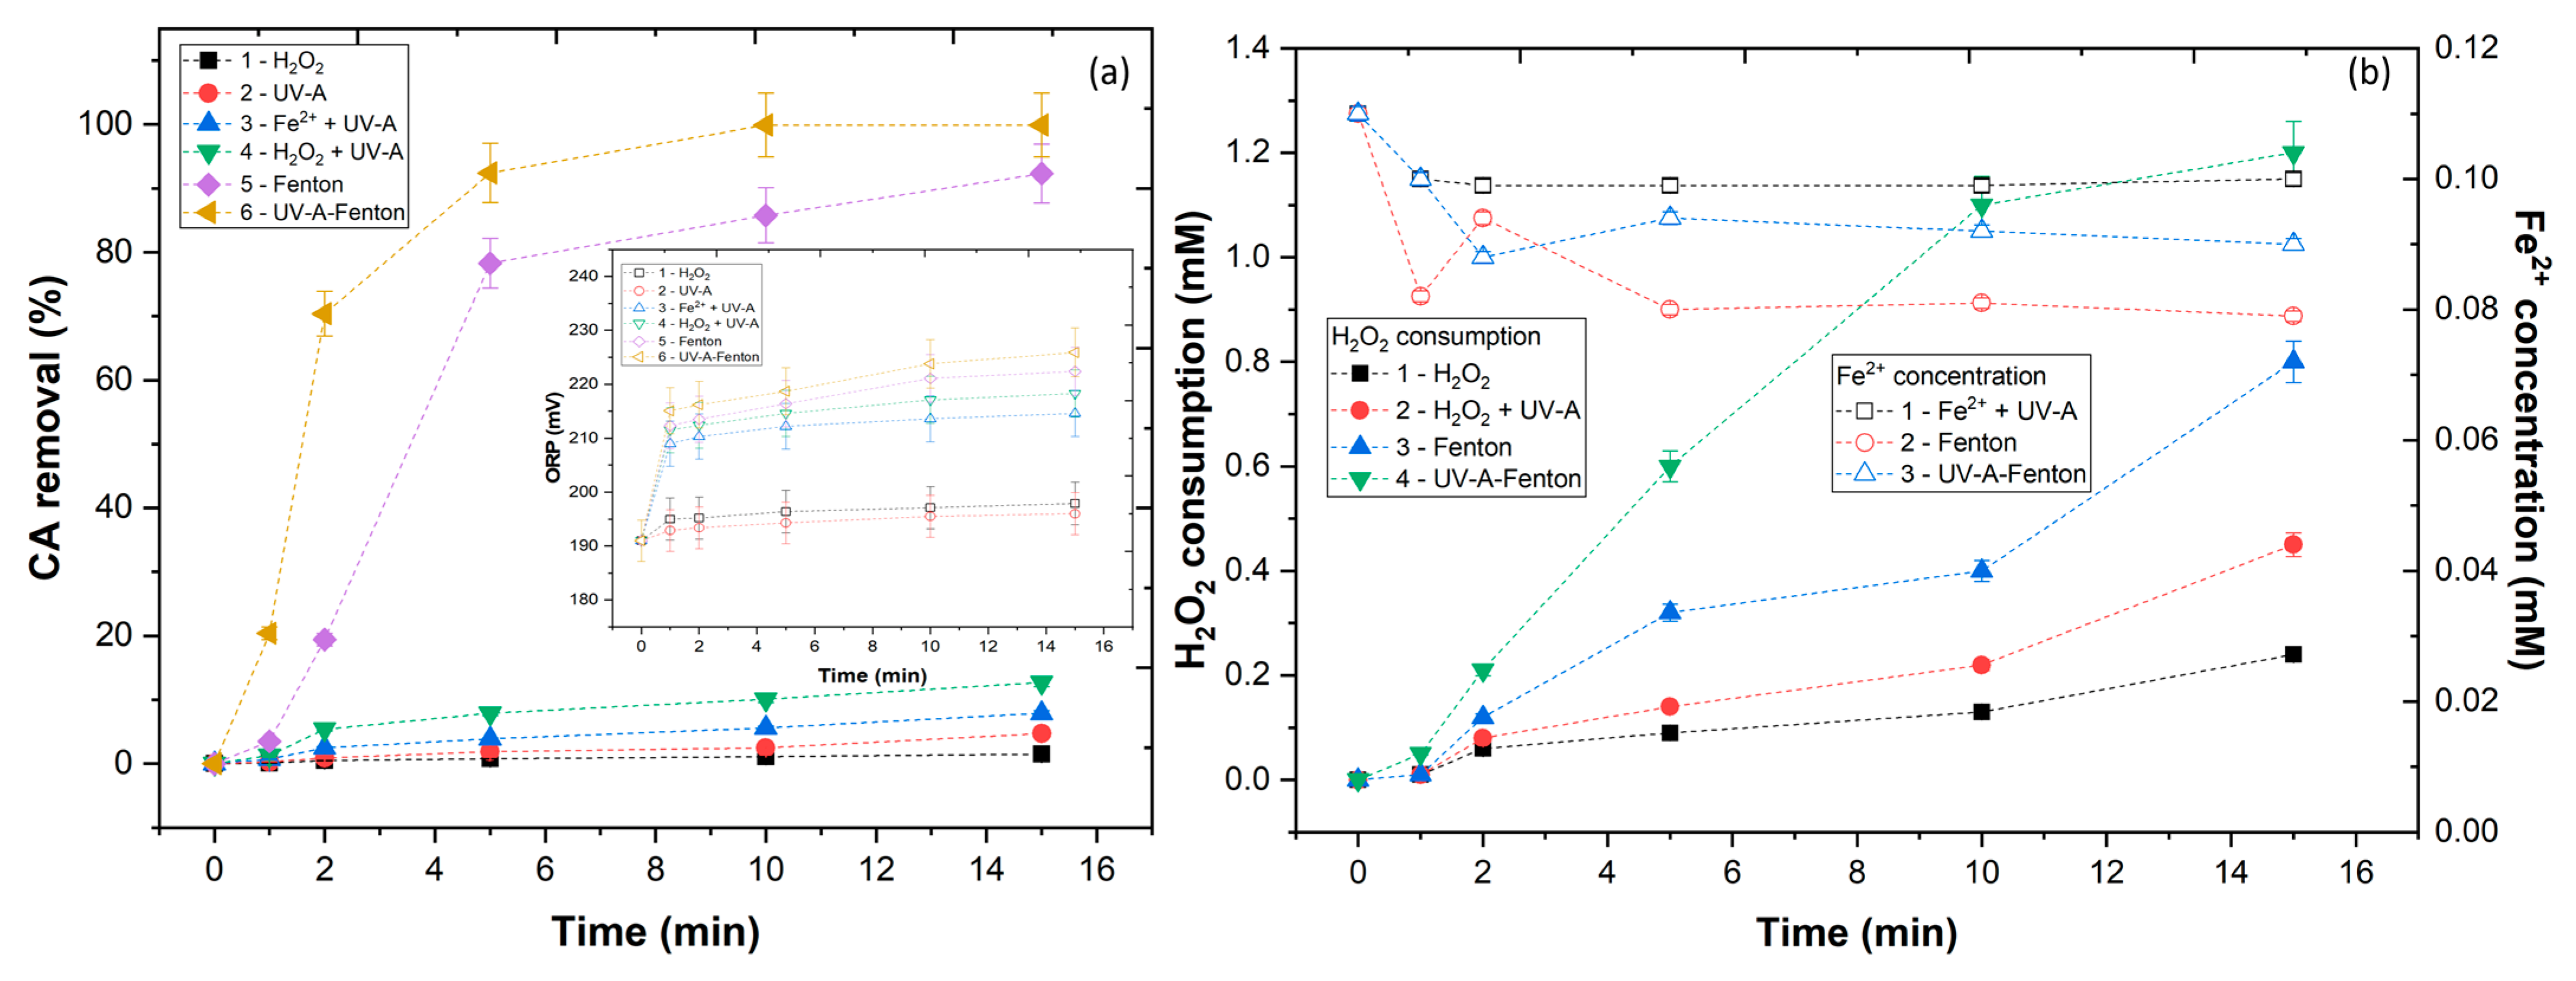
3.1. Chemical Degradability of Caffeic Acid
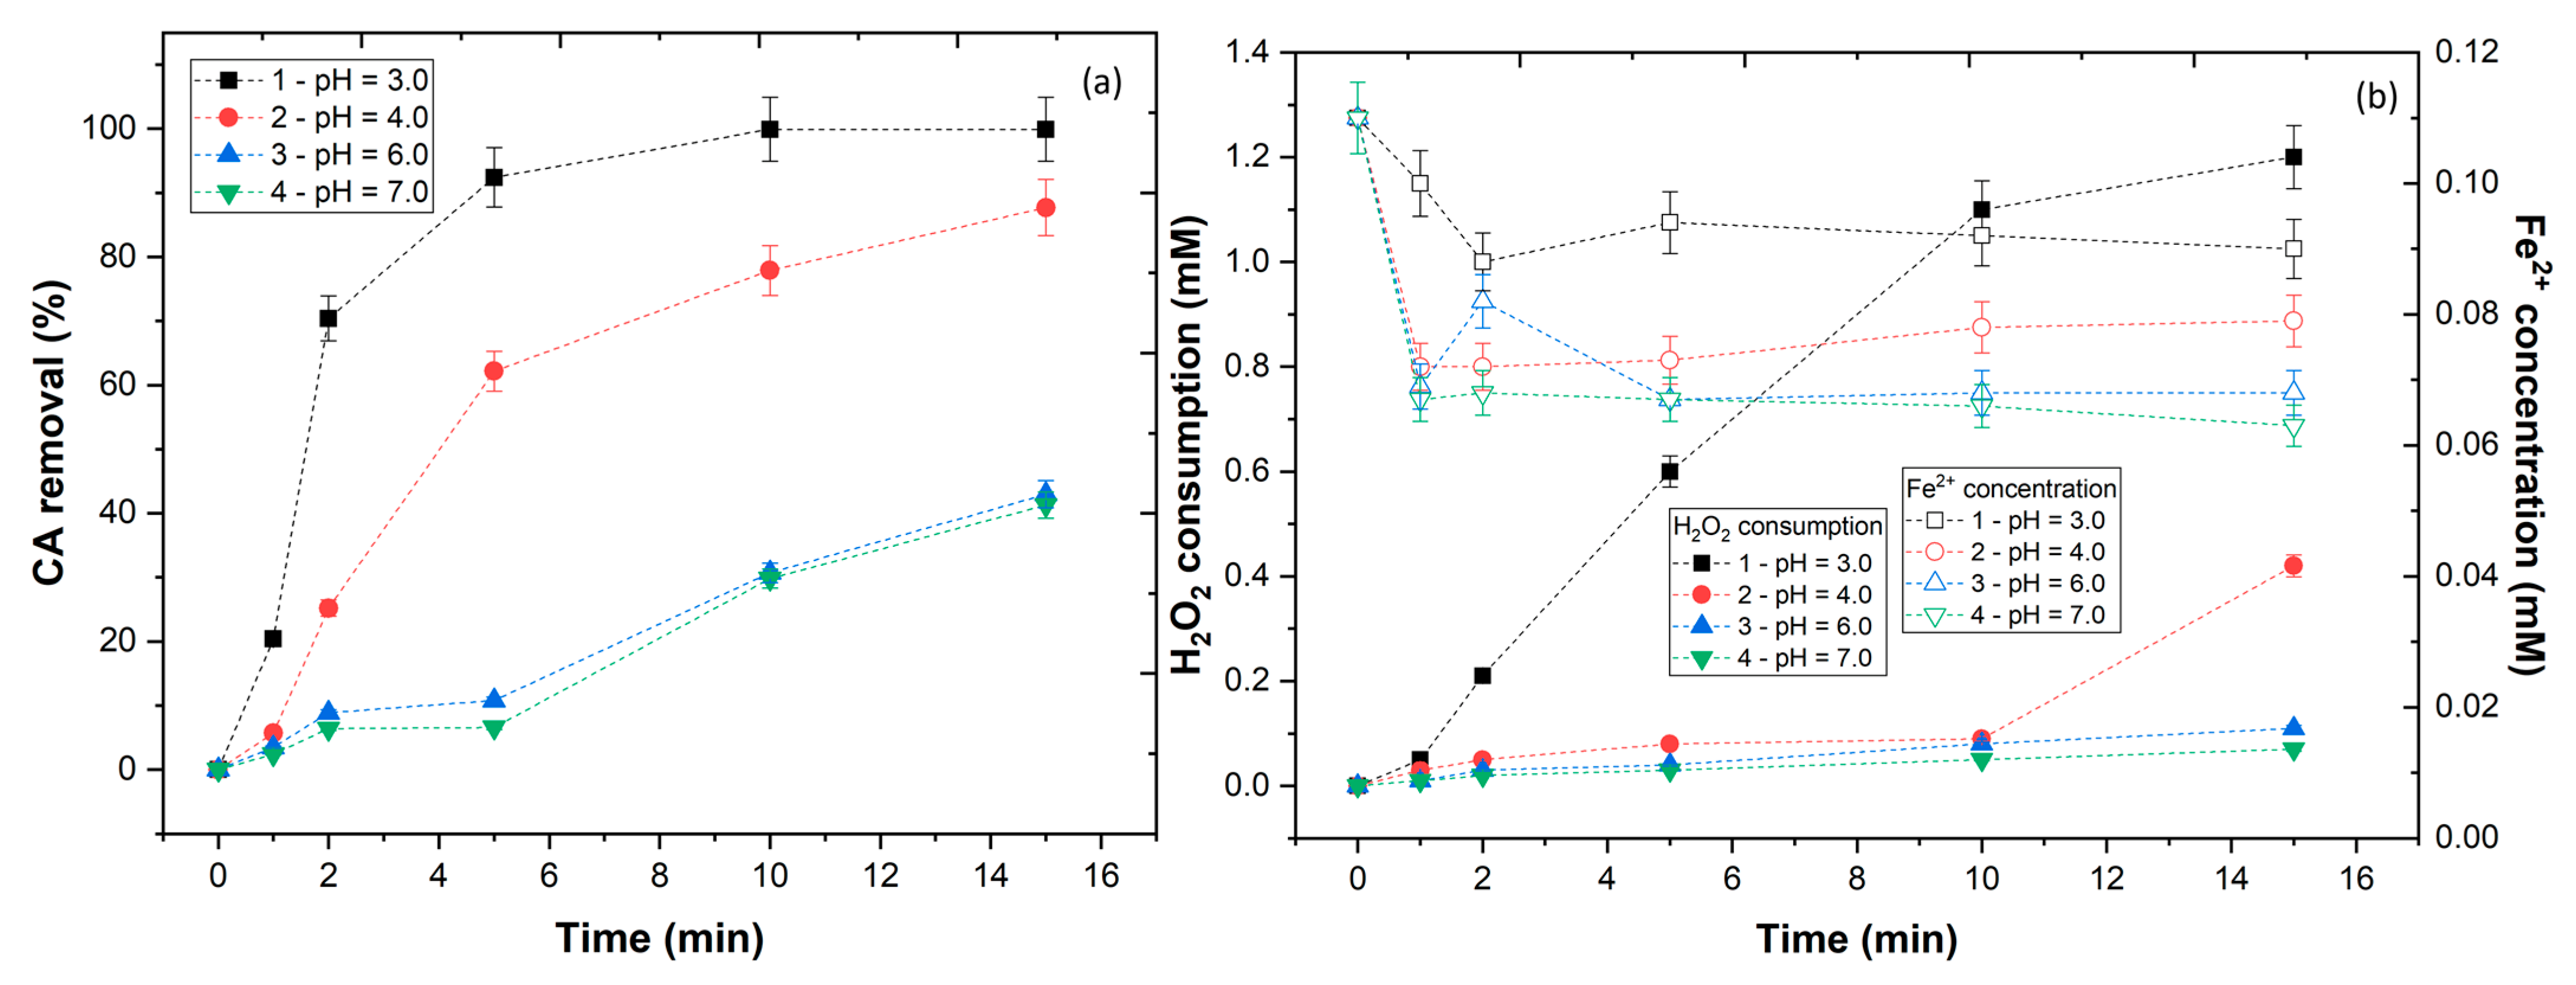
Considering the high content of impurities present in agro-industrial wastewaters, it is difficult to understand the degradation of the single compounds present in their constitution. Therefore, in this work caffeic acid (CA) was selected as a model compound because it exists in many types of agro-industrial wastewater. To evaluate the capacity of the UV-A reactor for the degradation of CA phenolic, several experiments were carried out: (1) CA+H2O2, (2) CA+UV-A, (3) CA+Fe2++UV-A, (4) CA+H2O2+UV-A, (5) CA+H2O2+Fe2+, (6) CA+H2O2+Fe2++UV-A. In Figure 2a are represented the results of CA removal after each treatment. From the results, it was possible to observe that CA is resistant to oxidation with the application of H2O2, UV-A, Fe2++UV-A, and H2O2+UV-A, with 1.5, 4.7, 7.9, and 12.7%, respectively. With the application of H2O2, UV-A, and Fe2++UV-A, there is no generation of hydroxyl radicals ( HO ) and CA shows to be resistant to degradation by radiation, H2O2, and iron. In accordance with these results, CA is harder to degrade regarding other phenolics, such as gallic acid [34]. The combination of H2O2 + UV-A increased the degradation of CA, due to the conversion of H2O2 into HO radicals (Equation (3)). The highest CA removals were observed with application of the Fenton and UV-A-Fenton processes, with 92.3 and 99.9% after 15 min of reaction. An analysis of the ORP values showed higher values with the application of Fenton and photo-Fenton, which could be linked to the production of HO radicals. To understand these results, the conversion of the H2O2 and the concentration of Fe2+ available in solution were studied (Figure 2b). With the application of H2O2 and H2O2 + UV-A, there was a low consumption of H2O2 (0.24 and 0.45 mM), thus a low generation of HO radicals occurred. With application of Fenton and UV-A-Fenton, the H2O2 consumption increased (0.80 and 1.20 mM). This increase could be due to the reaction of Fe2+ with H2O2 (Equation (4)). This difference in H2O2 consumption could be due to the Fe2+ available. Due to the reaction of Fe2+ with H2O2, the Fe2+ was oxidized to Fe3+, precipitating and ferric hydroxide. The UV-A was able to regenerate the Fe3+ to Fe2+ (Equation (5)) [35,36], thus a higher HO radicals generation occurred.
H 2 O 2 + UV     2 HO
Fe 2 + + H 2 O 2     Fe 3 + + HO + HO
Fe ( HO ) 2 + + UV     Fe 2 + + HO
These results were in agreement with the work of Cruz et al. [37], who observed an efficient removal of Sulfamethoxazole by the combination of catalyst + H2O2 + UV radiation.

3.2. Effect of pH

The pH of the solution has an important effect in the degradation efficiency of CA. Previous authors observed that the downward trend of HO radical production increased with higher pH, because the Fenton reaction’s optimal pH is around pH 2–4 [38]. The pH of the CA solution was varied (3.0–7.0), with results showing a CA removal of 99.9, 87.7, 43.0, and 41.3%, respectively, for pH 3.0, 4.0, 6.0, and 7.0 (Figure 3a). As the pH increased above pH > 3.0, the availability of the iron decreased (0.090, 0.079, 0.068, and 0.063 mM, respectively) (Figure 3b). At pH above 3.0, the Fe3+ produced by the oxidation of Fe2+ in the Fenton process began to precipitate in the form of amorphous Fe(HO)3. This formation not only decreased the iron concentration, but also inhibited the regeneration of Fe2+ [39]. In accordance with Equations (6) and (7), the reaction between Fe3+ and H2O2 generates ferric-hydroperoxyl complexes that decomposes to produce HO 2 radicals and Fe2+, as shown in Equation (8); however, these reactions have a very slow reaction rate (2.7 × 10⁻³ M s−1) [40]. Thus, at pH > 3.0, a lower concentration of H2O2 was converted to HO radicals, which decreased the efficiency of the UV-A-Fenton process.
Fe 3 + + H 2 O 2     Fe ( HO 2 ) 2 + + H +
FeHO 2 + + H 2 O 2     Fe ( HO ) ( HO 2 ) + + H +
Fe ( HO ) ( HO 2 ) +     Fe 2 + + HO + HO 2
A similar result was observed in the work of Zha et al. [41], in the degradation of landfill leachate by the photo-Fenton process. Considering that the pH of winery wastewaters is usually between 3 and 4, the application of photo-Fenton at pH 3.0 decreases the requirement of reagent consumption for pH adjustments.

3.3. Effect of H2O2 Concentration

In this section, the effect of the oxidant (H2O2) concentration in the efficiency of the UV-A-Fenton to degrade the CA phenolic was evaluated. To keep the UV-A-Fenton competitive with other processes, it is essential that this process represents a low-cost operation, thus the control of the H2O2 concentration is implied. In observation of Figure 4a, different H2O2:CA molar ratios (R) were tested, with results showing a tendency to increase the CA removal by increasing the molar rate. With application of an R = 1 and 2, a low CA removal was observed; however, when the R = 4 was applied, a near complete removal of CA was observed, reaching a plateau after 10 min of reaction. Above this ratio, no considerable CA removal was observed. To understand these results, the H2O2 consumption and Fe2+ concentration, along with the reaction, were studied (Figure 4b). With application of R = 1 and 2, the H2O2 consumption was low (0.10 and 0.30 mM, respectively), despite the high concentration of Fe2+ available (0.088 and 0.095 mM, respectively), which could mean that the H2O2 consumed was insufficient to produce HO radicals in a necessary amount to degrade the CA phenolic. With application of R = 4, 8, and 16, the iron concentrations remained similar (0.090, 0.087, and 0.086 mM, respectively); however, a higher H2O2 consumption was observed (1.2, 1.5, and 1.9 mM), thus a higher amount of HO radicals were generated, leading to the degradation of the CA phenolic. The consumption of H2O2 within R = 8 and 16 could be linked to the scavenging reactions between the excess of H2O2 with HO (Equations (9) and (10)), leading to the production of hydroperoxyl radicals ( HO 2 ) and superoxide anion radicals ( O 2 ) with a lower oxidation potential (E° = 1.70 and 0.40 V) than HO radicals (E° = 2.80 V) [42].
H 2 O 2 + HO     H 2 O + HO 2
H 2 O 2 + HO     H 2 O + H + + O 2
To have a better understanding of the effect of the H2O2 in phenolic degradation, the results showed a good fitting to the pseudo-first order (PFO) kinetic model. The k values vs. [H2O2] were plotted and two different kinetic rates were separated (Figure 5a). In a first one, up to 2.2 × 10⁻³ mol L−1 H2O2, the PFO constant is directly proportional to the concentration of H2O2 applied, with a slope of 0.012 mol L−1 min−1. In the second kinetic rate (up to 8.8 × 10⁻³ mol L−1), the PFO constant increased linearly with the concentration of H2O2, with a slope of 0.489 mol L−1 min−1. Based in these results, it can be assumed that the LED light fully penetrates the solution, independent of the concentration of H2O2 used, so the geometry of the UV-A reactor and the depth of the solution appeared to be adequate. These results were shown to be in agreement with the work of Li and Cheng [43], who observed a direct relation between the increase in the kinetic rate of malachite green degradation with higher H2O2 concentrations.
It is also necessary to study the how the concentration of H2O2 affects the energy consumption of the reactor, because the energy consumption determines part of the treatment costs. In Figure 5b, the E EO values vs. the [H2O2] were plotted, with results showing two distinct areas: (1) one for [H2O2] ≤ 2.2 × 10⁻³ mol L−1 and (2) one for [H2O2] ≥ 2.2 × 10⁻³ mol L−1. For concentrations below 2.2 × 10⁻³ mol L−1, the degradation of CA was too slow, which implied a higher energy consumption. For concentrations higher than 2.2 × 10⁻³ mol L−1, only small gains were observed, which are not profitable, considering the high cost of H2O2 [44].

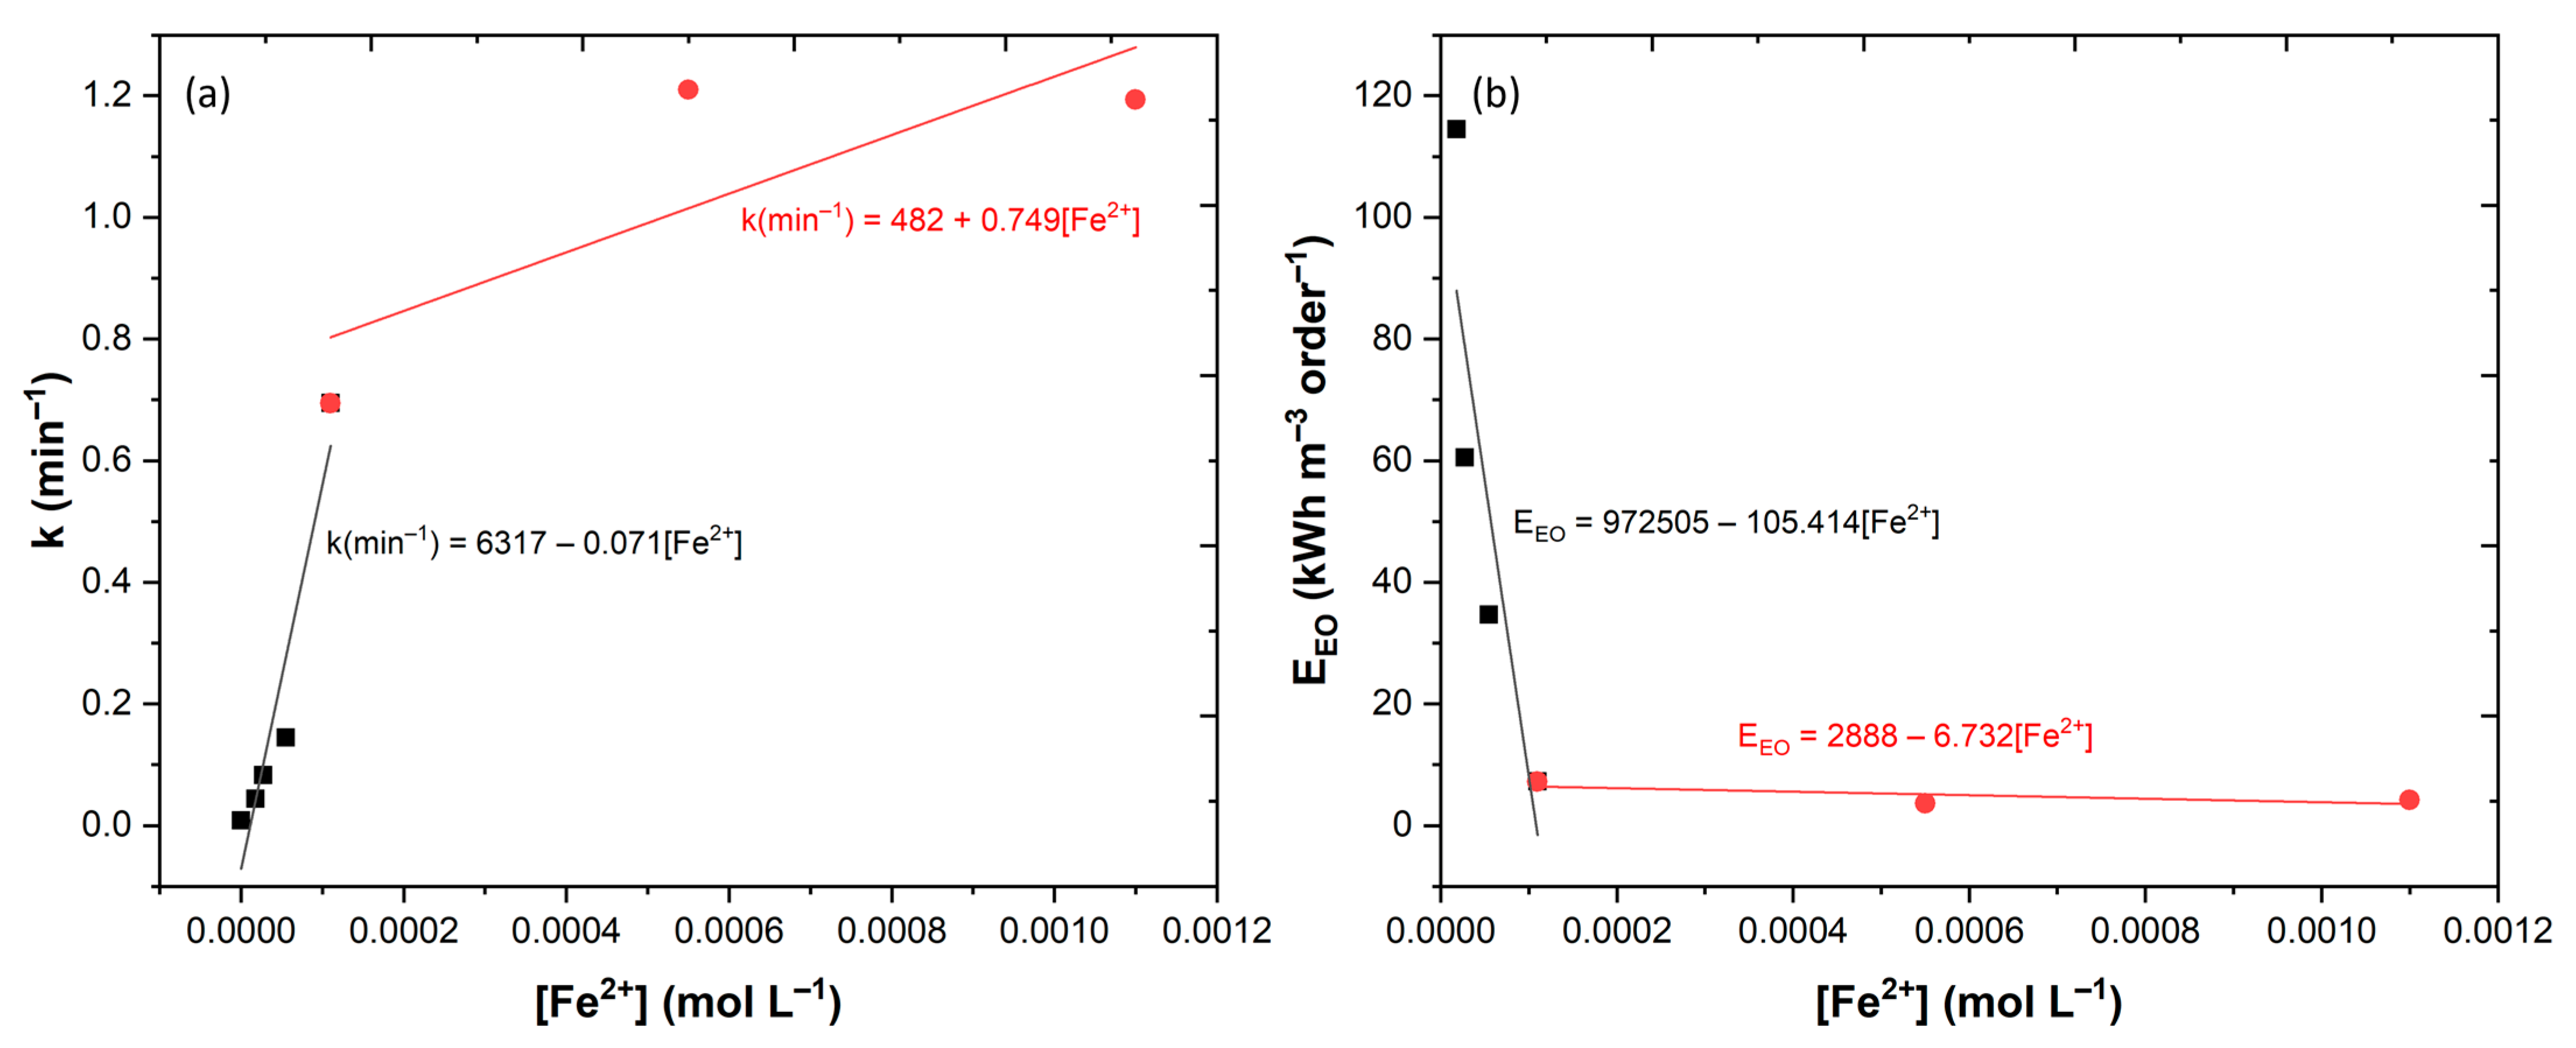
3.4. Effect of Fe2+ Concentration

As previously observed in Figure 2, the Fe2+ catalyst had a major effect regarding UV-A radiation in the conversion of H2O2 into HO radicals. Therefore, the H2O2:Fe2+ molar ratio (R1) was varied to study the effect of the Fe2+ concentration in the UV-A-Fenton process (Figure 6a). The results showed that by increasing the catalyst concentration, the rate of the CA phenolic degradation was increased. Clearly, the application of an R1 from 120 to 40 was revealed to be insufficient to achieve a complete degradation of CA. Qualitatively, the results indicated that increasing the Fe2+ concentration in solution, for a constant H2O2 concentration, increased the degradation rate of CA. To understand the effect of the Fe2+ concentration, the H2O2 consumption and the concentration of iron that remained in solution were analyzed (Figure 6b). With the application of an R1 from 120 to 40, lower concentrations of H2O2 were consumed, regarding the values obtained within R1 from 20 to 2, thus more HO radicals were generated. Figure 6b shows that within the first 5 min a higher concentration of H2O2 was consumed with the application of R1 = 2, which is consistent with the higher concentration of iron present, thus more HO radicals were generated. However, from this point onwards, the H2O2 consumption decreased to values lower than those observed with the application of R1 = 4, which could be a strong indicator that Fe2+ began consuming the HO radicals. To confirm this theory, the Fe2+ present in the solution was determined. The results showed higher Fe2+ concentrations available within the application of R1 from 20 to 2 (Figure 6b). A similar behavior was observed in the work of Faggiano et al. [45], in which increasing the concentration of iron to a certain extent lead to a reduction of the H2O2 consumption.
The results obtained showed a good fitting to the PFO kinetic model, and by plotting the k values vs. [Fe2+], two different dominions are shown (Figure 7a). In a first dominion, up to 1.1 × 10⁻⁴ mol L−1, the PFO kinetic constant is directly proportional to the concentration of Fe2+, with a slope of 0.071 mol L−1 min−1. A second dominion was observed from 1.1 × 10⁻⁴ to 11 × 10−4 mol L−1, in which the PFO kinetic constant increased linearly with the concentration Fe2+, with a slope of 0.749 mol L−1 min−1. In a closer look, from 5.5 × 10⁻⁴ to 11 × 10−4 mol L−1, the kinetic rate decreased. This could be attributed to scavenging reactions between the excess of iron present in solution and the HO radicals generated (Equation (11)) [46].
Fe 2 + + HO     Fe 3 + + HO
These results were in agreement with the work of Xavier et al. [47], who observed that the application of an excess of Fe2+ increased the scavenging reactions and decreased the efficiency of the photo-Fenton process in the degradation of Magenta MB. Parallel to the kinetic rate, the energy consumption was determined to evaluate the feasibility of the reactor. The results (Figure 7b) showed two different dominions, one for [Fe2+] ≤ 1.1 × 10⁻⁴ mol L−1 and one for [Fe2+] ≥ 1.1 × 10⁻⁴ mol L−1. These results clearly stipulate that for concentrations below 1.1 × 10⁻⁴ mol L−1, the reactions were too prolonged, implying larger electric consumptions, thus it could result in higher costs for treatment plants. For application of Fe2+ above 1.1 × 10⁻⁴ mol L−1, the gains were very low and do not justify the application of those amounts of iron. The selection of the appropriate radiation type with the correct geometry influences the kinetic rate of degradation and the costs of treatment. This fact was observed in the work of Tapia-Tlatelpa et al. [48], who observed from testing UV lamps with different geometries, that LED lamps with a radial position (similar to this work) achieved the lowest energy consumption.
In Table 2, it is shown research that compares the E EO values obtained by other treatment processes applied in the degradation of phenolic compounds, dyes, and compounds of emerging concern. When compared to the work of Yáñez et al. [12], the methodology created in this work was shown to be more efficient, reducing the energy required to degrade the CA phenolic. In a different work, the application of a low-pressure Hg lamp (8 W power, 250 nm) presented an ideal process to convert the H2O2 into HO radicals [49]; however, without a catalyst, this was observed to be a slow process with high energy consumption.
In the work of Kim et al. [50], three different reactors were applied: (1) UV-C lamp (6 W power, 254 nm) with H2O2, (2) ozone batch reactor (1.12 mg O3/min), and (3) E-beam (1 MeV and 40 kW). The results showed that the ozonation process achieved worse E EO results in comparison to the UV-A reactor used in this work. Although the UV-C and E-beam reactors showed promising results, the concentration of the SMX degraded was much lower than the concentration of CA used in this work. The UV-A reactors with an emission wavelength of 365 nm were applied in photocatalytic degradation of dyes and phenolics [33,48], with results showing efficient removals; however, they are not revealed as being competitive in comparison to the results obtained in this work. In Table 2, several examples of the application of photo-Fenton process to treat real wastewaters are also shown, such as in winery wastewater [51] and poultry slaughterhouse wastewater [52]. It is shown that the demand for electric energy to treat real wastewaters is much higher in comparison to single compounds, as is the amount of reagents required to degrade the organic carbon.

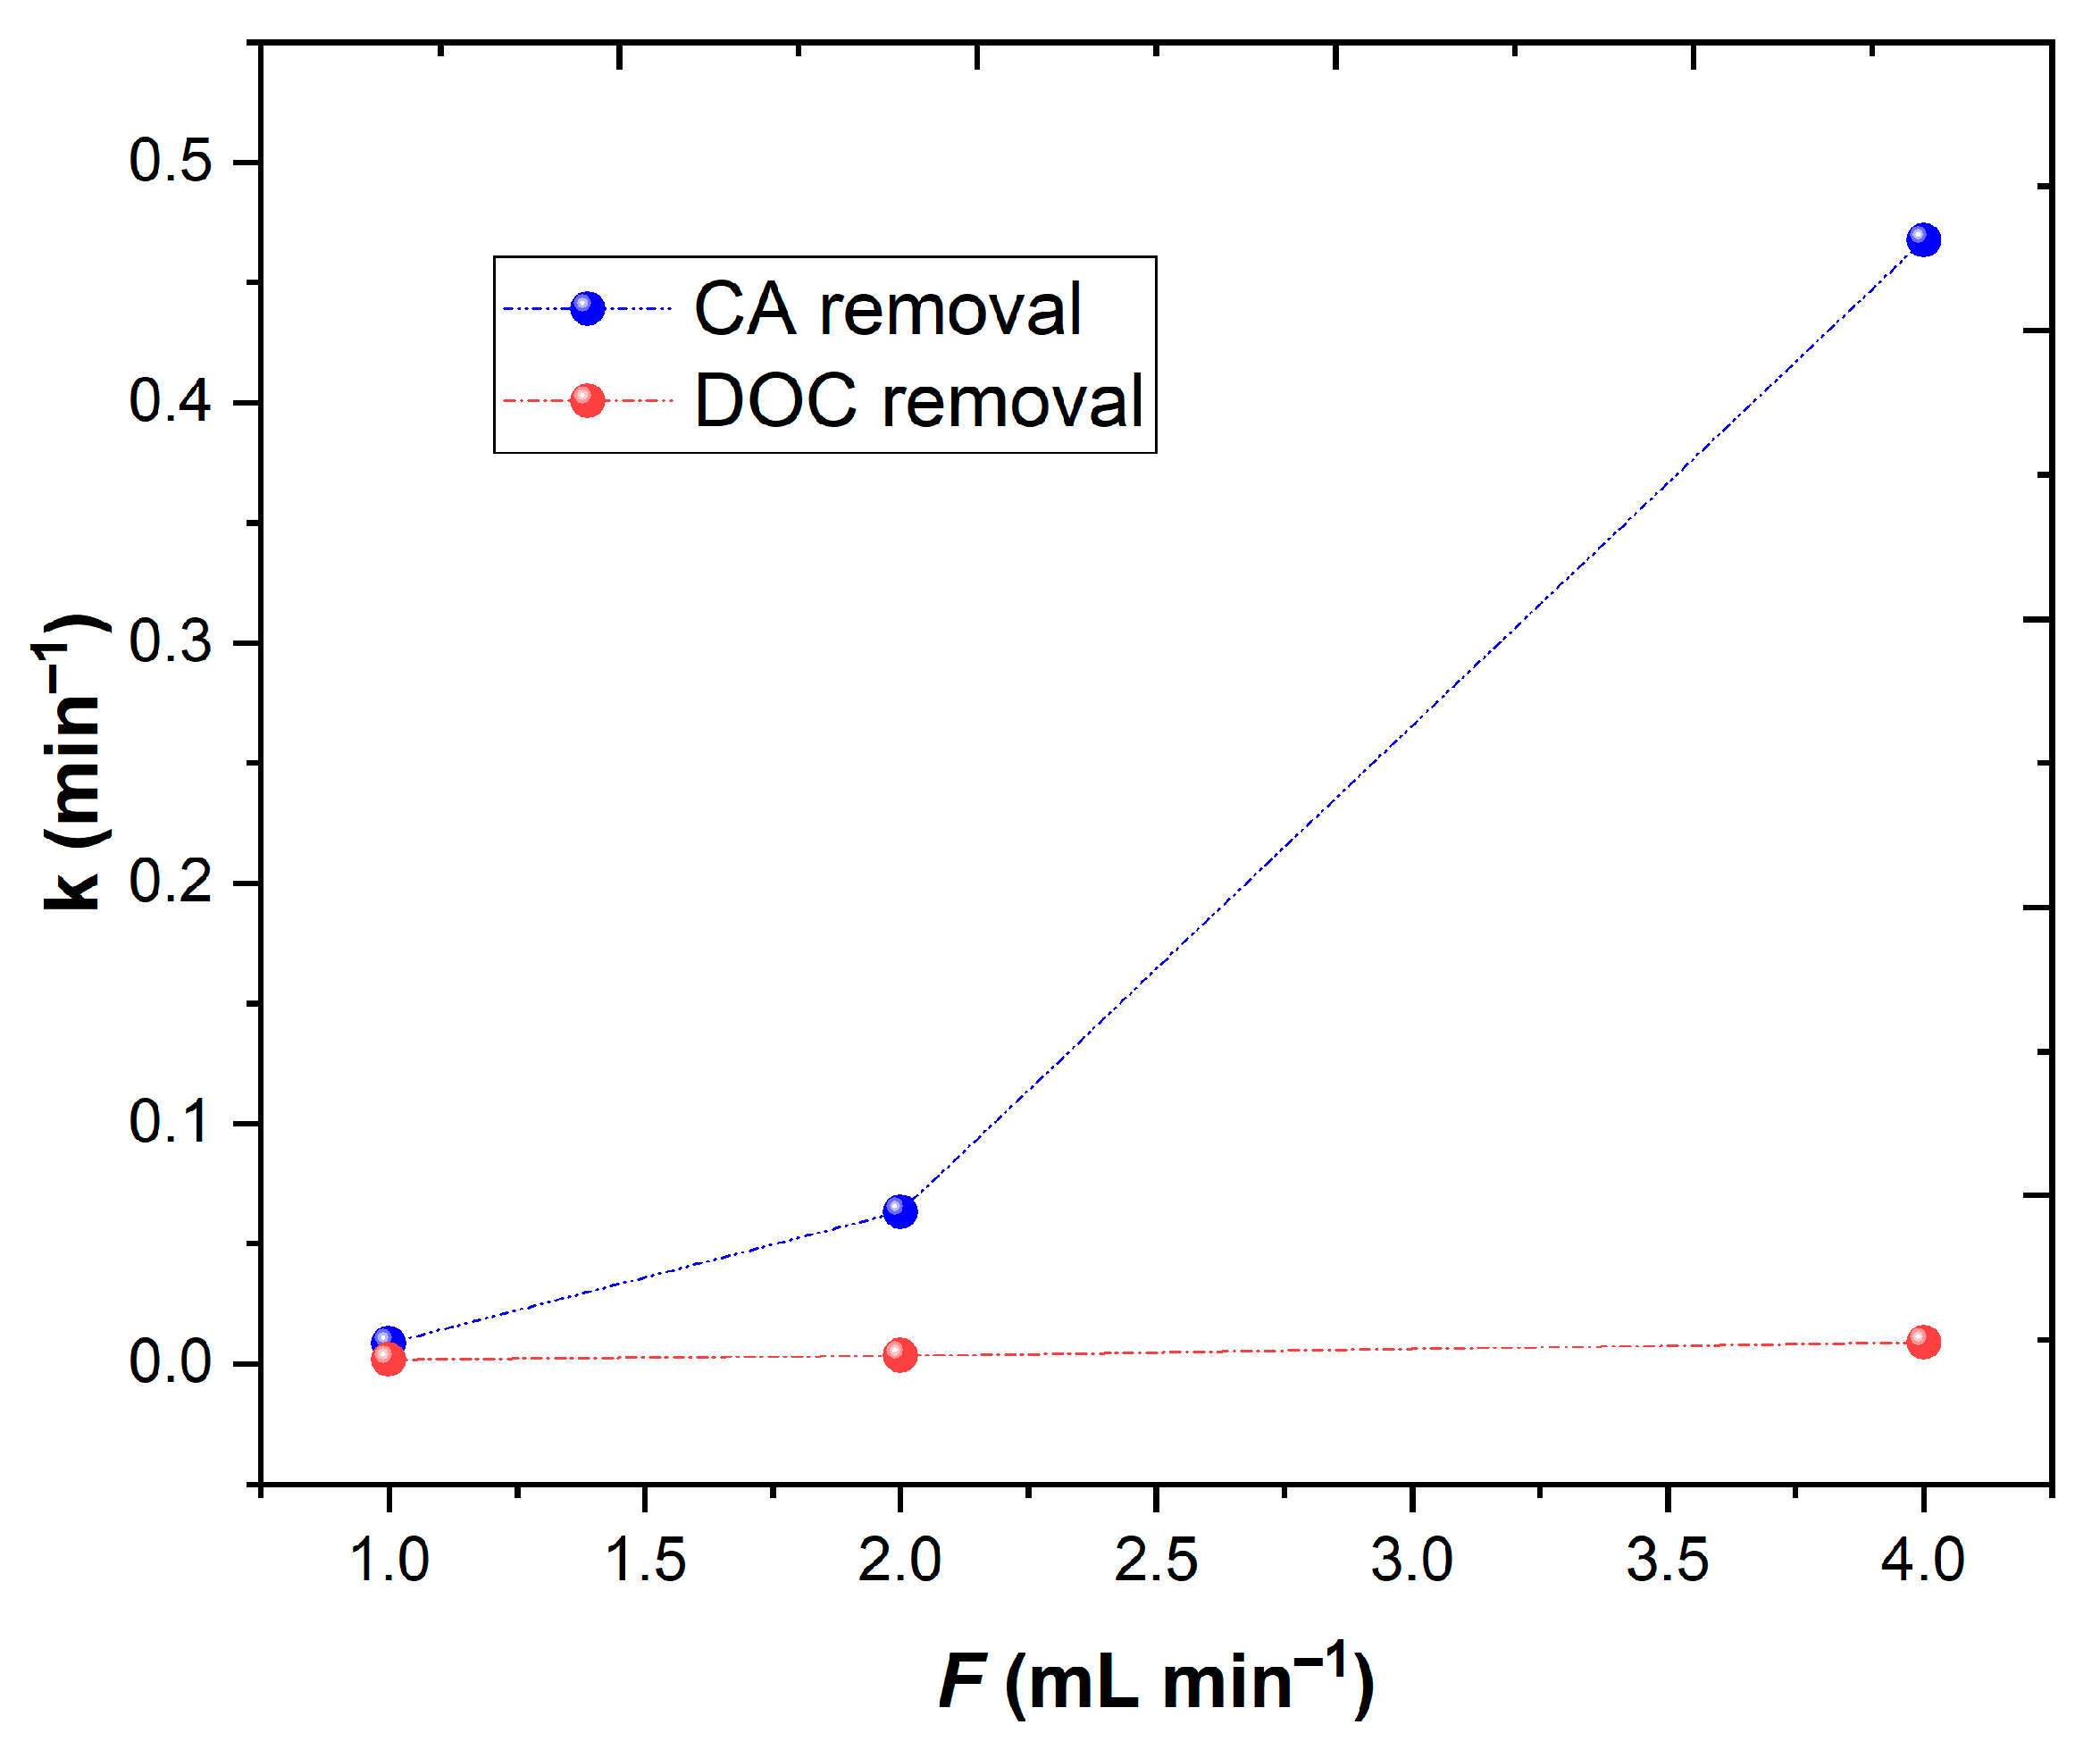
3.5. Experiments in Continuous Mode

Previous sections have shown that batch reactors fitted with UV-A LED lights achieved a near complete removal of CA from the aqueous solution. It was also observed in the H2O2 and Fe2+ concentration variations sections that the degradation of CA occurred in two phases, a faster one within the first 5 min, followed by a slower rate, reaching a plateau. This occurs because, in the first period, the Fe2+ reacted very fast with the H2O2 (k = 78 mol−1 dm3 s−1), generating a high content of HO radicals. Following this period, the ferric ions produced earlier reacted with the H2O2 producing HO 2 , with a much lower kinetic rate (k = 0.02 mol−1 dm3 s−1) [55]. Therefore, these results indicate that the residence time (τ, min) within the continuous mode is an important parameter to be considered. In an ideal continuous reactor, the space-time is equal to the mean residence time, and is determined in accordance with Equation (12) [55].
τ = V F
where V is the volume of the reactor (mL) and F is the flow rate (mL min−1). In Figure 8a are shown the removal results of CA and DOC as a function of dimensionless reaction time values (θ = t/τ), in which each θ is comparable to one τ [56]. The results showed that a CA steady state was achieved after 0.04 space-time values, while the mineralization of CA showed a steady state from 0 to 0.020 space-time values. By the analysis of the results obtained, the flow rate had a significant influence on the removal rate of CA and mineralization, in which, with F = 4 mL min−1, higher CA and DOC removal was achieved (99.2 and 35.9%, respectively). The Fe2+ concentration analysis revealed that the availability of iron remaining in the solution was similar to that observed in batch experiments; therefore, the concentration of H2O2 was revealed to be the decisive factor. In observation of Figure 8, it can be seen that the application of F = 1 and 2 mL min−1 led to considerable lower additions of H2O2 regarding the application of F = 4 mL min−1, thus less HO radicals were generated. These results were in agreement with the work of Rosales et al. [30], who observed that increasing the residence time enhanced the generation of HO radicals, increasing the discoloration of textile wastewaters.
To understand the results obtained by the continuous mode, the kinetic constants were determined by application of a continuous mode simplified model, assuming a first order reaction Equation (13) [33].
k τ = 1   C ss C 0 C SS C 0
where C0 and CSS are the initial and steady state concentrations of CA (mol L−1) and DOC (mg C L−1). In Table 3 are shown the kinetic rate constants obtained under different flow rates. The results are plotted in Figure 9, showing that as the flow rate increases, the kinetic rate of CA and DOC also increased, meaning that it achieved a good penetration of the UV-A radiation into the water. Considering this behavior, the continuous mode in association with the UV-A LEDs with horizontal geometry could be considered as a good system for phenolic degradation.

4. Conclusions

This work attempted to study the effect of several parameters in the kinetic rate and energy consumption of the hydroxyl radical-based oxidation processes. The experiments were carried out employing a UV-A LED system emitting at 365 nm, H2O2 as the oxidant, and Fe2+ as the catalyst. Based in the results, the UV-A-Fenton process at pH 3.0 achieved the highest CA degradation rate. It is concluded that increasing the H2O2 concentration increases the kinetic rate of CA degradation; however, above 2.2 × 10⁻³ mol L−1, the reactor is not economically viable, because no significant E EO reduction is observed. It is concluded that the Fe2+ achieves the best performance, with 1.1 × 10⁻⁴ mol L−1, with an E EO = 7.23 kWh m−3 order. Above this concentration, the kinetic rate increases; however, no significant gains in energy consumption were observed. When batch conditions are applied to continuous mode, it is concluded that the degradation of CA is dependent on the flow rate. It is also concluded that higher flow rates lead to higher CA and DOC removals (kCA = 0.468 min−1; kDOC = 0.00896 min−1).
Based in the results obtained from this work, a UV-A LED reactor adapted to continuous mode could provide an excellent process to reduce the soaring energy costs associated with these systems and make them viable for wastewater treatment plants.

Author Contributions

Conceptualization, N.J., A.R.T. and I.O.; methodology, N.J. and I.O.; software, N.J.; validation, N.J., J.R.F., M.S.L. and J.A.P.; formal analysis, N.J.; investigation, N.J.; resources, N.J.; data curation, N.J.; writing—original draft preparation, N.J.; writing—review and editing, N.J., J.R.F., M.S.L. and J.A.P.; visualization, N.J., J.R.F., M.S.L. and J.A.P.; supervision, M.S.L. and J.A.P.; project administration, J.A.P.; funding acquisition, M.S.L. and J.A.P. All authors have read and agreed to the published version of the manuscript.

Funding

The authors are grateful for the financial support of the Project AgriFood XXI NORTE-01-0145-FEDER-000041 and Fundação para a Ciência e a Tecnologia (FCT) to CQVR (UIDB/00616/2020). Ana R. Teixeira also thanks the FCT for the financial support provided through the doctoral scholarship UI/BD/150847/2020.

Institutional Review Board Statement

Not applicable.

Informed Consent Statement

Not applicable.

Data Availability Statement

Not applicable.

Acknowledgments

The authors are thankful to CITAB, supported by National Funds by the FCT—Portuguese Foundation for Science and Technology, under the project UIDB/04033/2020.

Conflicts of Interest

The authors declare no conflict of interest.

References

  1. Alayu, E.; Yirgu, Z. Advanced technologies for the treatment of wastewaters from agro-processing industries and cogeneration of by-products: A case of slaughterhouse, dairy and beverage industries. Int. J. Environ. Sci. Technol. 2018, 15, 1581–1596. [Google Scholar] [CrossRef]
  2. Rajagopal, R.; Saady, N.M.C.; Torrijos, M.; Thanikal, J.V.; Hung, Y.T. Sustainable agro-food industrial wastewater treatment using high rate anaerobic process. Water 2013, 5, 292–311. [Google Scholar] [CrossRef] [Green Version]
  3. Amor, C.; Marchão, L.; Lucas, M.S.; Peres, J.A. Application of advanced oxidation processes for the treatment of recalcitrant agro-industrial wastewater: A review. Water 2019, 11, 205. [Google Scholar] [CrossRef] [Green Version]
  4. Krzemińska, D.; Neczaj, E.; Borowski, G. Advanced oxidation processes for food industrial wastewater decontamination. J. Ecol. Eng. 2015, 16, 61–71. [Google Scholar] [CrossRef]
  5. Spennati, E.; Casazza, A.A.; Converti, A. Winery wastewater treatment by microalgae to production purposes. Energies 2020, 13, 2490. [Google Scholar] [CrossRef]
  6. Ioannou, L.A.; Puma, G.L.; Fatta-Kassinos, D. Treatment of winery wastewater by physicochemical, biological and advanced processes: A review. J. Hazard. Mater. 2015, 286, 343–368. [Google Scholar] [CrossRef]
  7. Jorge, N.; Santos, C.; Teixeira, A.R.; Marchão, L.; Tavares, P.B.; Lucas, M.S.; Peres, J.A. Treatment of agro-industrial wastewaters by coagulation-flocculation-decantation and advanced oxidation processes—A literature review. Eng. Proc. 2022, 19, 33. [Google Scholar] [CrossRef]
  8. Ferreira, R.; Gomes, J.; Martins, R.C.; Costa, R.; Quinta-Ferreira, R.M. Winery wastewater treatment by integrating Fenton’s process with biofiltration by Corbicula fluminea. J. Chem. Technol. Biotechnol. 2018, 93, 333–339. [Google Scholar] [CrossRef]
  9. Gernjak, W.; Maldonado, M.I.; Malato, S.; Caceres, J.; Krutzler, T.; Glaser, A.; Bauer, R. Pilot-Plant treatment of olive mill wastewater (OMW) by solar TiO2 photocatalysis and solar photo-Fenton. Sol. Energy 2004, 77, 567–572. [Google Scholar] [CrossRef]
  10. Vijayaraghavalu, S.; Prasad, H.K.; Kumar, M. Treatment and recycling of wastewater from winery. In Advances in Biological Treatment of Industrial Waste Water and their Recycling for a Sustainable Future. Applied Environmental Science and Engineering for a Sustainable Future; Singh, R.L., Singh, R.P., Eds.; Springer: Singapore, 2019; pp. 167–197. [Google Scholar]
  11. Beltrán-Heredia, J.; Sánchez-Martín, J.; Muñoz-Serrano, A.; Peres, J.A. Towards overcoming TOC increase in wastewater treated with moringa oleifera seed extract. Chem. Eng. J. 2012, 188, 40–46. [Google Scholar] [CrossRef]
  12. Yáñez, E.; Santander, P.; Contreras, D.; Yáñez, J.; Cornejo, L.; Mansilla, H.D. Homogeneous and heterogeneous degradation of caffeic acid using photocatalysis driven by UVA and solar light. J. Environ. Sci. Health Part A 2016, 51, 78–85. [Google Scholar] [CrossRef]
  13. Filipe-Ribeiro, L.; Milheiro, J.; Matos, C.C.; Cosme, F.; Nunes, F.M. Data on changes in red wine phenolic compounds, headspace aroma compounds and sensory profile after treatment of red wines with activated carbons with different physicochemical characteristics. Data Br. 2017, 12, 188–202. [Google Scholar] [CrossRef] [PubMed]
  14. Milheiro, J.; Filipe-Ribeiro, L.; Cosme, F.; Nunes, F.M. A simple, cheap and reliable method for control of 4-ethylphenol and 4-ethylguaiacol in red wines. screening of fining agents for reducing volatile phenols levels in red wines. J. Chromatogr. B 2017, 1041–1042, 183–190. [Google Scholar] [CrossRef] [PubMed]
  15. Soto, M.L.; Moure, A.; Domínguez, H.; Parajó, J.C. Recovery, concentration and purification of phenolic compounds by adsorption: A review. J. Food Eng. 2011, 105, 1–27. [Google Scholar] [CrossRef]
  16. Venditti, F.; Cuomo, F.; Ceglie, A.; Avino, P.; Russo, M.V.; Lopez, F. Visible light caffeic acid degradation by carbon-doped titanium dioxide. Langmuir 2015, 31, 3627–3634. [Google Scholar] [CrossRef]
  17. Tolba, M.F.; Azab, S.S.; Khalifa, A.E.; Abdel-Rahman, S.Z.; Abdel-Naim, A.B. Caffeic acid phenethyl ester, a promising component of propolis with a plethora of biological activities: A review on its anti-inflammatory, neuroprotective, hepatoprotective, and cardioprotective effects. IUBMB Life 2013, 65, 699–709. [Google Scholar] [CrossRef]
  18. Bello, M.M.; Raman, A.A.A.; Asghar, A. A review on approaches for addressing the limitations of Fenton oxidation for recalcitrant wastewater treatment. Process Saf. Environ. Prot. 2019, 126, 119–140. [Google Scholar] [CrossRef]
  19. Neyens, E.; Baeyens, J. A Review of classic Fenton’s peroxidation as an advanced oxidation technique. J. Hazard. Mater. 2003, 98, 33–50. [Google Scholar] [CrossRef]
  20. Cuerda-Correa, E.M.; Alexandre-Franco, M.F.; Fernández-González, C. Advanced oxidation processes for the removal of antibiotics from water. An overview. Water 2020, 12, 102. [Google Scholar] [CrossRef] [Green Version]
  21. Wang, J.; Chen, H. Catalytic ozonation for water and wastewater treatment: Recent advances and perspective. Sci. Total Environ. 2020, 704, 135249. [Google Scholar] [CrossRef]
  22. Dowd, K.O.; Pillai, S.C. Photo-Fenton disinfection at near neutral pH: Process, parameter optimization and recent advances. J. Environ. Chem. Eng. 2020, 8, 104063. [Google Scholar] [CrossRef]
  23. Chong, M.N.; Jin, B.; Chow, C.W.; Saint, C. Recent developments in photocatalytic water treatment technology: A review. Water Res. 2010, 44, 2997–3027. [Google Scholar] [CrossRef] [PubMed]
  24. Umar, M.; Aziz, H.A.; Yusoff, M.S. Trends in the use of Fenton, electro-Fenton and photo-Fenton for the treatment of landfill leachate. Waste Manag. 2010, 30, 2113–2121. [Google Scholar] [CrossRef] [PubMed]
  25. Wu, Y.; Passananti, M.; Brigante, M.; Dong, W.; Mailhot, G. Fe (III)–EDDS complex in Fenton and photo-Fenton processes: From the radical formation to the degradation of a target compound. Environ. Sci. Pollut. Res. 2014, 21, 12154–12162. [Google Scholar] [CrossRef]
  26. Chen, J.; Loeb, S.; Kim, J. LED revolution: Fundamentals and prospects for UV disinfection applications. Environ. Sci. Water Res. Technol. 2017, 3, 188–202. [Google Scholar] [CrossRef]
  27. Bronze, M.R.; Crespo, J.G.; Pereira, V.J.; Janssens, R.; Cristo, B.M.; Luis, P. Photocatalysis using UV-A and UV-C light sources for advanced oxidation of anti-cancer drugs spiked in laboratory-grade water and synthetic urine. Ind. Eng. Chem. Res. 2020, 59, 647–653. [Google Scholar] [CrossRef]
  28. Natarajan, K.; Natarajan, T.S.; Bajaj, H.C.; Tayade, R.J. Photocatalytic Reactor Based on UV-LED/TiO2 coated quartz tube for degradation of dyes. Chem. Eng. J. 2011, 178, 40–49. [Google Scholar] [CrossRef]
  29. Rojviroon, T.; Laobuthee, A.; Sirivithayapakorn, S. Photocatalytic activity of toluene under UV-LED light with TiO2 thin films. Int. J. Photoenergy 2012, 2012, 898464. [Google Scholar] [CrossRef] [Green Version]
  30. Rosales, E.; Pazos, M.; Longo, M.A.; Sanromán, M.A. Electro-Fenton Decoloration of Dyes in a Continuous Reactor: A promising technology in colored wastewater treatment. Chem. Eng. J. 2009, 155, 62–67. [Google Scholar] [CrossRef]
  31. Mudnic, I.; Modun, D.; Rastija, V.; Vukovic, J.; Brizic, I.; Katalinic, V.; Kozina, B.; Medic-Saric, M.; Boban, M. Antioxidative and vasodilatory effects of phenolic acids in wine. Food Chem. 2010, 119, 1205–1210. [Google Scholar] [CrossRef]
  32. Jorge, N.; Teixeira, A.R.; Matos, C.C.; Lucas, M.S.; Peres, J.A. Combination of coagulation–flocculation–decantation and ozonation processes for winery wastewater treatment. Int. J. Environ. Res. Public Health 2021, 18, 8882. [Google Scholar] [CrossRef] [PubMed]
  33. Ferreira, L.C.; Fernandes, J.R.; Rodriguez-Chueca, J.; Peres, J.A.; Lucas, M.S.; Tavares, P.B. Photocatalytic degradation of an agro-industrial wastewater model compound using a UV LEDs system: Kinetic study. J. Environ. Manag. 2020, 269, 110740. [Google Scholar] [CrossRef] [PubMed]
  34. Benitez, F.J.; Real, F.J.; Acero, J.L.; Leal, A.I.; Garcia, C. Gallic acid degradation in aqueous solutions by UV/H2O2 treatment, fenton’s reagent and the photo-fenton system. J. Hazard. Mater. 2005, 126, 31–39. [Google Scholar] [CrossRef] [PubMed]
  35. Kaplan, F.; Hesenov, A.; Gözmen, B.; Erbatur, O. Degradations of model compounds representing some phenolics in olive mill wastewater via electro-Fenton and photoelectro-Fenton treatments. Environ. Technol. 2011, 32, 685–692. [Google Scholar] [CrossRef] [PubMed]
  36. Jorge, N.; Teixeira, A.R.; Lucas, M.S.; Peres, J.A. Combined organic coagulants and photocatalytic processes for winery wastewater treatment. J. Environ. Manag. 2023, 326, 116819. [Google Scholar] [CrossRef] [PubMed]
  37. Cruz, A.; Couto, L.; Esplugas, S.; Sans, C. Study of the contribution of homogeneous catalysis on heterogeneous Fe (III)/Alginate mediated photo-fenton process. Chem. Eng. J. 2017, 318, 272–280. [Google Scholar] [CrossRef]
  38. Feng, X.; Wang, Z.; Chen, Y.; Tao, T.; Wu, F.; Zuo, Y. Effect of Fe (III)/Citrate concentrations and ratio on the photoproduction of hydroxyl radicals: Application on the degradation of diphenhydramine. Ind. Eng. Chem. Res. 2012, 51, 7007–7012. [Google Scholar] [CrossRef]
  39. Masomboon, N.; Ratanatamskul, C.; Lu, M. Mineralization of 2, 6-dimethylaniline by photoelectro-Fenton process. Appl. Catal. A Gen. 2010, 384, 128–135. [Google Scholar] [CrossRef]
  40. Gao, L.; Cao, Y.; Wang, L.; Li, S. A review on sustainable reuse applications of Fenton sludge during wastewater treatment. Front. Environ. Sci. Eng. 2022, 16, 77. [Google Scholar] [CrossRef]
  41. Zha, F.G.; Yao, D.X.; Hu, Y.B.; Gao, L.M.; Wang, X.M. Integration of US/Fe2+ and photo-Fenton in sequencing for degradation of landfill leachate. Water Sci. Technol. 2016, 73, 260–266. [Google Scholar] [CrossRef] [PubMed]
  42. Agrawal, S.; Nirwan, N.; Chohadia, A. Degradation of acriflavine using environmentally benign process involving singlet-oxygen-photo-fenton: A comparative study. J. Photochem. Photobiol. A Chem. 2020, 398, 112547. [Google Scholar] [CrossRef]
  43. Li, Y.; Cheng, H. Chemical kinetic modeling of organic pollutant degradation in Fenton and solar photo-Fenton processes. J. Taiwan Inst. Chem. Eng. 2021, 123, 175–184. [Google Scholar] [CrossRef]
  44. Jorge, N.; Teixeira, A.R.; Lucas, M.S.; Peres, J.A. Agro-industrial wastewater treatment with acacia dealbata coagulation/flocculation and photo-Fenton-based processes. Recycling 2022, 7, 54. [Google Scholar] [CrossRef]
  45. Faggiano, A.; De Carluccio, M.; Fiorentino, A.; Ricciardi, M.; Cucciniello, R.; Proto, A.; Rizzo, L. Photo-Fenton like process as polishing step of biologically co-treated olive mill wastewater for phenols removal. Sep. Purif. Technol. 2023, 305, 122525. [Google Scholar] [CrossRef]
  46. Gupta, A.; Garg, A. Degradation of ciprofloxacin using Fenton’s oxidation: Effect of operating parameters, identification of oxidized by-products and toxicity assessment. Chemosphere 2018, 193, 1181–1188. [Google Scholar] [CrossRef]
  47. Xavier, S.; Gandhimathi, R.; Nidheesh, P.V.; Ramesh, S.T. Comparative removal of magenta mb from aqueous solution by homogeneous and heterogeneous photo-Fenton processes. Desalin. Water Treat. 2016, 57, 12832–12841. [Google Scholar] [CrossRef]
  48. Tapia-tlatelpa, T.; Buscio, V.; Trull, J.; Sala, V. Performance analysis and methodology for replacing conventional lamps by optimized LED arrays for photocatalytic processes. Chem. Eng. Res. Des. 2020, 156, 456–468. [Google Scholar] [CrossRef]
  49. Rahmah, A.U.; Harimurti, S.; Murugesan, T. Experimental investigation on the effect of wastewater matrix on oxytetracycline mineralization using UV/H2O2 system. Int. J. Environ. Sci. Technol. 2017, 14, 1225–1233. [Google Scholar] [CrossRef]
  50. Kim, T.; Don, S.; Young, H.; Joo, S.; Lee, M.; Yu, S. Degradation and toxicity assessment of sulfamethoxazole and chlortetracycline using electron beam, ozone and UV. J. Hazard. Mater. 2012, 227–228, 237–242. [Google Scholar] [CrossRef] [PubMed]
  51. Jorge, N.; Teixeira, A.R.; Marchão, L.; Lucas, M.S.; Peres, J.A. Application of combined coagulation–flocculation–decantation/photo-Fenton/adsorption process for winery wastewater treatment. Eng. Proc. 2022, 19, 22. [Google Scholar] [CrossRef]
  52. Kanafin, Y.N.; Makhatova, A.; Meiramkulova, K.; Poulopoulos, S.G. Treatment of a poultry slaughterhouse wastewater using advanced oxidation processes. J. Water Process Eng. 2022, 47, 102694. [Google Scholar] [CrossRef]
  53. Teixeira, A.R.; Jorge, N.; Fernandes, J.R.; Lucas, M.S.; Peres, J.A. Textile dye removal by acacia dealbata link. pollen adsorption combined with UV-A/NTA/Fenton process. Top. Catal. 2022, 65, 1045–1061. [Google Scholar] [CrossRef]
  54. Rózsa, G.; Kozmér, Z.; Alapi, T.; Schrantz, K.; Takács, E.; Wojnárovits, L. Transformation of Z-thiacloprid by three advanced oxidation processes: Kinetics, intermediates and the role of reactive species. Catal. Today 2017, 284, 187–194. [Google Scholar] [CrossRef] [Green Version]
  55. Esteves, B.M.; Rodrigues, C.S.D.; Madeira, L.M. Synthetic olive mill wastewater treatment by Fenton’s process in batch and continuous reactors operation. Environ. Sci. Pollut. Res. 2018, 25, 34826–34838. [Google Scholar] [CrossRef] [PubMed]
  56. Monteil, H.; Pechaud, Y.; Oturan, N.; Trellu, C.; Oturan, M.A. Pilot scale continuous reactor for water treatment by electrochemical advanced oxidation processes: Development of a new hydrodynamic/reactive combined model. Chem. Eng. J. 2021, 404, 127048. [Google Scholar] [CrossRef]
Figure 1. Schematic representation of UV-A LEDs lab-scale reactor with peristaltic pump.
Ijerph 20 01276 g001
Figure 2. Assessment of different AOPs in (a) CA removal and ORP variation and (b) H2O2 consumption and Fe2+ concentration. Operational conditions: [CA] = 5.5 × 10⁻⁴ mol L−1, [H2O2] = 2.2 × 10⁻³ mol L−1, [Fe2+] = 1.1 × 10⁻⁴ mol L−1, pH = 3.0, agitation 150 rpm, temperature = 298 K, radiation UV-A, I UV = 32.7 W m−2, t = 15 min.
Ijerph 20 01276 g002
Figure 3. Effect of pH in (a) CA removal and (b) H2O2 consumption and Fe2+ concentration. Operational conditions: [CA] = 5.5 × 10⁻⁴ mol L−1, [H2O2] = 22 × 10−4 mol L−1, [Fe2+] = 1.1 × 10⁻⁴ mol L−1, agitation 150 rpm, temperature = 298 K, radiation UV-A, I UV = 32.7 W m−2, t = 15 min.
Ijerph 20 01276 g003
Figure 4. Evaluation of H2O2:CA molar ratio in (a) CA removal and (b) H2O2 consumption and Fe2+ concentration. Operational conditions: [CA] = 5.5 × 10⁻⁴ mol/L, [Fe2+] = 1.1 × 10⁻⁴ mol L−1, pH = 3.0, agitation 150 rpm, temperature = 298 K, radiation UV-A, I UV = 32.7 W m−2, t = 15 min.
Ijerph 20 01276 g004
Figure 5. Outcome of several concentrations of H2O2 in CA degradation by the UV-A-Fenton process; (a) dependence on the kinetic constant rates; (b) electric energy per order ( E EO ).
Ijerph 20 01276 g005
Figure 6. Assessment of the H2O2:Fe2+ molar ratio in (a) CA degradation and (b) H2O2 consumption and Fe2+ concentration. Operational conditions: [CA] = 5.5 × 10⁻⁴ mol L−1, [H2O2] = 2.2 × 10⁻³ mol L−1, pH = 3.0, agitation 150 rpm, temperature = 298 K, radiation UV-A, I UV = 32.7 W m−2, t = 15 min.
Ijerph 20 01276 g006
Figure 7. Outcome of several concentrations of Fe2+ in CA degradation by UV-A-Fenton process; (a) dependence on the kinetic constant rates; (b) electric energy per order ( E EO ).
Ijerph 20 01276 g007
Figure 8. Assessment of different flow rates (1–4 mL min−1) in (a) CA and DOC removal; (b) H2O2 and Fe2+ concentration available as function of θ. Operational conditions: [CA] = 5.5 × 10⁻⁴ mol L−1, [Fe2+] = 1.1 × 10⁻⁴ mol L−1, pH = 3.0, agitation 150 rpm, temperature = 298 K, radiation UV-A, I UV = 32.7 W m−2, HRT = 15 min.
Ijerph 20 01276 g008
Figure 9. Dependence of the kinetic constant (k) to the flow rate (F) of the continuous mode reactor.
Ijerph 20 01276 g009
Table 1. Molecular formula, molecular structure, maximum absorption wavelength and molecular weight of caffeic acid (CA) [31].
NameMolecular FormulaMolecular Structureλmax (nm)Molecular Weight (g/mol)
Caffeic acid (CA)(HO)2C6H3CH=CHCO2HIjerph 20 01276 i001324180.16
Table 2. Disclosed results of electric energy per order ( E EO ) obtained after degradation of single compounds by different treatment processes.
ContaminantsAOP
Processes
ConditionsEEO
(kWh.m−3 order−1
References
Caffeic acidUV-A LED/H2O2/Fe2+[CA] = 5.5 × 10⁻⁴ mol L−1, [H2O2] = 2.2 × 10⁻³ mol L−1, [Fe2+] = 1.1 × 10⁻⁴ mol L−17.23Present work
Caffeic acid (CA)UV-A-Fenton[CA] = 10 mg L−1, [H2O2] = 82.4 µmol L−1, [Fe2+] = 558.6 µmol L−130Yáñez et al. [12]
Winery wastewaterUV-A-FentonTOC = 1601 mg C L−1, [Fe2+] = 2.5 mM, [H2O2] = 225 mM, pH = 3.0, agitation = 350 rpm, t = 150 min641Jorge et al. [51]
Winery wastewaterUV-C-FentonTOC = 1601 mg C L−1, [Fe2+] = 2.5 mM, [H2O2] = 225 mM, pH = 3.0, agitation = 350 rpm, t = 150 min170
Poultry slaughterhouse wastewaterUV-C-FentonTOC = 68.66 mg C L−1, [Fe2+] = 20 mg L−1, [H2O2] = 98 mM, pH = 3.3, agitation = 350 rpm, t = 150 min248Kanafin et al. [52]
Oxytetracycline (OTC)UV-C/H2O2[OTC] = 250 mg L−1, [H2O2] = 375 mg L−147.18Rahmah et al. [49]
Sufamethoxazole (SMX)UV-C[SMX] = 30 mg L−1, [H2O2] = 10 mM1.50Kim et al. [50]
Sufamethoxazole (SMX)Ozone[SMX] = 30 mg L−127.53
Sufamethoxazole (SMX)Electron beam[SMX] = 30 mg L−10.46
Acid Red 88 (AR88)UV-A-FentonpH 3.0, [AR88] = 50 mg L−1, [H2O2] = 4 mM, [Fe2+] = 0.15 mM, [NTA] = 0.10 mM,26Teixeira et al. [53]
Orange PX-2RUV-A LED/TiO2[OPX-2R] = 0.1 g/L, [TiO2] = 1.0 g/L119.04Tapia-Tlatelpa et al. [48]
p-hydroxybenzoic acid (pHBA)UV-A LED/TiO2[pHBA] = 50 mg L−1, [TiO2] = 1000 mg L−1115Ferreira et al. [33]
Z-thiaclopridUV/TiO2[Z-thiacloprid] = 1.0 × 10⁻⁴ mol L−1, [TiO2] = 1 g L−180.0Rózsa et al. [54]
Table 3. Kinetic constants from CA and DOC removal observed for the assays with different flow rates (mL min−1). Means in the same column with different letters represent significant differences (p < 0.05) within each parameter (kCA and kDOC) by comparing flow rates.
FτCSS/C0DOCSS/DOC0kCAkDOC
mL min−1min min−1min−1
12500.3180.7180.009 ± 4.5 × 10⁻⁴ a0.00157 ± 7.8 × 10⁻⁵ a
21250.0590.7070.063 ± 3.2 × 10⁻³ b0.00332 ± 1.7 × 10⁻⁴ b
462.50.0080.6410.468 ± 2.3 × 10⁻² c0.00896 ± 4.5 × 10⁻⁴ c
Disclaimer/Publisher’s Note: The statements, opinions and data contained in all publications are solely those of the individual author(s) and contributor(s) and not of MDPI and/or the editor(s). MDPI and/or the editor(s) disclaim responsibility for any injury to people or property resulting from any ideas, methods, instructions or products referred to in the content.

