
Soft Tissue Ewing Sarcoma Cell Drug Resistance Revisited: A Systems Biology Approach
 , ,
, ,
Abstract
:1. Introduction
2. Materials and Methods
2.1. High-Throughput Gene Expression Data
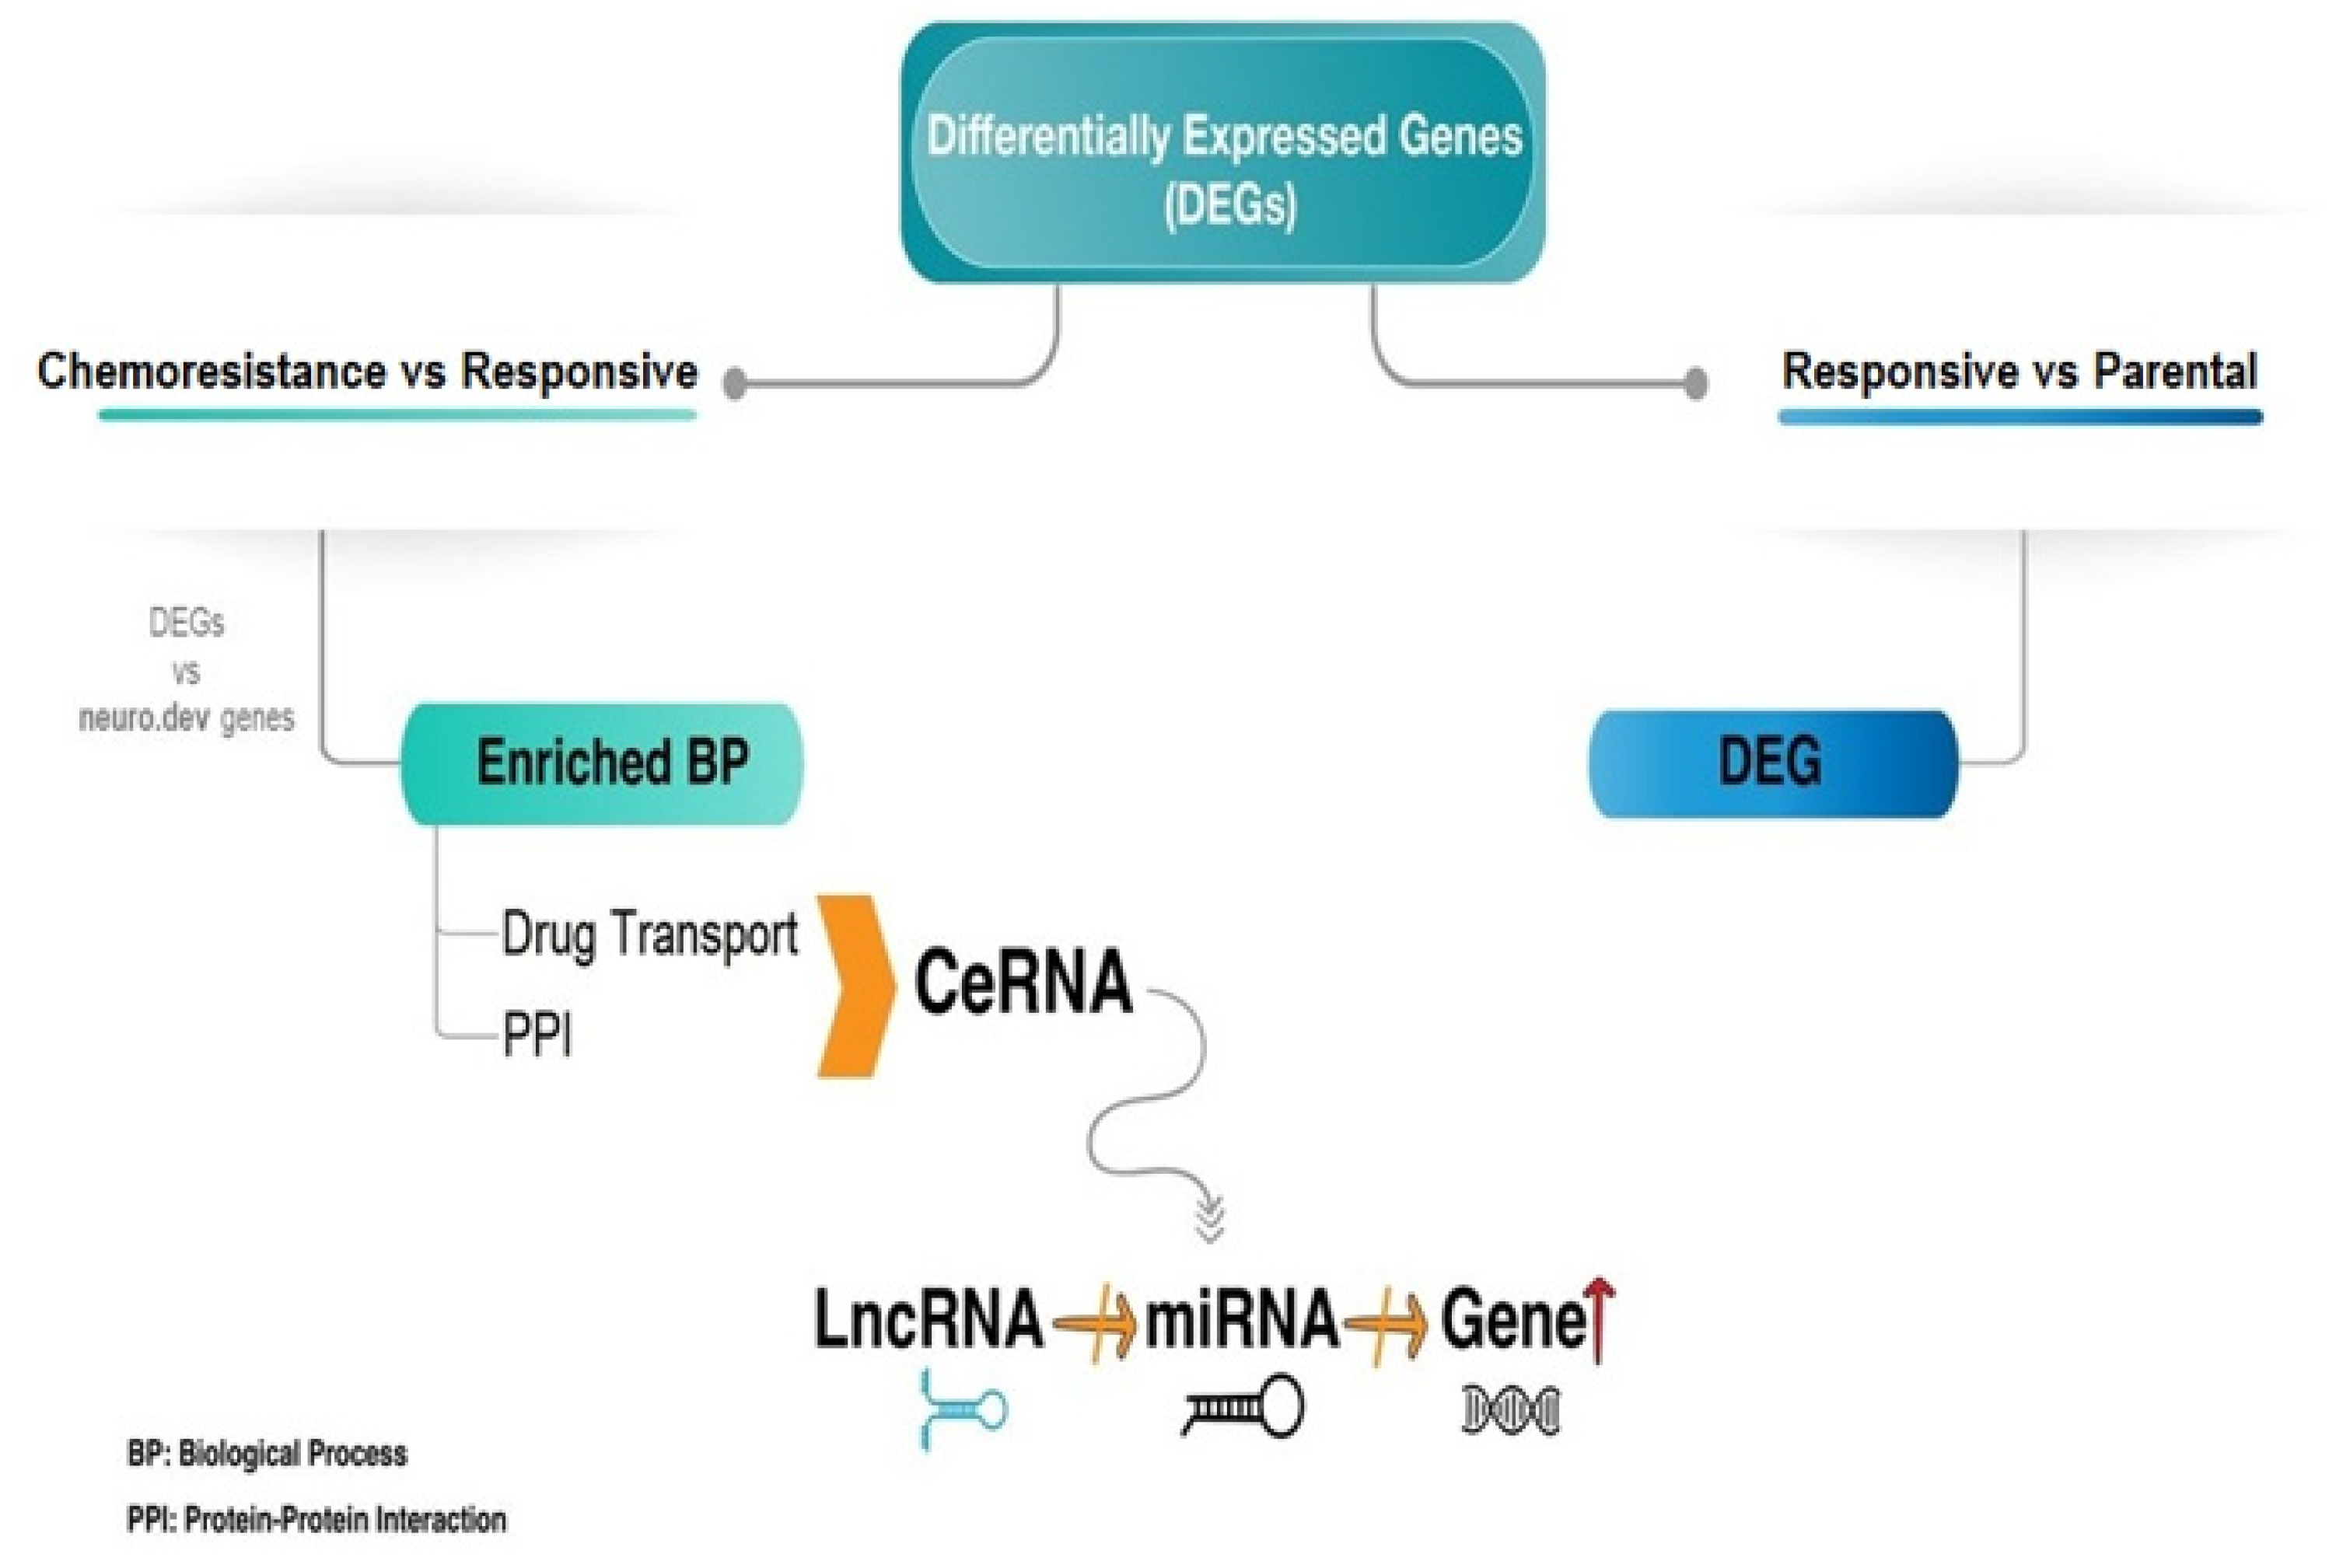
2.2. RNA-Seq Data Processing and Identification of Differentially Expressed Genes
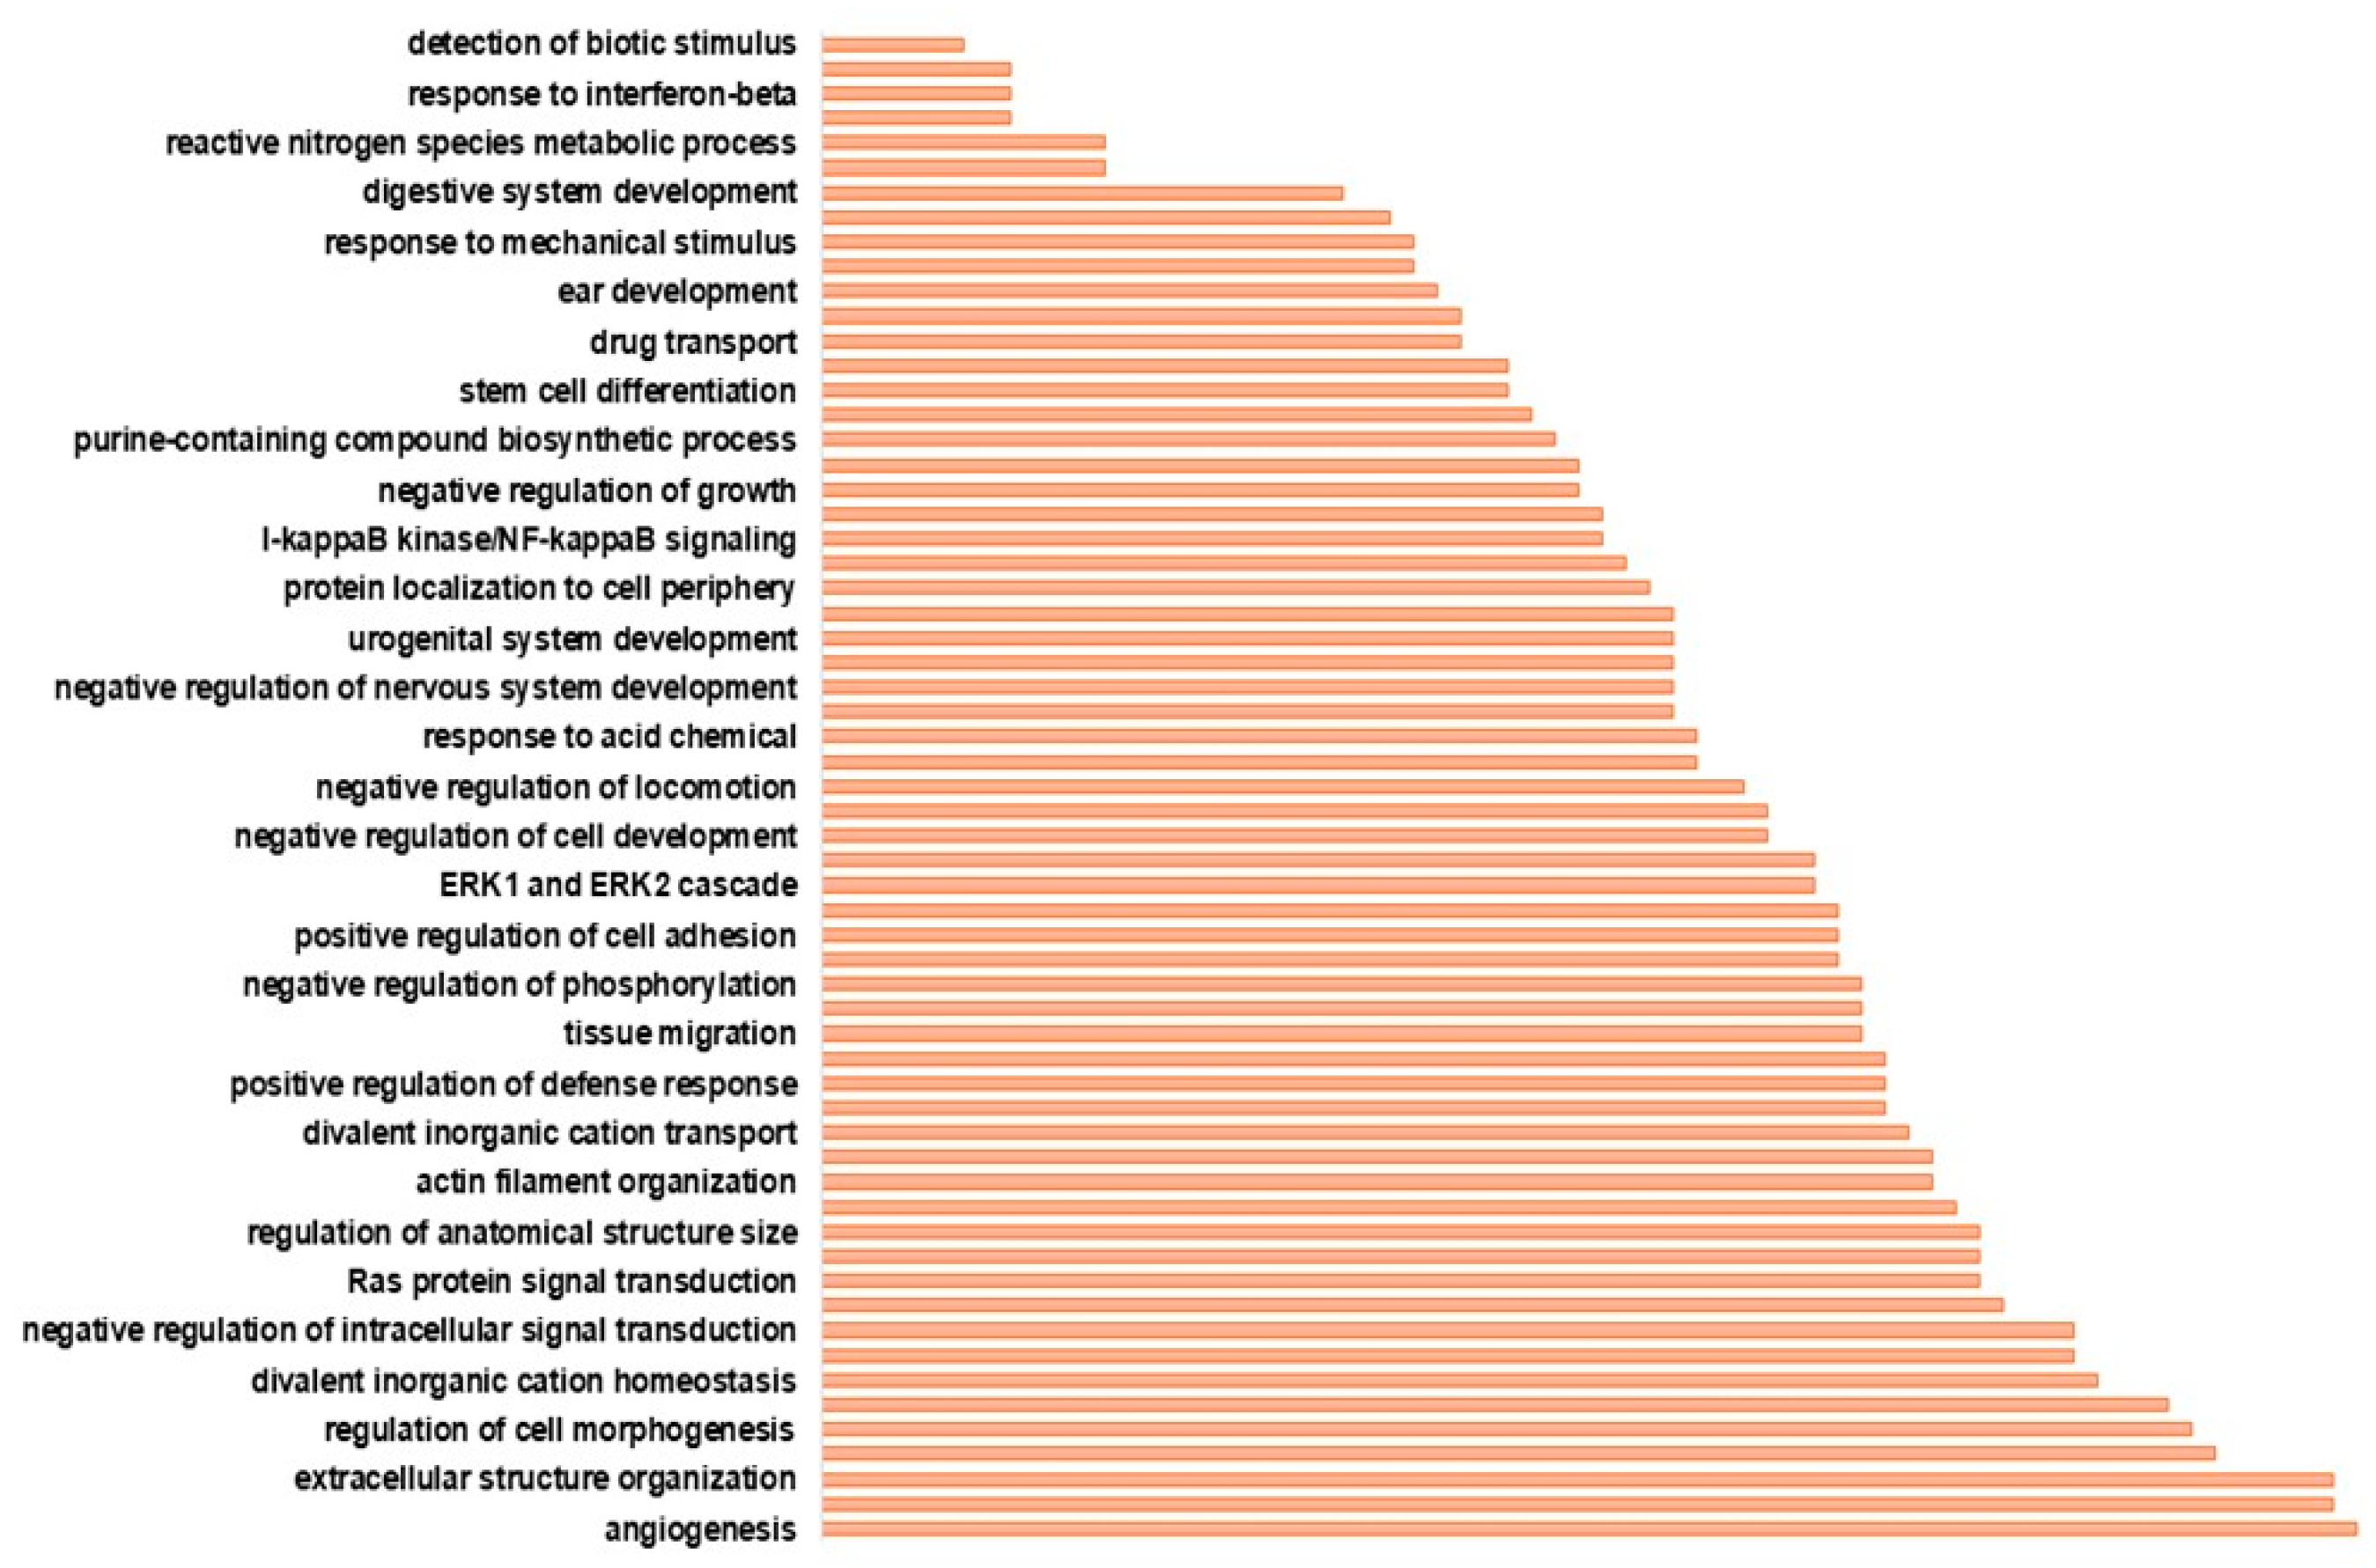
2.3. Gene Set Enrichment Analysis
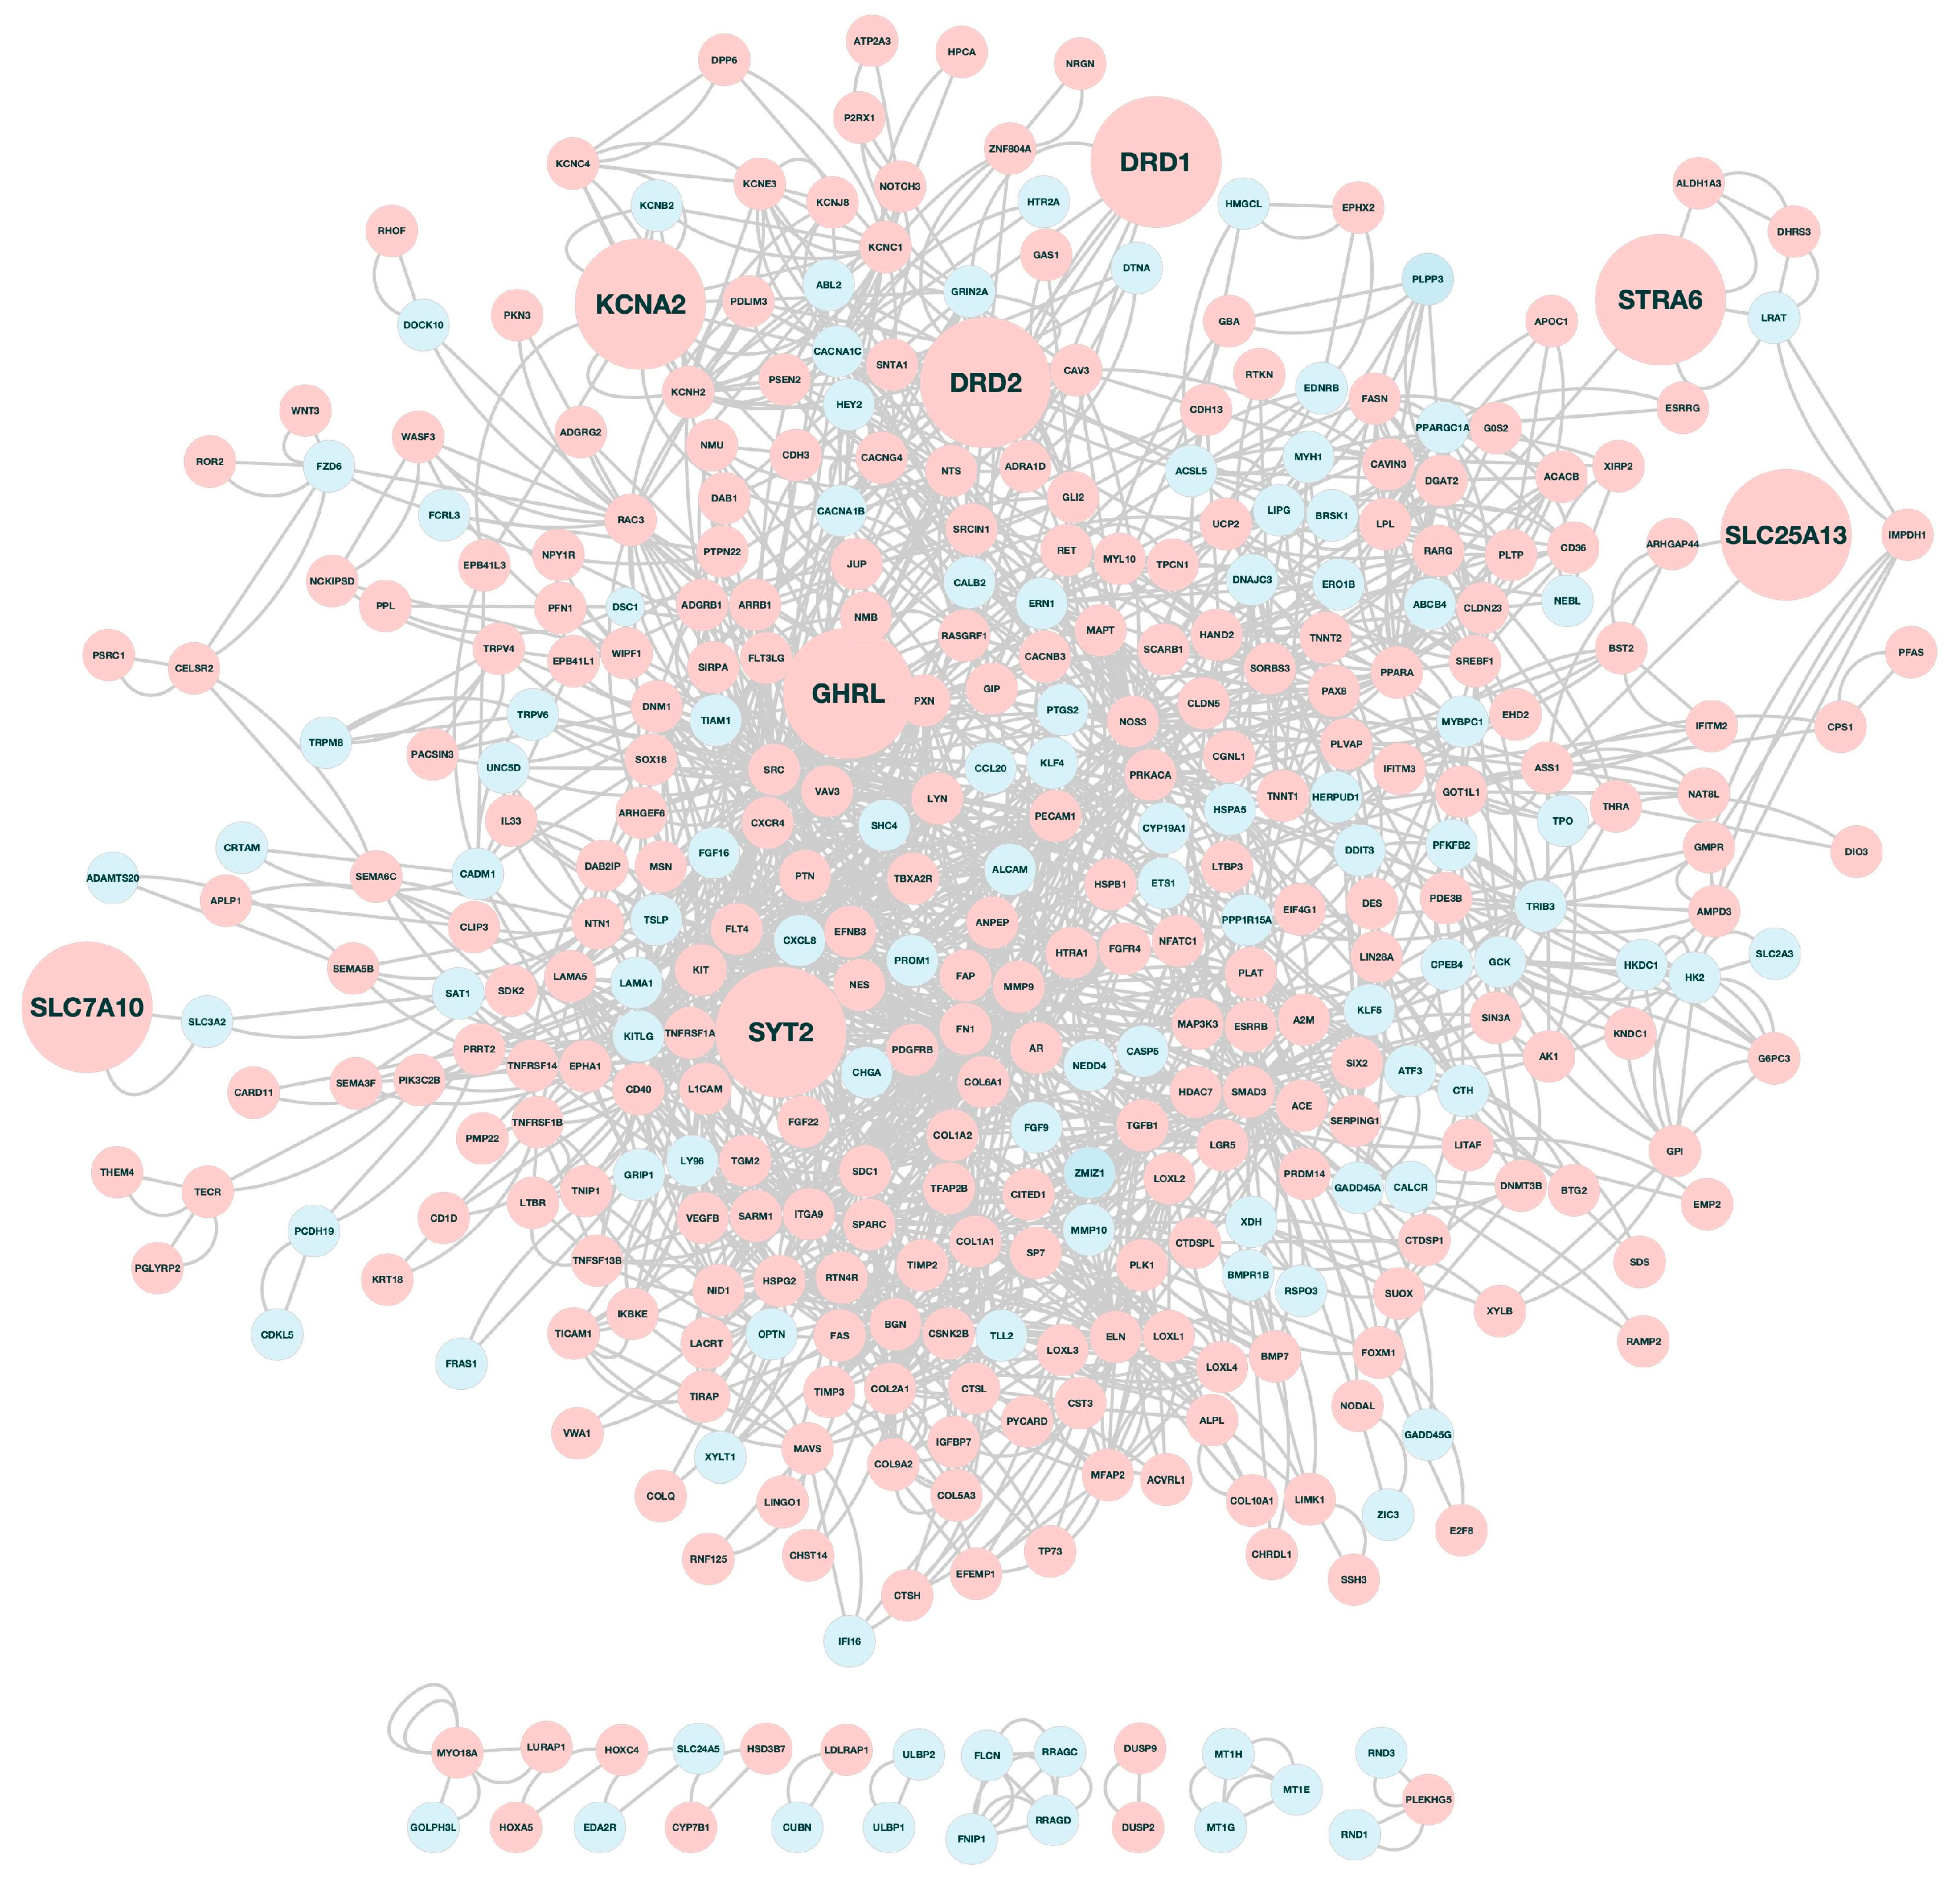
2.4. Functional Association Network
2.5. Epigenetic Regulators of Chemoresistant Genes
3. Results
3.1. Gene Expression Profiles of Ewing Sarcoma Drug Resistance
3.2. Functional Annotation Analysis
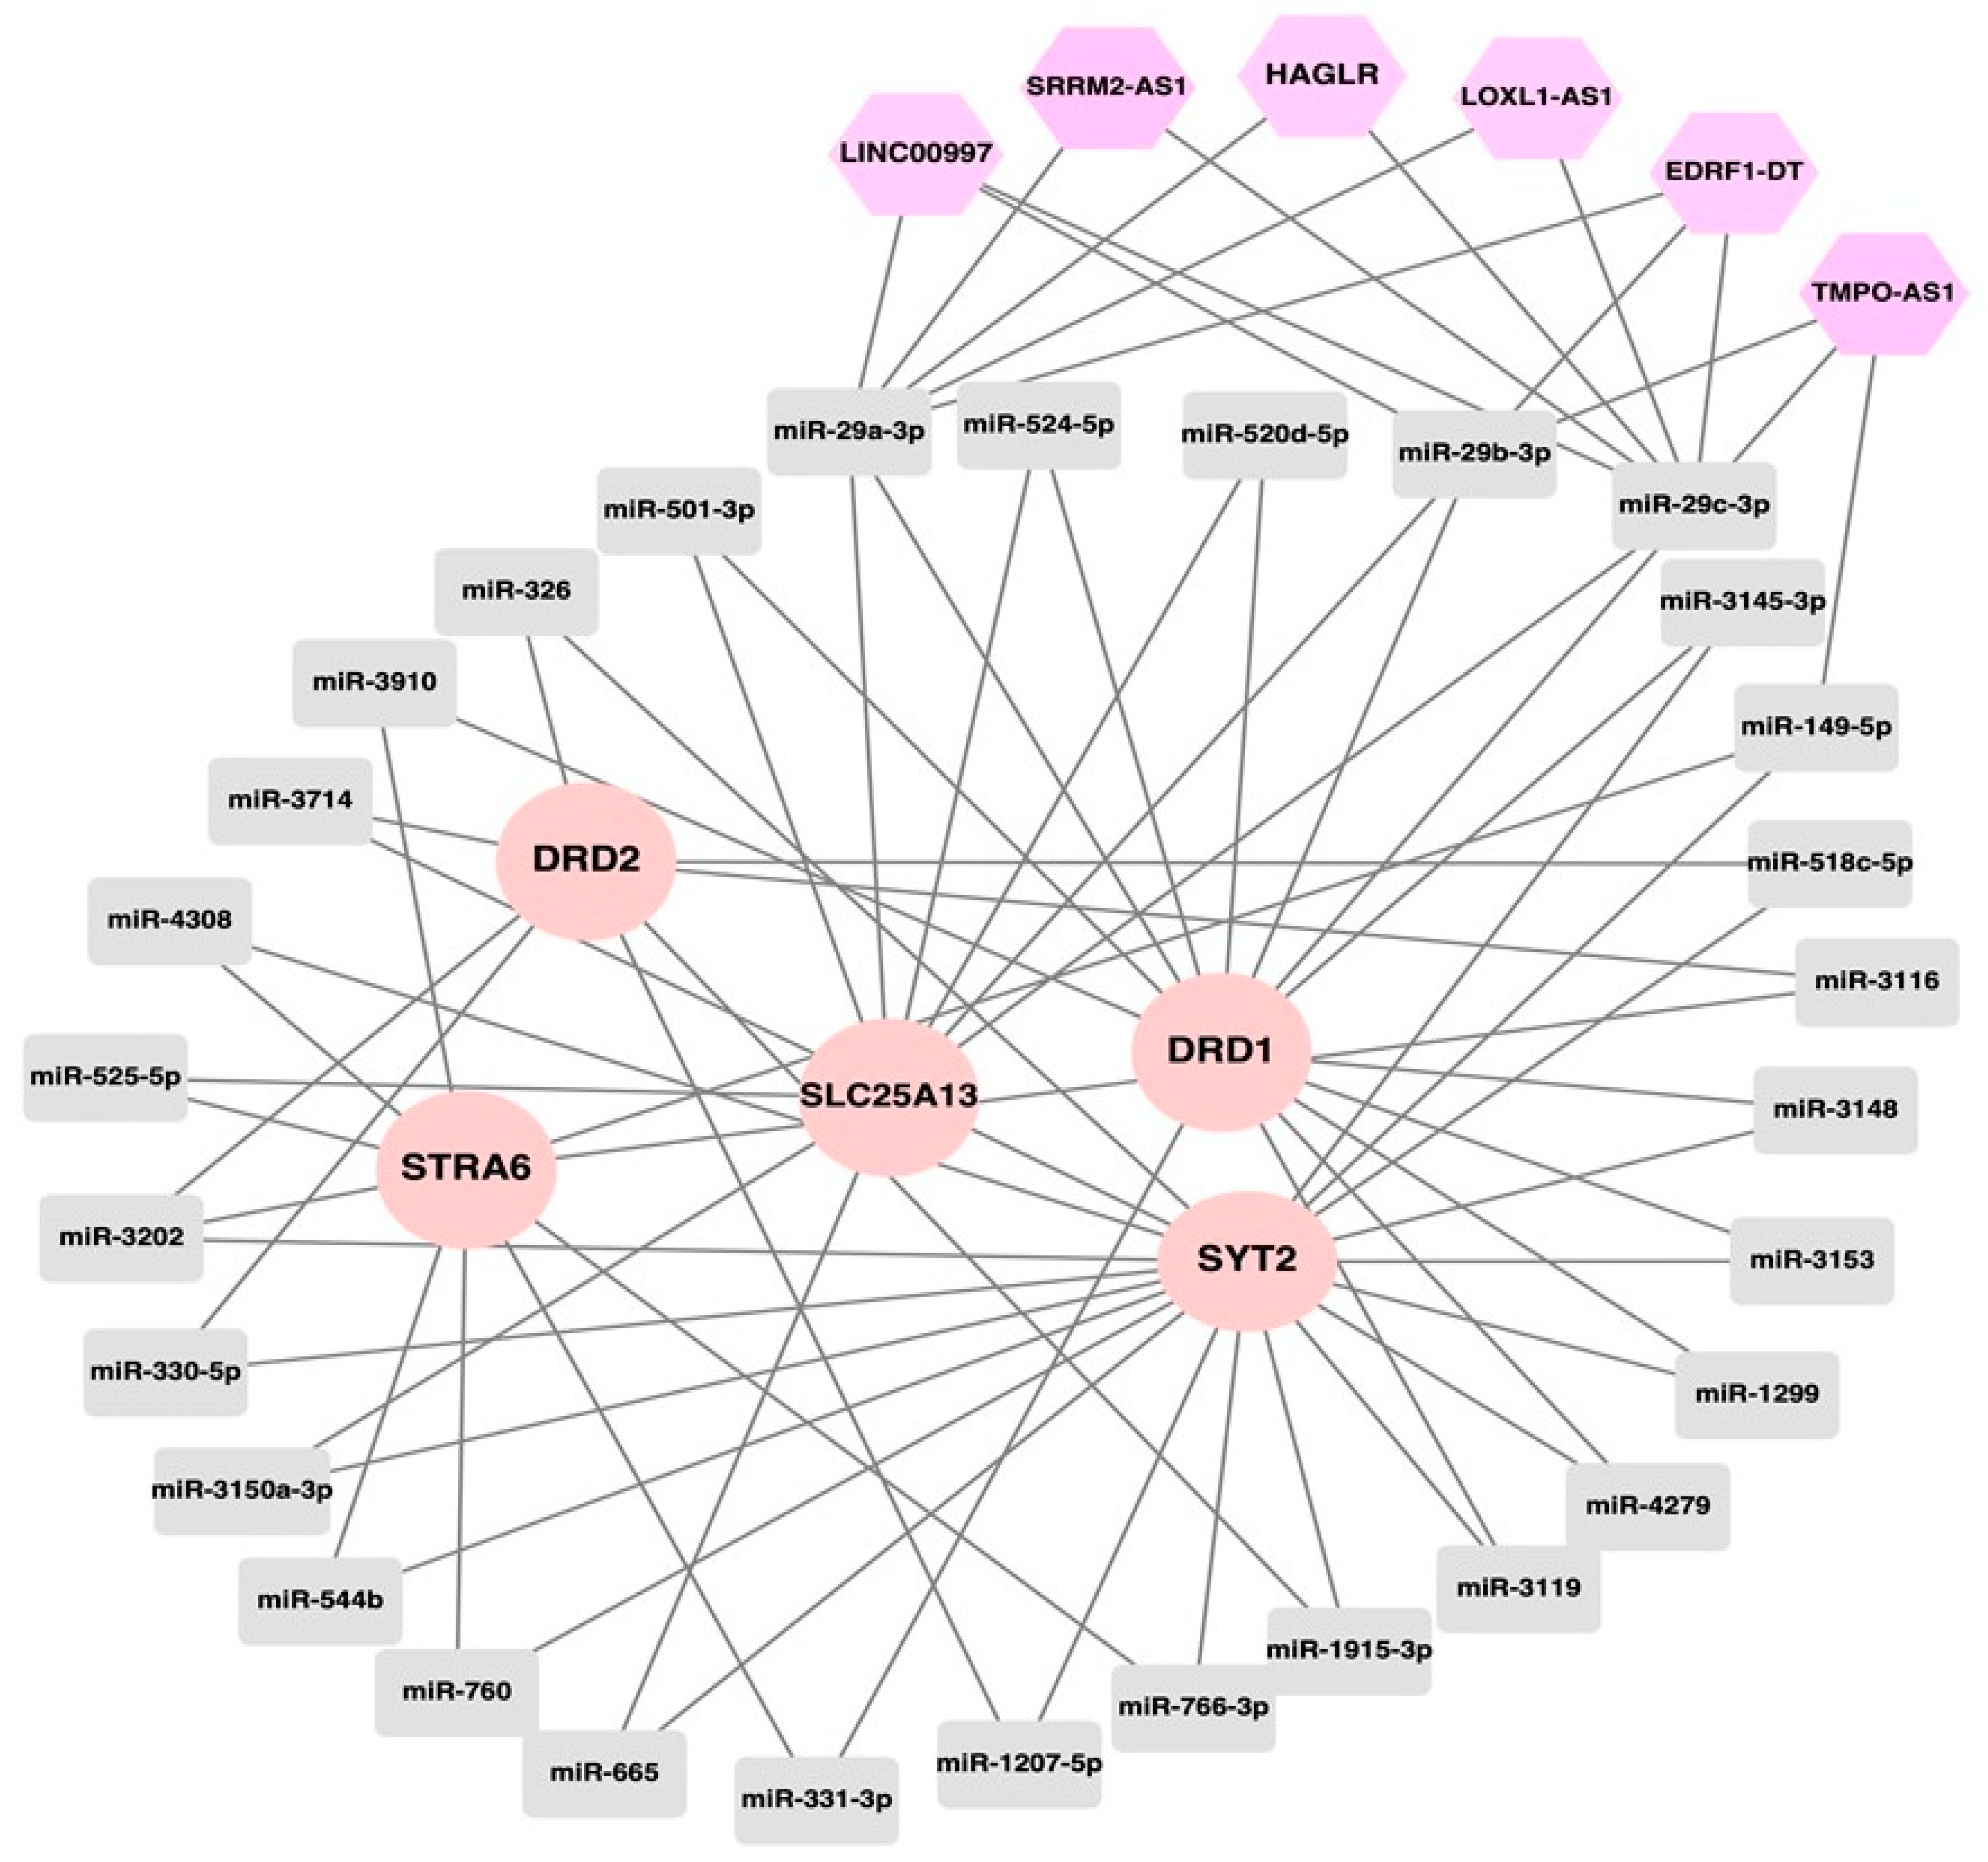
3.3. Epigenetic Regulatory Network of Drug Resistance-Relevant Genes
4. Discussion
Autonomic Nervous System and Drug Resistance
5. Conclusions
Supplementary Materials
Author Contributions
Funding
Institutional Review Board Statement
Informed Consent Statement
Data Availability Statement
Conflicts of Interest
References
- Yang, J.; Ren, Z.; Du, X.; Hao, M.; Zhou, W. The role of mesenchymal stem/progenitor cells in sarcoma: Update and dispute. Stem Cell Investig. 2014, 1, 18. [Google Scholar] [CrossRef]
- Burningham, Z.; Hashibe, M.; Spector, L.; Schiffman, J.D. The Epidemiology of Sarcoma. Clin. Sarcoma Res. 2012, 2, 14. [Google Scholar] [CrossRef] [Green Version]
- Khan, S.; Abid, Z.; Haider, G.; Bukhari, N.; Zehra, D.; Hashmi, M.; Abid, M.; Ibrahim, U. Incidence of Ewing’s Sarcoma in Different Age Groups, Their Associated Features, and Its Correlation with Primary Care Interval. Cureus 2021, 13, e13986. [Google Scholar] [CrossRef] [PubMed]
- WHO. Undifferentiated Small Round Cell Sarcoma of Bone and Soft Tissue: Ewing Sarcoma; International Agency for Research on Cancer: Lyon, France, 2020; Volume 3.
- Valery, P.C.; Holly, E.A.; Sleigh, A.C.; Williams, G.; Kreiger, N.; Bain, C. Hernias and Ewing’s sarcoma family of tumours: A pooled analysis and meta-analysis. Lancet Oncol. 2005, 6, 485–490. [Google Scholar] [CrossRef] [PubMed]
- Cope, J.U.; Tsokos, M.; Helman, L.J.; Gridley, G.; Tucker, M.A. Inguinal hernia in patients with Ewing sarcoma: A clue to etiology. Med. Pediatr. Oncol. 2000, 34, 195–199. [Google Scholar] [CrossRef]
- Alfarouk, K.O.; Stock, C.M.; Taylor, S.; Walsh, M.; Muddathir, A.K.; Verduzco, D.; Bashir, A.H.; Mohammed, O.Y.; Elhassan, G.O.; Harguindey, S.; et al. Resistance to cancer chemotherapy: Failure in drug response from ADME to P-gp. Cancer Cell Int. 2015, 15, 71. [Google Scholar] [CrossRef] [Green Version]
- Nikolaou, M.; Pavlopoulou, A.; Georgakilas, A.G.; Kyrodimos, E. The challenge of drug resistance in cancer treatment: A current overview. Clin. Exp. Metastasis 2018, 35, 309–318. [Google Scholar] [CrossRef]
- Gyorffy, B.; Surowiak, P.; Kiesslich, O.; Denkert, C.; Schafer, R.; Dietel, M.; Lage, H. Gene expression profiling of 30 cancer cell lines predicts resistance towards 11 anticancer drugs at clinically achieved concentrations. Int. J. Cancer 2006, 118, 1699–1712. [Google Scholar] [CrossRef] [PubMed] [Green Version]
- Kang, H.C.; Kim, I.J.; Park, J.H.; Shin, Y.; Ku, J.L.; Jung, M.S.; Yoo, B.C.; Kim, H.K.; Park, J.G. Identification of genes with differential expression in acquired drug-resistant gastric cancer cells using high-density oligonucleotide microarrays. Clin. Cancer Res. Off. J. Am. Assoc. Cancer Res. 2004, 10, 272–284. [Google Scholar] [CrossRef] [Green Version]
- Kim, S.C.; Shin, Y.K.; Kim, Y.A.; Jang, S.G.; Ku, J.L. Identification of genes inducing resistance to ionizing radiation in human rectal cancer cell lines: Re-sensitization of radio-resistant rectal cancer cells through down regulating NDRG1. BMC Cancer 2018, 18, 594. [Google Scholar] [CrossRef]
- Serafim, R.B.; da Silva, P.; Cardoso, C.; Di Cristofaro, L.F.M.; Netto, R.P.; de Almeida, R.; Navegante, G.; Storti, C.B.; de Sousa, J.F.; de Souza, F.C.; et al. Expression Profiling of Glioblastoma Cell Lines Reveals Novel Extracellular Matrix-Receptor Genes Correlated with the Responsiveness of Glioma Patients to Ionizing Radiation. Front. Oncol. 2021, 11, 668090. [Google Scholar] [CrossRef]
- Gibney, E.R.; Nolan, C.M. Epigenetics and gene expression. Heredity 2010, 105, 4–13. [Google Scholar] [CrossRef] [Green Version]
- Golbabapour, S.; Abdulla, M.A.; Hajrezaei, M. A concise review on epigenetic regulation: Insight into molecular mechanisms. Int. J. Mol. Sci. 2011, 12, 8661–8694. [Google Scholar] [CrossRef]
- Holoch, D.; Moazed, D. RNA-mediated epigenetic regulation of gene expression. Nat. Rev. Genet. 2015, 16, 71–84. [Google Scholar] [CrossRef] [Green Version]
- Kaikkonen, M.U.; Lam, M.T.; Glass, C.K. Non-coding RNAs as regulators of gene expression and epigenetics. Cardiovasc. Res. 2011, 90, 430–440. [Google Scholar] [CrossRef] [Green Version]
- Statello, L.; Guo, C.J.; Chen, L.L.; Huarte, M. Gene regulation by long non-coding RNAs and its biological functions. Nat. Rev. Mol. Cell Biol. 2021, 22, 96–118. [Google Scholar] [CrossRef] [PubMed]
- Zhang, X.; Wang, W.; Zhu, W.; Dong, J.; Cheng, Y.; Yin, Z.; Shen, F. Mechanisms and Functions of Long Non-Coding RNAs at Multiple Regulatory Levels. Int. J. Mol. Sci. 2019, 20, 5573. [Google Scholar] [CrossRef] [PubMed] [Green Version]
- O’Brien, J.; Hayder, H.; Zayed, Y.; Peng, C. Overview of MicroRNA Biogenesis, Mechanisms of Actions, and Circulation. Front. Endocrinol. 2018, 9, 402. [Google Scholar] [CrossRef] [PubMed] [Green Version]
- Ambros, V. The functions of animal microRNAs. Nature 2004, 431, 350–355. [Google Scholar] [CrossRef] [PubMed]
- Lewis, B.P.; Burge, C.B.; Bartel, D.P. Conserved seed pairing, often flanked by adenosines, indicates that thousands of human genes are microRNA targets. Cell 2005, 120, 15–20. [Google Scholar] [CrossRef] [Green Version]
- Si, W.; Shen, J.; Zheng, H.; Fan, W. The role and mechanisms of action of microRNAs in cancer drug resistance. Clin. Epigenet. 2019, 11, 25. [Google Scholar] [CrossRef] [PubMed]
- Allegra, A.; Ettari, R.; Innao, V.; Bitto, A. Potential Role of microRNAs in inducing Drug Resistance in Patients with Multiple Myeloma. Cells 2021, 10, 448. [Google Scholar] [CrossRef] [PubMed]
- Hu, X.Y.; Song, Z.; Yang, Z.W.; Li, J.J.; Liu, J.; Wang, H.S. Cancer drug resistance related microRNAs: Recent advances in detection methods. Analyst 2022, 147, 2615–2632. [Google Scholar] [CrossRef] [PubMed]
- Beylerli, O.; Gareev, I.; Sufianov, A.; Ilyasova, T.; Guang, Y. Long noncoding RNAs as promising biomarkers in cancer. Non-Coding RNA Res. 2022, 7, 66–70. [Google Scholar] [CrossRef] [PubMed]
- Chen, L.L. The expanding regulatory mechanisms and cellular functions of circular RNAs. Nat. Rev. Mol. Cell Biol. 2020, 21, 475–490. [Google Scholar] [CrossRef]
- Diener, C.; Keller, A.; Meese, E. Emerging concepts of miRNA therapeutics: From cells to clinic. Trends Genet. TIG 2022, 38, 613–626. [Google Scholar] [CrossRef]
- Kong, X.; Hu, S.; Yuan, Y.; Du, Y.; Zhu, Z.; Song, Z.; Lu, S.; Zhao, C.; Yan, D. Analysis of lncRNA, miRNA and mRNA-associated ceRNA networks and identification of potential drug targets for drug-resistant non-small cell lung cancer. J. Cancer 2020, 11, 3357–3368. [Google Scholar] [CrossRef] [Green Version]
- Liu, H.; Wang, S.; Zhou, S.; Meng, Q.; Ma, X.; Song, X.; Wang, L.; Jiang, W. Drug Resistance-Related Competing Interactions of lncRNA and mRNA across 19 Cancer Types. Mol. Ther. Nucleic Acids 2019, 16, 442–451. [Google Scholar] [CrossRef] [Green Version]
- Qu, Y.; Tan, H.Y.; Chan, Y.T.; Jiang, H.; Wang, N.; Wang, D. The functional role of long noncoding RNA in resistance to anticancer treatment. Ther. Adv. Med. Oncol. 2020, 12, 1758835920927850. [Google Scholar] [CrossRef]
- Liu, K.; Gao, L.; Ma, X.; Huang, J.J.; Chen, J.; Zeng, L.; Ashby, C.R., Jr.; Zou, C.; Chen, Z.S. Long non-coding RNAs regulate drug resistance in cancer. Mol. Cancer 2020, 19, 54. [Google Scholar] [CrossRef] [Green Version]
- Barrett, T.; Wilhite, S.E.; Ledoux, P.; Evangelista, C.; Kim, I.F.; Tomashevsky, M.; Marshall, K.A.; Phillippy, K.H.; Sherman, P.M.; Holko, M.; et al. NCBI GEO: Archive for functional genomics data sets--update. Nucleic Acids Res. 2013, 41, D991–D995. [Google Scholar] [CrossRef] [PubMed] [Green Version]
- Clough, E.; Barrett, T. The Gene Expression Omnibus Database. Methods Mol. Biol. 2016, 1418, 93–110. [Google Scholar] [CrossRef] [PubMed] [Green Version]
- Pishas, K.I.; Lessnick, S.L. Ewing sarcoma resistance to SP-2509 is not mediated through KDM1A/LSD1 mutation. Oncotarget 2018, 9, 36413–36429. [Google Scholar] [CrossRef] [PubMed] [Green Version]
- Alnasir, J.; Shanahan, H.P. Investigation into the annotation of protocol sequencing steps in the sequence read archive. GigaScience 2015, 4, 23. [Google Scholar] [CrossRef] [Green Version]
- Kim, D.; Langmead, B.; Salzberg, S.L. HISAT: A fast spliced aligner with low memory requirements. Nat. Methods 2015, 12, 357–360. [Google Scholar] [CrossRef] [Green Version]
- Li, H.; Handsaker, B.; Wysoker, A.; Fennell, T.; Ruan, J.; Homer, N.; Marth, G.; Abecasis, G.; Durbin, R.; Genome Project Data Processing, S. The Sequence Alignment/Map format and SAMtools. Bioinformatics 2009, 25, 2078–2079. [Google Scholar] [CrossRef] [Green Version]
- Pertea, M.; Pertea, G.M.; Antonescu, C.M.; Chang, T.C.; Mendell, J.T.; Salzberg, S.L. StringTie enables improved reconstruction of a transcriptome from RNA-seq reads. Nat. Biotechnol. 2015, 33, 290–295. [Google Scholar] [CrossRef] [Green Version]
- Robinson, M.D.; McCarthy, D.J.; Smyth, G.K. edgeR: A Bioconductor package for differential expression analysis of digital gene expression data. Bioinformatics 2010, 26, 139–140. [Google Scholar] [CrossRef] [Green Version]
- Benjamini, Y.; Hochberg, Y. Controlling the False Discovery Rate: A Practical and Powerful Approach to Multiple Testing. J. R. Stat. Soc. Ser. B 1995, 57, 289–300. [Google Scholar] [CrossRef]
- Tweedie, S.; Braschi, B.; Gray, K.; Jones, T.E.M.; Seal, R.L.; Yates, B.; Bruford, E.A. Genenames.org: The HGNC and VGNC resources in 2021. Nucleic Acids Res. 2021, 49, D939–D946. [Google Scholar] [CrossRef]
- Kirov, S.; Ji, R.; Wang, J.; Zhang, B. Functional annotation of differentially regulated gene set using WebGestalt: A gene set predictive of response to ipilimumab in tumor biopsies. Methods Mol. Biol. 2014, 1101, 31–42. [Google Scholar] [CrossRef] [PubMed]
- Liao, Y.; Wang, J.; Jaehnig, E.J.; Shi, Z.; Zhang, B. WebGestalt 2019: Gene set analysis toolkit with revamped UIs and APIs. Nucleic Acids Res. 2019, 47, W199–W205. [Google Scholar] [CrossRef] [PubMed] [Green Version]
- Szklarczyk, D.; Gable, A.L.; Nastou, K.C.; Lyon, D.; Kirsch, R.; Pyysalo, S.; Doncheva, N.T.; Legeay, M.; Fang, T.; Bork, P.; et al. The STRING database in 2021: Customizable protein-protein networks, and functional characterization of user-uploaded gene/measurement sets. Nucleic Acids Res. 2021, 49, D605–D612. [Google Scholar] [CrossRef] [PubMed]
- Shannon, P.; Markiel, A.; Ozier, O.; Baliga, N.S.; Wang, J.T.; Ramage, D.; Amin, N.; Schwikowski, B.; Ideker, T. Cytoscape: A software environment for integrated models of biomolecular interaction networks. Genome Res. 2003, 13, 2498–2504. [Google Scholar] [CrossRef]
- Paraskevopoulou, M.D.; Georgakilas, G.; Kostoulas, N.; Vlachos, I.S.; Vergoulis, T.; Reczko, M.; Filippidis, C.; Dalamagas, T.; Hatzigeorgiou, A.G. DIANA-microT web server v5.0: Service integration into miRNA functional analysis workflows. Nucleic Acids Res. 2013, 41, W169–W173. [Google Scholar] [CrossRef] [Green Version]
- Agarwal, V.; Bell, G.W.; Nam, J.W.; Bartel, D.P. Predicting effective microRNA target sites in mammalian mRNAs. eLife 2015, 4, e05005. [Google Scholar] [CrossRef]
- Chen, Y.; Wang, X. miRDB: An online database for prediction of functional microRNA targets. Nucleic Acids Res. 2020, 48, D127–D131. [Google Scholar] [CrossRef] [Green Version]
- Liu, W.; Wang, X. Prediction of functional microRNA targets by integrative modeling of microRNA binding and target expression data. Genome Biol. 2019, 20, 18. [Google Scholar] [CrossRef]
- Krek, A.; Grun, D.; Poy, M.N.; Wolf, R.; Rosenberg, L.; Epstein, E.J.; MacMenamin, P.; da Piedade, I.; Gunsalus, K.C.; Stoffel, M.; et al. Combinatorial microRNA target predictions. Nat. Genet. 2005, 37, 495–500. [Google Scholar] [CrossRef]
- Karagkouni, D.; Paraskevopoulou, M.D.; Tastsoglou, S.; Skoufos, G.; Karavangeli, A.; Pierros, V.; Zacharopoulou, E.; Hatzigeorgiou, A.G. DIANA-LncBase v3: Indexing experimentally supported miRNA targets on non-coding transcripts. Nucleic Acids Res. 2020, 48, D101–D110. [Google Scholar] [CrossRef]
- Sherlach, K.S.; Roepe, P.D. Drug resistance associated membrane proteins. Front. Physiol. 2014, 5, 108. [Google Scholar] [CrossRef] [PubMed] [Green Version]
- Anderson, J.T.; Huang, K.M.; Lustberg, M.B.; Sparreboom, A.; Hu, S. Solute Carrier Transportome in Chemotherapy-Induced Adverse Drug Reactions. Rev. Physiol. Biochem. Pharmacol. 2022, 183, 177–215. [Google Scholar] [CrossRef] [PubMed]
- Elebiyo, T.C.; Rotimi, D.; Evbuomwan, I.O.; Maimako, R.F.; Iyobhebhe, M.; Ojo, O.A.; Oluba, O.M.; Adeyemi, O.S. Reassessing vascular endothelial growth factor (VEGF) in anti-angiogenic cancer therapy. Cancer Treat. Res. Commun. 2022, 32, 100620. [Google Scholar] [CrossRef]
- Pavlopoulou, A.; Oktay, Y.; Vougas, K.; Louka, M.; Vorgias, C.E.; Georgakilas, A.G. Determinants of resistance to chemotherapy and ionizing radiation in breast cancer stem cells. Cancer Lett. 2016, 380, 485–493. [Google Scholar] [CrossRef] [PubMed]
- Joyce, H.; McCann, A.; Clynes, M.; Larkin, A. Influence of multidrug resistance and drug transport proteins on chemotherapy drug metabolism. Expert Opin. Drug Metab. Toxicol. 2015, 11, 795–809. [Google Scholar] [CrossRef] [PubMed]
- Barabasi, A.L.; Gulbahce, N.; Loscalzo, J. Network medicine: A network-based approach to human disease. Nat. Rev. Genet. 2011, 12, 56–68. [Google Scholar] [CrossRef] [Green Version]
- Sun, J.; Jiang, Z.; Li, Y.; Wang, K.; Chen, X.; Liu, G. Downregulation of miR-21 inhibits the malignant phenotype of pancreatic cancer cells by targeting VHL. OncoTargets Ther. 2019, 12, 7215–7226. [Google Scholar] [CrossRef] [Green Version]
- Zhang, X.; Wang, S.; Wang, H.; Cao, J.; Huang, X.; Chen, Z.; Xu, P.; Sun, G.; Xu, J.; Lv, J.; et al. Circular RNA circNRIP1 acts as a microRNA-149-5p sponge to promote gastric cancer progression via the AKT1/mTOR pathway. Mol. Cancer 2019, 18, 20. [Google Scholar] [CrossRef] [Green Version]
- Zhou, L.; Jiang, F.; Chen, X.; Liu, Z.; Ouyang, Y.; Zhao, W.; Yu, D. Downregulation of miR-221/222 by a microRNA sponge promotes apoptosis in oral squamous cell carcinoma cells through upregulation of PTEN. Oncol. Lett. 2016, 12, 4419–4426. [Google Scholar] [CrossRef] [Green Version]
- Ekimler, S.; Sahin, K. Computational Methods for MicroRNA Target Prediction. Genes 2014, 5, 671–683. [Google Scholar] [CrossRef] [Green Version]
- Hamzeiy, H.; Allmer, J.; Yousef, M. Computational methods for microRNA target prediction. Methods Mol. Biol. 2014, 1107, 207–221. [Google Scholar] [CrossRef] [PubMed]
- Quillet, A.; Saad, C.; Ferry, G.; Anouar, Y.; Vergne, N.; Lecroq, T.; Dubessy, C. Improving Bioinformatics Prediction of microRNA Targets by Ranks Aggregation. Front. Genet. 2019, 10, 1330. [Google Scholar] [CrossRef] [PubMed] [Green Version]
- Jiang, H.; Zhang, G.; Wu, J.H.; Jiang, C.P. Diverse roles of miR-29 in cancer (review). Oncol. Rep. 2014, 31, 1509–1516. [Google Scholar] [CrossRef] [Green Version]
- Muniyappa, M.K.; Dowling, P.; Henry, M.; Meleady, P.; Doolan, P.; Gammell, P.; Clynes, M.; Barron, N. MiRNA-29a regulates the expression of numerous proteins and reduces the invasiveness and proliferation of human carcinoma cell lines. Eur. J. Cancer 2009, 45, 3104–3118. [Google Scholar] [CrossRef]
- Li, W.; Zhang, B.; Jia, Y.; Shi, H.; Wang, H.; Guo, Q.; Li, H. LncRNA LOXL1-AS1 regulates the tumorigenesis and development of lung adenocarcinoma through sponging miR-423-5p and targeting MYBL2. Cancer Med. 2020, 9, 689–699. [Google Scholar] [CrossRef] [Green Version]
- Wu, C.; Zhang, J. Long non-conding RNA LOXL1-AS1 sponges miR-589-5p to up-regulate CBX5 expression in renal cell carcinoma. Biosci. Rep. 2020, 40, BSR20200212. [Google Scholar] [CrossRef] [PubMed]
- Xie, N.; Fei, X.; Liu, S.; Liao, J.; Li, Y. LncRNA LOXL1-AS1 promotes invasion and proliferation of non-small-cell lung cancer through targeting miR-324-3p. Am. J. Transl. Res. 2019, 11, 6403–6412. [Google Scholar] [PubMed]
- Yu, W.; Dai, Y. lncRNA LOXL1-AS1 promotes liver cancer cell proliferation and migration by regulating the miR-377-3p/NFIB axis. Oncol. Lett. 2021, 22, 624. [Google Scholar] [CrossRef] [PubMed]
- Hu, J.; Huang, L.; Ding, Q.; Lv, J.; Chen, Z. Long noncoding RNA HAGLR sponges miR-338-3p to promote 5-Fu resistance in gastric cancer through targeting the LDHA-glycolysis pathway. Cell Biol. Int. 2021, 46, 173–184. [Google Scholar] [CrossRef]
- Yang, C.; Shen, S.; Zheng, X.; Ye, K.; Sun, Y.; Lu, Y.; Ge, H. Long noncoding RNA HAGLR acts as a microRNA-143-5p sponge to regulate epithelial-mesenchymal transition and metastatic potential in esophageal cancer by regulating LAMP3. FASEB J. Off. Publ. Fed. Am. Soc. Exp. Biol. 2019, 33, 10490–10504. [Google Scholar] [CrossRef]
- Zou, J.; Wu, K.; Lin, C.; Jie, Z.G. LINC00319 acts as a microRNA-335-5p sponge to accelerate tumor growth and metastasis in gastric cancer by upregulating ADCY3. Am. J. Physiol. Gastrointest. Liver Physiol. 2020, 318, G10–G22. [Google Scholar] [CrossRef] [PubMed]
- Chang, H.; Yao, Y. lncRNA TMPO antisense RNA 1 promotes the malignancy of cholangiocarcinoma cells by regulating let-7g-5p/high-mobility group A1 axis. Bioengineered 2022, 13, 2889–2901. [Google Scholar] [CrossRef] [PubMed]
- Liu, G.; Yang, H.; Cao, L.; Han, K.; Li, G. LncRNA TMPO-AS1 Promotes Proliferation and Invasion by Sponging miR-383-5p in Glioma Cells. Cancer Manag. Res. 2020, 12, 12001–12009. [Google Scholar] [CrossRef] [PubMed]
- Wang, Y.; Ma, J.; Li, R.; Gao, X.; Wang, H.; Jiang, G. LncRNA TMPO-AS1 serves as a sponge for miR-4731-5p modulating breast cancer progression through FOXM1. Am. J. Transl. Res. 2021, 13, 11094–11106. [Google Scholar]
- Welch, D.; Kahen, E.; Fridley, B.; Brohl, A.S.; Cubitt, C.L.; Reed, D.R. Small molecule inhibition of lysine-specific demethylase 1 (LSD1) and histone deacetylase (HDAC) alone and in combination in Ewing sarcoma cell lines. PLoS ONE 2019, 14, e0222228. [Google Scholar] [CrossRef]
- Kozub, M.M.; Carr, R.M.; Lomberk, G.L.; Fernandez-Zapico, M.E. LSD1, a double-edged sword, confers dynamic chromatin regulation but commonly promotes aberrant cell growth. F1000Research 2017, 6, 2016. [Google Scholar] [CrossRef] [Green Version]
- Maiques-Diaz, A.; Somervaille, T.C. LSD1: Biologic roles and therapeutic targeting. Epigenomics 2016, 8, 1103–1116. [Google Scholar] [CrossRef] [Green Version]
- Huang, Z.; Li, S.; Song, W.; Li, X.; Li, Q.; Zhang, Z.; Han, Y.; Zhang, X.; Miao, S.; Du, R.; et al. Lysine-specific demethylase 1 (LSD1/KDM1A) contributes to colorectal tumorigenesis via activation of the Wnt/beta-catenin pathway by down-regulating Dickkopf-1 (DKK1). PLoS ONE 2013, 8, e70077. [Google Scholar] [CrossRef]
- Kashyap, V.; Ahmad, S.; Nilsson, E.M.; Helczynski, L.; Kenna, S.; Persson, J.L.; Gudas, L.J.; Mongan, N.P. The lysine specific demethylase-1 (LSD1/KDM1A) regulates VEGF-A expression in prostate cancer. Mol. Oncol. 2013, 7, 555–566. [Google Scholar] [CrossRef]
- Lim, S.; Janzer, A.; Becker, A.; Zimmer, A.; Schule, R.; Buettner, R.; Kirfel, J. Lysine-specific demethylase 1 (LSD1) is highly expressed in ER-negative breast cancers and a biomarker predicting aggressive biology. Carcinogenesis 2010, 31, 512–520. [Google Scholar] [CrossRef]
- Magliulo, D.; Bernardi, R.; Messina, S. Lysine-Specific Demethylase 1A as a Promising Target in Acute Myeloid Leukemia. Front. Oncol. 2018, 8, 255. [Google Scholar] [CrossRef] [PubMed] [Green Version]
- Rondou, P.; Haegeman, G.; Van Craenenbroeck, K. The dopamine D4 receptor: Biochemical and signalling properties. Cell. Mol. Life Sci. CMLS 2010, 67, 1971–1986. [Google Scholar] [CrossRef]
- Undieh, A.S. Pharmacology of signaling induced by dopamine D(1)-like receptor activation. Pharmacol. Ther. 2010, 128, 37–60. [Google Scholar] [CrossRef] [PubMed] [Green Version]
- Lin, L.; Yee, S.W.; Kim, R.B.; Giacomini, K.M. SLC transporters as therapeutic targets: Emerging opportunities. Nat. Rev. Drug Discov. 2015, 14, 543–560. [Google Scholar] [CrossRef] [Green Version]
- Li, Q.; Shu, Y. Role of solute carriers in response to anticancer drugs. Mol. Cell. Ther. 2014, 2, 15. [Google Scholar] [CrossRef] [PubMed] [Green Version]
- Rosas-Cruz, A.; Salinas-Jazmin, N.; Velazquez, M.A.V. Dopamine Receptors in Cancer: Are They Valid Therapeutic Targets? Technol. Cancer Res. Treat. 2021, 20, 15330338211027913. [Google Scholar] [CrossRef]
- Weissenrieder, J.S.; Neighbors, J.D.; Mailman, R.B.; Hohl, R.J. Cancer and the Dopamine D2 Receptor: A Pharmacological Perspective. J. Pharmacol. Exp. Ther. 2019, 370, 111–126. [Google Scholar] [CrossRef]
- Sung, H.Y.; Han, J.; Ju, W.; Ahn, J.H. Synaptotagmin-like protein 2 gene promotes the metastatic potential in ovarian cancer. Oncol. Rep. 2016, 36, 535–541. [Google Scholar] [CrossRef] [Green Version]
- Skibola, D.R.; Smith, M.T.; Bracci, P.M.; Hubbard, A.E.; Agana, L.; Chi, S.; Holly, E.A. Polymorphisms in ghrelin and neuropeptide Y genes are associated with non-Hodgkin lymphoma. Cancer Epidemiol. Biomark. Prev. 2005, 14, 1251–1256. [Google Scholar] [CrossRef] [Green Version]
- Syrbe, S.; Hedrich, U.B.S.; Riesch, E.; Djemie, T.; Muller, S.; Moller, R.S.; Maher, B.; Hernandez-Hernandez, L.; Synofzik, M.; Caglayan, H.S.; et al. De novo loss- or gain-of-function mutations in KCNA2 cause epileptic encephalopathy. Nat. Genet. 2015, 47, 393–399. [Google Scholar] [CrossRef]
- Bouillet, P.; Sapin, V.; Chazaud, C.; Messaddeq, N.; Decimo, D.; Dolle, P.; Chambon, P. Developmental expression pattern of Stra6, a retinoic acid-responsive gene encoding a new type of membrane protein. Mech. Dev. 1997, 63, 173–186. [Google Scholar] [CrossRef]
- Rutter, A.R.; Fradley, R.L.; Garrett, E.M.; Chapman, K.L.; Lawrence, J.M.; Rosahl, T.W.; Patel, S. Evidence from gene knockout studies implicates Asc-1 as the primary transporter mediating d-serine reuptake in the mouse CNS. Eur. J. Neurosci. 2007, 25, 1757–1766. [Google Scholar] [CrossRef] [PubMed]
- Gaynes, J.S.; Jonart, L.M.; Zamora, E.A.; Naumann, J.A.; Gossai, N.P.; Gordon, P.M. The central nervous system microenvironment influences the leukemia transcriptome and enhances leukemia chemo-resistance. Haematologica 2017, 102, e136–e139. [Google Scholar] [CrossRef] [Green Version]
- Zhao, C.M.; Hayakawa, Y.; Kodama, Y.; Muthupalani, S.; Westphalen, C.B.; Andersen, G.T.; Flatberg, A.; Johannessen, H.; Friedman, R.A.; Renz, B.W.; et al. Denervation suppresses gastric tumorigenesis. Sci. Transl. Med. 2014, 6, 250ra115. [Google Scholar] [CrossRef] [Green Version]
- Logotheti, S.; Marquardt, S.; Richter, C.; Sophie Hain, R.; Murr, N.; Takan, I.; Pavlopoulou, A.; Pützer, B.M. Neural Networks Recapitulation by Cancer Cells Promotes Disease Progression: A Novel Role of p73 Isoforms in Cancer-Neuronal Crosstalk. Cancers 2020, 12, 3789. [Google Scholar] [CrossRef] [PubMed]
- Russell-Goldman, E.; Hornick, J.L.; Qian, X.; Jo, V.Y. NKX2.2 immunohistochemistry in the distinction of Ewing sarcoma from cytomorphologic mimics: Diagnostic utility and pitfalls. Cancer Cytopathol. 2018, 126, 942–949. [Google Scholar] [CrossRef] [PubMed] [Green Version]
- Peter, M.; Couturier, J.; Pacquement, H.; Michon, J.; Thomas, G.; Magdelenat, H.; Delattre, O. A new member of the ETS family fused to EWS in Ewing tumors. Oncogene 1997, 14, 1159–1164. [Google Scholar] [CrossRef] [Green Version]
- Tsuda, Y.; Dickson, B.C.; Swanson, D.; Sung, Y.S.; Zhang, L.; Meyers, P.; Healey, J.H.; Antonescu, C.R. Ewing sarcoma with FEV gene rearrangements is a rare subset with predilection for extraskeletal locations and aggressive behavior. Genes Chromosomes Cancer 2020, 59, 286–294. [Google Scholar] [CrossRef]
- Shibuya, R.; Matsuyama, A.; Nakamoto, M.; Shiba, E.; Kasai, T.; Hisaoka, M. The combination of CD99 and NKX2.2, a transcriptional target of EWSR1-FLI1, is highly specific for the diagnosis of Ewing sarcoma. Virchows Arch. 2014, 465, 599–605. [Google Scholar] [CrossRef]
- Malt, E.A.; Juhasz, K.; Malt, U.F.; Naumann, T. A Role for the Transcription Factor Nk2 Homeobox 1 in Schizophrenia: Convergent Evidence from Animal and Human Studies. Front. Behav. Neurosci. 2016, 10, 59. [Google Scholar] [CrossRef] [Green Version]
- Ferguson, A.V.; Bains, J.S. Actions of angiotensin in the subfornical organ and area postrema: Implications for long term control of autonomic output. Clin. Exp. Pharmacol. Physiol. 1997, 24, 96–101. [Google Scholar] [CrossRef]
- Leon, T.Y.; Ngan, E.S.; Poon, H.C.; So, M.T.; Lui, V.C.; Tam, P.K.; Garcia-Barcelo, M.M. Transcriptional regulation of RET by Nkx2-1, Phox2b, Sox10, and Pax3. J. Pediatr. Surg. 2009, 44, 1904–1912. [Google Scholar] [CrossRef] [PubMed] [Green Version]
- Camilleri, M.; Wieben, E.; Eckert, D.; Carlson, P.; Hurley O’Dwyer, R.; Gibbons, D.; Acosta, A.; Klee, E.W. Familial chronic megacolon presenting in childhood or adulthood: Seeking the presumed gene association. Neurogastroenterol. Motil. 2019, 31, e13550. [Google Scholar] [CrossRef] [PubMed]
- Danková, M.; Tóth, Š.; Holodová, M.; Fagová, Z.; Čurgali, K.; Mechírová, E.; Maretta, M.; Nemcová, R.; Gancarčíková, S.; Polák, Š. Immunohistochemical visualisation of the enteric nervous system architecture in the germ-free piglets. J. Mol. Histol. 2022, 53, 773–780. [Google Scholar] [CrossRef]
- Costes, L.M.; Boeckxstaens, G.E.; de Jonge, W.J.; Cailotto, C. Neural networks in intestinal immunoregulation. Organogenesis 2013, 9, 216–223. [Google Scholar] [CrossRef] [PubMed]
- Sternini, C. Organization of the peripheral nervous system: Autonomic and sensory ganglia. J. Investig. Dermatol. Symp. Proc. 1997, 2, 1–7. [Google Scholar] [CrossRef]
- Geronikolou, S.A.; Albanopoulos, K.; Chrousos, G.; Cokkinos, D. Evaluating the Homeostasis Assessment Model Insulin Resistance and the Cardiac Autonomic System in Bariatric Surgery Patients: A Meta-Analysis. Adv. Exp. Med. Biol. 2017, 988, 249–259. [Google Scholar] [CrossRef]
- Geronikolou, S.A.; Pavlopoulou, A.; Cokkinos, D.; Chrousos, G. Interactome of Obesity: Obesidome: Genetic Obesity, Stress Induced Obesity, Pathogenic Obesity Interaction. Adv. Exp. Med. Biol. 2017, 987, 233–241. [Google Scholar] [CrossRef]
- Molteni, A.; Ward, W.F.; Ts’ao, C.H.; Taylor, J.; Small, W., Jr.; Brizio-Molteni, L.; Veno, P.A. Cytostatic properties of some angiotensin I converting enzyme inhibitors and of angiotensin II type I receptor antagonists. Curr. Pharm. Des. 2003, 9, 751–761. [Google Scholar] [CrossRef]


| Gene Symbol | Gene Name | Associated Disease/Syndrome |
|---|---|---|
| AADAT | alpha-aminoadipate aminotransferase | Detrusor Sphincter Dyssynergia and Huntington Disease |
| ACVRL1 | activin A receptor like type 1 | Telangiectasia, Hereditary Hemorrhagic, Type 2; Idiopathic Pulmonary Arterial Hypertension |
| AR | androgen receptor | Spinal And Bulbar Muscular Atrophy |
| ARAP3 | Ankyrin Repeat And Plekstrin Homology Domains-Containing Protein 3 | Neurofibromatosis 1 |
| ARHGAP44 | Rho GTPase Activating Protein 44 | Hyperalphalipoproteinemia 2 |
| ASS1 | Argininosuccinate Synthase 1 | Citrullinemia |
| ATP11A | ATPase Phospholipid Transporting 11A | COVID-19; leukodystrophy |
| BMP7 | Bone Morphogenetic Protein 7 | renal fibrosis, spondylolistheis, |
| CACNB3 | Calcium Voltage-Gated Channel Auxiliary Subunit Beta 3 | distal hereditary motor neuropathy 2 |
| CC2D1A | Coiled-Coil And C2 Domain Containing 1A | Intellectual Developmental Disorder, Autosomal Recessive 3; Autosomal Recessive Non-Syndromic Intellectual Disability; cerebral palsy |
| CCKAR | Cholecystokinin A Receptor | panic disorder, functionless pituitary adenoma |
| CCNF | cyclin F | amyotrophic lateral sclerosis |
| CHAT | Choline O-Acetyltransferase | myasthenic syndrome, central sleep apnea, respiratory failure |
| CNTNAP1 | ontactin Associated Protein 1 | lethal congenital contracture syndrome, neuropathy |
| Collagen Type II Alpha 1 Chain | epiphysial dysplasia | |
| CRB2 | Crumbs Cell Polarity Complex Component 2 | Genetic Steroid-Resistant Nephrotic Syndrome; Ventriculomegaly With Cystic Kidney Disease |
| CST3 | Cystatin C | kidney disease, Cerebral Amyloid Angiopathy, Cst3-Relate |
| CTSF | Cathepsin F | Neuronal Ceroid Lipofuscinosis; Spinocerebellar Ataxia |
| CXCR4 | C-X-C Motif Chemokine Receptor 4 | dementia; whim syndrome |
| DAB1 | DAB Adaptor Protein 1 | epilepsy; spinocerebral ataxia |
| DLX6 | Distal-Less Homeobox 6 | Isolated Split Hand-Split Foot Malformation |
| DMRTA2 | DMRT Like Family A2 | Uncertain |
| DNM1 | Dynamin 1 | Developmental And Epileptic Encephalopathy 31 |
| DRD1 | Dopamine Receptor D1 | cerebral meningioma; Early-Onset Schizophrenia; Attention Deficit-Hyperactivity Disorder; heroin dependence |
| DRD2 | Dopamine Receptor D2 | Cocaine Dependence; drug deeondence; Antisocial Personality Disorder |
| DZIP1 | DAZ Interacting Zinc Finger Protein 1 | Orthostatic Intolerance; Mitral Valve Prolapse 3; spermatogenic failure |
| EEF1A2 | Eukaryotic Translation Elongation Factor 1 Alpha 2 | Developmental And Epileptic Encephalopathy |
| EEF2K | Eukaryotic Elongation Factor 2 Kinase | colorectal adenocarcinoma |
| EFNB3 | ephrin beta3 | Craniofrontonasal Syndrome |
| ENTPD1 | Ectonucleoside Triphosphate Diphosphohydrolase 1 | spastic paraplegia; Radiation Proctitis; beta-thalassemia |
| FAS | Fas Cell Surface Death Receptor | Autoimmune Lymphoproliferative Syndrome |
| FASN | Fatty Acid Synthase | NAFLD, prostate Ca |
| FBXL21P | F-Box And Leucine Rich Repeat Protein 21, Pseudogene | uncertain |
| FEV | FEV Transcription Factor | Ewing sarcoma; anxiety |
| FLT4 | Fms Related Receptor Tyrosine Kinase 4 | Congenital Heart Defects, Multiple Types, 7; Hereditary Lymphedema I; Hemangioma |
| FN1 | fibronectin 1 | soft tissue chondroma; Spondylometaphyseal Dysplasia; Spondyloepimetaphyseal Dysplasia |
| FRZB | Frizzled Related Protein | osteogenic sarcoma; retinal degeneration |
| GAL3ST1 | Galactose-3-O-Sulfotransferase 1 | Renal Cell Carcinoma, Nonpapillary |
| GAS1 | Growth Arrest Specific 1 | Septopreoptic Holoprosencephaly |
| GAS7 | Growth Arrest Specific 7 | Open-Angle Glaucoma; deafness; glaucoma |
| GBA | Glucosylceramidase Beta | Gaucher Disease, Type I,2,3,3c |
| GDF11 | Growth Differentiation Factor 11 | Vertebral Hypersegmentation And Orofacial Anomalies; aging |
| GLI2 | GLI Family Zinc Finger 2 | Holoprosencephaly 9; Combined Pituitary Hormone Deficiencies |
| HAND2 | Heart And Neural Crest Derivatives Expressed 2 | Cardiomyopathy, Dilated, 1a/h; Dilated Cardiomyopathy |
| HHEX | Hematopoietically Expressed Homeobox | Heart Defects, Congenital, And Other Congenital Anomalies; Diabetes Mellitus, Neonatal, With Congenital Hypothyroidism |
| HPCA | Hippocalcin | Dystonia 2, Torsion, Autosomal Recessive |
| HSPG2 | Heparan Sulfate Proteoglycan 2 | Dyssegmental Dysplasia, Silverman-Handmaker Type Tardive Dyskinesia |
| IL33 | Interleukin 33 | Chronic Asthma |
| INKA1 | Inka Box Actin Regulator 1 | Visual Cortex Disease |
| IQSEC2 | IQ Motif And Sec7 Domain ArfGEF 2 | Intellectual Developmental Disorder, X-Linked 1 |
| ISL2 | ISL LIM Homeobox 2 | Amme complex |
| KIRREL3 | Kirre Like Nephrin Family Adhesion Molecule 3 | Autosomal Dominant Non-Syndromic Intellectual Disability; Familial Nephrotic Syndrome; Granulomatous Disease |
| KNDC1 | Kinase Non-Catalytic C-Lobe Domain Containing 1 | Brugada syndrome |
| L1CAM | L1 Cell Adhesion Molecule | Corpus Callosum, Partial Agenesis Of, X-Linked; hydrocephaly |
| LAMA5 | Laminin Subunit Alpha 5 | Vitreous Detachment; Presynaptic Congenital Myasthenic Syndromes; Lama5-Related Multisystemic Syndrome |
| LHX6 | LIM Homeobox 6 | Waardenburg Syndrome, Type 2c; tooth ageenesis |
| LIMK1 | LIM Domain Kinase 1 | Supravalvular Aortic Stenosis |
| LMNB1 | Lamin B1 | Hutchinson-Gilford Progeria Syndrome; Leukodystrophy, Demyelinating, Adult-Onset |
| LYNX1 | Ly6/Neurotoxin 1 | Malde Meleda; Ovarian Serous Cystadenocarcinoma; amblyopia |
| MAPT | Microtubule Associated Protein Tau | Frontotemporal Dementia; Supranuclear Palsy,; parkinsson disease; parkinsson-dementia syndrome |
| MARVELD1 | MARVEL Domain Containing 1 | Facial Nerve Disease; Facial Paralysis; Heart Fibrosarcoma; Cranial Nerve Disease |
| MAVS | Mitochondrial Antiviral Signaling Protein | hepatitis; Newcastle diseases; Oropouche Fever |
| MMP9 | Matrix Metallopeptidase 9 | Metaphyseal Anadysplasia; Central Nervous System Tuberculosis; Brain Glioblastoma Multiforme; internal hemoroids |
| NAT8L | N-Acetyltransferase 8 Like | N-Acetylaspartate Deficiency; Canavan Disease; microcephaly; Miliaria Rubra |
| NCKIPSD | NCK Interacting Protein With SH3 Domain | Wiskott-Aldrich Syndrome; thrombocytopenia; leucemia, spheroid syndrome |
| NDRG2 | NDRG Family Member 2 | Charcot-Marie-Tooth Disease, Glioblastoma, Meningioma |
| NES | nestin | Medulloepithelioma; Central Neurocytoma; Optic Nerve Glioma; Periventricular Leukomalacia |
| NFIX | Nuclear Factor I X | Malan Syndrome; Marshall-Smith Syndrome; megalocornea |
| NKX2-2 | NK2 Homeobox 2 | Maturity-Onset Diabetes Of The Young; Oligodendroglioma; Ewing Sarcoma |
| NODAL | Nodal Growth Differentiation Factor | Wolff–Parkinson–White Syndrome; heart disease |
| NOS3 | Nitric Oxide Synthase 3 | stroke; alzheimer; hypertention, preeclampsia |
| NOTCH3 | Notch Receptor 3 | Cerebral Arteriopathy, Autosomal Dominant, With Subcortical Infarcts And Leukoencephalopathy |
| NPY1R | Neuropeptide Y Receptor Y1 | Body Mass Index Quantitative Trait Locus 11 |
| NTN1 | netrin 1 | Mirror Movements 4/1, Superior Semicircular Canal Dehiscence, Colorectal Ca |
| OTX1 | Orthodenticle Homeobox 1 | Agnathia-Otocephaly Complex, epilepsy, Bardet-Biedl Syndrome 15; dyslexia |
| PDGFRB | Platelet Derived Growth Factor Receptor Beta | Kosaki Overgrowth Syndrome, premature aging syndrome, |
| PIP5K1C | Phosphatidylinositol-4-Phosphate 5-Kinase Type 1 Gamma | Neurogenic Bladder; alcohol use disorder; Cerebellar Ataxia, Cayman Type |
| PITX1 | Paired Like Homeodomain 1 | Clubfoot, Congenital, With Or Without Deficiency Of Long Bones And/Or Mirror-Image Polydactyly, Clubfoot |
| PMP22 | Peripheral Myelin Protein 22 | Charcot-Marie-Tooth Disease And Deafness, Neuropathy, Hereditary, With Liability To Pressure Palsies, Guillain-Barre Syndrome |
| PRPH | peripherin | Frontotemporal Dementia And/Or Amyotrophic Lateral Sclerosis 3; Amyotrophic Lateral Sclerosis 19 |
| PRRT2 | Proline Rich Transmembrane Protein 2 | Episodic Kinesigenic Dyskinesia 1, Prrt2-Associated Paroxysmal Movement Disorders, Convulsions, Familial Infantile, With Paroxysmal Choreoathetosis |
| RASGRF1 | Ras Protein Specific Guanine Nucleotide Releasing Factor 1 | myopia, Degenerative Myopia, Transient Neonatal Diabetes Mellitus |
| RET | Ret Proto-Oncogene | Pheochromocytoma, Multiple Endocrine Neoplasia, Thyroid Carcinoma |
| RNF165 | Ring Finger Protein 165 | uncertaın |
| RTN4R | Reticulon 4 Receptor | spinal cord injury, schizophrenia, psychotic disorder, leucemia |
| S1PR2 | Sphingosine-1-Phosphate Receptor 2 | deafness, pulmonary edema |
| SARM1 | Sterile Alpha And TIR Motif Containing 1 | Wallerian Degeneration, Retinoschisis 1 |
| SCTR | Secretin Receptor | Gastrinoma, Jejunal Somatostatinoma, pancreas disease, Primary Biliary Cholangiti |
| SEMA3F | semaphorin 3F | neuroma, megacolon, lung Ca, tongue carcinoma |
| SEMA6B | Semaphorin 6B | epilepsy |
| SH3TC2 | SH3 Domain And Tetratricopeptide Repeats 2 | Genetic Motor Neuron Disease, Charcot-Marie-Tooth |
| SLC18A3 | Solute Carrier Family 18 Member 3 | Myasthenic Syndrome, Fetal Akinesia Deformation Sequence 1 |
| SLC19A3 | Solute Carrier Family 19 Member 3 | Thiamine Metabolism Dysfunction Syndrome 2, Infantile Spasms-Psychomotor Retardation-Progressive Brain Atrophy-Basal Ganglia Disease Syndrome |
| SLC25A1 | Solute Carrier Family 25 Member 1 | Myasthenic Syndrome,, Combined D-2- And L-2-Hydroxyglutaric Aciduria |
| SLC7A10 | Solute Carrier Family 7 Member 10 | Hypotonia-Cystinuria Syndrome |
| SMARCC2 | SWI/SNF Related, Matrix Associated, Actin Dependent Regulator Of Chromatin Subfamily C Member 2 | Neurilemmomatosis |
| SRCIN1 | SRC Kinase Signaling Inhibitor 1 | Kohlschutter-Tonz Syndrome |
| SRRM3 | Serine/Arginine Repetitive Matrix 3 | deafness, burst Ca |
| STRA6 | Signaling Receptor And Transporter Of Retinol STRA6 | Microphthalmia, Syndromic 9 |
| SYT2 | Synaptotagmin 2 | Myasthenic Syndrome, Congenital, 7a, Presynaptic, And Distal Motor Neuropathy; Lambert-Eaton Myasthenic Syndrome |
| TCF7L1 | Transcription Factor 7 Like 1 | Brust Ca, colorectal Ca, heaptocellular Ca, Arrhythmogenic Right Ventricular Cardiomyopathy |
| TEAD2 | TEA Domain Transcription Factor 2 | Multiple Acyl-Coa Dehydrogenase Deficiency; spastic paraplegia |
| THRA | Thyroid Hormone Receptor Alpha | Hypothyroidism, Resistance To Thyroid Hormone Due To A Mutation In Thyroid Hormone Receptor Alpha, Hyperthyroxinemia, bone giant cell tumor |
| TLE5 | TLE Family Member 5, Transcriptional Modulator | Arthrogryposis, Distal |
| TNFRSF1A | TNF Receptor Superfamily Member 1A | Charge syndrome, periodic fever |
| TNFRSF1B | TNF Receptor Superfamily Member 1B | Psoriatic Arthritis, Rheumatoid Arthritis, Juvenile Rheumatoid Arthritis |
| TP73 | Tumor Protein P73 | respiratory failure, Oligodendroglioma, neuroblastoma |
| TRIM71 | Tripartite Motif Containing 71 | all types hydrocephalus, Autosomal Recessive Limb-Girdle Muscular Dystrophy Type 2h |
| TRPV4 | Transient Receptor Potential Cation Channel Subfamily V Member 4 | metatropic dysplasia, Hereditary Motor And Sensory Neuropathy |
| TSKU | Tsukushi, Small Leucine Rich Proteoglycan | miliaria |
| TUBB4A | Tubulin Beta 4A Class IVa | cerebral palsy, torsion dystonia, nervous system disease |
| UCP2 | Uncoupling Protein 2 | Hyperinsulinism Due To Ucp2 Deficiency |
| VAV3 | Vav Guanine Nucleotide Exchange Factor 3 | ovarian Ca, meningioma, glaucoma |
| VAX1 | Ventral Anterior Homeobox 1 | microphalmia |
| VEGFB | Vascular Endothelial Growth Factor B | Macular Retinal Edema; Macular Degeneration, Age-Related, 1 |
| VWA1 | Von Willebrand Factor A Domain Containing 1 | Neuropathy, Hereditary Motor, With Myopathic Features; Neuromuscular Disease |
| WDR62 | WD Repeat Domain 62 | Congenital Nervous System Abnormality |
| ZIC1 | Zic Family Member 1 | Craniosynostosis 6 |
| ZMIZ1 | Zinc Finger MIZ-Type Containing 1 | Neurodevelopmental Disorder With Dysmorphic Facies And Distal Skeletal Anomalies; Syndromic Intellectual Disability; Brain Stem Infarction |
Disclaimer/Publisher’s Note: The statements, opinions and data contained in all publications are solely those of the individual author(s) and contributor(s) and not of MDPI and/or the editor(s). MDPI and/or the editor(s) disclaim responsibility for any injury to people or property resulting from any ideas, methods, instructions or products referred to in the content. |
© 2023 by the authors. Licensee MDPI, Basel, Switzerland. This article is an open access article distributed under the terms and conditions of the Creative Commons Attribution (CC BY) license (https://creativecommons.org/licenses/by/4.0/).
Share and Cite
Asfa, S.; Toy, H.I.; Arshinchi Bonab, R.; Chrousos, G.P.; Pavlopoulou, A.; Geronikolou, S.A. Soft Tissue Ewing Sarcoma Cell Drug Resistance Revisited: A Systems Biology Approach. Int. J. Environ. Res. Public Health 2023, 20, 6288. https://doi.org/10.3390/ijerph20136288
Asfa S, Toy HI, Arshinchi Bonab R, Chrousos GP, Pavlopoulou A, Geronikolou SA. Soft Tissue Ewing Sarcoma Cell Drug Resistance Revisited: A Systems Biology Approach. International Journal of Environmental Research and Public Health. 2023; 20(13):6288. https://doi.org/10.3390/ijerph20136288
Chicago/Turabian StyleAsfa, Seyedehsadaf, Halil Ibrahim Toy, Reza Arshinchi Bonab, George P. Chrousos, Athanasia Pavlopoulou, and Styliani A. Geronikolou. 2023. "Soft Tissue Ewing Sarcoma Cell Drug Resistance Revisited: A Systems Biology Approach" International Journal of Environmental Research and Public Health 20, no. 13: 6288. https://doi.org/10.3390/ijerph20136288