
The Well-Being of the German Adult Population Measured with the WHO-5 over Different Phases of the COVID-19 Pandemic: An Analysis within the COVID-19 Snapshot Monitoring Study (COSMO)

 , ,
, ,
Abstract
:1. Introduction
2. Materials and Methods
2.1. Study Sample—The COSMO Study
2.2. Evaluation Time Points
2.3. Variables and Measures
2.3.1. WHO-5
2.3.2. Demographic Variables
2.3.3. Socioeconomic Variables
2.3.4. Health-Related Variables
2.4. Statistical Analyses
3. Results
3.1. Sample Characteristics
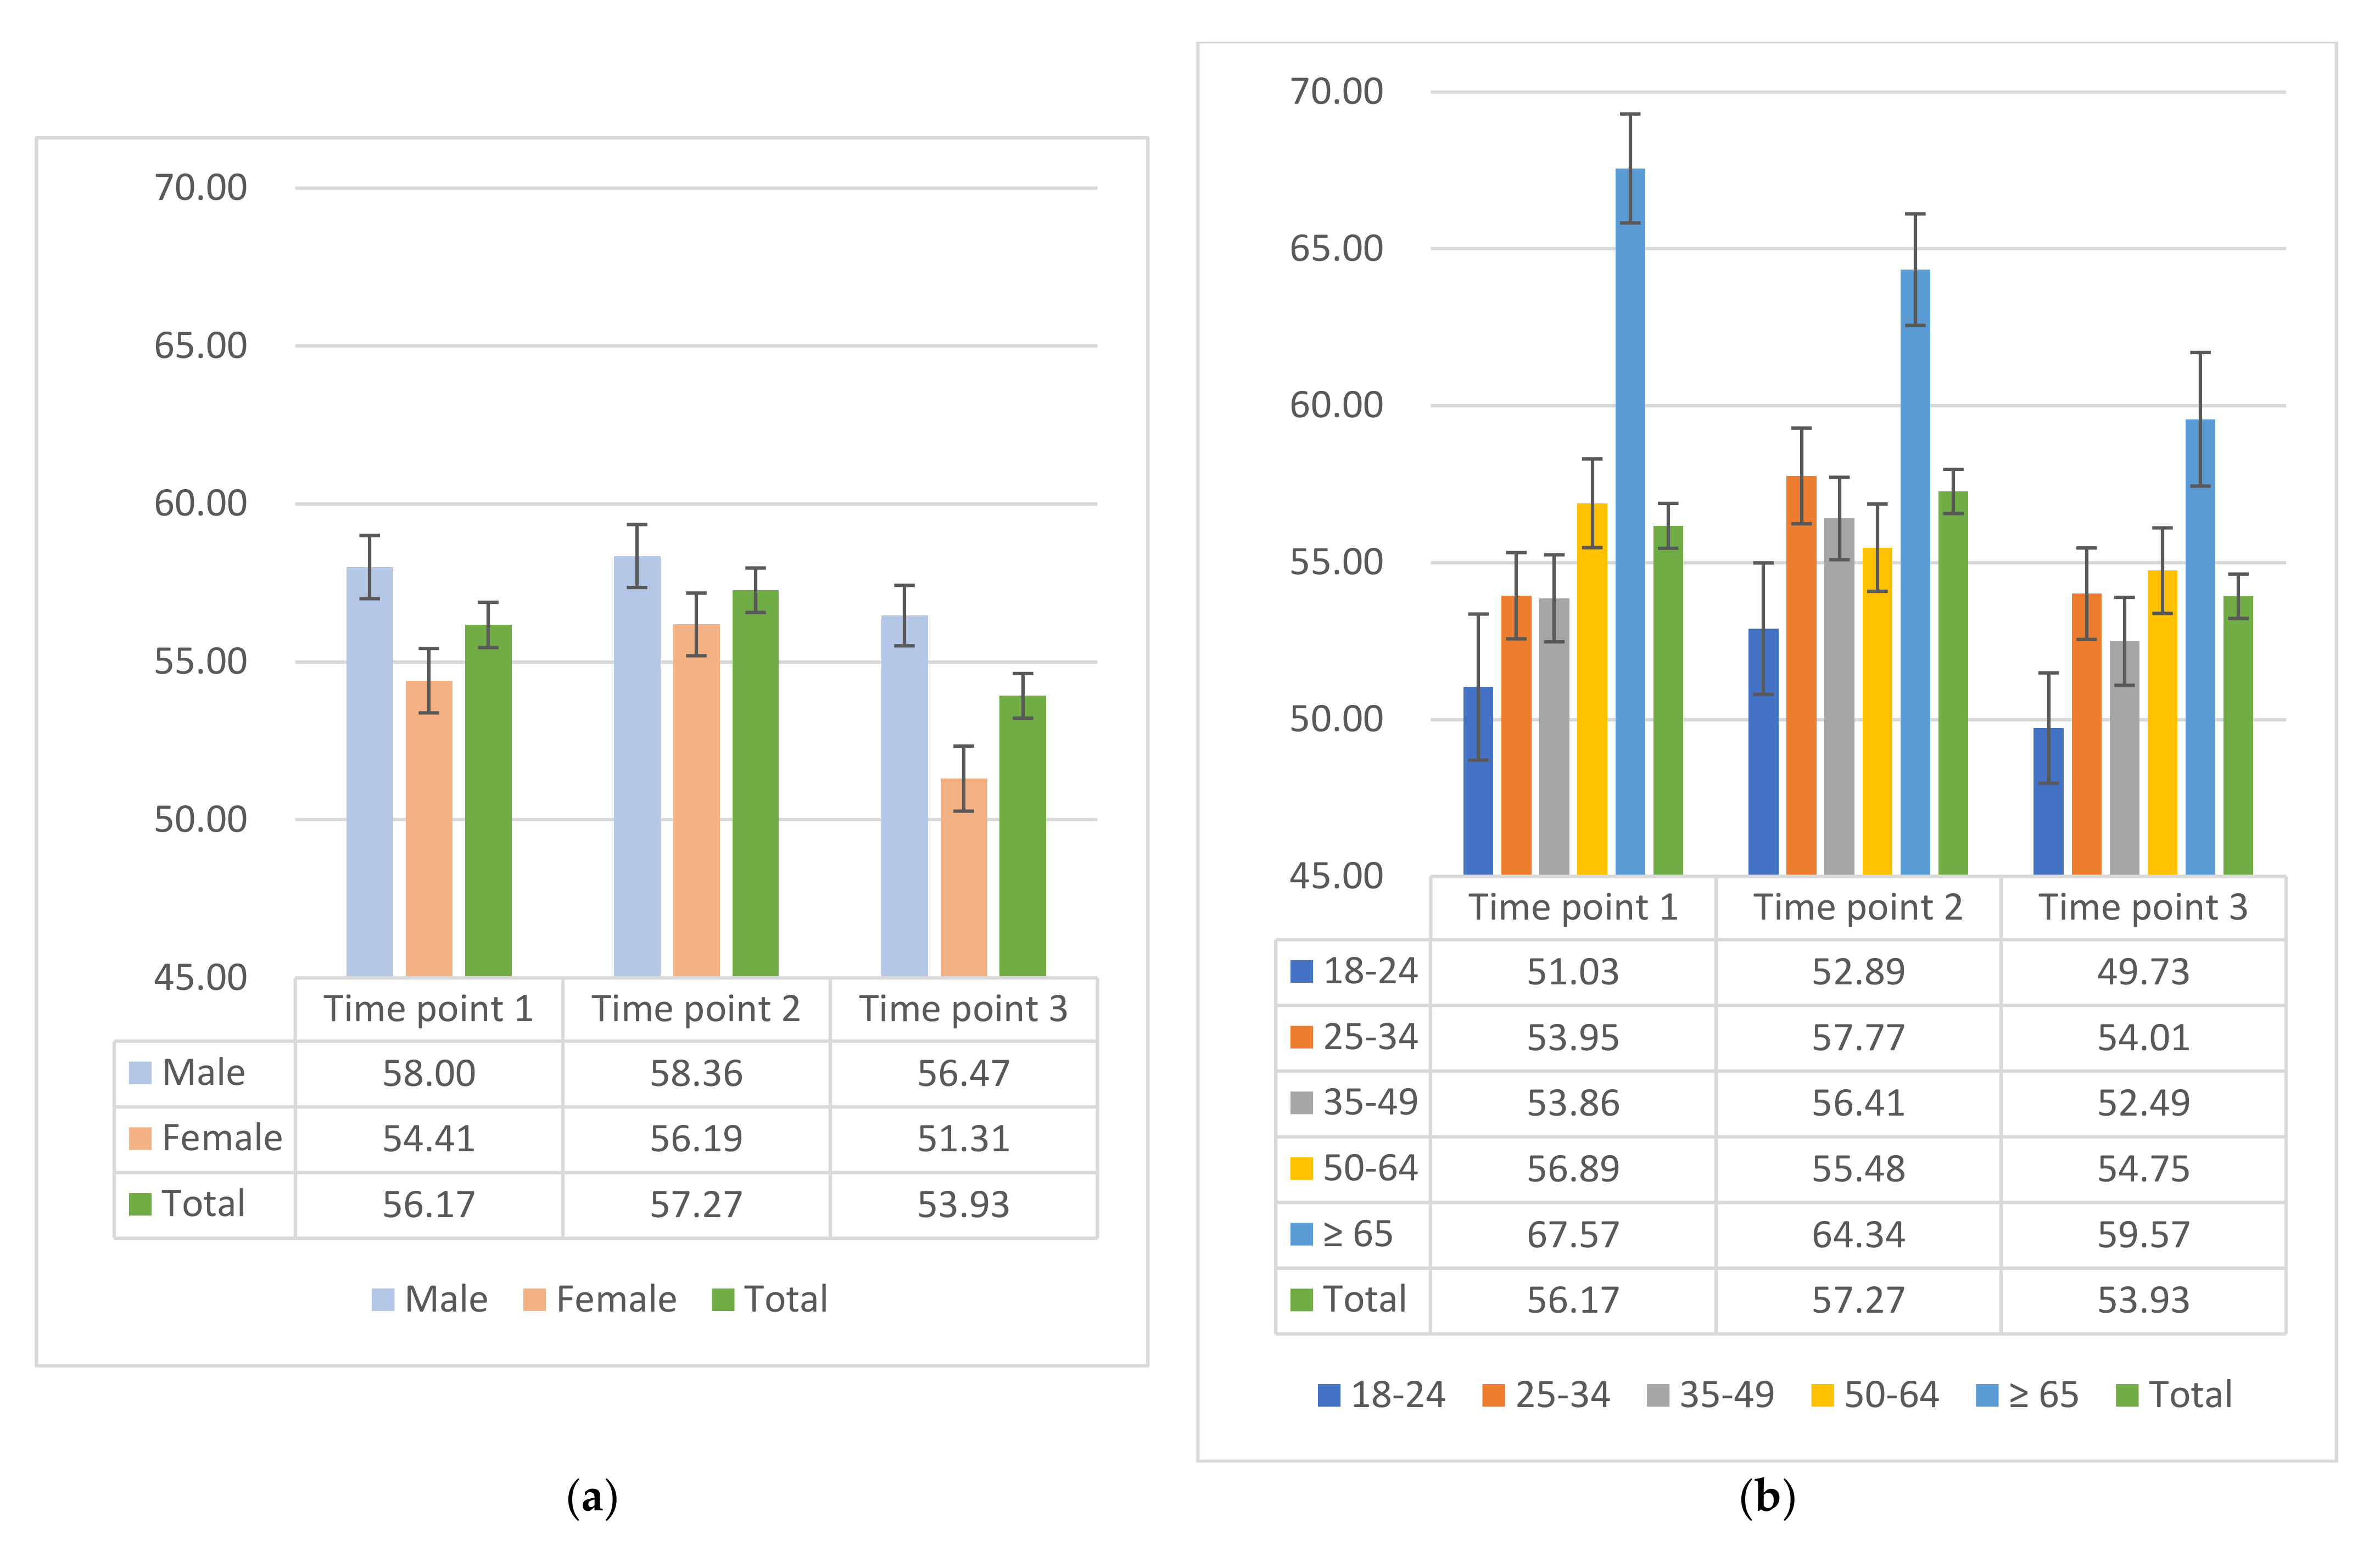
3.2. SWB across Different Pandemic Phases
3.3. Factors Associated with SWB in Different Time Points
3.3.1. Univariate Analyses
- Time point 1
- Time point 2
- Time point 3
3.3.2. Multivariate Analyses
3.4. Additional Analyses: Household Net Income Stratified by Household Size
4. Discussion
Strengths and Limitations
5. Conclusions
Author Contributions
Funding
Institutional Review Board Statement
Informed Consent Statement
Data Availability Statement
Acknowledgments
Conflicts of Interest
Abbreviations
| WHO | World Health Organization |
| WHO-5T | Transformed WHO-5 |
| COVID-19 | Coronavirus disease 2019 |
| COSMO | COVID-19 Snapshot Monitoring |
| ZPID | Leibniz Institute for Psychology Information |
| RKI | Robert Koch Institute |
| BZgA | Federal Centre for Health Education |
| SWB | Subjective well-being |
| SES | Socioeconomic status |
| CI | Confidence interval |
| SD | Standard deviation |
| OR | Odds ratio |
Appendix A. Initial WHO-5T in Different Time Points

| WHO-5T—Time Point 1 | WHO-5T—Time Point 2 | WHO-5T—Time Point 3 | ||||||||||
|---|---|---|---|---|---|---|---|---|---|---|---|---|
| 19–20 May 2020 | 15–16 September 2020 | 21–22 December 2020 | ||||||||||
| n | % | Mean | SD | n | % | Mean | SD | n | % | Mean | SD | |
| Total | 972 | 56.17 | 22.34 | 1013 | 57.27 | 22.40 | 973 | 53.93 | 22.05 | |||
| Gender | ||||||||||||
| Male | 477 | 49.07% | 58.00 | 21.86 | 506 | 49.95% | 58.36 | 22.44 | 494 | 50.77% | 56.47 | 21.27 |
| Female | 495 | 50.93% | 54.41 | 22.69 | 507 | 50.05% | 56.19 | 22.32 | 479 | 49.23% | 51.31 | 22.54 |
| Age group | ||||||||||||
| 18–24 years | 87 | 8.95% | 51.03 | 21.71 | 94 | 9.28% | 52.89 | 20.34 | 118 | 12.13% | 49.73 | 19.11 |
| 25–34 years | 226 | 23.25% | 53.95 | 20.67 | 188 | 18.56% | 57.77 | 20.91 | 191 | 19.63% | 54.01 | 20.18 |
| 35–49 years | 266 | 27.37% | 53.86 | 22.64 | 303 | 29.91% | 56.41 | 22.83 | 268 | 27.54% | 52.49 | 22.94 |
| 50–64 years | 273 | 28.09% | 56.89 | 23.38 | 276 | 27.25% | 55.48 | 23.11 | 284 | 29.19% | 54.75 | 22.96 |
| ≥65 years | 120 | 12.35% | 67.57 | 19.03 | 152 | 15.00% | 64.34 | 21.92 | 112 | 11.51% | 59.57 | 22.54 |
| Education level | ||||||||||||
| Up to 9 years | 105 | 10.80% | 59.50 | 20.02 | 121 | 11.94% | 57.26 | 25.61 | 114 | 11.72% | 50.35 | 26.65 |
| At least 10 years without A-levels | 334 | 34.36% | 54.13 | 22.96 | 357 | 35.24% | 56.40 | 22.91 | 299 | 30.73% | 55.34 | 21.54 |
| At least 10 years with A-levels | 533 | 54.84% | 56.80 | 22.31 | 535 | 52.81% | 57.85 | 21.27 | 560 | 57.55% | 53.90 | 21.23 |
| Migration background | ||||||||||||
| Yes | 141 | 14.51% | 54.89 | 22.64 | 141 | 13.92% | 55.49 | 21.80 | 184 | 18.91% | 49.35 | 22.19 |
| No | 828 | 85.19% | 56.36 | 22.28 | 866 | 85.49% | 57.53 | 22.53 | 783 | 80.47% | 54.97 | 21.97 |
| Do not know | 3 | 0.31% | 64.00 | 32.74 | 6 | 0.59% | 62.00 | 17.11 | 6 | 0.62% | 58.00 | 13.57 |
| Household language other than German | ||||||||||||
| Yes | 244 | 25.10% | 58.13 | 21.08 | 257 | 25.37% | 57.99 | 22.45 | 248 | 25.49% | 54.16 | 21.67 |
| No | 728 | 74.90% | 55.52 | 22.73 | 756 | 74.63% | 57.03 | 22.39 | 725 | 74.51% | 53.85 | 22.19 |
| Relationship status | ||||||||||||
| Yes | 621 | 63.89% | 57.05 | 22.13 | 639 | 63.08% | 59.29 | 21.18 | 661 | 67.93% | 56.21 | 21.59 |
| No | 351 | 36.11% | 54.62 | 22.67 | 374 | 36.92% | 53.83 | 23.98 | 312 | 32.07% | 49.10 | 22.27 |
| Age of children <18 years | ||||||||||||
| 0–2 years | 90 | 9.26% | 54.89 | 23.61 | 77 | 7.60% | 61.14 | 18.49 | 105 | 10.79% | 51.96 | 21.77 |
| 3–5 years | 64 | 6.58% | 49.25 | 22.28 | 55 | 5.43% | 55.78 | 21.05 | 62 | 6.37% | 55.74 | 21.37 |
| 6–9 years | 77 | 7.92% | 53.61 | 23.19 | 87 | 8.59% | 56.05 | 20.51 | 77 | 7.91% | 62.29 | 18.54 |
| 10–13 years | 72 | 7.41% | 49.61 | 23.91 | 107 | 10.56% | 56.71 | 23.79 | 74 | 7.61% | 53.03 | 22.39 |
| 14–17 years | 81 | 8.33% | 61.63 | 20.64 | 62 | 6.12% | 55.42 | 22.06 | 77 | 7.91% | 51.48 | 23.58 |
| No | 687 | 70.68% | 56.79 | 21.86 | 731 | 72.16% | 57.54 | 22.66 | 677 | 69.58% | 54.24 | 22.29 |
| Single parent | ||||||||||||
| Yes | 40 | 4.12% | 53.90 | 22.59 | 45 | 4.44% | 55.02 | 22.87 | 35 | 3.60% | 48.69 | 23.45 |
| No | 245 | 25.21% | 54.82 | 23.61 | 237 | 23.40% | 56.88 | 21.53 | 261 | 26.82% | 53.82 | 21.20 |
| Employment | ||||||||||||
| Yes | NA | NA | NA | NA | 663 | 65.45% | 57.24 | 21.72 | 695 | 71.43% | 55.21 | 21.00 |
| No | NA | NA | NA | NA | 350 | 34.55% | 57.34 | 23.66 | 278 | 28.57% | 50.73 | 24.22 |
| Work in health sector | ||||||||||||
| Yes | 96 | 9.88% | 53.17 | 21.63 | 66 | 6.52% | 60.61 | 21.38 | 68 | 6.99% | 54.18 | 21.73 |
| No | 876 | 90.12% | 56.50 | 22.41 | 947 | 93.48% | 57.04 | 22.46 | 905 | 93.01% | 53.91 | 22.08 |
| Self-employed | ||||||||||||
| Yes | 100 | 10.29% | 57.04 | 22.51 | 77 | 7.60% | 58.55 | 20.96 | 73 | 7.50% | 54.85 | 22.59 |
| No | 872 | 89.71% | 56.07 | 22.34 | 936 | 92.40% | 57.17 | 22.52 | 900 | 92.50% | 53.85 | 22.02 |
| Household size | ||||||||||||
| Just me | 284 | 29.22% | 55.63 | 22.62 | 294 | 29.02% | 55.16 | 24.17 | 228 | 23.43% | 51.40 | 23.38 |
| 2 persons | 351 | 36.11% | 57.89 | 21.87 | 369 | 36.43% | 59.36 | 21.14 | 364 | 37.41% | 56.37 | 21.77 |
| 3–4 persons | 276 | 28.40% | 55.67 | 23.04 | 297 | 29.32% | 57.41 | 21.54 | 323 | 33.20% | 52.15 | 20.88 |
| More than 4 persons | 59 | 6.07% | 51.73 | 19.75 | 51 | 5.03% | 53.25 | 24.52 | 55 | 5.65% | 58.98 | 23.37 |
| Not specified | 2 | 0.21% | 32.00 | 22.63 | 2 | 0.20% | 64.00 | 28.28 | 3 | 0.31% | 48.00 | 14.42 |
| Inhabitants of hometown | ||||||||||||
| ≤5000 | 148 | 15.23% | 57.57 | 23.79 | 168 | 16.58% | 59.74 | 20.50 | 136 | 13.98% | 52.91 | 22.69 |
| 5001–20,000 | 211 | 21.71% | 57.50 | 20.27 | 203 | 20.04% | 55.53 | 22.54 | 243 | 24.97% | 52.87 | 22.18 |
| 20,001–100,000 | 241 | 24.79% | 56.73 | 21.95 | 267 | 26.36% | 58.65 | 22.12 | 253 | 26.00% | 53.75 | 21.95 |
| 100,001–500,000 | 183 | 18.83% | 53.42 | 23.16 | 190 | 18.76% | 55.14 | 23.03 | 180 | 18.50% | 54.42 | 20.71 |
| >500,000 | 189 | 19.44% | 55.56 | 23.05 | 185 | 18.26% | 57.15 | 23.47 | 161 | 16.55% | 56.10 | 23.00 |
| Household income | ||||||||||||
| <EUR 1250 | NA | NA | NA | NA | 148 | 14.61% | 49.27 | 24.82 | 109 | 11.20% | 44.07 | 25.65 |
| EUR 1250–1749 | NA | NA | NA | NA | 117 | 11.55% | 56.44 | 22.84 | 115 | 11.82% | 50.61 | 21.85 |
| EUR 1750–2249 | NA | NA | NA | NA | 123 | 12.14% | 55.38 | 23.19 | 123 | 12.64% | 56.78 | 21.83 |
| EUR 2250–2999 | NA | NA | NA | NA | 169 | 16.68% | 56.45 | 22.36 | 181 | 18.60% | 55.05 | 21.57 |
| EUR 3000–3999 | NA | NA | NA | NA | 193 | 19.05% | 61.08 | 20.01 | 163 | 16.75% | 55.95 | 19.92 |
| EUR 4000–4999 | NA | NA | NA | NA | 105 | 10.37% | 59.01 | 20.60 | 122 | 12.54% | 56.66 | 19.74 |
| ≥EUR 5000 | NA | NA | NA | NA | 77 | 7.60% | 66.23 | 18.83 | 68 | 6.99% | 59.18 | 20.47 |
| Not specified | NA | NA | NA | NA | 81 | 8.00% | 57.83 | 22.25 | 92 | 9.46% | 52.65 | 23.21 |
| Chronic disease | ||||||||||||
| Yes | 347 | 35.70% | 51.87 | 23.03 | 347 | 34.25% | 51.09 | 24.29 | 334 | 34.33% | 49.07 | 23.23 |
| No | 600 | 61.73% | 58.93 | 21.46 | 643 | 63.47% | 60.89 | 20.54 | 608 | 62.49% | 56.82 | 20.90 |
| Do not know | 25 | 2.57% | 49.76 | 23.78 | 23 | 2.27% | 49.39 | 20.77 | 31 | 3.19% | 49.55 | 21.71 |
| COVID-19 infection | ||||||||||||
| Yes, confirmed | 11 | 1.13% | 59.27 | 21.53 | 14 | 1.38% | 62.29 | 24.09 | NA | NA | NA | NA |
| Yes, but not yet confirmed | 9 | 0.93% | 49.78 | 14.44 | 5 | 0.49% | 41.60 | 24.27 | NA | NA | NA | NA |
| No | 803 | 82.61% | 56.86 | 22.73 | 923 | 91.12% | 57.84 | 22.38 | NA | NA | NA | NA |
| Yes, survived | 11 | 1.13% | 50.18 | 17.01 | 6 | 0.59% | 48.00 | 25.17 | NA | NA | NA | NA |
| Do not know | 138 | 14.20% | 52.84 | 20.65 | 65 | 6.42% | 50.22 | 20.58 | NA | NA | NA | NA |
Appendix B. WHO-5T Stratified by Gender and Age Group
| WHO-5T in Time Point 1 | WHO-5T in Time Point 2 | WHO-5T in Time Point 3 | ||||
|---|---|---|---|---|---|---|
| 19–20 May 2020 | 15–16 September 2020 | 21–22 December 2020 | ||||
| Partial Lockdown | No Restrictions | 2nd Strict Lockdown | ||||
| Mean | SD | Mean | SD | Mean | SD | |
| Female (Total) | 54.41 2 | 22.69 | 56.19 3 | 22.32 | 51.31 2,3 | 22.54 |
| 18–24 | 45.62 1 | 22.94 | 54.26 1 | 19.02 | 46.84 | 18.95 |
| 25–34 | 53.88 | 21.67 | 55.18 | 20.54 | 52.88 | 21.14 |
| 35–49 | 52.58 | 22.25 | 53.95 | 22.43 | 49.58 | 22.94 |
| 50–64 | 55.94 | 23.72 | 53.71 | 23.82 | 51.62 | 23.80 |
| ≥65 | 63.84 | 20.36 | 66.90 3 | 20.61 | 57.33 3 | 23.48 |
| Men (Total) | 58.00 | 21.86 | 58.36 | 22.44 | 56.47 | 21.27 |
| 18–24 | 56.09 | 19.42 | 51.58 | 21.65 | 52.25 | 19.05 |
| 25–34 | 54.04 | 19.39 | 60.53 | 21.06 | 55.25 | 19.11 |
| 35–49 | 55.25 | 23.06 | 58.70 | 23.03 | 55.32 | 22.66 |
| 50–64 | 57.84 | 23.09 | 57.25 | 22.32 | 58.10 | 21.61 |
| ≥65 | 70.32 1,2 | 17.63 | 61.50 1 | 23.10 | 61.07 2 | 21.94 |
| Overall | 56.17 2 | 22.34 | 57.27 3 | 22.40 | 53.93 2,3 | 22.05 |
Appendix C. Univariate Analyses of Risk of Suspected Depression by the WHO-5T in Three Time Points
| Risk of Suspected Depression by the WHO-5T in COSMO | ||||||||||||
|---|---|---|---|---|---|---|---|---|---|---|---|---|
| Time Point 1 | Time Point 2 | Time Point 3 | ||||||||||
| 19–20 May 2020 | 15–16 September 2020 | 21–22 December 2020 | ||||||||||
| % of Depression 1 | 95% CI | OR | 95% CI | % of Depression | 95% CI | OR | 95% CI | % of Depression | 95% CI | OR | 95% CI | |
| Gender | ||||||||||||
| Male (reference) | 31.24% | [29.14, 33.34] | 32.02% | [27.90, 36.13] | 35.22% | [31.01–39.44] | ||||||
| Female | 39.80% | [37.60, 42.00] | 1.46 | [1.12, 1.90] ** | 37.48% | [33.16, 41.79] | 1.27 | [0.98, 1.65] | 46.56% | [42.08–51.03] | 1.60 | [1.24, 2.07] *** |
| Age (continuous) | 35.60% | [32.59, 38.61] | 0.99 | [0.98, 0.99] ** | 34.75% | [31.81, 37.68] | 0.99 | [0.98, 1.00] * | 40.80% | [37.71–43.89] | 0.99 | [0.98, 0.99] ** |
| Age group (years) | ||||||||||||
| 18–24 (reference) | 48.28% | [42.89, 53.66] | 48.94% | [38.78, 59.10] | 53.39% | [44.35–62.43] | ||||||
| 25–34 | 37.17% | [33.95, 40.39] | 0.63 | [0.39, 1.05] | 30.32% | [23.73, 36.91] | 0.45 | [0.27, 0.76] ** | 41.88% | [34.87–48.90] | 0.63 | [0.40, 1.00] * |
| 35–49 | 38.72% | [35.73, 41.71] | 0.68 | [0.42, 1.10] | 35.97% | [30.56, 41.39] | 0.59 | [0.37, 0.94] * | 41.04% | [35.14–46.95] | 0.61 | [0.39, 0.94] * |
| 50–64 | 34.07% | [31.19, 36.94] | 0.55 | [0.34, 0.90] * | 37.68% | [31.95, 43.41] | 0.63 | [0.39, 1.01] | 38.73% | [33.06–44.41] | 0.55 | [0.39, 0.85] ** |
| ≥65 | 20.00% | [12.81, 27.19] | 0.27 | [0.15, 0.50] *** | 23.68% | [16.90, 30.47] | 0.32 | [0.19, 0.56] *** | 30.36% | [21.80–38.91] | 0.38 | [0.22, 0.65] *** |
| Education level | ||||||||||||
| No A-level (reference) | 37.59% | [33.05, 42.12] | 36.19% | [31.88, 40.51] | 38.98% | [34.27–43.69] | ||||||
| A-level | 33.96% | [29.93, 37.98] | 0.85 | [0.66, 1.11] | 33.46% | [29.46, 37.46] | 0.89 | [0.68, 1.15] | 42.14% | [38.05–46.24] | 1.14 | [0.88, 1.48] |
| Migration background awareness | ||||||||||||
| No (reference) | 34.78% | [31.54, 38.02] | 34.40% | [31.25, 37.56] | 38.91% | [35.51–42.31] | ||||||
| Yes | 40.43% | [32.30, 48.55] | 1.27 | [0.88, 1.83] | 36.88% | [28.89, 22.87] | 1.11 | [0.77, 1.61] | 48.91% | [41.67–56.16] | 1.50 | [1.09, 2.08] * |
| Household language other than German | ||||||||||||
| No (reference) | 36.95% | [33.44, 40.46] | 35.45% | [32.04, 38.86] | 40.69% | [37.11–44.27] | ||||||
| Yes | 31.56% | [25.71, 37.40] | 0.79 | [0.58, 1.07] | 32.68% | [26.94, 38.43] | 0.88 | [0.66, 1.19] | 41.13% | [34.99–47.27] | 1.02 | [0.76, 1.37] |
| Relationship status | ||||||||||||
| No (reference) | 40.74% | [35.59, 45.89] | 40.64% | [35.66, 45.63] | 51.60% | [46.05–57.16] | ||||||
| Yes | 32.69% | [29.00, 36.38] | 0.71 | [0.54, 0.93] * | 31.30% | [27.70, 34.90] | 0.67 | [0.51, 0.87] ** | 35.70% | [32.05–39.36] | 0.52 | [0.40, 0.68] *** |
| Age of children <18 years | ||||||||||||
| No (reference) | 35.08% | [31.51, 38.65] | 35.29% | [31.83, 38.76] | 40.77% | [37.06–44.47] | ||||||
| 0–5 years | 38.24% | [30.04, 46.43] | 1.08 | [0.74, 1.57] | 27.12% | [19.06, 35.17] | 0.66 | [0.43, 1.02] | 43.42% | [35.52–51.33] | 1.21 | [0.85, 1.73] |
| 6–13 years | 42.40% | [33.70, 51.10] | 1.45 | [0.98, 2.14] | 36.48% | [28.97, 43.98] | 1.10 | [0.77, 1.58] | 33.59% | [25.47–41.71] | 0.66 | [0.45, 0.99] * |
| 14–17 years | 27.16% | [17.41, 36.91] | 0.62 | [0.37, 1.03] | 40.32% | [28.01, 52.63] | 1.25 | [0.73, 2.13] | 42.86% | [31.73–53.98] | 1.21 | [0.75, 1.95] |
| Single parent | ||||||||||||
| No (reference) | 36.73% | [30.69, 42.78] | 33.76% | [27.72, 39.79] | 40.61% | [34.64–46.58] | ||||||
| Yes | 37.50% | [22.31, 52.69] | 1.03 | [0.52, 2.06] | 31.11% | [17.43, 44.79] | 0.89 | [0.45, 1.76] | 42.86% | [26.22–59.49] | 1.10 | [0.54, 2.24] |
| Employment | ||||||||||||
| No (reference) | NA | NA | 34.86% | [29.86, 39.86] | 47.48% | [41.60–53.36] | ||||||
| Yes | NA | NA | NA | NA | 34.69% | [31.06, 38.32] | 0.99 | [0.76, 1.30] | 38.13% | [34.52–41.74] | 0.68 | [0.52, 0.90] ** |
| Work in health sector | ||||||||||||
| No (reference) | 35.27% | [32.11, 38.44] | 35.48% | [32.43, 38.53] | 41.10% | [37.90–44.31] | ||||||
| Yes | 38.54% | [28.75, 48.33] | 1.15 | [0.75, 1.78] | 24.24% | [13.82, 34.66] | 0.58 | [0.33, 1.04] | 36.76% | [25.22–48.31] | 0.83 | [0.50, 1.39] |
| Self-employed | ||||||||||||
| No (reference) | 35.21% | [32.03, 38.38] | 34.83% | [31.78, 37.88] | 41.00% | [37.78–44.22] | ||||||
| Yes | 39.00% | [29.39, 48.61] | 1.18 | [0.77, 1.80] | 33.77% | [23.13, 44.40] | 0.95 | [0.58, 1.56] | 38.36% | [27.12–49.59] | 0.90 | [0.55, 1.46] |
| Household size # | ||||||||||||
| Just me (reference) | 38.73% | [33.06, 44.41] | 37.41% | [31.87, 42.96] | 46.49% | [40.00–52.98] | ||||||
| 2 people | 30.77% | [25.93, 35.60] | 0.70 | [0.51, 0.98] * | 31.98% | [27.21, 36.74] | 0.79 | [0.57, 1.09] | 35.99% | [31.05–40.93] | 0.65 | [0.46, 0.91] * |
| ≥ 3 people | 37.61% | [32.42, 42.81] | 0.95 | [0.69, 1.32] | 35.34% | [30.31, 40.37] | 0.91 | [0.66, 1.26] | 42.06% | [37.08–47.05] | 0.87 | [0.60, 1.16] |
| Inhabitants of hometown | ||||||||||||
| ≤20,000 (reference) | 32.59% | [27.74, 37.45] | 35.31% | [30.44, 40.18] | 43.54% | [38.54–48.53] | ||||||
| 20,001–100,000 | 36.51% | [30.42, 42.61] | 1.19 | [0.84, 1.68] | 32.21% | [26.59, 37.83] | 0.87 | [0.62, 1.22] | 40.32% | [34.26–46.37] | 0.88 | [0.63, 1.21] |
| 100,001–500,000 | 37.16% | [30.14, 44.18] | 1.22 | [0.84, 1.78] | 36.32% | [29.46, 43.17] | 1.05 | [0.73, 1.50] | 38.89% | [31.75–46.03] | 0.83 | [0.58, 1.19] |
| >500,000 | 38.62% | [31.66, 45.58] | 1.30 | [0.90, 1.88] | 35.68% | [28.75, 42.60] | 1.02 | [0.70, 1.47] | 37.27% | [29.77–44.76] | 0.77 | [0.53, 1.13] |
| Household income # | ||||||||||||
| <EUR 1250 (reference) | NA | NA | 48.65% | [40.57, 56.73] | 60.55% | [51.33–69.77] | ||||||
| EUR 1250–2249 | NA | NA | NA | NA | 38.75% | [32.57, 44.93] | 0.67 | [0.44, 1.01] | 43.28% | [36.97–49.59] | 0.50 | [0.31, 0.79] ** |
| EUR 2250–3999 | NA | NA | NA | NA | 30.39% | [25.64, 35.13] | 0.46 | [0.31, 0.68] *** | 37.21% | [32.09–42.32] | 0.39 | [0.25, 0.60] *** |
| ≥EUR 4000 | NA | NA | NA | NA | 24.73% | [18.44, 31.01] | 0.35 | [0.22, 0.55] *** | 32.63% | [25.95–39.32] | 0.32 | [0.19, 0.52] *** |
| Chronic disease awareness | ||||||||||||
| No (reference) | 31.68% | [28.03, 35.33] | 29.58% | [26.11, 33.05] | 36.46% | [32.73–40.20] | ||||||
| Yes | 42.65% | [37.44, 47.86] | 1.60 | [1.22, 2.10] ** | 44.67% | [39.43, 49.91] | 1.92 | [1.47, 2.52] *** | 49.10% | [43.73–54.47] | 1.68 | [1.29, 2.20] *** |
| Awareness of COVID-19 infection | ||||||||||||
| No (reference) | 35.49% | [32.44, 38.55] | 34.72% | [31.75, 37.69] | NA | NA | ||||||
| Yes | 38.71% | [21.28, 56.14] | 1.15 | [0.55, 2.39] | 36.00% | [16.80, 55.20] | 1.06 | [0.46, 2.42] | NA | NA | NA | NA |
Appendix D. Multivariate Analyses of Risk of Suspected Depression by the WHO-5T
| Risk of Suspected Depression by the WHO-5T in Time Point 1 | ||||||
|---|---|---|---|---|---|---|
| Model 1 | Model 2 | Model 3 | ||||
| OR | 95% CI | OR | 95% CI | OR | 95% CI | |
| Gender | ||||||
| Male | Ref. | Ref. | Ref. | |||
| Female | 1.41 | [1.08, 1.85] ** | 1.39 | [1.06, 1.83] * | 1.40 | [1.06, 1.84] * |
| Age | ||||||
| Continuous | 0.98 | [0.97, 0.99] *** | 0.98 | [0.97, 0.99] *** | 0.98 | [0.97, 0.99] ** |
| Relationship status | ||||||
| No | Ref. | Ref. | Ref. | |||
| Yes | 0.75 | [0.57, 0.99] * | 0.77 | [0.53, 1.12] | 0.77 | [0.52, 1.13] |
| Chronic disease awareness | ||||||
| No | Ref. | Ref. | Ref. | |||
| Yes | 1.87 | [1.39, 2.50] *** | 1.88 | [1.40, 2.53] *** | 1.88 | [1.40, 2.54] *** |
| Household size # | ||||||
| Just me | Ref. | Ref. | ||||
| 2 persons | 0.90 | [0.58, 1.38] | 0.89 | [0.57, 1.38] | ||
| ≥3 persons | 1.07 | [0.67, 1.65] | 1.05 | [0.65, 1.69] | ||
| Migration background awareness | ||||||
| No | Ref. | |||||
| Yes | 1.14 | [0.78, 1.68] | ||||
| Age of children <18 years | ||||||
| No | Ref. | |||||
| 0–5 years | 1.03 | [0.66, 1.61] | ||||
| 6–13 years | 1.38 | [0.89, 2.14] | ||||
| 14–17 years | 0.67 | [0.38, 1.18] | ||||
| Work in health sector | ||||||
| No | Ref. | |||||
| Yes | 0.94 | [0.59, 1.48] | ||||
| Adjusted R2 | 0.06 | 0.06 | 0.07 | |||
| Risk of Suspected Depression by the WHO-5T in Time Point 2 | ||||||
|---|---|---|---|---|---|---|
| Model 1 | Model 2 | Model 3 | ||||
| OR | 95% CI | OR | 95% CI | OR | 95% CI | |
| Gender | ||||||
| Male | Ref. | Ref. | Ref. | |||
| Female | 1.29 | [0.99, 1.69] | 1.29 | [0.97, 1.71] | 1.34 | [1.01, 1.78] * |
| Age | ||||||
| Continuous | 0.98 | [0.98, 0.99] ** | 0.99 | [0.98, 1.00] * | 0.99 | [0.98, 1.00] * |
| Relationship status | ||||||
| No | Ref. | Ref. | Ref. | |||
| Yes | 0.70 | [0.54, 0.92] * | 0.82 | [0.55, 1.21] | 0.85 | [0.57, 1.28] |
| Chronic disease awareness | ||||||
| No | Ref. | Ref. | Ref. | |||
| Yes | 2.20 | [1.65, 2.92] *** | 2.04 | [1.51, 2.76] *** | 2.14 | [1.57, 2.91] *** |
| Household size # | ||||||
| Just me | Ref. | Ref. | ||||
| 2 persons | 1.17 | [0.75, 1.82] | 1.19 | [0.76, 1.88] | ||
| ≥3 persons | 1.34 | [0.84, 2.14] | 1.34 | [0.80, 2.24] | ||
| Household income # | ||||||
| <EUR 1250 | Ref. | Ref. | ||||
| EUR 1250–2249 | 0.73 | [0.47, 1.13] | 0.68 | [0.43, 1.08] | ||
| EUR 2250–3999 | 0.46 | [0.29, 0.72] ** | 0.41 | [0.25, 0.67] *** | ||
| ≥EUR 4000 | 0.38 | [0.22, 0.66] ** | 0.34 | [0.19, 0.60] *** | ||
| Migration background awareness | ||||||
| No | Ref. | |||||
| Yes | 1.11 | [0.74, 1.67] | ||||
| Age of children <18 years | ||||||
| No | Ref. | |||||
| 0–5 years | 0.66 | [0.40, 1.08] | ||||
| 6–13 years | 1.16 | [0.75, 1.79] | ||||
| 14–17 years | 1.21 | [0.65, 2.25] | ||||
| Employment | ||||||
| No | Ref. | |||||
| Yes | 1.29 | [0.90, 1.85] | ||||
| Work in health sector | ||||||
| No | Ref. | |||||
| Yes | 0.45 | [0.23, 0.88] * | ||||
| Adjusted R2 | 0.06 | 0.08 | 0.10 | |||
| Risk of Suspected Depression by the WHO-5T | |||
|---|---|---|---|
| Time Point 1 | Time Point 2 | Time Point 3 | |
| 19–20 May 2020 | 15–16 September 2020 | 21–22 December 2020 | |
| OR 95% CI | OR 95% CI | OR 95% CI | |
| Gender | |||
| Male | Ref. | Ref. | |
| Female | 1.40 [1.07, 1.83] * | 1.52 [1.15, 2.01] ** | |
| Age (continuous) | 0.98 [0.97, 0.99] *** | 0.99 [0.98, 1.00] ** | 0.98 [0.97, 0.99] *** |
| Relationship status | |||
| No | Ref. | Ref. | |
| Yes | 0.75 [0.57, 0.99] * | 0.56 [0.41, 0.75] *** | |
| Chronic disease awareness | |||
| No | Ref. | Ref. | Ref. |
| Yes | 1.87 [1.39, 2.50] *** | 2.08 [1.54, 2.82] *** | 2.00 [1.46, 2.73] *** |
| Employment | |||
| No | Ref. | ||
| Yes | 0.68 [0.49, 0.95] * | ||
| Work in health sector | |||
| No | Ref. | ||
| Yes | 0.49 [0.26, 0.94] * | ||
| Household income | |||
| <EUR 1250 | Ref. | ||
| EUR 1250–2249 | 0.77 [0.50, 1.17] | ||
| EUR 2250–3999 | 0.49 [0.33, 0.73] *** | ||
| ≥EUR 4000 | 0.40 [0.25, 0.64] *** | ||
| Adjusted R2 | 0.06 | 0.08 | 0.09 |
Appendix E. Sensitivity Analysis
| Linear Regression of the WHO-5T in COSMO | ||||||
|---|---|---|---|---|---|---|
| Time Point 1 | Time Point 2 | Time Point 3 | ||||
| 19–20 May 2020 | 15–16 September 2020 | 21–22 December 2020 | ||||
| Beta | 95% CI | Beta | 95% CI | Beta | 95% CI | |
| Gender | ||||||
| Male | ||||||
| Female | −2.80 | [−5.54, −0.07] * | −4.53 | [−7.19, −1.87] ** | ||
| Age | 0.30 | [0.21, 0.40] *** | 0.22 | [0.13, 0.32] *** | 0.27 | [0.17, 0.36] *** |
| Relationship status | ||||||
| No | ||||||
| Yes | 1.24 | [−1.62, 4.10] | 5.32 | [2.43, 8.21] *** | ||
| Chronic disease awareness | ||||||
| No | ||||||
| Yes | −9.14 | [−12.12, −6.15] *** | −10.00 | [−13.04, −6.97] *** | −9.27 | [−12.26, −6.28] *** |
| Employment | ||||||
| No | ||||||
| Yes | 4.42 | [1.31, 7.53] ** | ||||
| Work in health sector | ||||||
| No | ||||||
| Yes | 4.66 | [−1.15, 10.48] | ||||
| Household income | ||||||
| <EUR 1250 | ||||||
| EUR 1250–2249 | 4.55 | [0.09, 9.00] * | ||||
| EUR 2250–3999 | 8.41 | [4.27, 12.55] *** | ||||
| ≥EUR 4000 | 10.64 | [5.91, 15.37] *** | ||||
Appendix F. Measured Variables: Question and Answer Categories
| Variable | Question | Answer Categories |
|---|---|---|
| Gender | What is your gender? | 1—Male 2—Female |
| Age | How old are you? | I am___ years old Recoded to: AGE_Level 1—18 to 24 years 2—25 to 34 years 3—35 to 49 years 4—50 to 64 years 5—≥65 years |
| Education | How many years of education have you completed? | 1—0–9 years 2—at least 10 years without A-Level 3—at least 10 years with A-Level Recoded to: Edu_With_A_level 0—no A-Level 1—A-Level |
| Migration | Are you aware of yourself or any of your parents being born abroad? | 1—Yes 2—No 99—Do not know Recoded to: Mig_Aware_Y 0—No or Do not know 1—Yes |
| House_Language | Do you mainly speak a language other than German in your household? | 1—Yes 2—No Recoded to: Langu_Other_G 0—No 1—Yes |
| IPV_Partner_1 | Are you in a relationship or partnership (including marriage)? | 1—Yes 2—No Recoded to: Partner_Y 0—No 1—Yes |
| Child_0_B3 Child_3_B6 Child_6_B10 Child_10_B14 Child_14_B18 Child_NO | Do you have one or more children under the age of 18? | CHILD_0_B3 0 to under 3 years CHILD_3_B6 3 to under 6 years CHILD_6_B10 6 to under 10 years CHILD_10_B14 10 to under 14 years CHILD_14_B18 14 to under 18 years CHILD_NO no children under 18 years 0—Not quoted 1—Quoted Recoded to: child_0_6 (0 to under 6 years) child_6_14 (6 to under 14 years) 0—Not quoted 1—Quoted |
| Single_Parent | Are you a single parent? | 1—Yes 2—No Recoded to: Sin_Pare_Y 0—No 1—Yes |
| Employment | Are you employed? | 1—Yes 2—No Recoded to: Employ_Y 0—No 1—Yes |
| Health | Do you have a job in the health sector? | 1—Yes 2—No Recoded to: Healthjob_Y 0—No 1—Yes |
| Self_Employed | Are you a freelancer or self-employed? | 1—Yes 2—No Recoded to: Self_employ_Y 0—No 1—Yes |
| Household_Size | How many people permanently live in your household? | 1—Just me 2—2 persons 3—3–4 persons 4—More than 4 persons 88—Not specified Recoded to: Housesize_C_123 1—Just me 2—2 persons 3—≥3 persons 88—Not specified |
| Inhabitants | How many inhabitants live in the village or town in which you live? | 1—≤5000 2—5001–20,000 3—20,001–100,000 4—100,001–500,000 5—>500,000 Recoded to: Inhab_C 1—≤20,000 2—20,001–100,000 3—100,001–500,000 4—>500,000 |
| Income_HH | What is the total monthly net income of your household? | 1—<EUR 1250 2—EUR 1250–1749 3—EUR 1750–2249 4—EUR 2250–2999 5—EUR 3000–3999 6—EUR 4000–4999 7—≥EUR 5000 88—Not specified Recoded to: Income_C 0—<EUR 1250 1—EUR 1250–2249 2—EUR 2250–3999 3—≥EUR 4000 88—Not specified |
| Chronic | Do you have a chronic disease? | 1—Yes 2—No 99—Do not know Recoded to: Chro_Aware_Y 0—No or Do not know 1—Yes |
| Infected | Have you or were you infected with the novel coronavirus? | 1—Yes, confirmed 2—Yes, but not yet confirmed 11—Yes, survived 3—No 99—Do not know Recoded to: Infect_Aware_Y 0—No or Do not know 1—Yes (confirmed, not yet confirmed, or survived) |
| Instruction for WHO-5 index questionnaire: | The following statements relate to your well-being in the past two weeks. For each statement, please mark the rubric that you think best describes how you have felt in the past two weeks. | |
| WHO5_1 | I have felt cheerful and in good spirits. | 1—All of the time 2—Most of the time 3—More than half the time 4—Less than half the time 5—Some of the time 6—At no time Recoded to: WHO5_R_1 0—At no time 1—Some of the time 2—Less than half the time 3—More than half the time 4—Most of the time 5—All of the time |
| WHO5_2 | I have felt calm and relaxed. | 1—All of the time 2—Most of the time 3—More than half the time 4—Less than half the time 5—Some of the time 6—At no time Recoded to: WHO5_R_2 0—At no time 1—Some of the time 2—Less than half the time 3—More than half the time 4—Most of the time 5—All of the time |
| WHO5_3 | I have felt active and vigorous. | 1—All of the time 2—Most of the time 3—More than half the time 4—Less than half the time 5—Some of the time 6—At no time Recoded to: WHO5_R_3 0—At no time 1—Some of the time 2—Less than half the time 3—More than half the time 4—Most of the time 5—All of the time |
| WHO5_4 | I woke up feeling fresh and rested. | 1—All of the time 2—Most of the time 3—More than half the time 4—Less than half the time 5—Some of the time 6—At no time Recoded to: WHO5_R_4 0—At no time 1—Some of the time 2—Less than half the time 3—More than half the time 4—Most of the time 5—All of the time |
| WHO5_5 | My daily life has been filled with things that interest me. | 1—All of the time 2—Most of the time 3—More than half the time 4—Less than half the time 5—Some of the time 6—At no time Recoded to: WHO5_R_5 0—At no time 1—Some of the time 2—Less than half the time 3—More than half the time 4—Most of the time 5—All of the time |
| Sum of WHO5_R_1 to WHO5_R_5 Recoded to: WHO5_R_sum WHO5_R_sum multiplied by 4 Recoded to: WHO5_T_sum WHO5_T_sum Recoded to: WHO_depression 0—WHO5_T_sum > 50 1—WHO5_T_sum ≤ 50 |
References
- Clemente-Suárez, V.J.; Dalamitros, A.A.; Beltran-Velasco, A.I.; Mielgo-Ayuso, J.; Tornero-Aguilera, J.F. Social and Psychophysiological Consequences of the COVID-19 Pandemic: An Extensive Literature Review. Front. Psychol. 2020, 11, 580225. [Google Scholar] [CrossRef] [PubMed]
- Holmes, E.A.; O’Connor, R.C.; Perry, V.H.; Tracey, I.; Wessely, S.; Arseneault, L.; Ballard, C.; Christensen, H.; Silver, R.C.; Everall, I.; et al. Multidisciplinary research priorities for the COVID-19 pandemic: A call for action for mental health science. Lancet Psychiatry 2020, 7, 547–560. [Google Scholar] [CrossRef]
- Zhang, J.; Lu, H.; Zeng, H.; Zhang, S.; Du, Q.; Jiang, T.; Du, B. The differential psychological distress of populations affected by the COVID-19 pandemic. Brain Behav. Immun. 2020, 87, 49–50. [Google Scholar] [CrossRef] [PubMed]
- Slavich, G.M. Social Safety Theory: A Biologically Based Evolutionary Perspective on Life Stress, Health, and Behavior. Annu. Rev. Clin. Psychol. 2020, 16, 265–295. [Google Scholar] [CrossRef]
- Segerstrom, S.C.; Miller, G.E. Psychological Stress and the Human Immune System: A Meta-Analytic Study of 30 Years of Inquiry. Psychol. Bull. 2004, 130, 601–630. [Google Scholar] [CrossRef] [Green Version]
- Glaser, R.; Kiecolt-Glaser, J.K. Stress-induced immune dysfunction: Implications for health. Nat. Rev. Immunol. 2005, 5, 243–251. [Google Scholar] [CrossRef]
- Elenkov, I.J.; Chrousos, G.P. Stress Hormones, Proinflammatory and Antiinflammatory Cytokines, and Autoimmunity. Ann. N. Y. Acad. Sci. 2002, 966, 290–303. [Google Scholar] [CrossRef]
- Slavich, G.M.; Irwin, M.R. From stress to inflammation and major depressive disorder: A social signal transduction theory of depression. Psychol. Bull. 2014, 140, 774–815. [Google Scholar] [CrossRef] [PubMed]
- Gargiulo, R.A.; Stokes, M.A. Subjective Well-Being as an Indicator for Clinical Depression. Soc. Indic. Res. 2009, 92, 517–527. [Google Scholar] [CrossRef]
- Karlsen, E.; Dybdahl, R.; Vittersø, J. The possible benefits of difficulty: How stress can increase and decrease subjective well-being. Scand. J. Psychol. 2006, 47, 411–417. [Google Scholar] [CrossRef]
- Xiong, J.; Lipsitz, O.; Nasri, F.; Lui, L.M.W.; Gill, H.; Phan, L.; Chen-Li, D.; Iacobucci, M.; Ho, R.; Majeed, A.; et al. Impact of COVID-19 pandemic on mental health in the general population: A systematic review. J. Affect. Disord. 2020, 277, 55–64. [Google Scholar] [CrossRef]
- Krishnamoorthy, Y.; Nagarajan, R.; Saya, G.K.; Menon, V. Prevalence of psychological morbidities among general population, healthcare workers and COVID-19 patients amidst the COVID-19 pandemic: A systematic review and meta-analysis. Psychiatry Res. 2020, 293, 113382. [Google Scholar] [CrossRef] [PubMed]
- Gilan, D.; Röthke, N.; Blessin, M.; Kunzler, A.; Stoffers-Winterling, J.; Müssig, M.; Yuen, K.S.L.; Tüscher, O.; Thrul, J.; Kreuter, F.; et al. Psychomorbidity, Resilience, and Exacerbating and Protective Factors During the SARS-CoV-2 Pandemic. Deutsches Ärzteblatt Int. 2020, 117, 625–630. [Google Scholar] [CrossRef] [PubMed]
- Kunzler, A.M.; Röthke, N.; Günthner, L.; Stoffers-Winterling, J.; Tüscher, O.; Coenen, M.; Rehfuess, E.; Schwarzer, G.; Binder, H.; Schmucker, C.; et al. Mental burden and its risk and protective factors during the early phase of the SARS-CoV-2 pandemic: Systematic review and meta-analyses. Glob. Health 2021, 17, 34. [Google Scholar] [CrossRef] [PubMed]
- Brooks, S.K.; Webster, R.K.; Smith, L.E.; Woodland, L.; Wessely, S.; Greenberg, N.; Rubin, G.J. The psychological impact of quarantine and how to reduce it: Rapid review of the evidence. Lancet 2020, 395, 912–920. [Google Scholar] [CrossRef] [Green Version]
- Xiang, Y.-T.; Yang, Y.; Li, W.; Zhang, L.; Zhang, Q.; Cheung, T.; Ng, C.H. Timely mental health care for the 2019 novel coronavirus outbreak is urgently needed. Lancet Psychiatry 2020, 7, 228–229. [Google Scholar] [CrossRef] [Green Version]
- Li, S.; Wang, Y.; Xue, J.; Zhao, N.; Zhu, T. The Impact of COVID-19 Epidemic Declaration on Psychological Consequences: A Study on Active Weibo Users. Int. J. Environ. Res. Public Health 2020, 17, 2032. [Google Scholar] [CrossRef] [Green Version]
- Betsch, C.; Wieler, L.; Bosnjak, M.; Ramharter, M.; Stollorz, V.; Omer, S.; Korn, L.; Sprengholz, P.; Felgendreff, L.; Eitze, S.; et al. Germany COVID-19 Snapshot MOnitoring (COSMO Germany): Monitoring knowledge, risk perceptions, preventive behaviours, and public trust in the current coronavirus outbreak in Germany. PsychArchives 2020. [Google Scholar] [CrossRef]
- International Monetary Fund(IMF). Policy responses to COVID-19. Available online: https://www.imf.org/en/Topics/imf-and-covid19/Policy-Responses-to-COVID-19#G (accessed on 15 April 2021).
- Topp, C.W.; Østergaard, S.D.; Søndergaard, S.; Bech, P. The WHO-5 Well-Being Index: A Systematic Review of the Literature. Psychother. Psychosom. 2015, 84, 167–176. [Google Scholar] [CrossRef]
- Bech, P.; Olsen, L.R.; Kjoller, M.; Rasmussen, N.K. Measuring well-being rather than the absence of distress symptoms: A comparison of the SF-36 Mental Health subscale and the WHO-Five Well-Being Scale. Int. J. Methods Psychiatr. Res. 2003, 12, 85–91. [Google Scholar] [CrossRef]
- World Health Organization. Wellbeing Measures in Primary Health Care: The DepCare Project; Consensus Meeting; WHO Regional Office: Stockholm, Sweden, 1998. [Google Scholar]
- Armutsgefährdungsschwelle und Armutsgefährdung (Monetäre Armut) in Deutschland. Available online: https://www.destatis.de/DE/Themen/Gesellschaft-Umwelt/Einkommen-Konsum-Lebensbedingungen/Lebensbedingungen-Armutsgefaehrdung/Tabellen/armutsschwelle-gefaehrdung-silc.html (accessed on 1 May 2021).
- Reichtum: Wer zur Oberschicht Gehört. Available online: https://www.iwkoeln.de/presse/pressemitteilungen/beitrag/judith-niehues-maximilian-stockhausen-wer-zur-oberschicht-gehoert.html (accessed on 15 April 2021).
- Brähler, E.; Mühlan, H.; Albani, C.; Schmidt, S. Teststatistische prüfung und normierung der deutschen versionen des EUROHIS-QOL Lebensqualität-index und des WHO-5 Wohlbefindens-index. [Testing and standardization of the German version of the EUROHIS-QOL and WHO-5 quality-of life-indices]. Diagnostica 2007, 53, 83–96. [Google Scholar] [CrossRef]
- Carrozzino, D.; Christensen, K.S.; Cosci, F. Construct and criterion validity of patient-reported outcomes (PROs) for depression: A clinimetric comparison. J. Affect. Disord. 2021, 283, 30–35. [Google Scholar] [CrossRef]
- Every-Palmer, S.; Jenkins, M.; Gendall, P.; Hoek, J.; Beaglehole, B.; Bell, C.; Williman, J.; Rapsey, C.; Stanley, J. Psychological distress, anxiety, family violence, suicidality, and wellbeing in New Zealand during the COVID-19 lockdown: A cross-sectional study. PLoS ONE 2020, 15, e0241658. [Google Scholar] [CrossRef]
- Mazza, C.; Ricci, E.; Biondi, S.; Colasanti, M.; Ferracuti, S.; Napoli, C.; Roma, P. A Nationwide Survey of Psychological Distress among Italian People during the COVID-19 Pandemic: Immediate Psychological Responses and Associated Factors. Int. J. Environ. Res. Public Health 2020, 17, 3165. [Google Scholar] [CrossRef] [PubMed]
- European Foundation for the Improvement of Living and Working Conditions. European Quality of Life Survey Integrated Data File, 2003–2016, 3rd ed.; UK Data Service: London, UK, 2018. [Google Scholar] [CrossRef]
- Gruber, J.; Prinstein, M.J.; Clark, L.A.; Rottenberg, J.; Abramowitz, J.S.; Albano, A.M.; Aldao, A.; Borelli, J.L.; Chung, T.; Davila, J.; et al. Mental health and clinical psychological science in the time of COVID-19: Challenges, opportunities, and a call to action. Am. Psychol. 2021, 76, 409–426. [Google Scholar] [CrossRef] [PubMed]
- Kumar, A.; Nayar, K.R. COVID 19 and its mental health consequences. J. Ment. Health 2021, 30, 1–2. [Google Scholar] [CrossRef]
- Chittleborough, C.R.; Winefield, H.; Gill, T.K.; Koster, C.; Taylor, A.W. Age differences in associations between psychological distress and chronic conditions. Int. J. Public Health 2011, 56, 71–80. [Google Scholar] [CrossRef]
- Phongsavan, P.; Chey, T.; Bauman, A.; Brooks, R.; Silove, D. Social capital, socio-economic status and psychological distress among Australian adults. Soc. Sci. Med. 2006, 63, 2546–2561. [Google Scholar] [CrossRef]
- Wang, Y.; Kala, M.P.; Jafar, T.H. Factors associated with psychological distress during the coronavirus disease 2019 (COVID-19) pandemic on the predominantly general population: A systematic review and meta-analysis. PLoS ONE 2020, 15, e0244630. [Google Scholar] [CrossRef]
- Schröpfer, K.; Schmidt, N.; Kus, S.; Koob, C.; Coenen, M. Psychological Stress among Students in Health-Related Fields during the COVID-19 Pandemic: Results of a Cross-Sectional Study at Selected Munich Universities. Int. J. Environ. Res. Public Health 2021, 18, 6611. [Google Scholar] [CrossRef]
- Jorm, A.F.; Windsor, T.D.; Dear, K.B.G.; Anstey, K.J.; Christensen, H.; Rodgers, B. Age group differences in psychological distress: The role of psychosocial risk factors that vary with age. Psychol. Med. 2005, 35, 1253–1263. [Google Scholar] [CrossRef] [PubMed]
- Inter-Agency Standing Committee. Operational Considerations for Multisectoral Mental Health and Psychosocial Support Programmes during the COVID-19 Pandemic. Available online: https://covid19humanitarian-rwla.temp-dns.com/covid19db/wp-content/uploads/2020/06/Operational-considerations-for-multisectoral-mental-health-and-psychosocial-support-programmes-during-the-COVID-19-pandemic.pdf (accessed on 30 April 2021).
- Donovan, N.J.; Wu, Q.; Rentz, D.M.; Sperling, R.A.; Marshall, G.A.; Glymour, M.M. Loneliness, depression and cognitive function in older U.S. adults. Int. J. Geriatr. Psychiatry 2017, 32, 564–573. [Google Scholar] [CrossRef] [PubMed] [Green Version]
- Mohler-Kuo, M.; Dzemaili, S.; Foster, S.; Werlen, L.; Walitza, S. Stress and Mental Health among Children/Adolescents, Their Parents, and Young Adults during the First COVID-19 Lockdown in Switzerland. Int. J. Environ. Res. Public Health 2021, 18, 4668. [Google Scholar] [CrossRef]
- Drapeau, A.; Marchand, A.; Beaulieu-Prevost, D. Epidemiology of Psychological Distress. In Mental Illnesses-Understanding, Prediction and Control; L’Abate, L., Ed.; IntechOpen: Rijeka, Croatia, 2012. [Google Scholar]
- Statistisches Bundesamt. Bevölkerung nach Altersgruppen. Available online: https://www.destatis.de/DE/Themen/Gesellschaft-Umwelt/Bevoelkerung/Bevoelkerungsstand/Tabellen/bevoelkerung-altersgruppen-deutschland.html (accessed on 22 October 2021).
- World Health Organization. Depression and Other Common Mental Disorders Global Health Estimates. 2017. Available online: https://apps.who.int/iris/bitstream/handle/10665/254610/WHO-MSD-MER-2017.2-eng.pdf?sequence=1 (accessed on 1 May 2021).
- Qiu, J.; Shen, B.; Zhao, M.; Wang, Z.; Xie, B.; Xu, Y. A nationwide survey of psychological distress among Chinese people in the COVID-19 epidemic: Implications and policy recommendations. Gen. Psychiatry 2020, 33, e100213. [Google Scholar] [CrossRef] [PubMed] [Green Version]
- Wang, C.; Pan, R.; Wan, X.; Tan, Y.; Xu, L.; Ho, C.S.; Ho, R.C. Immediate Psychological Responses and Associated Factors during the Initial Stage of the 2019 Coronavirus Disease (COVID-19) Epidemic among the General Population in China. Int. J. Environ. Res. Public Health 2020, 17, 1729. [Google Scholar] [CrossRef] [PubMed] [Green Version]
- Swendeman, D.; Fehrenbacher, A.E.; Roy, S.; Das, R.; Ray, P.; Sumstine, S.; Ghose, T.; Jana, S. Gender disparities in depression severity and coping among people living with HIV/AIDS in Kolkata, India. PLoS ONE 2018, 13, e0207055. [Google Scholar] [CrossRef]
- Chandan, J.S.; Taylor, J.; Bradbury-Jones, C.; Nirantharakumar, K.; Kane, E.; Bandyopadhyay, S. COVID-19: A public health approach to manage domestic violence is needed. Lancet Public Health 2020, 5, e309. [Google Scholar] [CrossRef]
- Frasquilho, D.; Matos, M.G.; Salonna, F.; Guerreiro, D.; Storti, C.C.; Gaspar, T.; Caldas-De-Almeida, J.M. Mental health outcomes in times of economic recession: A systematic literature review. BMC Public Health 2015, 16, 115. [Google Scholar] [CrossRef] [Green Version]
- Hall, G.C.N.; Berkman, E.T.; Zane, N.W.; Leong, F.T.L.; Hwang, W.-C.; Nezu, A.M.; Nezu, C.M.; Hong, J.J.; Chu, J.P.; Huang, E.R. Reducing mental health disparities by increasing the personal relevance of interventions. Am. Psychol. 2021, 76, 91–103. [Google Scholar] [CrossRef] [Green Version]
- Kessler, R.C.; Price, R.H.; Wortman, C.B. Social Factors in Psychopathology: Stress, Social Support, and Coping Processes. Annu. Rev. Psychol. 1985, 36, 531–572. [Google Scholar] [CrossRef]
- Schneider, E.C.; Zaslavsky, A.M.; Epstein, A.M. Racial Disparities in the Quality of Care for Enrollees in Medicare Managed Care. J. Am. Med Assoc. 2002, 287, 1288–1294. [Google Scholar] [CrossRef] [PubMed] [Green Version]
- Adler, N.E.; Rehkopf, D.H. U.S. Disparities in Health: Descriptions, Causes, and Mechanisms. Annu. Rev. Public Health 2008, 29, 235–252. [Google Scholar] [CrossRef] [PubMed] [Green Version]
- Solomon, D.; Maxwell, C.; Castro, A. Systematic Inequality and Economic Opportunity. Available online: https://www.americanprogress.org/issues/race/reports/2019/08/07/472910/systematic-inequality-economic-opportunity/ (accessed on 6 May 2021).
- Cheung, K.L.; Ten Klooster, P.M.; Smit, C.; de Vries, H.; Pieterse, M.E. The impact of non-response bias due to sampling in public health studies: A comparison of voluntary versus mandatory recruitment in a Dutch national survey on adolescent health. BMC Public Health 2017, 17, 276. [Google Scholar] [CrossRef] [Green Version]
- He, Z.; Chen, J.; Pan, K.; Yue, Y.; Cheung, T.; Yuan, Y.; Du, N.; Zhao, Y.; Feng, Y.; Zhou, D.; et al. The development of the ‘COVID-19 Psychological Resilience Model’ and its efficacy during the COVID-19 pandemic in China. Int. J. Biol. Sci. 2020, 16, 2828–2834. [Google Scholar] [CrossRef]
- Inchausti, F.; Macbeth, A.; Hasson-Ohayon, I.; Dimaggio, G. Psychological Intervention and COVID-19: What We Know So Far and What We Can Do. J. Contemp. Psychother. 2020, 50, 243–250. [Google Scholar] [CrossRef] [PubMed]

| Time Point 1 | Time Point 2 | Time Point 3 | ||||
|---|---|---|---|---|---|---|
| 19–20 May 2020 | 15–16 September 2020 | 21–22 December 2020 | ||||
| n | %/Mean (SD) | n | %/Mean (SD) | n | %/Mean (SD) | |
| Gender | ||||||
| Male | 477 | 49.07% | 506 | 49.95% | 494 | 50.77% |
| Female | 495 | 50.93% | 507 | 50.05% | 479 | 49.23% |
| Age (cont.) | 972 | 44.59 (15.12) | 1013 | 45.92 (15.60) | 973 | 44.07 (15.25) |
| Age group (years) | ||||||
| 18–24 | 87 | 8.95% | 94 | 9.28% | 118 | 12.13% |
| 25–34 | 226 | 23.25% | 188 | 18.56% | 191 | 19.63% |
| 35–49 | 266 | 27.37% | 303 | 29.91% | 268 | 27.54% |
| 50–64 | 273 | 28.09% | 276 | 27.25% | 284 | 29.19% |
| ≥65 | 120 | 12.35% | 152 | 15.00% | 112 | 11.51% |
| Education level | ||||||
| No A-level | 439 | 45.16% | 478 | 47.19% | 413 | 42.45% |
| A-level | 533 | 54.84% | 535 | 52.81% | 560 | 57.55% |
| Migration background awareness | ||||||
| No | 831 | 85.49% | 872 | 86.08% | 789 | 81.09% |
| Yes | 141 | 14.51% | 141 | 13.92% | 184 | 18.91% |
| Household language other than German | ||||||
| No | 728 | 74.90% | 756 | 74.63% | 725 | 74.51% |
| Yes | 244 | 25.10% | 257 | 25.37% | 248 | 25.49% |
| Relationship status | ||||||
| No | 351 | 36.11% | 374 | 36.92% | 312 | 32.07% |
| Yes | 621 | 63.89% | 639 | 63.08% | 661 | 67.93% |
| Age of children <18 years | ||||||
| No | 687 | 70.68% | 731 | 72.16% | 677 | 69.58% |
| 0–5 years | 136 | 13.99% | 118 | 11.65% | 152 | 15.62% |
| 6–13 years | 125 | 12.86% | 159 | 15.70% | 131 | 13.46% |
| 14–17 years | 81 | 8.33% | 62 | 6.12% | 77 | 7.91% |
| Single parent | ||||||
| No | 245 | 25.21% | 237 | 23.40% | 261 | 26.82% |
| Yes | 40 | 4.12% | 45 | 4.44% | 35 | 3.60% |
| Employment | ||||||
| No | NA | NA | 350 | 34.55% | 278 | 28.57% |
| Yes | NA | NA | 663 | 65.45% | 695 | 71.43% |
| Work in health sector | ||||||
| No | 876 | 90.12% | 947 | 93.48% | 905 | 93.01% |
| Yes | 96 | 9.88% | 66 | 6.52% | 68 | 6.99% |
| Self-employed | ||||||
| No | 872 | 89.71% | 936 | 92.40% | 900 | 92.50% |
| Yes | 100 | 10.29% | 77 | 7.60% | 73 | 7.50% |
| Household size | ||||||
| Just me | 284 | 29.22% | 294 | 29.02% | 228 | 23.43% |
| 2 people | 351 | 36.11% | 369 | 36.43% | 364 | 37.41% |
| ≥3 people | 335 | 34.47% | 348 | 34.35% | 378 | 38.85% |
| Not specified | 2 | 0.21% | 2 | 0.20% | 3 | 0.31% |
| Inhabitants of hometown | ||||||
| <20,000 | 359 | 36.93% | 371 | 36.62% | 379 | 38.95% |
| 20,001–100,000 | 241 | 24.79% | 267 | 26.36% | 253 | 26.00% |
| 100,001–500,000 | 183 | 18.83% | 190 | 18.76% | 180 | 18.50% |
| >500,000 | 189 | 19.44% | 185 | 18.26% | 161 | 16.55% |
| Household net income | ||||||
| <EUR 1250 | NA | NA | 148 | 14.61% | 109 | 11.20% |
| EUR 1250–2249 | NA | NA | 240 | 23.69% | 238 | 24.46% |
| EUR 2250–3999 | NA | NA | 362 | 35.74% | 344 | 35.35% |
| ≥EUR 4000 | NA | NA | 182 | 17.97% | 190 | 19.53% |
| Not specified | NA | NA | 81 | 8.00% | 92 | 9.46% |
| Chronic disease awareness | ||||||
| No | 625 | 64.30% | 666 | 65.75% | 639 | 65.67% |
| Yes | 347 | 35.70% | 347 | 34.25% | 334 | 34.33% |
| Awareness of COVID-19 infection | ||||||
| No | 941 | 96.81% | 988 | 97.54% | NA | NA |
| Yes | 31 | 3.19% | 25 | 2.47% | NA | NA |
| Risk of Suspected Depression by the WHO-5T in Time Point 3 | ||||||
|---|---|---|---|---|---|---|
| Model 1 | Model 2 | Model 3 | ||||
| OR | 95% CI | OR | 95% CI | OR | 95% CI | |
| Gender | ||||||
| Male | Ref. | Ref. | Ref. | |||
| Female | 1.58 | [1.21, 2.05] ** | 1.49 | [1.13, 1.98] ** | 1.52 | [1.15, 2.03] ** |
| Age | ||||||
| Continuous | 0.98 | [0.97, 0.99] *** | 0.98 | [0.97, 0.99] ** | 0.98 | [0.97, 0.99] ** |
| Relationship status | ||||||
| No | Ref. | Ref. | Ref. | |||
| Yes | 0.56 | [0.43, 0.74] *** | 0.61 | [0.41, 0.91] * | 0.65 | [0.43, 0.97] * |
| Chronic disease awareness | ||||||
| No | Ref. | Ref. | Ref. | |||
| Yes | 2.12 | [1.57, 2.86] *** | 2.03 | [1.49, 2.78] *** | 2.04 | [1.49, 2.81] *** |
| Household size # | ||||||
| Just me | Ref. | Ref. | ||||
| 2 persons | 1.08 | [0.68, 1.73] | 0.99 | [0.61, 1.60] | ||
| ≥3 persons | 1.26 | [0.78, 2.04] | 1.20 | [0.71, 2.04] | ||
| Household income # | ||||||
| <EUR 1250 | Ref. | Ref. | ||||
| EUR 1250–2249 | 0.56 | [0.35, 0.91] * | 0.63 | [0.38, 1.05] | ||
| EUR 2250–3999 | 0.53 | [0.32, 0.88] * | 0.61 | [0.36, 1.04] | ||
| ≥EUR 4000 | 0.42 | [0.24, 0.74] ** | 0.49 | [0.26, 0.90] * | ||
| Migration background awareness | ||||||
| No | Ref. | |||||
| Yes | 1.36 | [0.95, 1.95] | ||||
| Age of children < 18years | ||||||
| No | Ref. | |||||
| 0–5 years | 1.26 | [0.81, 1.96] | ||||
| 6–13 years | 0.63 | [0.40, 1.01] | ||||
| 14–17 years | 1.14 | [0.65, 2.01] | ||||
| Employment | ||||||
| No | Ref. | |||||
| Yes | 0.81 | [0.57, 1.17] | ||||
| Work in health sector | ||||||
| No | Ref. | |||||
| Yes | 0.78 | [0.44, 1.39] | ||||
| Adjusted R2 | 0.09 | 0.10 | 0.11 | |||
Publisher’s Note: MDPI stays neutral with regard to jurisdictional claims in published maps and institutional affiliations. |
© 2022 by the authors. Licensee MDPI, Basel, Switzerland. This article is an open access article distributed under the terms and conditions of the Creative Commons Attribution (CC BY) license (https://creativecommons.org/licenses/by/4.0/).
Share and Cite
Tsai, F.-Y.; Schillok, H.; Coenen, M.; Merkel, C.; Jung-Sievers, C.; on behalf of the COSMO Study Group. The Well-Being of the German Adult Population Measured with the WHO-5 over Different Phases of the COVID-19 Pandemic: An Analysis within the COVID-19 Snapshot Monitoring Study (COSMO). Int. J. Environ. Res. Public Health 2022, 19, 3236. https://doi.org/10.3390/ijerph19063236
Tsai F-Y, Schillok H, Coenen M, Merkel C, Jung-Sievers C, on behalf of the COSMO Study Group. The Well-Being of the German Adult Population Measured with the WHO-5 over Different Phases of the COVID-19 Pandemic: An Analysis within the COVID-19 Snapshot Monitoring Study (COSMO). International Journal of Environmental Research and Public Health. 2022; 19(6):3236. https://doi.org/10.3390/ijerph19063236
Chicago/Turabian StyleTsai, Fang-Yi, Hannah Schillok, Michaela Coenen, Christina Merkel, Caroline Jung-Sievers, and on behalf of the COSMO Study Group. 2022. "The Well-Being of the German Adult Population Measured with the WHO-5 over Different Phases of the COVID-19 Pandemic: An Analysis within the COVID-19 Snapshot Monitoring Study (COSMO)" International Journal of Environmental Research and Public Health 19, no. 6: 3236. https://doi.org/10.3390/ijerph19063236