Article

Residential Mobility of a Cohort of Homeless People in Times of Crisis: COVID-19 Pandemic in a European Metropolis

1
Department of Psychiatry, Assistance Publique—Hôpitaux de Marseille, 13385 Marseille, France
2
Epidemiology of Zoonoses and Public Health Research Unit (GREZOSP), Faculty of Veterinary Medicine, Université de Montréal, Saint-Hyacinthe, QC J2S 2M2, Canada
3
EA 3279: CEReSS—Health Service Research and Quality of Life Center, School of Medicine—La Timone Medical Campus, Aix-Marseille University, 13005 Marseille, France
4
Aix Marseille Univ, IRD, INSERM, SESSTIM, ISSPAM, AP-HM, La Timone Hospital, BioSTIC, Biostatistic & ICT, 13005 Marseille, France
5
Support Unit for Clinical Research and Economic Evaluation, Assistance Publique Hôpitaux de Marseille, 13385 Marseille, France
6
Médecins du Monde—Doctors of the World, 13003 Marseille, France
7
Laboratoire de Sciences Sociales Appliquées/Projet ASSAb, 13001 Marseille, France
*
Author to whom correspondence should be addressed.
Int. J. Environ. Res. Public Health 2022, 19(5), 3129; https://doi.org/10.3390/ijerph19053129
Submission received: 5 January 2022 / Revised: 8 February 2022 / Accepted: 18 February 2022 / Published: 7 March 2022
(This article belongs to the Topic Burden of COVID-19 in Different Countries)

Abstract

:
Most vulnerable individuals are particularly affected by the COVID-19 pandemic. This study takes place in a large city in France. The aim of this study is to describe the mobility of the homeless population at the beginning of the health crisis and to analyze its impact in terms of COVID-19 prevalence. From June to August 2020 and September to December 2020, 1272 homeless people were invited to be tested for SARS-CoV-2 antibodies and virus and complete questionnaires. Our data show that homeless populations are sociologically different depending on where they live. We show that people that were living on the street were most likely to be relocated to emergency shelters than other inhabitants. Some neighborhoods are points of attraction for homeless people in the city while others emptied during the health crisis, which had consequences for virus circulation. People with a greater number of different dwellings reported became more infected. This first study of the mobility and epidemiology of homeless people in the time of the pandemic provides unique information about mobility mapping, sociological factors of this mobility, mobility at different scales, and epidemiological consequences. We suggest that homeless policies need to be radically transformed since the actual model exposes people to infection in emergency.

1. Introduction

The mobility of the homeless within large North American and European cities prior to the health crisis remains a little studied phenomenon [1]. Some studies indicate that this mobility is greater than that of the general population in the same city [2,3]. Homeless people move within a city in order to find sustenance. According to Kaufman [4], research concerning the mobility of homeless people emphasizes moves within cities and reveals seven factors that are worthy of note: housing; labor markets; social, health, and justice services; personal health; the attributes of different places; interpersonal networks; and how mobility is socially differentiated. Homeless people from all kinds of accommodation were found to have a notable daily mobility [5], but little is known about their residential mobility over several months. Homeless people may also settle transiently, episodically, or chronically in a shelter [6].
To help homeless people exit homelessness, authorities implement rehousing programs. Most traditional rehousing programs assume that a person’s homelessness is the result of poor decision-making [7,8]. Most traditional programs such as “step-by-step” are clustered and supervized so that residents can become “housing ready” [9]. Although the goal of rehousing programs is to end homelessness, on average it takes over 10 years for people to move out of these types of living conditions [10]. The reality is that many people are caught in an “institutional circuit” of homelessness, hospitals, and prisons [11]. There is growing evidence that, while traditional housing programs manage homelessness, they are not particularly effective in ending it [12,13].
On 11 March 2020, the COVID-19 epidemic was declared a pandemic by the WHO [14]. The consequences of this crisis are also economic and social, particularly affecting the most vulnerable people [3,15]. Studies have shown that homeless people are at a greater risk of SARS-CoV-2 infection than the general population [16,17]. Homeless people have suffered from the disruption of their living and collecting places due to the epidemic. Allaria et al. (2021) [18] reported that the lockdown of the general population in France severely impacted the survival systems of the populations furthest from housing, with alarming rates of people without access to water or food. In addition, 77% of homeless participants reported that they encountered significant financial difficulties. Under the effects of a pandemic, there are additional constraints that are specific to the health crisis, which compound those constraints that are specific to homelessness: emergency accommodation link, continuation of a disrupted economic activity, etc. NGOs and the French public authorities took measures to help homeless people and provide them with shelter, especially during the initial lockdown. Conversely, emerging data have shown that homeless people living on the street appear to be at a lower risk of SARS-CoV-2 infection than people that are living in shelters [19,20]. This observation may be due to asymptomatic infections, which account for approximately 17% of cases [21]. The problem of asymptomatic infection is particularly important in congregate shelters, as asymptomatically infected persons can unknowingly transmit the infection to a large number of people in a short period of time [21]. Disrupted mobility may also play a role in the patterns of SARS-CoV-2 infection in the homeless population. Indeed, shelters where large numbers of people transit are more likely to have a high prevalence of SARS-CoV-2 infection [19,20].
A study of homeless people in the Netherlands indicates that mobility and access to shelters that were opened at the beginning of the pandemic differed according to the category of origin of precarious people [22]. However, we do not know what socio-economic variables are associated with them and what the exact consequences are for the mobility and sheltering of these people.
The pandemic is a good example of the effectiveness of the traditional type of rehousing program in times of crisis. It allows us to see how the pandemic accelerated the problems of access to housing in various vulnerable populations.
We hypothesized that the mobility of homeless people would be disrupted by the SARS-CoV-2 epidemic in terms of housing type and between neighborhoods in the city. We hypothesized that this mobility would differ according to the socio-economic characteristics of the homeless and that this mobility would have an impact in terms of epidemiology.
To study this hypothesis, we followed a large cohort of the most precarious people in Marseille, a large European city with a high rate of poverty and inequality. Marseille is a city of a rich country, a gateway to France and the European Union for many people from poorer countries. It could be representative of a city in a rich country that is close to poor countries attracting a high level of illegal and legal immigration. The fact that this city has many well identified associations allowed us to have a large number of respondents to our study, which provide a good representation of the precarious populations we studied.
In this study, we aimed to assess the homeless mobility and its epidemiological consequences in the context of the COVID-19 crisis.

2. Materials and Methods

2.1. Study Design

We conducted a prospective population-based cohort study of homeless people that were living on the streets, in shelters, or squats and slums: the COVID-Homeless survey (registered on ClinicalTrials, NCT04408131, 29 May 2020). This study aimed to exhaustively include participants from all shelters and outreach teams of the city. Each subject was tested twice: the first study lasted from 5 June–5 August 2020 (first campaign), and the second three months later, 11 September–18 December 2020 (second campaign). The homeless persons that were followed were tested for SARS-CoV-2 antibodies and answered a questionnaire concerning their life habits, socio-demographic data, and recent geographic and residential movements.

2.2. Study Area

The study area was the city of Marseille. Marseille is the second largest city in France, but also the poorest. It is situated in the Southeast of France, in the Bouche du Rhône department, which was particularly affected by SARS-CoV-2. A large public health survey estimated the seroprevalence of SARS-CoV-2, based on 12,400 samples that were taken in May 2020, to be 4.5% for the whole of France and 5.2% for the French region of Provence-Alpes-Côte d’Azur in which our study area was located [
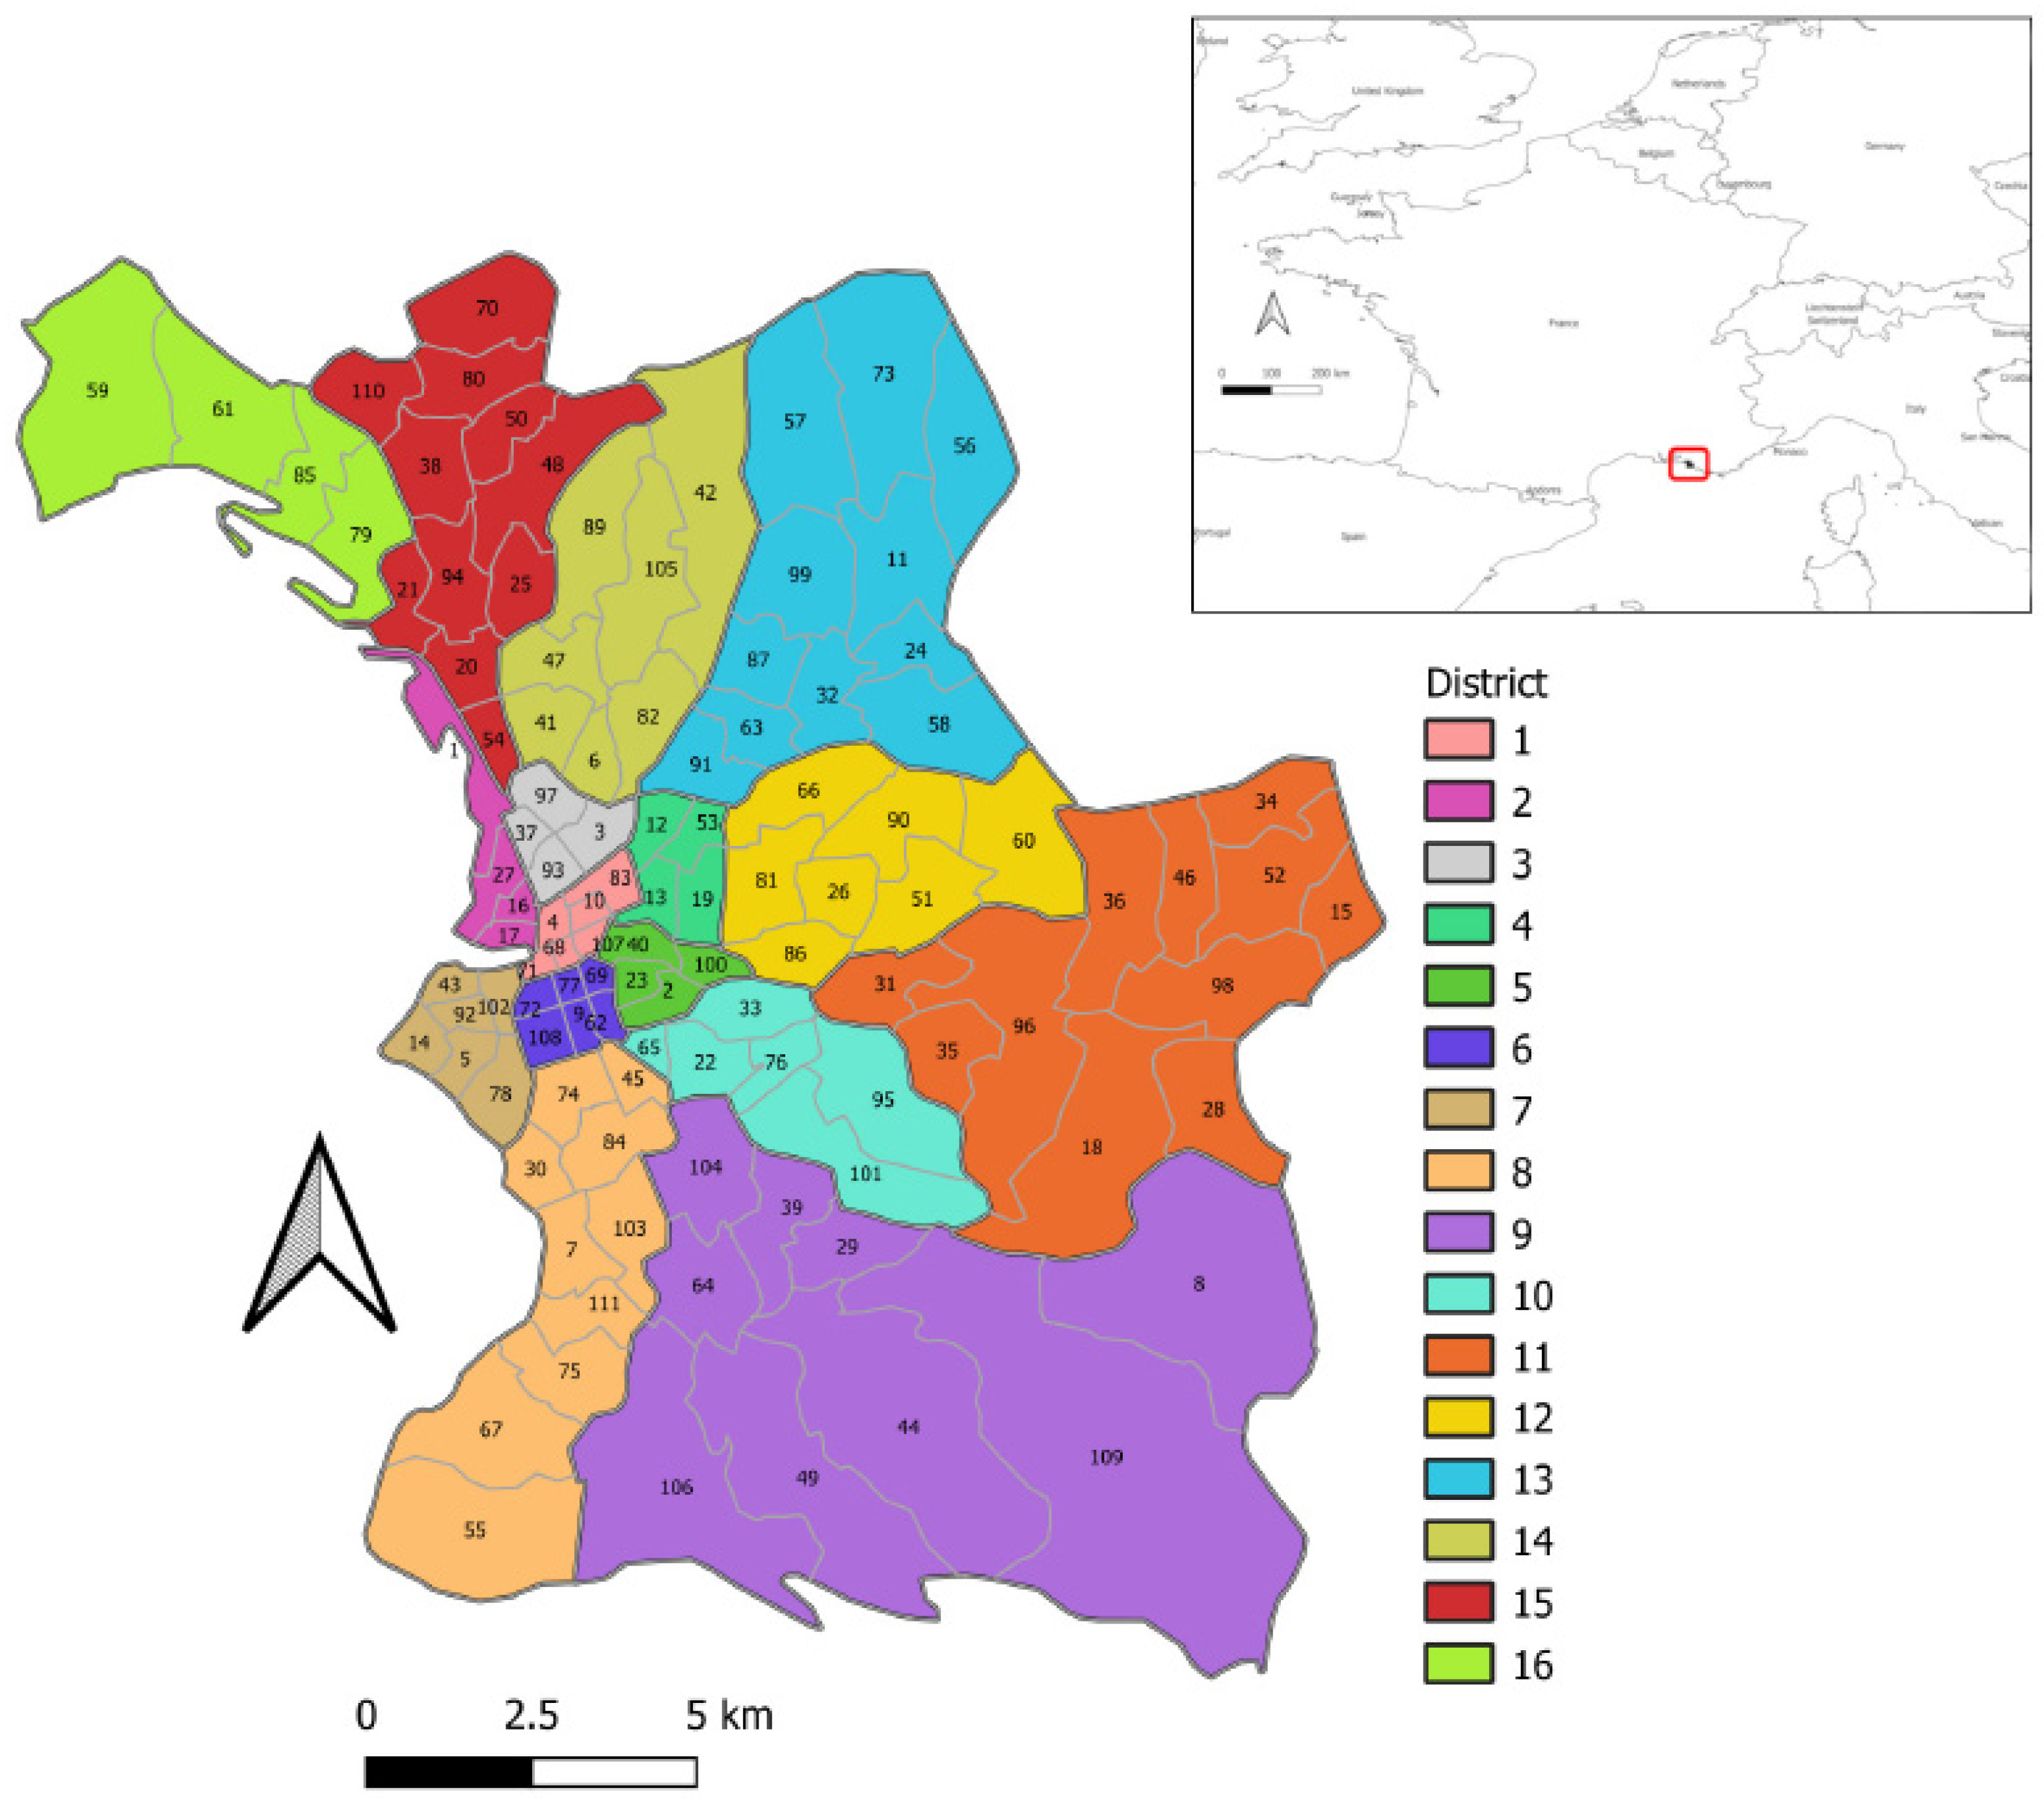
23]. On 17 March 2020, France entered its first lockdown, which ended on 11 May 2020. Following a resurgence of the epidemic after the summer of 2020, a second national confinement was decreed from 30 October to 15 December 2020. Marseille, similar to all French cities, is divided into 3 administrative divisions, from the largest to the smallest: 16 districts, 111 neighborhoods, and 742 units of equal size, called IRIS [24]. Most statistics and maps in this study are at the neighborhood scale, such as Figure 1, which depicts a map of the districts and neighborhoods in Marseille, France. This map shows the study area and is useful for associating district names with their locations in spatial analysis results.
Marseille is the second most populous city in France, suffering a high level of poverty [25]. More than one out of two residents live below the poverty line (51.3%) [
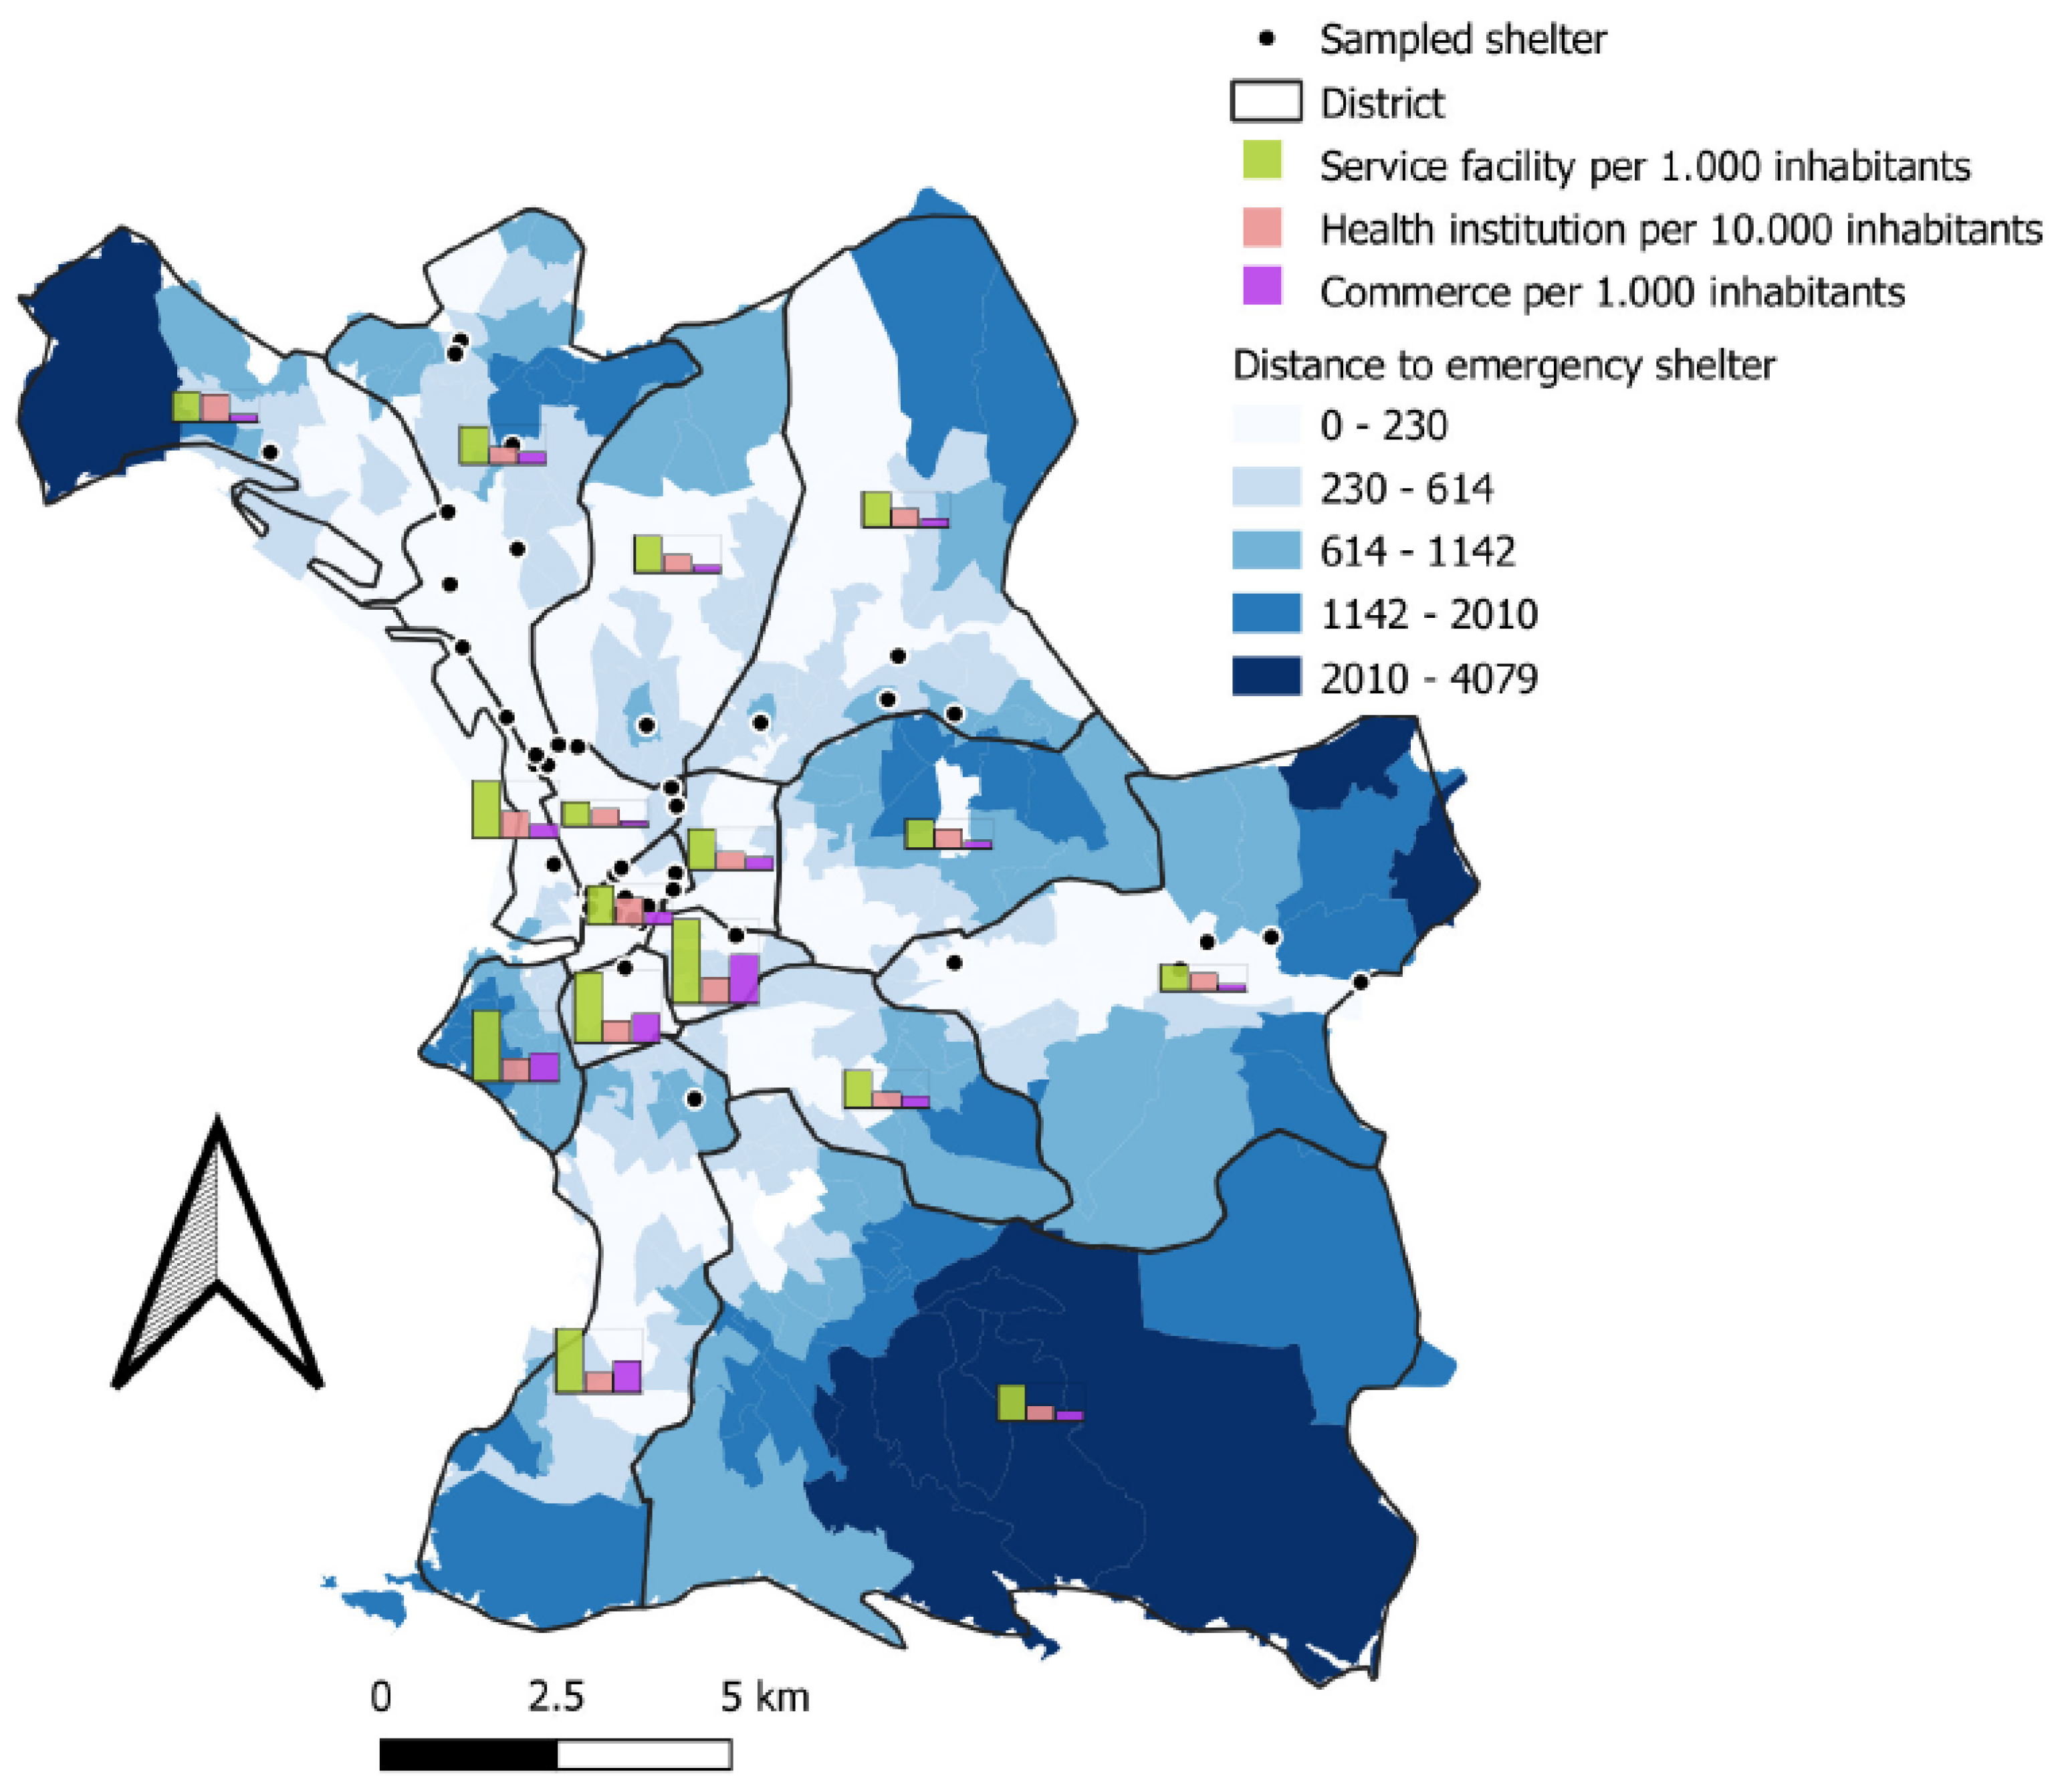
26]. Marseille’s impoverished neighborhoods contrast markedly with the wealthy areas of the city, which benefit from good access to personal services, health institutions, and shops, demonstrated by INSEE (French National Institute of Statistics and Economic Studies) classifications. Figure 2 shows the heterogeneous distribution of emergency accommodation in Marseille in relation to the different types of services. Figure 2, in the context of a study on precariousness and mobility, presents the state of healthcare supply and potentially the geographical factors of health inequality.

2.3. Population

In order to focus on the homeless people the furthest from housing, we decided to select those characterized by the greatest residential instability: people sleeping rough, in squats or slums, in stabilization shelters, in emergency shelters, or hostels, respectively, corresponding to the following categories of the European typology of homelessness (ETHOS): ETHOS 1, 2, 3, and 8 [27]. In the absence of a point-in-time count, random sampling was impossible.
However, data from the local orientation system for emergency and transitional accommodation (SIAO) and the NGO Doctors of the World estimated that in 2020, at the beginning of the COVID-19 outbreak, there were 2322 homeless adults living in emergency, transitional shelters, or hostels and 619 to 817 living in squats or slums. No point-in-time census was available for people that were living on the streets in Marseille.
We set a 2-month inclusion period, during which we systematically offered all homeless people that were aged over 18 to participate in the study. The recruitment of participants was also facilitated by the “Accés aux Soins des Sans Abris (ASSAb) network” of assistance to homeless people: 18 homeless outreach teams that were working in streets, hotels, squats, or slums; 5 emergency shelters; and 10 transitional accommodations. All the participants provided written informed consent. ETHOS categories were allocated according to the primary living location for the people that were questioned.

2.4. Study Design

The participants were interviewed by trained cultural community health workers in the language of the participants and also using a questionnaire. This questionnaire collected data on the sociodemographic characteristics, medical history and type, and history of housing. The homes of the participants were georeferenced. Questions were asked by trained local interviewers in the participants’ native language to improve comprehension and to minimize information bias [28].

2.5. Biological Analysis

All the participants had a rapid serological test. People with symptoms were invited to be tested by SARS-CoV-2 PCR screening. We used the rapid serological test “Biosynex COVID-19 BSS®”, providing the information about the presence of immunoglobulins M (IgM) and G (IgG) in 10 min. A Biosynex vitaPCR® was performed in case of symptoms of COVID-19 disease during the interviews [29], which provides results within 20 min.

2.6. Outcomes and Data Analysis

SARS-CoV-2 history of infection was defined by a positive SARS-CoV-2 serology (IgM or IgG) during the study period. All of the statistical analyses were carried out using R software [30], and differences with p values of <0.05 were considered statistically significant.
Maps were made using QGIS software [31]. Data on the administrative boundaries of the city come from French government databases. In the absence of indications to the contrary, complete case analyses were performed.

2.6.1. Socio-Demographic Factors and Living Areas

A Hill and Smith analysis were performed with the R package ade4 [32,33]. This analysis generalizes the PCA (principal components analysis) method to be used with quantitative variables and factors [34]. The results and graphs read like those of a PCA [35]. This analysis was based on the responses of the participants in the first testing session. We used the sociodemographic characteristics variables of our population to perform this analysis. We used stochastic regression imputation to assess the variables for individuals with missing data, using the R package ‘mice’ [36].

2.6.2. Relation between Mobility at the Individual Scale and Infection with SARS-CoV-2

To find out if the number of accommodations in the past year was significantly associated with having a positive serological test for SARS-CoV-2, we used a univariate logistic regression model. The independent variable was the number of accommodations since the pandemic and the dependent variable was the presence or absence of antibodies to SARS-CoV-2 at the individual level. To know the number of accommodations since the pandemic, we used the following question: “What is the person’s current housing?” followed by the question “and before?”. We repeated the “and before?” question until we went back to the beginning of the pandemic. The total number of different housing units that were filled in corresponded to the number of accommodations since the pandemic.

2.6.3. Life Paths: Mobility at the Housing Scale

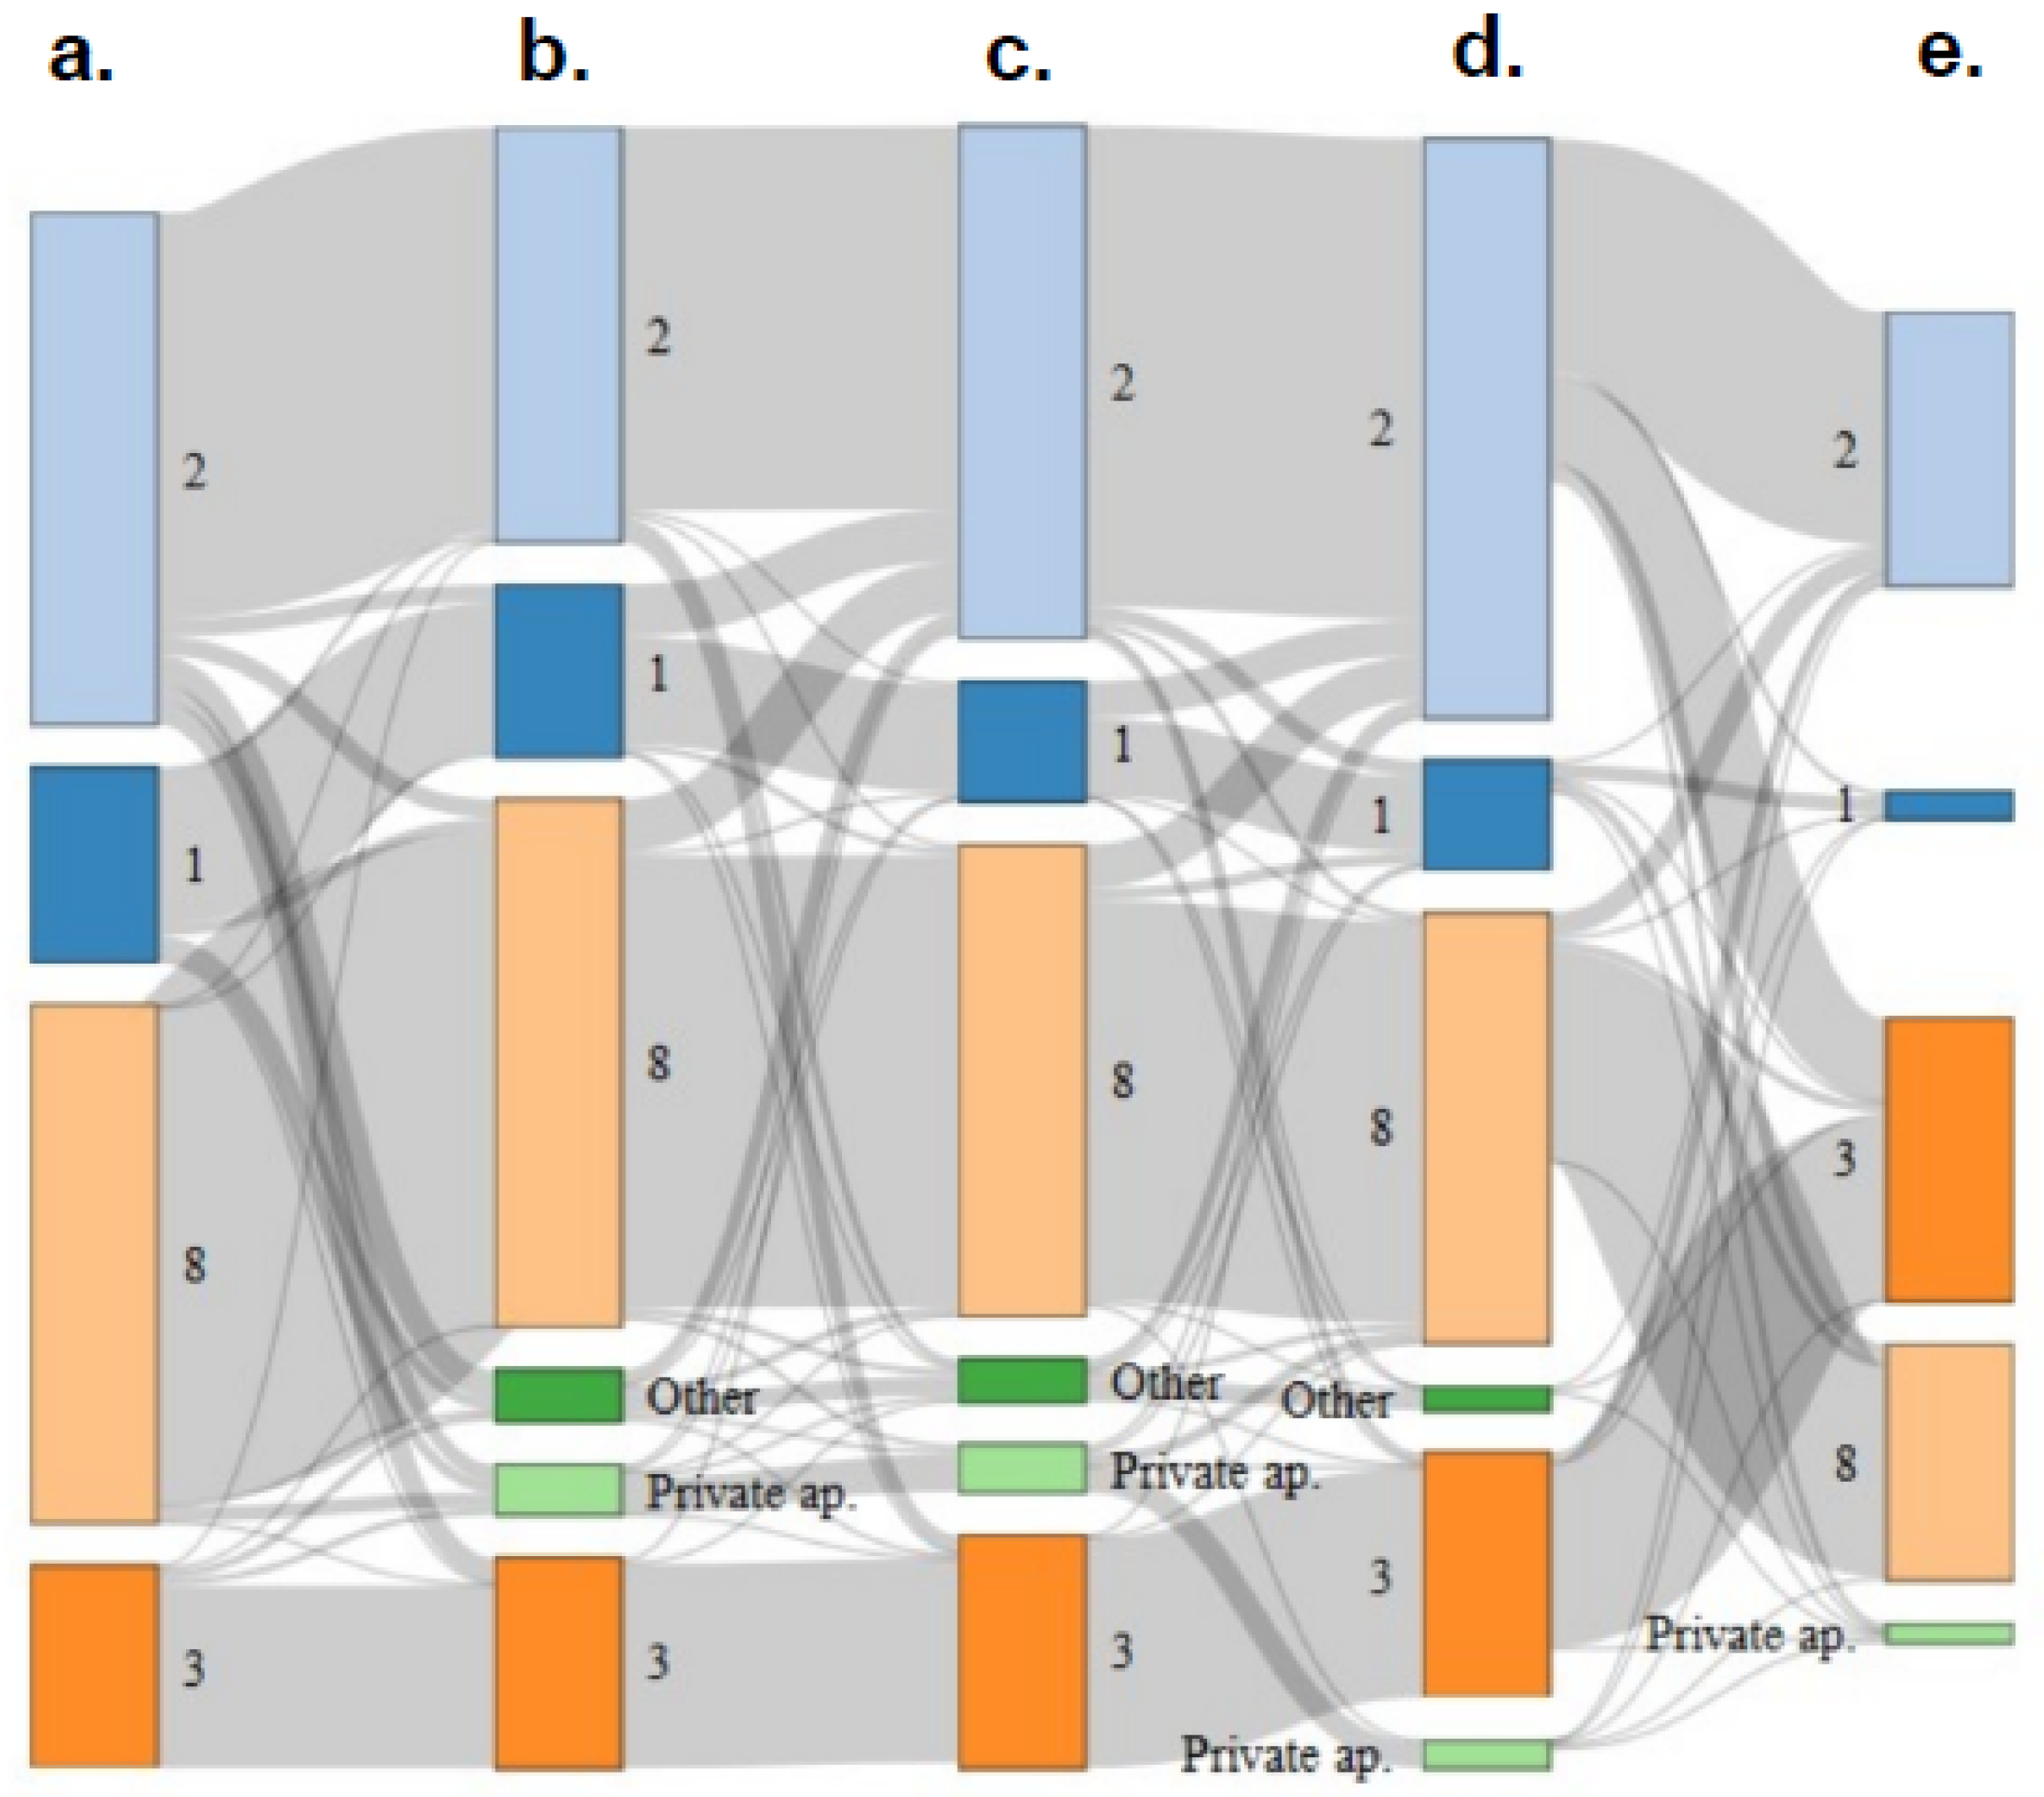
To illustrate mobility at the housing level, we used a Sankey diagram that shows mobility between ETHOS at 5 different time periods. The different periods were as follows: before the beginning of the health crisis (24 January 2020), before the lockdown (between 24 January and 16 March 2020), during the lockdown (between 16 March and 11 May 2020), and after the lockdown (between 11 May 2020 and 5 August 2020). All of this information was requested during the first campaign session. We also collected this information during the second test session (between 11 September and 18 December 2020) (second campaign). A Sankey Diagram was made using R software and the package networkD3 [37].

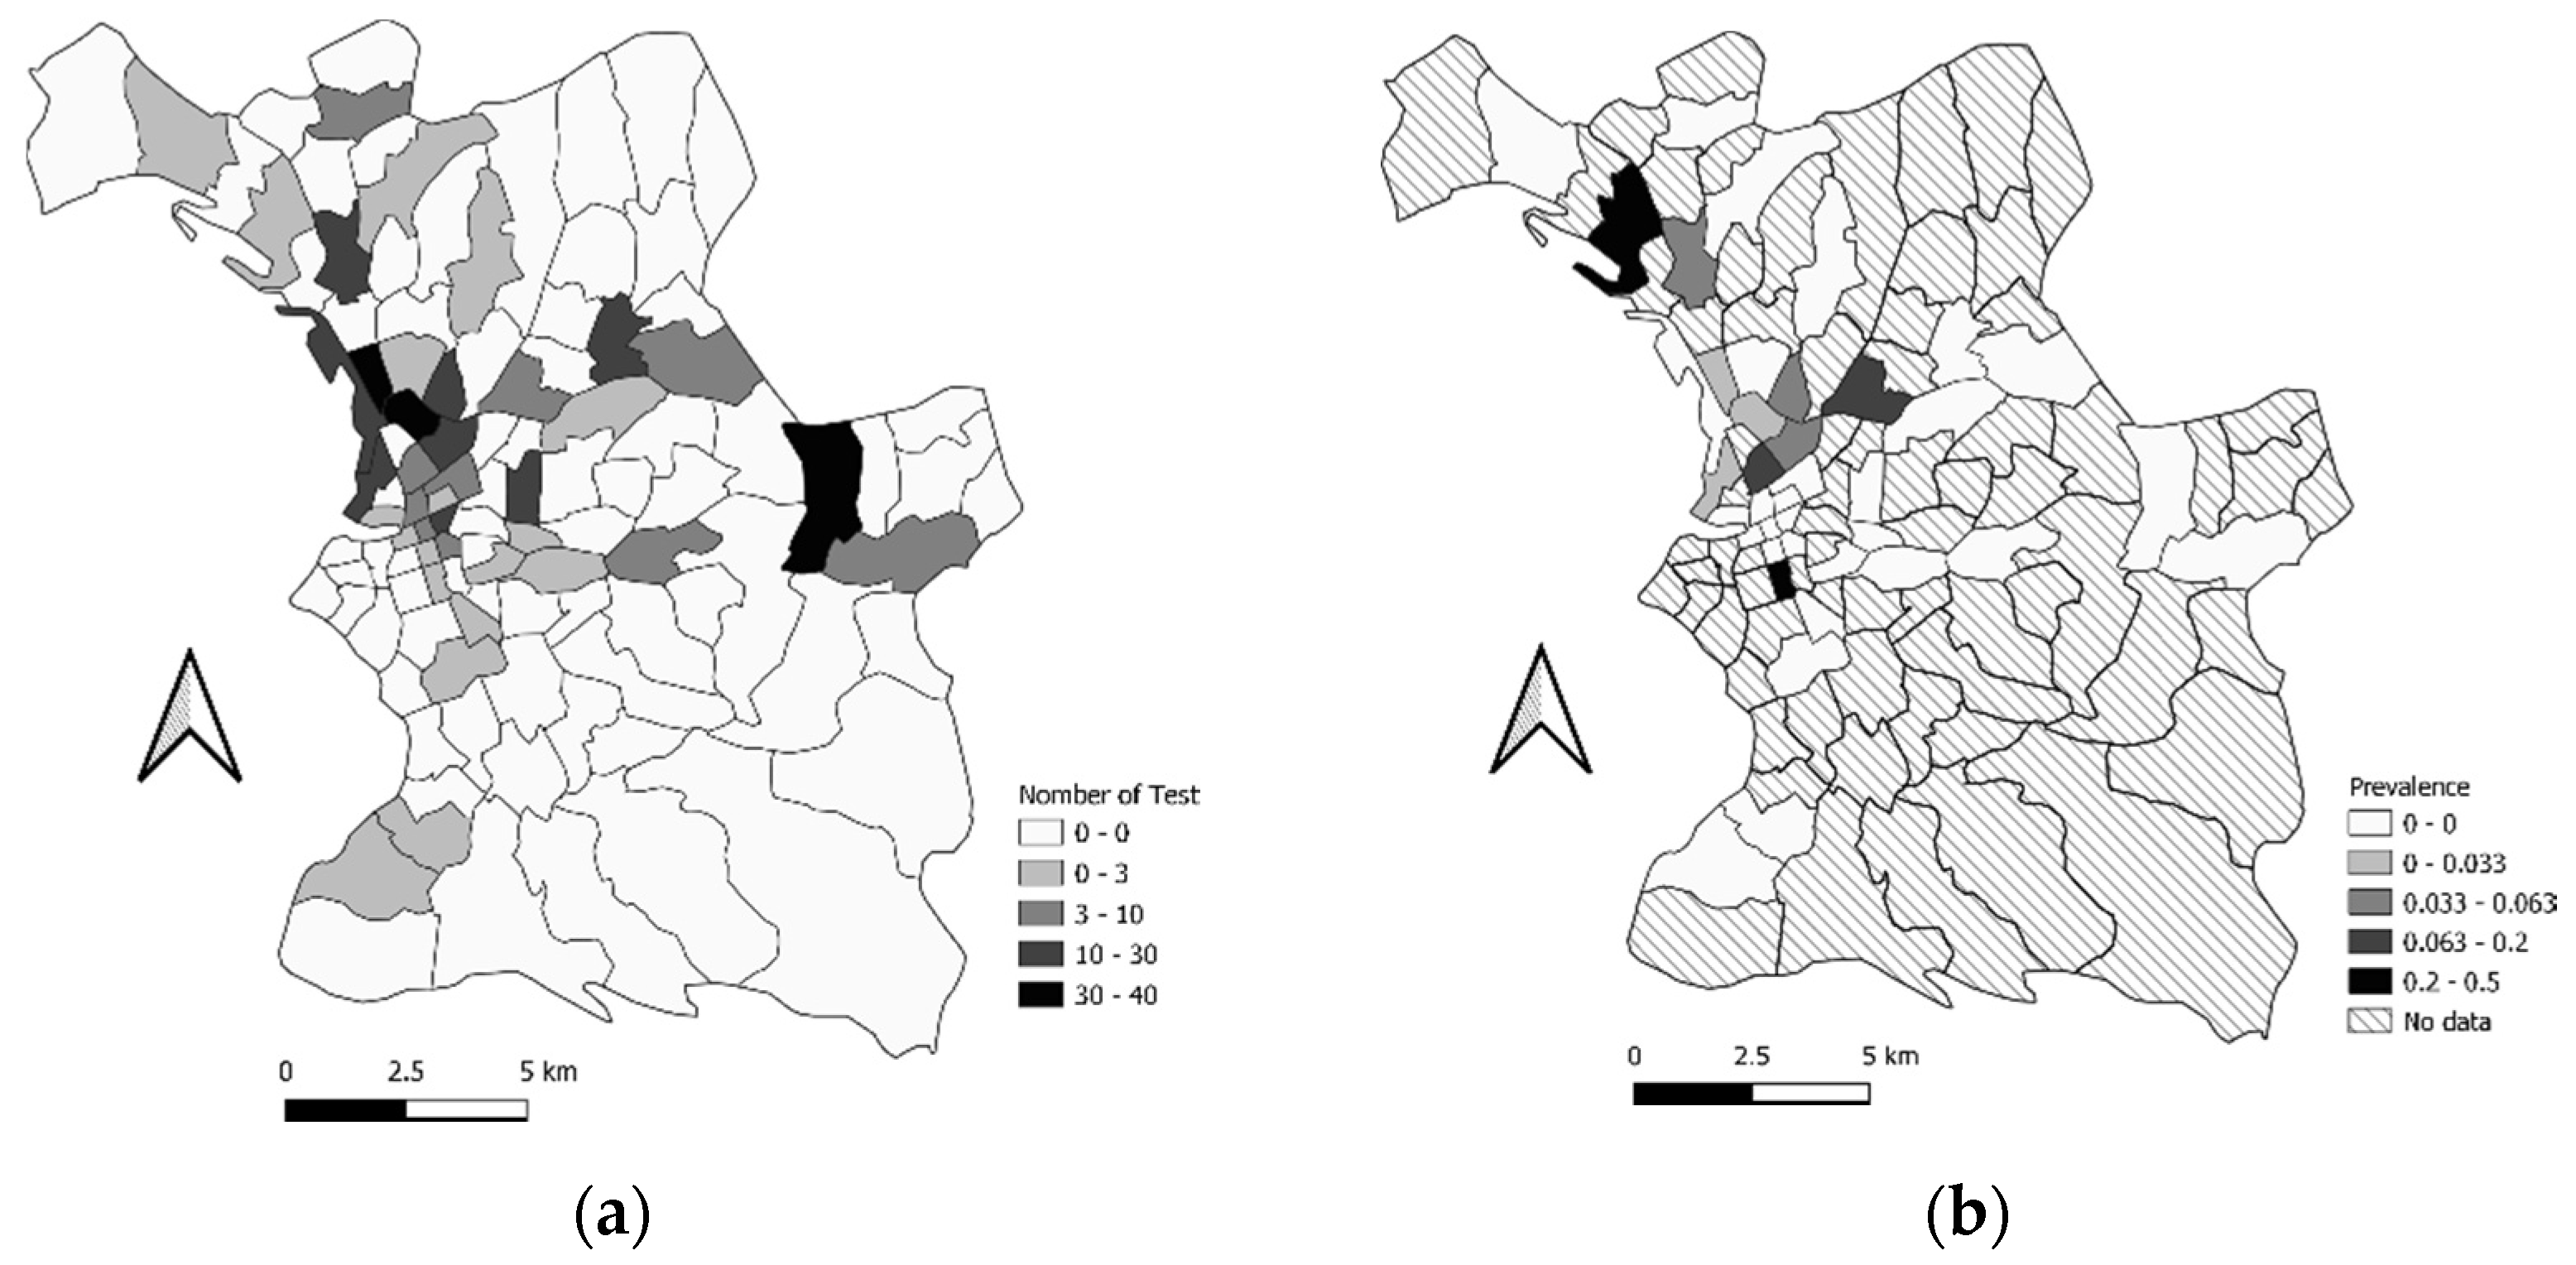
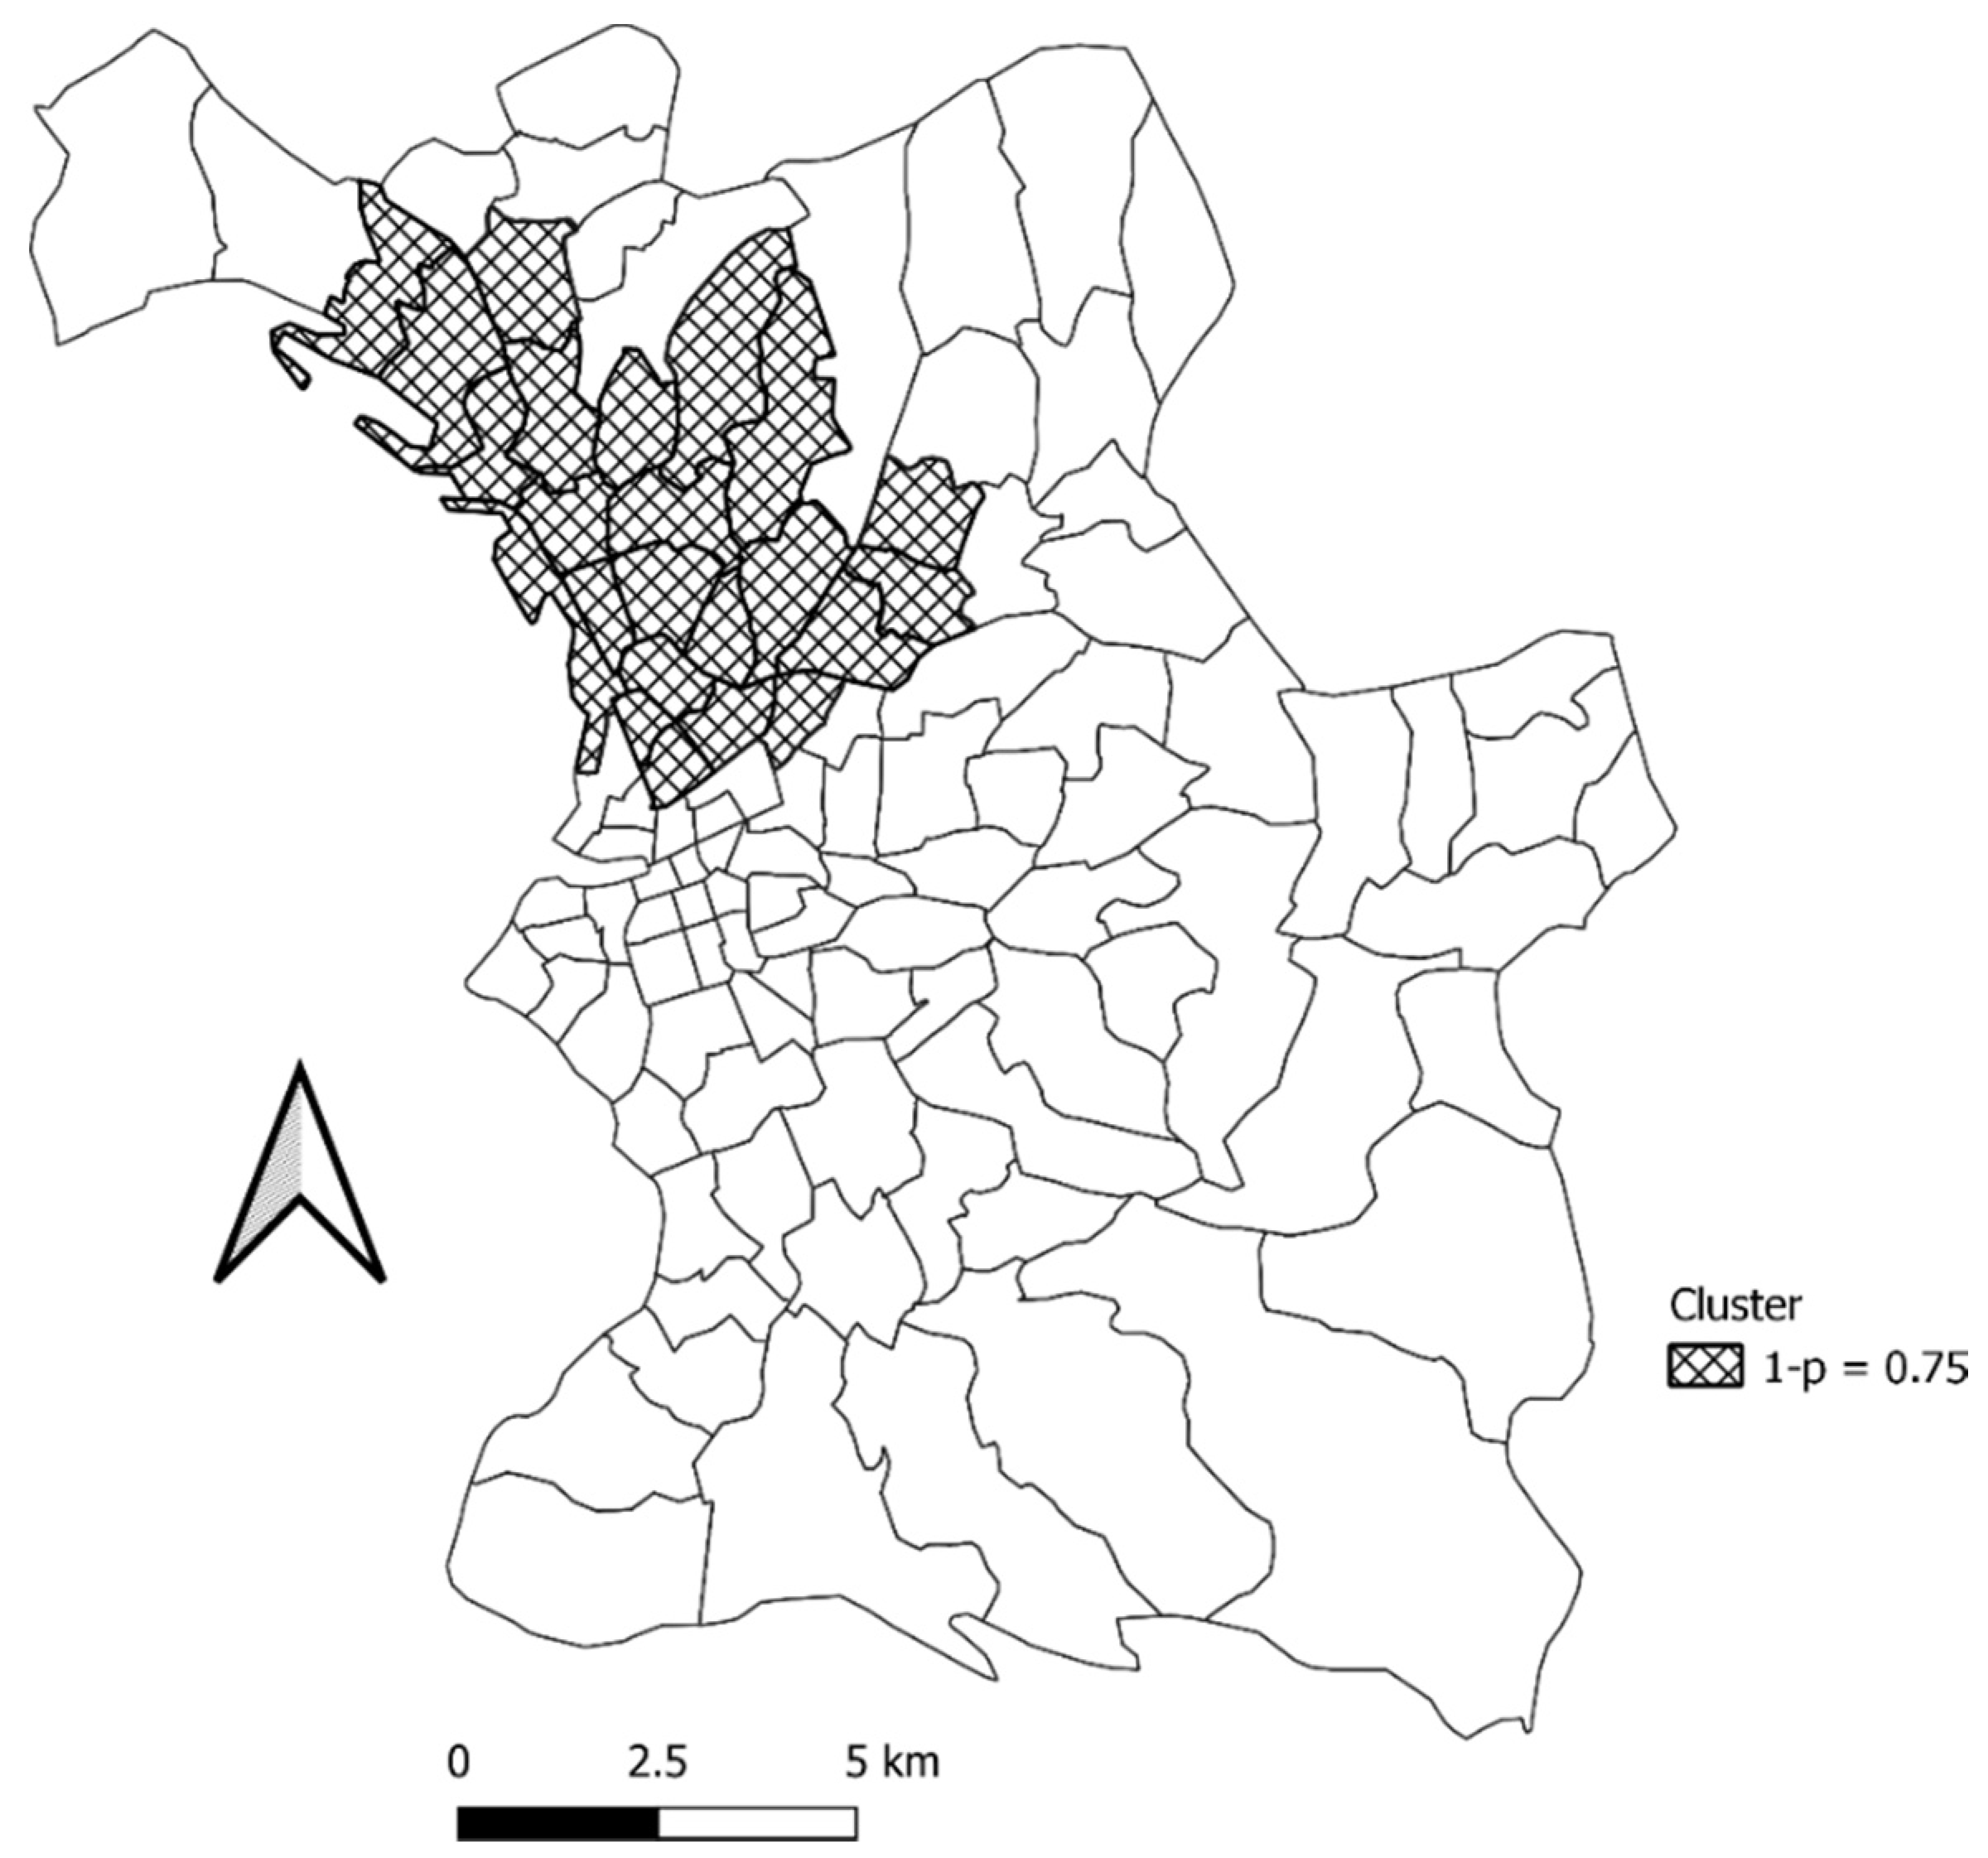
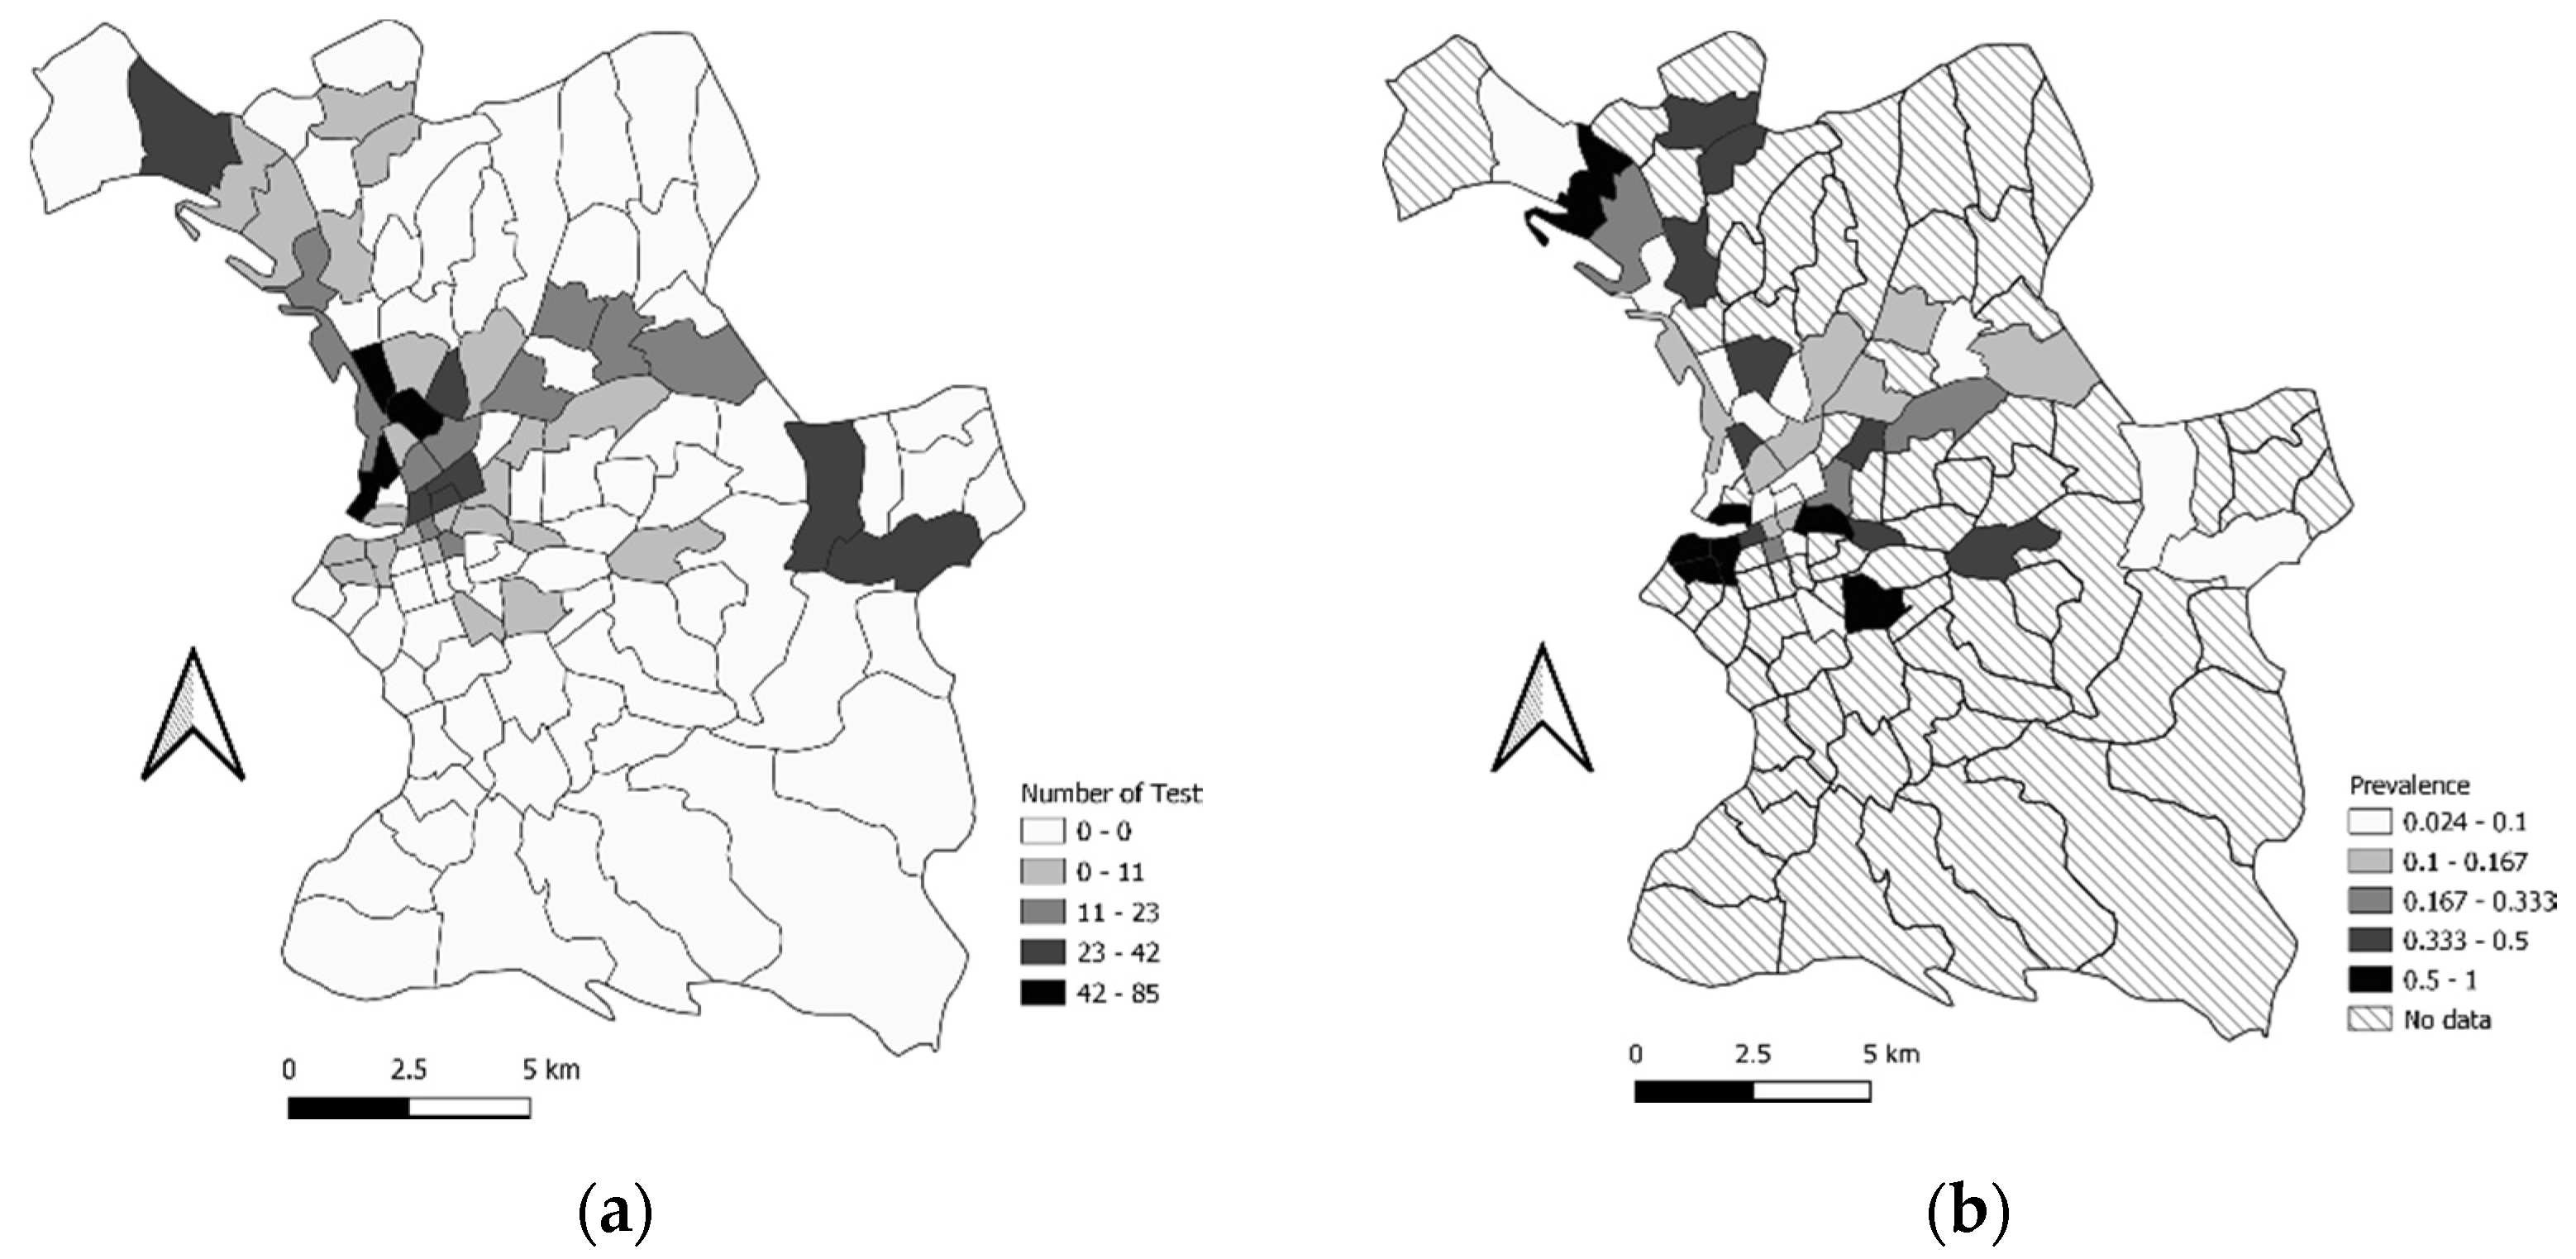
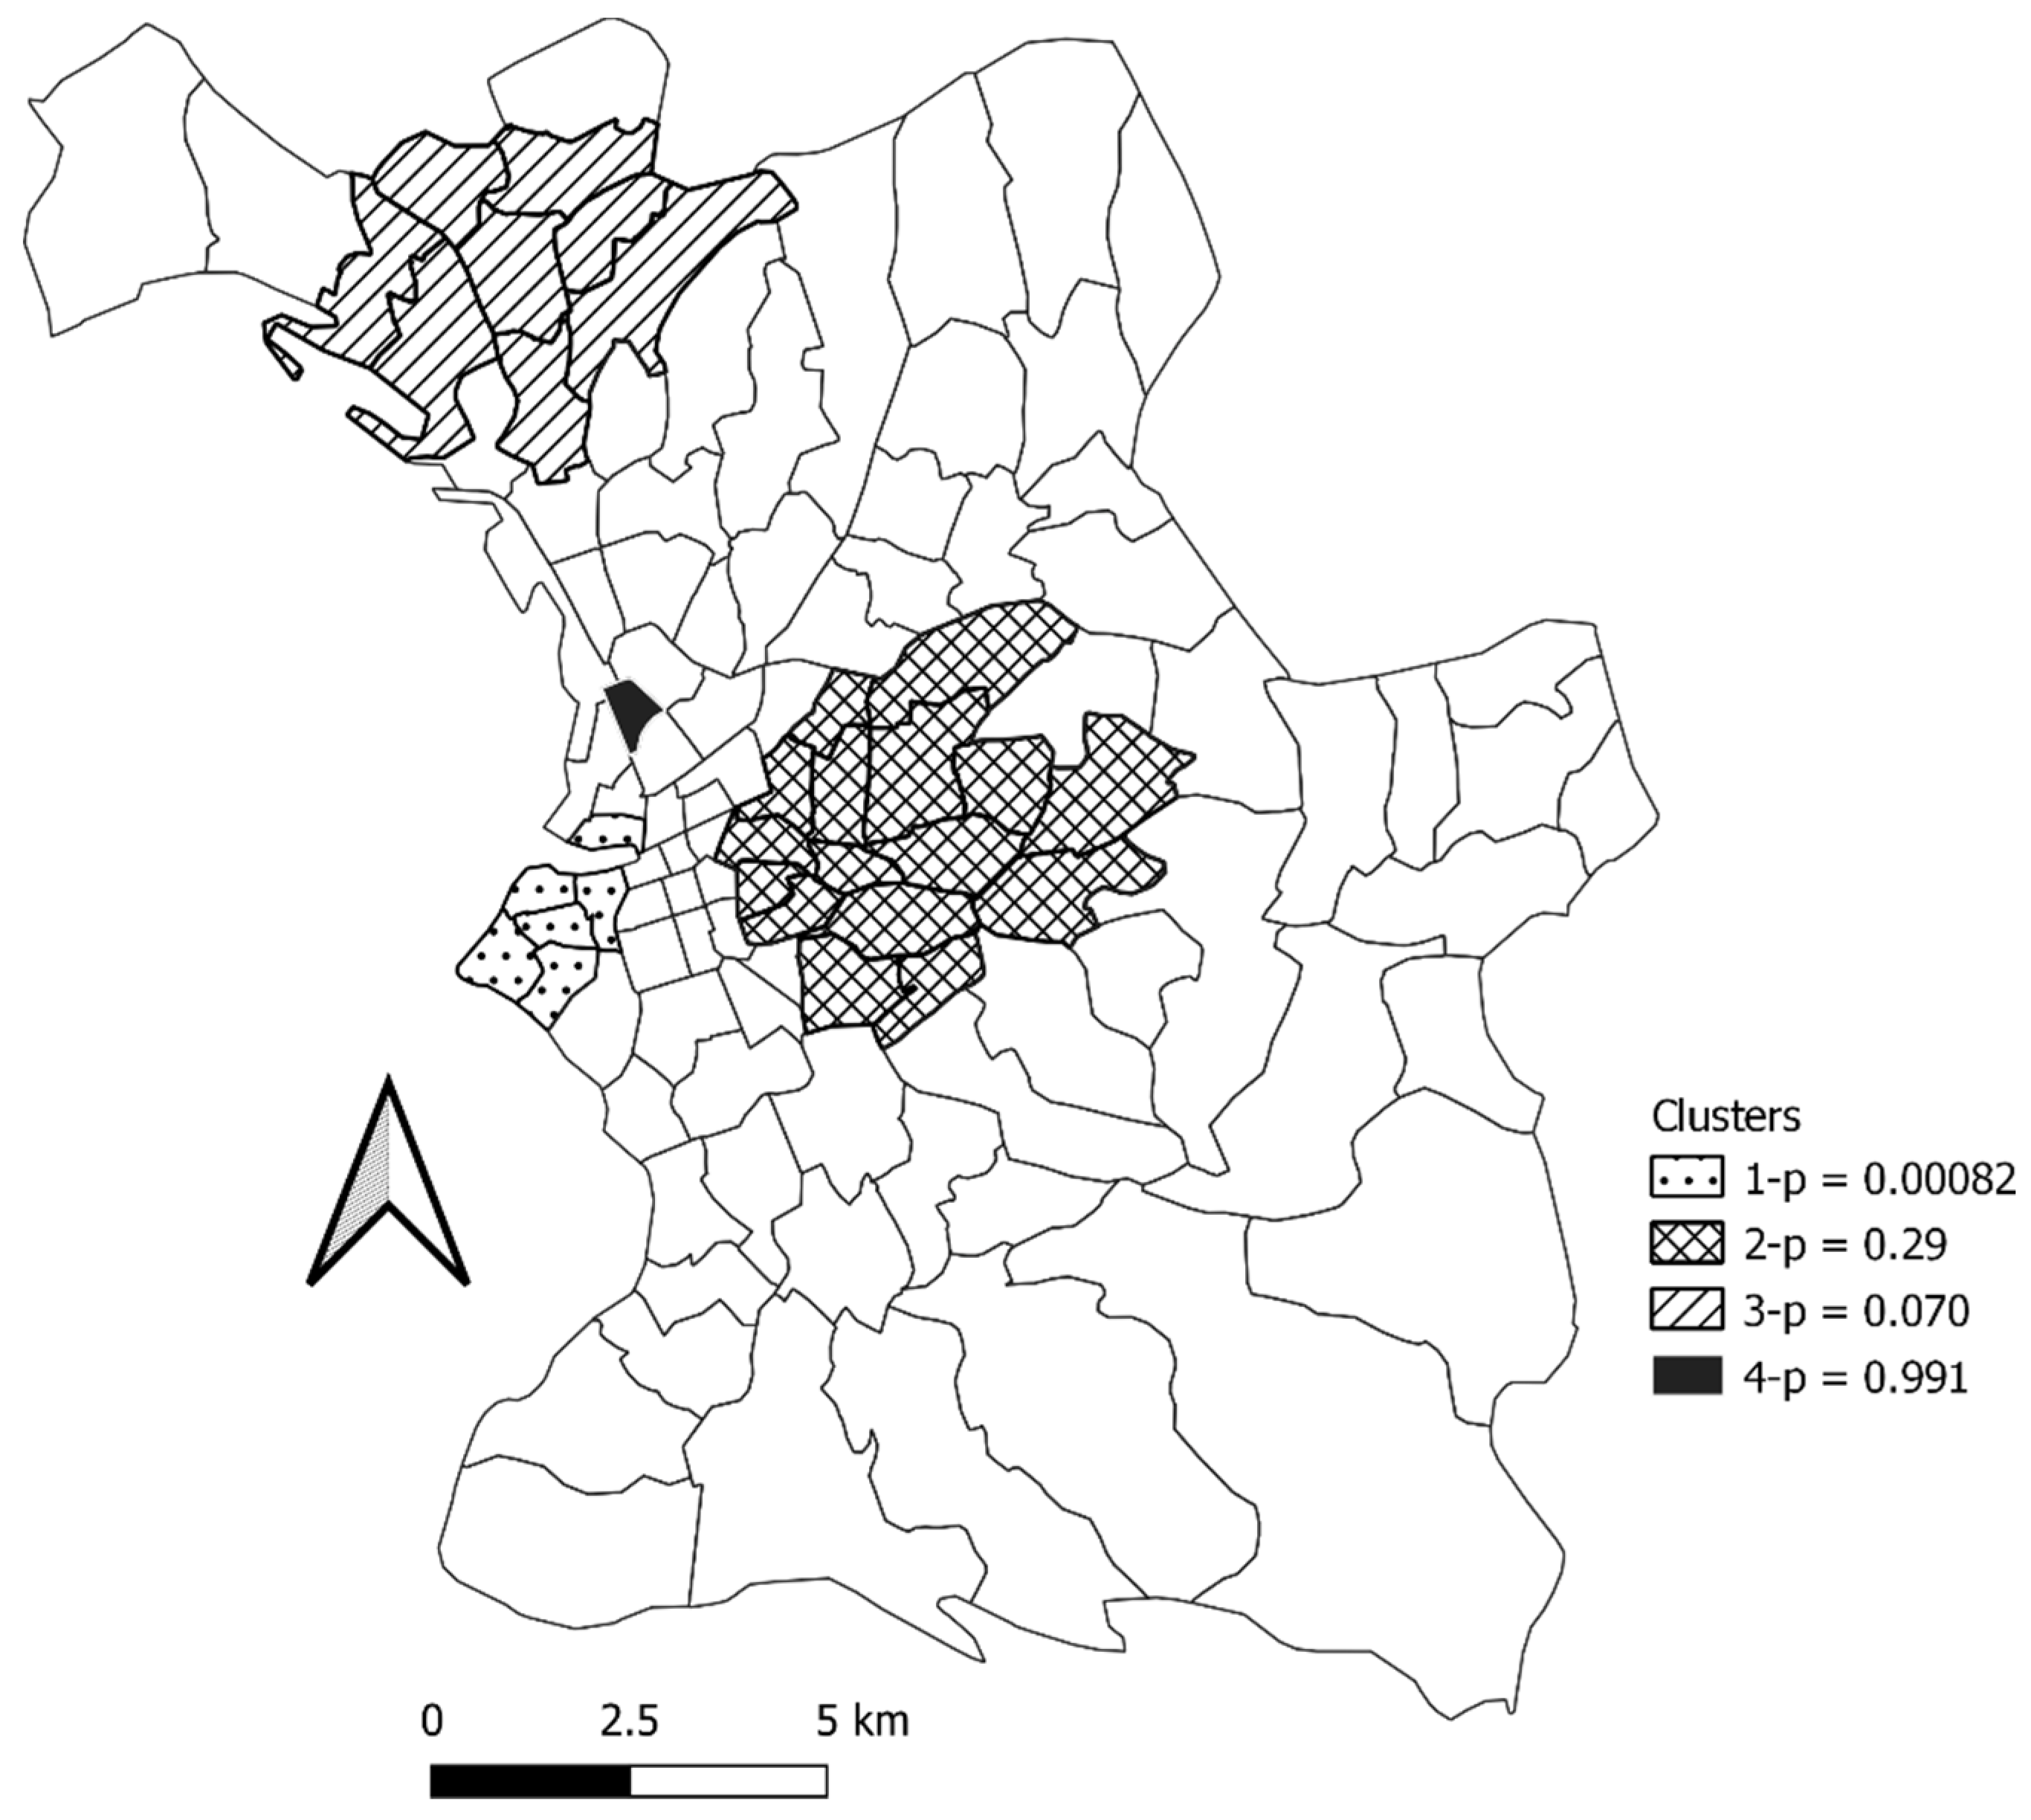
2.6.4. Mobility and Spatial Epidemiology at the Neighborhood Scale

Satscan software [38] was used for cluster analysis to detect the possible locations where the number of cases was higher than expected. We performed cluster analysis for the serological results for the first and second campaigns. We purely used spatial analysis for scanning for clusters with high rates. We used the Bernoulli distribution and an elliptic window shape for scanning, with a maximum spatial cluster size of 50 percent of population at risk.

2.7. Ethical Approval

The study was approved by the ethics committee Comité de Protection des Personnes d’Ile de France VI on 28 May 2020 (number 44–20). All of the people that were included in this study provided written informed consent. The database was anonymized and declared to the French regulatory commission (Commission Nationale Informatique et Libertés, CNIL, n°2018172v0).

3. Results

We included 1272 people in the cohort (Table 1) and 738 provided additional data during the second serological testing step (58.02% of included people).
In the first campaign, the majority of the individuals were male (70.29%, 894/1272), with an average age of 40.06 years (standard error: 0.40) and 6.01% (74/1231) testing positive for SARS-CoV-2. In the second campaign, the majority of the individuals were male (71.7%, 545/738), with an average age of 41.76 years (standard error: 0.54). 18.86% (136/721) had SARS-CoV-2 antibodies.

3.1. Socio-Demographic Factors and Living Areas

In the Hill and Smith analysis, axis 1 contrasted two types of people. The first group comprised of people that were born in France, who take drugs, whose education was lower secondary, who were isolated parents, and live in ETHOS 1. The opposing group characteristics were female, that were born in European countries including non-members of the European Union (EU), who lived in families, and lived in ETHOS 8 housing (Figure 3, Appendix A Table A1). Axis 2 opposed two types of people. The first group concerned people that were born in countries of sub-Saharan or Southern African countries, Middle-Eastern countries, and North and South American countries, who did not smoke. They were contrasted with people that were born in European Union countries and in France, who took drugs, who have been homeless for more than 5 years, and lived in ETHOS 1 housing (Figure 3, Appendix A Table A1). The housing situation was an important variable in this analysis (Appendix A Table A1). On the first axis of the analysis, ETHOS 1, 2, and 3 are opposed to ETHOS 8. On the second axis, ETHOS 1 and 8 are opposed to ETHOS 3 and 2.

3.2. Relation between Mobility at the Individual Scale and Infection with SARS-CoV-2

The average number of different accommodations since the pandemic was 1.718 (standard error: 0.034), with 94 missing data. The number of different accommodations since the pandemic was significantly associated with having a positive serological test for SARS-CoV-2 (Table 2).

3.3. Life Paths: Mobility at the Housing Scale

Before the beginning of the health crisis (January 2020), 13.08% of the people were counted in ETHOS 1 (166/1270), 35.2% in ETHOS 2 (447/1270), 38.19% (485/1270) in ETHOS 8, and 13.54% in ETHOS 3 (172/1270) (Figure 4). Between January 2020 and March 2020, beginning of the first lockdown, 13.63% (165/1211) of the population changed their accommodation status. During the first lockdown (March to May 2020), 15.27% (178/1166) of people moved. The most important flows were those of people going to ETHOS 2 (emergency shelters). Thus 30.56% (44/144) of people in ETHOS 1 before the first lockdown went to ETHOS 2 during the first lockdown, 9.84% (44/447) of people in ETHOS 8 went to Ethos 2, and 27.27% (12/44) of people in the ‘other’ category also went to ETHOS 2. Although a number of people left ETHOS 2 to go primarily to ETHOS 3 (4%, 14/352) between these dates, the flows were positive for ETHOS 2, which saw its population increase from 29.10% (353/1213) of reported housing types to 36% (440/1223) during the lockdown. After the first lockdown (ending in 11 May 2020), 13.85% (168/1213) of people moved. ETHOS 2 continued to receive people. Thus 31% (31/100) of people that were in ETHOS 1 during the lockdown went to ETHOS 2 after the lockdown. 9.18% (37/403) of people in ETHOS 8 went to ETHOS 2 after the lockdown, and 27% (10/36) of people in the other category went to ETHOS 2 as well. Between the two testing sessions (May to December 2020), 23.17% (165/712) of people moved. The most important flow was between people in ETHOS 2 after the lockdown and those in ETHOS 3 during the second testing session: 24.4% (71/291). This flow corresponded to people in emergency shelters who went to homeless hostels (transitional hostels, temporary accommodation, or transitional accommodation with support).

3.4. Mobility and Spatial Epidemiology at the Neighborhood Scale

For the population dynamics of mobility between the first and second campaigns, we have information about 377 people in the first campaign and 721 in the second campaign. We have information about the population dynamics in 45 of the 110 neighborhoods in Marseille. Of these 45 neighborhoods, 21 (46.7%) lost people between the first campaign and the second campaign, 19 (42.22%) gained people, and 5 (11.11%) had an equivalent number of respondents (Figure 5).
For the first period of testing (from 5 June to 5 August 2020), we had the test results of 377 people with associated geographical coordinates. We tested 39 neighborhoods out of the 110 in the city of. The prevalence per neighborhood was between 0 and 0.5 (Figure 6, Appendix B Table A2). The total prevalence, across all the neighborhoods combined (for the 377 people) was 2.65% (IC95%: 1.03–4.27%).
For the first campaign, we identified a non-significant cluster in the neighborhoods north-west of Marseille (population = 168, Number of cases = 8, expected cases: 4.46, observed/expected: 1.80, relative risk: 4.98, log likelihood ratio: 2.711407, p-value: 0.75, not a Gini Cluster) (Figure 7, Appendix B Table A2).
For the second period of testing (from 11 September to 18 December 2020), we had the tests of 721 people with associated geographical coordinates. We tested 43 neighborhoods out of the 110 in the city of Marseille. The prevalence per neighborhood was between 1 and 0.024 (Appendix B Table A3, Figure 8). The total prevalence, across all the neighborhoods combined (for the 721 people) was 10.12% (IC95%: 7.923–12.23).
For the period of the second campaign, four clusters were identified, two of which were significant and two not significant (Table 3, Appendix B Table A3, Figure 9): a significant cluster of 6 neighborhoods (cluster 1), around the old port of Marseille; a significant cluster of 16 neighborhoods (cluster 2), located in the center of Marseille; a non-significant cluster of 8 neighborhoods (cluster 3) in the north of Marseille; and a non-significant cluster which was located in the neighborhood of La Villette (cluster 4).

4. Discussion

The interest of this article is two-fold: it presents both unique data on homeless characteristics, mobilities, and their consequences in times of crisis in a large European city. We have shown that the homeless population in a large European city, such as Marseille, is very heterogeneous, both in terms of personal circumstances and type of homelessness (on the street, in emergency accommodation, etc.). Our study population was mobile in different ways during the year 2020, corresponding to the beginning of the COVID-19 crisis in France. Mobility varied according to the type of homelessness that was experienced at the beginning of the crisis. We have shown that mobility within the different neighborhoods of the city probably explains the evolution of the cluster locations as the epidemic progressed. We also showed a positive association between a large number of housing changes the probability of having anti-SARS-CoV-2 antibodies. We also report that there is an association between a panel of socio-economic variables and the type of housing that people had before the epidemic. We then show that the rate of crisis-related rehousing in emergency shelters differed according to the type of housing that people had before the epidemic. The classic emergency housing model, therefore, fails to provide shelter for some of the most precarious types of population: families, people living in slums, etc.
We were able to include many people in our cohort and had a response rate of 58.02%. This inclusion is satisfactory given the type of people that were targeted and the health crisis that was unfolding at the time. This study was made possible by the close involvement of local NGOs in the field. We want to emphasize the need for close cooperation between researchers and NGOs in the field in order to reach the most vulnerable in studies of this magnitude. Compared to the general population of Marseille, the homeless population is younger and consists of more men; 47% of male in the general population in Marseille in 2018, according to [39].
Different types of homelessness had a clear relationship to personal characteristics. The country of birth was a significant variable in the analysis affecting the type of homelessness that people experienced. It is possible to distinguish several groups: one group was made up of people that were born in France, who consumed alcohol, tobacco, and other drugs whilst living on the streets. Another group comprised of people that were living with their families, in squats, and shantytowns, that were born in Europe (outside and inside the European Union), who tended to remain in one area. The last group, less differentiated, was made up of people that were living in emergency shelters and transit shelters, parents, or single adults, with a secondary level of education, that were born in Africa, the Middle East, or America (North and South). Whilst our study highlighted the heterogeneity of the homeless population within Marseille, we were able to draw attention to the existence of new categories of people and the need for help that is adapted to their specific needs. The homeless population is not homogeneous. In the rest of Europe, as in Marseille, the socio-demographic characteristics are multiple and include groups requiring specific and different care, such as migrants or people with psychological problems [40]. These needs require a better understanding of the different types of homelessness and the socio-economic factors that are associated with them. This study is the first to our knowledge that provides this information in a major European city.
Our study showed that the flow of people between different types of accommodation increased from the lockdown onwards, compared to periods in between where the restrictions were eased. This was mainly because the flow of people that were living in squats and on the streets into emergency accommodation increased after the lockdown. Populations who were on the streets before the crisis were most likely to move to emergency accommodation. These observations reflect an effort by NGOs and politicians to encourage people into shelters during the first lockdown in France. This movement of people continued until the period from May to August 2020. During the second test session, the most notable population flows occurred from emergency shelters towards ETHOS 3 housing. This corresponds to a cessation of COVID-related emergency accommodation and to people moving to more stable shelters. According to the step-by-step model, this shift allowed for support of the people concerned and aimed at their insertion into housing. This was a standard institutional process, which accelerated after the COVID crisis following political commitments promising that people would not end up back on the streets.
Our observations question contemporary homelessness social policies. Our Sankey diagram showed that emergency accommodation is not limited to people staying under ‘emergency’ conditions. In an ideal world, the ‘step-by-step’ model aims to facilitate the progressive movement of homeless people from the streets to emergency shelters (ETHOS 2), and then onwards to stabilization shelters (ETHOS 3) in order to help prepare them for private housing. This model remains dominant at the policy level, despite the existence of other models such as housing first, which promotes direct and unconditional access to housing and has proven more effective at producing housing stability [41,42]. Our study shows (Figure 4) that there were very few instances of people moving from homeless directly to private housing, and lots of people in the step-by-step model, experiencing long stays in emergency shelters, and little access to stabilization shelters at a later stage. Furthermore, shelters seemed ill-adapted to families without education, which were staying in slums (Figure 3 and Figure 4). Although it seems that shelters appeared as the easiest solution to provide rapid protection for homeless people, there was no long-term solution after the initial emergency response. As discussed, these emergency solutions also involved greater risks of infection [15,43]. For the authors, the step-by-step model and emergency policies for homelessness need to be radically transformed. As has been demonstrated in other European countries on community integration, a more comprehensive and sustainable approach, such as housing first programs, should be promoted [44].
In this paper we have shown that the most mobile individuals, with a greater number of different dwellings in the past year, were at greater risk of testing positive for SARS-CoV-2. The association between mobility and infection has already been demonstrated in the general population [45,46], but this is the first time it has been observed using the number of dwellings as an indicator in the homeless population. This showed the importance of residential stability in order to comply with isolation and social distancing measures.
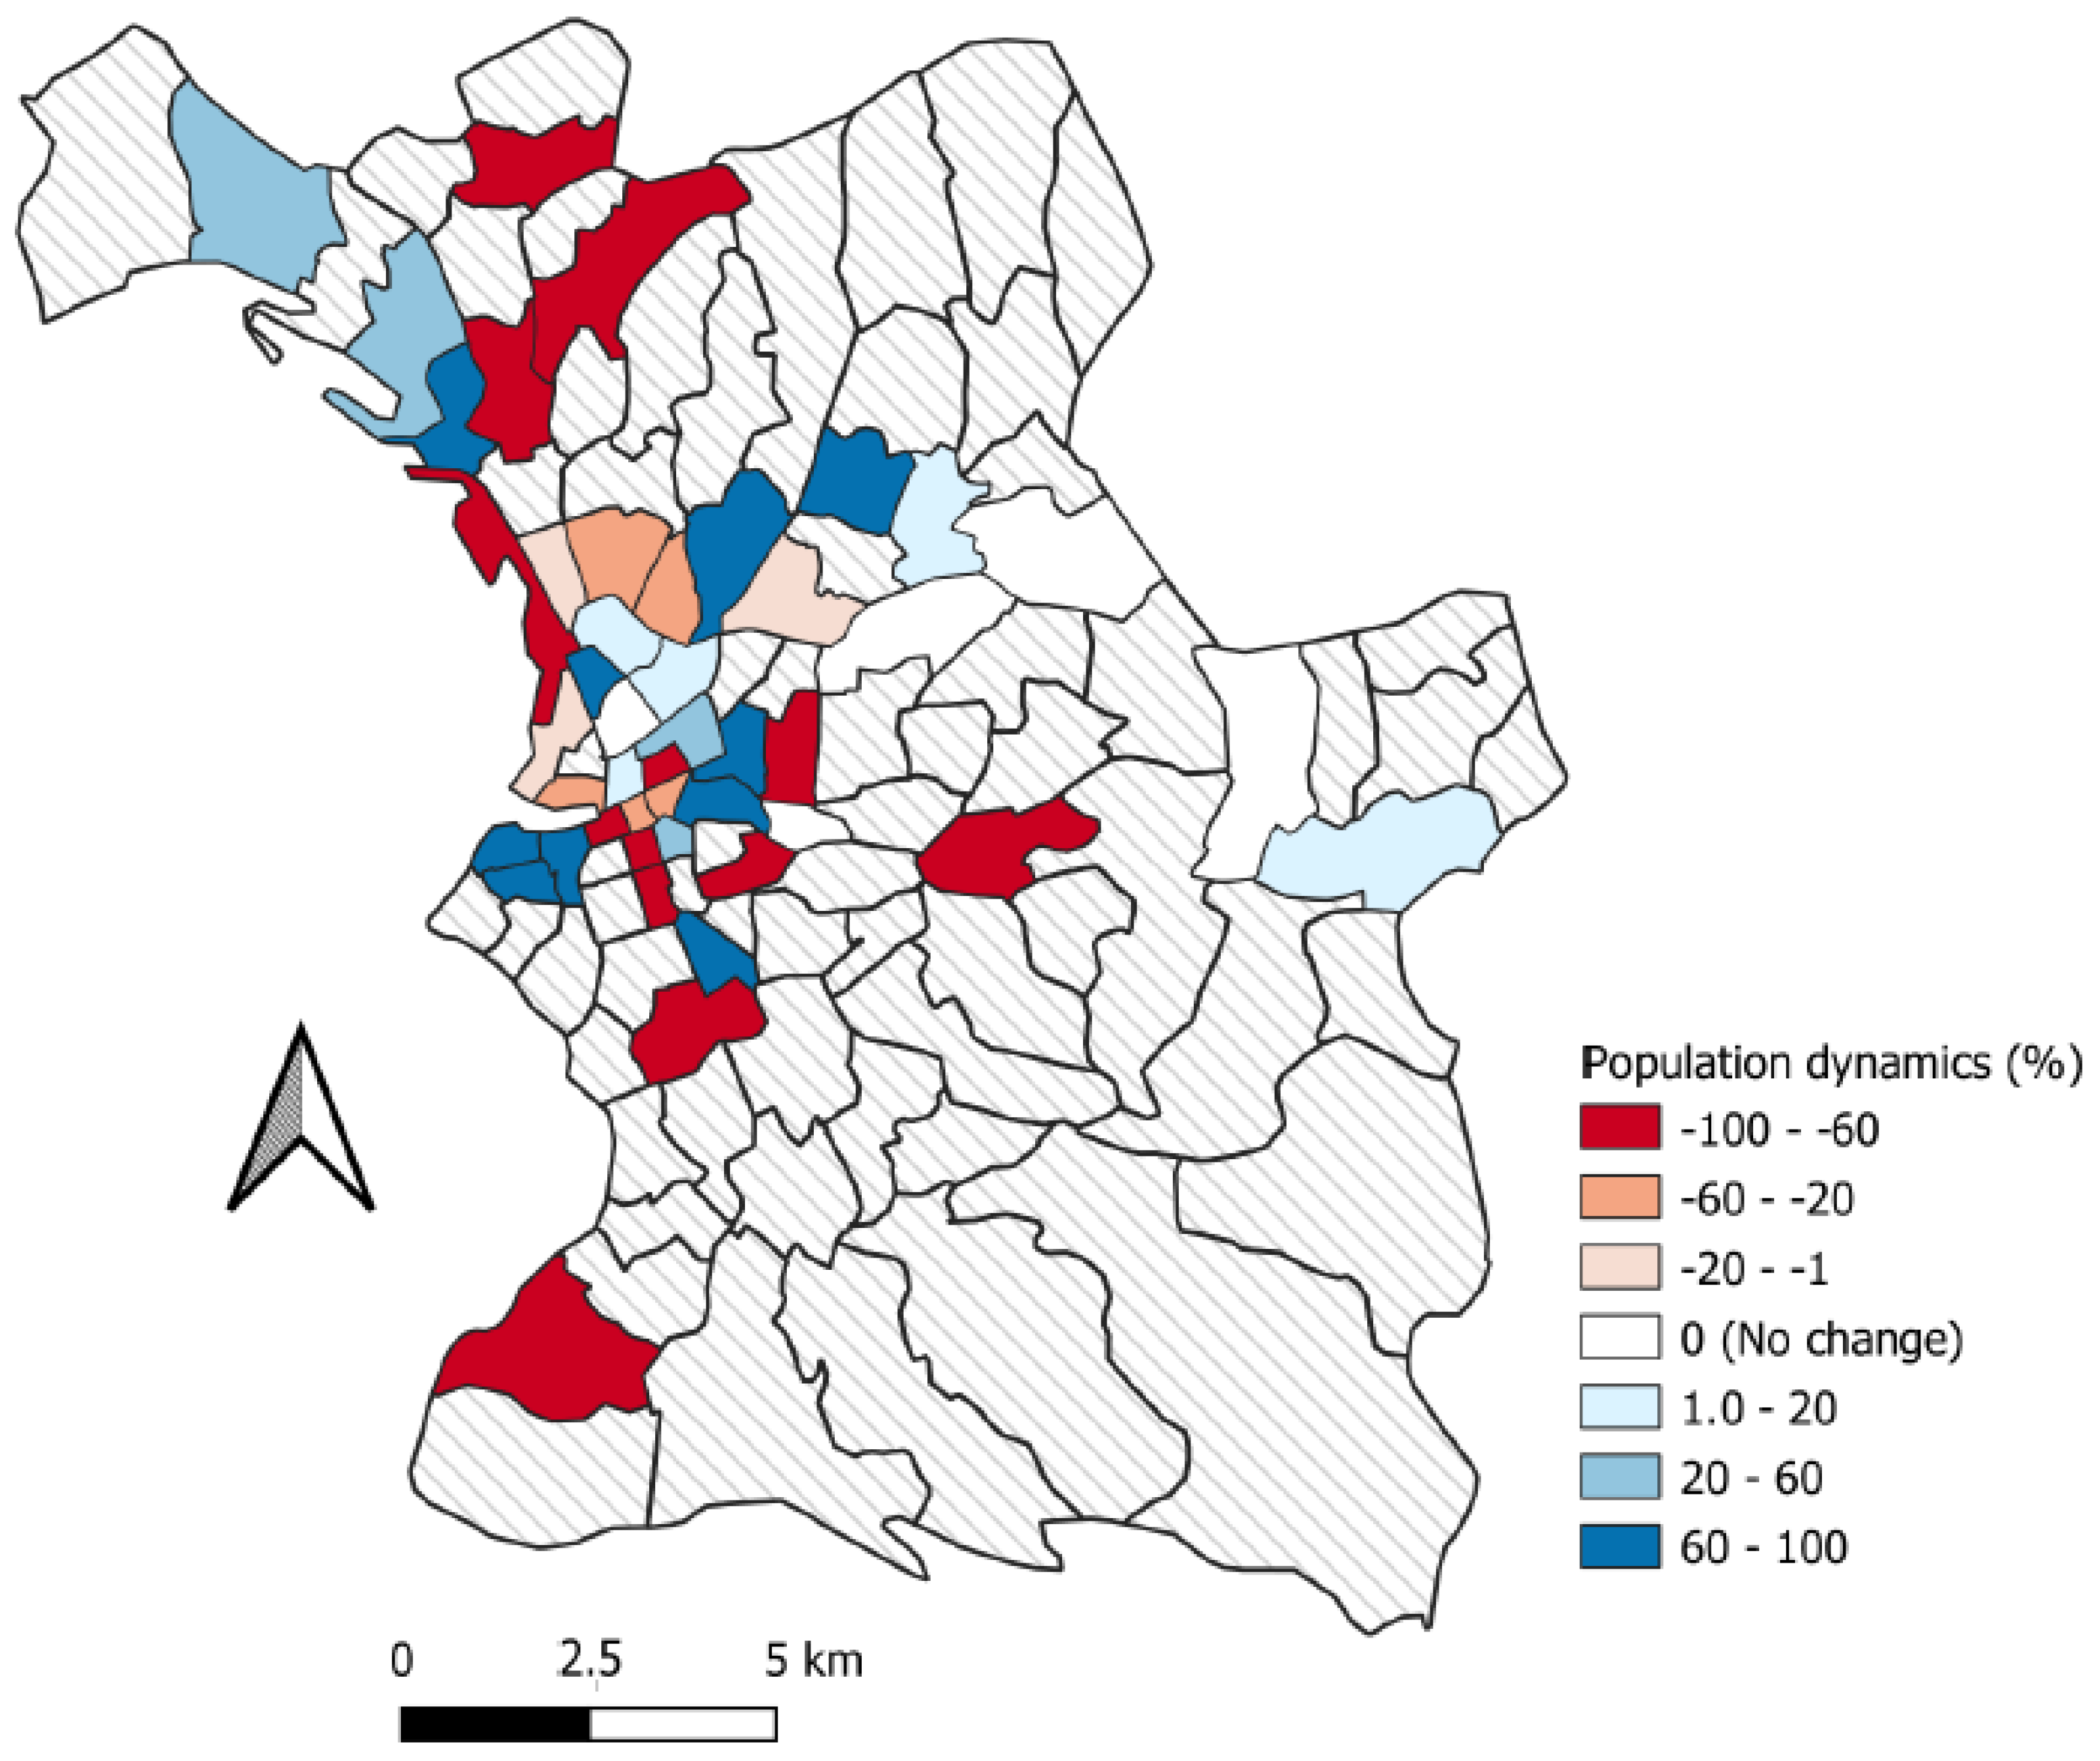
Our study also highlighted the mobility of the homeless population. People could be mobile within a neighborhood, a city, a country, or a continent (intra-European mobility, for example). We looked at mobility at the level of a city’s neighborhoods, the possible reasons for such mobility, and its consequences in epidemiological terms. In this part of the study, we observed an effective mobility between the first and second campaigns, with some neighborhoods gaining population, whilst others decreased.
We have shown that the number of dwellings is associated with a higher probability of infection. Going to a shelter is also associated with an increased likelihood of infection [19,20], especially if the shelters were overcrowded or the sleeping spaces were shared with a large number of residents [19,20]. Both of these factors argue for greater stability of people in times of health crisis in non-overcrowded living spaces, and approaches such as housing first seem to be more appropriate to address these issues.

Limitations

A selection bias cannot be ruled out since we had no reliable census data from which to perform random sampling. However, we aimed at exhaustiveness by systematically including all homeless adults that were encountered in the field during the inclusion period with our partners, which included all shelters and homeless mobile outreach teams in the city. This extensive recruitment and the overall size of our study population limits this bias. Homeless people living in the streets (ETHOS 1) were harder to reach and more are lost to follow-up, despite the committed involvement of all the study partners, including NGOs. Although some government measures increased the mobility of the homeless population from living on the streets to emergency accommodation, other measures had the potential to reduce population mobility. For example, the ‘winter eviction ban’, which forbids the eviction of a tenant during the winter months, was extended by decree (Ordinance n°2020-331 of 25 March 2000 (JORF 26 March 2000) [47]). Entry restrictions on homeless accommodation and restrictions on the length of stay in shelters was also suspended for the duration of the lockdown. The high levels of mobility that were observed in our study are perhaps surprising given this context and might lead one to expect higher mobility in this population today with the cessation of these measures. There was a bias concerning the map in Figure 5, as we had more spatial location information for people in the second campaign than in the first: the population dynamics of the neighborhoods, therefore, risks exaggeration towards the positive. Nevertheless, this map is still relevant for comparing the neighborhoods with each other. The lower number of spatialized data in the first campaign could also explain why the cluster that was identified there does not emerge as statically significant.

5. Conclusions

In summary, the mobility of homeless people at the city-scale is an important factor in better understanding the epidemiological dynamics for these populations. To date, these questions have been under-investigated, despite concerning the public health of the most precarious people. Herein this study, we highlight the need for further research on these important issues. These results encourage the implementation of management that is adapted to the specific situations of these particularly vulnerable populations in times of health crisis. As this crisis can be seen as an accelerator of the usual sheltering movements, this study also allows us to reconsider the rehousing program as a whole by advocating for housing first. This study is important at the city level for the adaptation of local strategies, but also at the European level for the implementation of more sustainable public housing programs.

Author Contributions

Wrote the first draft of the manuscript: A.A. Contributed to the writing of the manuscript: E.M., A.T., S.L., C.F., J.L. and M.M. collected the data and samples. E.M., C.F. and M.M. Analyzed the data: A.A., J.L. and J.G. Conceived the study: E.M., S.L., P.A., A.T. and C.F. All authors contributed to subsequent draft have reviewed and agreed with the content of the final manuscript. All authors have read and agreed to the published version of the manuscript.

Funding

This study was supported by the DGOS (PHRC-COVID-19: 20-0047, study ID 2020-AO1398-31).

Institutional Review Board Statement

This study was approved by ethical committee on 28 May 2020 (number 44-20).

Informed Consent Statement

Informed consent was obtained from all the subjects that were involved in the study.

Data Availability Statement

The datasets that were generated and analyzed during the current study are not publicly available due to special authorization to transfer databases given by the CNIL. Upon prior authorization by the CNIL, the dataset would be available from the corresponding author on a reasonable request. Additionally, the study protocol is available for the request. All data requests should be directed to the corresponding author.

Acknowledgments

We would like to thank all the homeless people who participated in this study by providing their samples and questionnaires. We would also like to thank all the following: the nurse interweaves and mediators that were involved in the ‘COVID homeless’ project: Maud Landreau, Anne Ranise and Nathalie Vuagniaux, Grâce Inegbeze, Snjezana Huette, Marko Sava, and Drisse Mekkaoui; the Assab network; the following Homeless outreach teams: ADDAP13, AMPIL, ASUD, Bus 31/32, Equipe Mobile d’Aide (EMA) Saralogisol, Equipe Mobile santé ADJ Marceau, Equipe Mobile Gare et Connexion ADJ Marceau, MARSS-APHM, Nouvelle Aube, Mission Bidonville Médecins du monde, PASS adulte APHM, Réseau Santé Marseille Sud (RSMS); the following Emergency shelters: UHU La Madrague-ville, St Louis, Sleep’in (groupe SOS Solidarité), Forbin (Fondation St Jean de Dieu), and Marius Macias (AAJT) and the following persons that were involved in providing Collective accommodation for homeless persons: Marius Macias (AAJT); William Booth (Armée du Salut); Le Marabout, le Mascaret (Habitat Alternatif Social); Foyer Honorat (Hospitalité pour les Femmes); Jane Pannier (Maison de la Jeune Fille); SHAS (Saralogisol) Coco Velten, La Selonne (groupe SOS Solidarité); Forbin (St Jean de Dieu); and Village Club du Soleil; for their work in improving the care management of homeless people in Marseille.

Conflicts of Interest

The authors declare no conflict of interest.

Appendix A

Table A1. Coordinates of each variable on axis 1 (CS 1) and 2 (CS 2) of the Hill and Smith analysis.
Variable.CS1CS2
mdv.Isolated.adult0.318020814614317−0.138686155266092Household status: Isolated adult
mdv.Family−0.596581877218025 * 0.268218556893136Household status: Family
mdv.Isolated.parent0.371420323213889−0.189431086881132Household status: Isolated parent
econ.No0.329645002280672−0.03784583794277Problems of economic resources during the period of health crisis: No
econ.Yes−0.1183341033828050.0135856854153533Problems of economic resources during the period of health crisis: Yes
comorb0.06014453635449640.143583595180596Number of Comorbidity
age0.1417227222869380.199677009063853Age in years
count.France0.657142200949126 *0.565684402668609 *Person’s country of birth: France
count.UE−0.4614027613392870.565496784946139Person’s country of birth: country of European Union
count.Europe.no.UE0.227542076216351 *0.227542076216351Person’s country of birth: country of Europe, not in European Union
count.North.Africa0.30389661463267−0.445676499984632Person’s country of birth: country of North Africa
count.Sub.Saharan Southern.Africa−0.00692548059787189−0.693042068909341 *Person’s country of birth: country of Sub−Saharan or Southern African countries
count.Middle.East0.182154429482761−0.579650734253128 *Person’s country of birth: country of Middle East
count.Russia−0.0005153911228273110.063809437909346Person’s country of birth: Russia
count.North.America0.194660784564911−0.989836831994614 *Person’s country of birth: country of North America
count.South.America0.0640708015214596−0.710434782575241 *Person’s country of birth: country of South America
sexe.Male0.193604145684412−0.0016711647920521Sex: Male
sexe.Female−0.4578891699520260.00395243736533019Sex: Female
finan.Yes0.0506880183723080.172342681477751Financial resources: Yes
finan.No−0.101735526236618−0.34590765147662Financial resources: No
educa.None−0.2737185306068280.103928647366441Education attainment: None
educa.Lower.secondary0.4151033147130790.0182723622263325Education attainment: Lower secondary
educa.Upper.secondary0.138676787874378−0.285382577809815Education attainment: Upper secondary
ealth.Yes0.07304283045421060.0286390463874196Health insurance: Yes
ealth.No−0.27363806632846−0.107289561839437Health insurance: No
Tobac.No−0.175282864892875−0.464552790157363Tobacco consumption: No
Tobac.Yes0.1288914927384170.341601574208484Tobacco consumption: Yes
Alcool_D0.21296639526610.310894858612279Alcohol consumption in number of standard glasses per day
drug.No−0.120115203696184−0.119479595798671Drug consumption: No
drug.Yes0.491030952710004 *0.488432587624964Drug consumption: Yes
home.0−0.204960195548446−0.210235966368546Total length of homelessness: Less than 3 months
home.10.226974290324227−0.351706113500525Total length of homelessness: Less than 1 year
home.30.0607296491464919−0.191823511717764Total length of homelessness: 1 to 5 years
home.6−0.1582479790292430.4797275092935Total length of homelessness: More than 5 years
ETHOS.10.3774266716111340.538257285433284Housing situation: ETHOS 1
ETHOS.20.294737185619723−0.414156583347008Housing situation: ETHOS 2
ETHOS.8−0.527713370478378 *0.20237575177422Housing situation: ETHOS 8
ETHOS.30.354022532005372−0.0113341020402295Housing situation: ETHOS 3
* five most important variables on axes 1 and 2 of the Hill and Smith analysis.

Appendix B

Table A2. Number of tests that were performed, number of positive tests, prevalence, and the cluster number for the first campaign.
NeighborhoodNeighborhood NumberDistrictNumber of TestsNumber of Positive TestsPrevalenceSatScan Cluster
Arenc121700.0001
Baille25100.000
Belle de Mai332010.0501
Belsunce41800.000
Bompard5700
Bon-Secours6142410.0421
Bonneveine7800
Carpiagne8900
Castellane96210.500
Chapitre101100.000
Chateau-Gombert111300
Chutes-Lavie12400 1
Cinq-Avenues13400
Endoume14700
Éoures151100
Grands-Carmes16200
Hôtel-de-Ville172200.000
La Barasse181100
La Blancarde1941900.000
La Cabucelle201500 1
La Calade211500 1
La Capelette221000
La Conception23500
La Croix-Rouge241300
La Delorme251500 1
La Fourragere261200
La Joliette2723010.033
La Milliere281100
La Panouse29900
La Plage30800
La Pomme3111600.000
La Rose32131700.000
La Timone3310100.000
La Treille341100
La Valbarelle351100
La Valentine36114000.000
La Villette37300 1
La Viste381500 1
Le Cabot39900
Le Camas40500
Le Canet4114200.0001
Le Merlan421400
Le Pharo43700
Le Redon44900
Le Rouet458100.000
Les Accates461100
Les Arnavaux471400 1
Les Aygalades4815200.000
Les Baumettes49900
Les Borels501500
Les Caillols511200
Les Camoins521100
Les Chartreux53400
Les Crottes54153910.0261
Les Goudes55800
Les Médecins561300
Les Mourets571300
Les Olives5813600.000
Les Riaux591600
Les Trois-Lucs601200
L’Estaque6116100.000
Lodi62600
Malpasse631300 1
Mazargues64900
Menpenti651000
Montolivet6612300.000
Montredon678200.000
Noailles681800.000
Notre-Dame-du-Mont6961000.000
Notre-Dame-Limite701500
Opéra711300.000
Palais-de-Justice72600
Palama731300
Périer 74800
Pointe-Rouge758100.000
Pont-de-Vivaux761000
Préfecture 776200.000
Roucas-Blanc78700
Saint-Andre7916210.5001
Saint-Antoine8015500.000
Saint-Barnabé811200
Saint-Barthélemy821400 1
Saint-Charles8311000.000
Saint-Giniez848300.000
Saint-Henri851600
Saint-Jean-du-Désert861200
Saint-Jérôme871300 1
Saint-Joseph881400 1
Saint-Julien891200
Saint-Just9013510.2001
Saint-Lambert91700
Saint-Lazare923610.1671
Saint-Louis93151610.0631
Saint-Loup941000
Saint-Marcel951100
Saint-Mauront9633610.0281
Saint-Menet9711700.000
Saint-Mitre981300
Saint-Pierre995200.000
Saint-Tronc1001000
Saint-Victor101700
Sainte-Anne102800
Sainte-Marguerite103900
Sainte-Marthe10414100.0001
Sormiou105900
Thiers10611600.000
Vauban107600
Vaufrèges108900
Verduron1091500
Vieille-Chapelle110800
Table A3. Number of tests that were performed, number of positive tests, prevalence, and the cluster number for the second campaign.
NeighborhoodNeighborhood NumberDistrictNumber of TestsPositif Test NumberPrevalenceSatScan Cluster
Arenc121320.154
Baille2500 2
Belle de Mai331620.125
Belsunce413920.051
Bompard5700 1
Bon-Secours6143320.061
Bonneveine7800
Carpiagne8900
Castellane9600
Chapitre1013530.086
Château-Gombert111300
Chutes-Lavie12400
Cinq-Avenues134410.2502
Endoume14700 1
Éoures151100
Grands-Carmes16200
Hôtel-de-Ville172111.0001
La Barasse181100
La Blancarde19400 2
La Cabucelle201500
La Calade21151710.059
La Capelette2210111.0002
La Conception23500 2
La Croix-Rouge241300
La Delorme251500
La Fourragère261200 2
La Joliette2727530.040
La Millière281100
La Panouse29900
La Plage30800
La Pomme3111210.5002
La Rose32132320.087
La Timone331000 2
La Treille341100
La Valbarelle351100
La Valentine36113020.067
La Villette373520.4003
La Viste381500 3
Le Cabot39900
Le Camas405111.0002
Le Canet4114210.500
Le Merlan421400
Le Pharo437111.0001
Le Redon44900
Le Rouet4581010.100
Les Accates461100
Les Arnavaux471400
Les Aygalades481500 3
Les Baumettes49900
Les Borels5015210.5003
Les Caillols511200 2
Les Camoins521100
Les Chartreux534210.5002
Les Crottes54156220.032
Les Goudes55800
Les Médecins561300
Les Mourets571300
Les Olives58131930.158
Les Riaux591600
Les Trois-Lucs601200
L’Estaque61163220.063
Lodi62600
Malpasse631300
Mazargues64900
Menpenti651000
Montolivet6612620.3332
Montredon67800
Noailles6811320.154
Notre-Dame-du-Mont6962120.095
Notre-Dame-Limite701500
Opéra711210.500
Palais-de-Justice72600
Palama731300
Périer 74800
Pointe-Rouge75800
Pont-de-Vivaux761000 2
Préfecture 776820.250
Roucas-Blanc78700
Saint-Andre79161130.2733
Saint-Antoine8015210.5003
Saint-Barnabé811200 2
Saint-Barthélemy8214610.167
Saint-Charles8314230.071
Saint-Giniez84800
Saint-Henri8516111.0003
Saint-Jean-du-Désert861200 2
Saint-Jérôme87131620.125
Saint-Joseph881400
Saint-Julien891200
Saint-Just90131220.167
Saint-Lambert917221.0001
Saint-Lazare9231520.133
Saint-Louis9315420.500
Saint-Loup941000
Saint-Marcel951100
Saint-Mauront9638520.024
Saint-Menet97113920.051
Saint-Mitre981300
Saint-Pierre995210.5002
Saint-Tronc1001000
Saint-Victor1017111.0001
Sainte-Anne102800
Sainte-Marguerite103900
Sainte-Marthe1041400
Sormiou105900
Thiers1061810.125
Vauban107600
Vaufrèges108900
Verduron1091500 3
Vieille-Chapelle110800

References

  1. Snow, D.A.; Mulcahy, M. Space, Politics, and the Survival Strategies of the Homeless. Am. Behav. Sci. 2001, 45, 149–169. [Google Scholar] [CrossRef]
  2. Gray, D.; Chau, S.; Huerta, T.; Frankish, J. Urban-Rural Migration and Health and Quality of Life in Homeless People. J. Soc. Distress Homelessness 2011, 20, 75–93. [Google Scholar] [CrossRef]
  3. Tsai, J.; Wilson, M. COVID-19: A potential public health problem for homeless populations. Lancet Public Health 2020, 5, e186–e187. [Google Scholar] [CrossRef]
  4. Kaufman, D.F. Canadian homeless mobilities: Tracing the inter-regional movements of At Home/Chez Soi participants. Can. Geogr. Le Géogr. Can. 2021, 65, 292–305. [Google Scholar] [CrossRef]
  5. Šimon, M.; Vašát, P.; Poláková, M.; Gibas, P.; Daňková, H. Activity spaces of homeless men and women measured by GPS tracking data: A comparative analysis of Prague and Pilsen. Cities 2019, 86, 145–153. [Google Scholar] [CrossRef]
  6. Kuhn, R.; Culhane, D.P. Applying Cluster Analysis to Test a Typology of Homelessness by Pattern of Shelter Utilization: Results from the Analysis of Administrative Data. Am. J. Commun. Psychol. 1998, 26, 207–232. [Google Scholar] [CrossRef] [Green Version]
  7. Lyon-Callo, V. Medicalizing Homelessness: The Production of Self-Blame and Self-Governing within Homeless Shelters. Med. Anthr. Q. 2000, 14, 328–345. [Google Scholar] [CrossRef]
  8. Manning, R.M.; Greenwood, R.M. Understanding Innovation in Homeless Service Provision: A Study of Frontline Providers’ Values-Readiness for Change. Adm. Ment. Health 2019, 46, 649–659. [Google Scholar] [CrossRef]
  9. Gulcur, L.; Stefancic, A.; Shinn, M.; Tsemberis, S.; Fischer, S.N. Housing, hospitalization, and cost outcomes for homeless individuals with psychiatric disabilities participating in continuum of care and housing first programmes. J. Commun. Appl. Soc. Psychol. 2003, 13, 171–186. [Google Scholar] [CrossRef]
  10. Feantsa, F.A.P. Third Overview of Housing Exclusion in Europe. 2018. Available online: https://www.feantsa.org/en/report/2018/03/21/the-second-overview-of-housing-exclusion-in-europe-2017 (accessed on 5 February 2022).
  11. Hopper, K.; Jost, J.; Hay, T.; Welber, S.; Haugland, G. Homelessness, severe mental illness, and the institutional circuit. Psychiatr. Serv. 1997, 48, 659–665. [Google Scholar]
  12. Pleace, N. Effective Services for Substance Misuse and Homelessness in Scotland: Evidence from an International Review; Scottish Government Social Research: Edinburgh, UK, 2008. [Google Scholar]
  13. Sahlin, I. The staircase of transition: Survival through failure. Innov. Eur. J. Soc. Sci. Res. 2005, 18, 115–136. [Google Scholar] [CrossRef]
  14. Cucinotta, D.; Vanelli, M. WHO declares COVID-19 a pandemic. Acta Biomed. 2020, 91, 157–160. [Google Scholar] [PubMed]
  15. Baggett, T.P.; Gaeta, J.M. COVID-19 and homelessness: When crises intersect. Lancet Public Health 2021, 6, e193–e194. [Google Scholar] [CrossRef]
  16. Loubiere, S.M.E.; Allaria, C.; Mosnier, M.; Allibert, A.; Ninove, L.; Bosetti, T.; Farnarier, C.; Hamouda, I.; Auquier, P.; Mosnier, E.; et al. Seroprevalence of SARS-CoV-2 antibodies among homeless people living rough, in shelters and squats: A large population-based study in France. PLoS ONE 2021, 16, e0255498. [Google Scholar]
  17. Roederer, T.; Mollo, B.; Vincent, C.; Nikolay, B.; Llosa, A.E.; Nesbitt, R.; Vanhomwegen, J.; Rose, T.; Goyard, S.; Anna, F.; et al. Seroprevalence and risk factors of exposure to COVID-19 in homeless people in Paris, France: A cross-sectional study. Lancet Public Health 2021, 6, e202–e209. [Google Scholar] [CrossRef]
  18. Allaria, C.; Loubière, S.; Mosnier, E.; Monfardini, E.; Auquier, P.; Tinland, A. “Locked down outside”: Perception of hazard and health resources in COVID-19 epidemic context among homeless people. SSM Popul. Health 2021, 15, 100829. [Google Scholar] [CrossRef]
  19. Ghinai, I.; Davis, E.S.; Mayer, S.; Toews, K.-A.; Huggett, T.D.; Snow-Hill, N.; Perez, O.; Hayden, M.K.; Tehrani, S.; Landi, A.J.; et al. Risk Factors for Severe Acute Respiratory Syndrome Coronavirus 2 Infection in Homeless Shelters in Chicago, Illinois—March–May. Open Forum Infect. Dis. 2020, 7, ofaa477. [Google Scholar] [CrossRef]
  20. Karb, R.; Samuels, E.; Vanjani, R.; Trimbur, C.; Napoli, A. Homeless Shelter Characteristics and Prevalence of SARS-CoV-2. West. J. Emerg. Med. 2020, 21, 1048–1053. [Google Scholar] [CrossRef]
  21. Nogrady, B. What the data say about asymptomatic COVID infections. Nature 2020, 587, 534–535. [Google Scholar] [CrossRef]
  22. Donker, L. We Stay Home (Less)! A Research on the Social Space of Homeless People and the Impact of Covid-19. Master’s Thesis, University of Groningen, Groningen, The Netherlands, 2021. [Google Scholar]
  23. Warszawski, J.; Bajos, N.; Costemalle, V.; Leblanc, S. En mai 5% de la population en France métropolitaine a développé des anticorps contre le SARS-CoV-Premiers résultats de l’enquête nationale EpiCov. Pathologies 2020, 1202. [Google Scholar]
  24. Insee. IRIS. Available online: https://www.insee.fr/en/metadonnees/definition/c1523 (accessed on 23 February 2022).
  25. Grzegorczyk, A. Socio-spatial diversity of Marseille at the turn of the 21st century. Bull. Geogr. Socio-Econ. Ser. 2012, 17, 45–55. [Google Scholar] [CrossRef] [Green Version]
  26. Martin, M. 17% des Habitants Vivent sous le Seuil de Pauvreté en 2012; INSEE: Paris, France, 2015. [Google Scholar]
  27. Amore, K.; Baker, M.; Howden-Chapman, P. The ETHOS Definition and Classification of Homelessness: An Analysis. Eur. J. Homelessness 2011, 5, 19–37. [Google Scholar]
  28. Mosnier, É.; Farnarier, C.; Mosnier, M.; Allaria, C.; Loubière, S.; Monfardini, E.; Rebaudet, S.; Bosetti, T.; Tinland, A. Un modèle innovant d’intervention, de dépistage et de prise en charge mobile de la Covid-19 chez les personnes sans-abri à Marseille. Sante Publique 2022, 1e–11. [Google Scholar] [CrossRef]
  29. Fournier, P.-E.; Zandotti, C.; Ninove, L.; Prudent, E.; Colson, P.; Gazin, C.; Million, M.; Tissot-Dupont, H.; Fenollar, F. Contribution of VitaPCR SARS-CoV-2 to the emergency diagnosis of COVID-19. J. Clin. Virol. 2020, 133, 104682. [Google Scholar] [CrossRef] [PubMed]
  30. R Core Team. R: A Language and Environment for Statistical Computing; R Core Team: Vienna, Austria, 2020. [Google Scholar]
  31. Team, Q.D. QGIS Geographic Information System. 2016. Available online: http://qgis.osgeo.org (accessed on 23 February 2022).
  32. De Leeuw, J.; Van Rijckevorsel, J. HOMALS and PRINCALS—Some generalizations of principal components analysis. Data Anal. Inform. 1980, 2, 231–242. [Google Scholar]
  33. Thioulouse, J.; Dray, S. Interactive multivariate data analysis in R with the ade4 and ade4TkGUI packages. J. Stat. Softw. 2007, 22, 1–14. [Google Scholar] [CrossRef] [Green Version]
  34. Kiers, H.A.L. Simple structure in component analysis techniques for mixtures of qualitative and quantitative variables. Psychometrika 1991, 56, 197–212. [Google Scholar] [CrossRef]
  35. Hotelling, H. Analysis of a complex of statistical variables into principal components. J. Educ. Psychol. 1933, 24, 498–520. [Google Scholar] [CrossRef]
  36. van Buuren, S.; Groothuis-Oudshoorn, K. mice: Multivariate Imputation by Chained Equations inR. J. Stat. Softw. 2011, 45, 1–67. [Google Scholar] [CrossRef] [Green Version]
  37. Gandrud, G.; Allaire, J.J.; Russell, K.; Yetman, C.J. networkD3: D3 Javascript Network Graphs from R, R package version 0.4; R Core Team: Vienna, Austria, 2017. [Google Scholar]
  38. Kulldorff, M. SaTScan User Guide for Version 9.0. 2010; SaTScan: Boston, MA, USA, 2010. [Google Scholar]
  39. INSEE. Évolution et Structure de la Population en 2018 Commune de Marseille (13055). 2021. Available online: https://www.insee.fr/fr/statistiques/5397441?sommaire=5397467&geo=COM-13055#tableau-POP_G2 (accessed on 27 January 2022).
  40. Baptista, I.; Marlier, E.E. Fighting Homelessness and Housing Exclusion in Europe: A Study of National Policies; European Social Policy Network (ESPN): Brussels, Belgium, 2019. [Google Scholar]
  41. Tinland, A.; Loubière, S.; Boucekine, M.; Boyer, L.; Fond, G.; Girard, V.; Auquier, P. Effectiveness of a housing support team intervention with a recovery-oriented approach on hospital and emergency department use by homeless people with severe mental illness: A randomised controlled trial. Epidemiol. Psychiatr. Sci. 2020, 29, e169. [Google Scholar] [CrossRef]
  42. Aubry, T.; Goering, P.; Veldhuizen, S.; Adair, C.E.; Bourque, J.; Distasio, J.; Latimer, E.; Stergiopoulos, V.; Somers, J.; Streiner, D.L.; et al. A Multiple-City RCT of Housing First With Assertive Community Treatment for Homeless Canadians with Serious Mental Illness. Psychiatr. Serv. 2016, 67, 275–281. [Google Scholar] [CrossRef] [PubMed]
  43. Mosnier, E.; Loubière, S.; Monfardini, E.; Alibert, A.; Landier, J.; Ninoves, L.; Bosetti, T.; Wakap, S.N.; Tinland, A. Facteurs associés à l’infection par le SARS-CoV-2, étude de cohorte de personnes en situation de sans-abrisme. Infect. Dis. Now 2021, 51, S58. [Google Scholar] [CrossRef]
  44. Greenwood, R.M.; Manning, R.M.; O’Shaughnessy, B.R.; Vargas-Moniz, M.J.; Loubière, S.; Spinnewijn, F.; Lenzi, M.; Wolf, J.R.; Bokszczanin, A.; Bernad, R.; et al. Homeless Adults’ Recovery Experiences in Housing First and Traditional Services Programs in Seven European Countries. Am. J. Commun. Psychol. 2020, 65, 353–368. [Google Scholar] [CrossRef] [PubMed]
  45. Badr, H.S.; Du, H.; Marshall, M.; Dong, E.; Squire, M.M.; Gardner, L.M. Association between mobility patterns and COVID-19 transmission in the USA: A mathematical modelling study. Lancet Infect. Dis. 2020, 20, 1247–1254. [Google Scholar] [CrossRef]
  46. Nouvellet, P.; Bhatia, S.; Cori, A.; Ainslie, K.E.C.; Baguelin, M.; Bhatt, S.; Boonyasiri, A.; Brazeau, N.F.; Cattarino, L.; Cooper, L.V.; et al. Reduction in mobility and COVID-19 transmission. Nat. Commun. 2021, 12, 1–9. [Google Scholar] [CrossRef]
  47. JORF. Ordonnance n° 2020-331 du 25 mars 2020 Relative au Prolongement de la Trêve Hivernale. 2020: JORF n°0074 du 26 Mars 2020; Légifrance: Paris, France, 2020. [Google Scholar]
Figure 1. Map of the districts and neighborhoods in Marseille, France. The neighborhoods are in alphabetical order according to their name and names of districts are numbered.
Ijerph 19 03129 g001
Figure 2. Map of the number of personal services (per 1000 inhabitants), health institutions (per 10,000 inhabitants), and commerce (per 1000 inhabitants) by district and distance to emergency shelters by IRIS, categorized into Jenks Natural Breaks Classification.
Ijerph 19 03129 g002
Figure 3. Scatter diagram of the projection of the variables in the first two axes of the Hill and Smith analysis with mixed quantitative variables and factors.
Ijerph 19 03129 g003
Figure 4. Sankey diagram of life paths in our study. Different periods are: (a) before the beginning of the health crisis (24 January 2020), (b) before the lockdown (between 24 January and 16 March 2020), (c) during the lockdown (between 16 March and 11 May 2020), (d) after the lockdown (between 11 May 2020, and 5 August 2020), and (e) during the second testing session (between 11 September and 18 December 2020). 1 indicates ETHOS 1, 2 indicates ETHOS 2, 3 indicates ETHOS 3, 8 indicates ETHOS 8, Private ap. indicate persons in private apartment and Other indicates other types of housing.
Ijerph 19 03129 g004
Figure 5. Population mobility between the first and second campaigns at the neighborhood scale. Neighborhoods in red indicate that they lose people between the first campaign and second campaign, neighborhoods in blue won people. Neighborhoods with no data are in hashed gray.
Ijerph 19 03129 g005
Figure 6. (a) Map of the number of tests that were performed by neighborhood for the first testing period (first campaign) in Marseille City, categorized into Jenks Natural Breaks Classification.; (b) Map of prevalence by the neighborhood for the first testing period (first campaign) in Marseille City, categorized into Jenks Natural Breaks Classification.
Ijerph 19 03129 g006
Figure 7. Map of the clusters that were identified for the first testing period (first campaign) in Marseille City.
Ijerph 19 03129 g007
Figure 8. (a) Map of the number of tests that were performed by the neighborhood for the second testing campaign period in Marseille City, categorized into Jenks Natural Breaks Classification.; (b) Map of the prevalence by neighborhood for the second testing period in Marseille City, categorized into Jenks Natural Breaks Classification.
Ijerph 19 03129 g008
Figure 9. Map of the clusters that were identified in the second period testing period in Marseille City.
Ijerph 19 03129 g009
Table 1. The sociodemographic characteristics of the study population who participated in the first campaigns (n = 1272).
Sociodemographic Characteristicsn (%) or Mean (SE)
Gender
Men894(70.29%)
Women378(29.71%)
Age (years)40.06(0.40)
Household status
Isolated adult672(52.83%)
Family416(32.70%)
Isolated parent130(10.22%)
Missing54(4.25%)
Financial resources
No400(31.45%)
Yes794(62.42%)
Missing78(6.13%)
Problems of economic resources during the period of health crisis
No321(25.24%)
Yes883(69.42%)
Missing68(5.35%)
Country of Birth 1
France236(18.55%)
European Union199(15.64%)
Europe, non-European Union 212(16.67%)
North Africa282(22.17%)
Sub-Saharan/Southern Africa213(16.75%)
Middle East15(1.18%)
Russia31(2.44%)
North America2(0.16%)
South America17(1.34%)
Missing65(5.11%)
Education attainment
No educational achievement607(47.72%)
Lower secondary329(25.86%)
Upper secondary or vocational246(19.34%)
Missing90(7.08%)
Health insurance
No247(19.42%)
Yes952(79.84%)
Missing73(5.74%)
Living Conditionsn (%) or Mean (SE)
Total length of homelessness
<3 months90(7.08%)
3 to 12 months240(18.87%)
1 to 5 years452(35.53%)
>5 years397(31.21%)
Missing93(7.31%)
ETHOS 2 Typology at baseline
ETHOS 1: street166(13.05%)
ETHOS 2: emergency shelters and hotel rooms447(35.14%)
ETHOS 3: transitional shelters172(13.52%)
ETHOS 8: squats, slums 485(38.13%)
Missing2(0.16%)
Health Characteristicsn (%) or Mean (SE)
Tobacco consumption
No 486(38.21%)
Yes655(51.49%)
Missing131(10.3%)
Alcohol consumption (glasses per day)0.48(0.03)
Substance consumption
No 903(70.99%)
Yes218(17.14%)
Missing151(11.87%)
Number of Comorbidities0.57(0.03)
Serological test for SARS-CoV-2
Negative1157(90.96%)
Positive74(5.82%)
Missing41(3.22%)
1 “European Union” countries: Belgium, Bulgaria, Germany, Hungary, Italy, Poland, Portugal, Romania, Czech Republic, Slovakia, and Spain. “Outside European Union” countries: Albania, Armenia, Bosnia, Croatia, Moldavia, Montenegro, Serbia, Russia including Chechnya, and Ukraine. 2 ETHOS: the European typology for homelessness and housing exclusion.
Table 2. Univariate analysis of the seroprevalence of SARS-CoV-2 infection between June and August 2020 in homeless people that were living in Marseille.
HR (IC95%)p-Value
Number of different accommodations in the past year1.2 (1.007–1.424)0.049
Table 3. Results of the cluster analysis for the second period testing period, the neighborhoods concerned for each cluster are indicated in Appendix B Table A2.
ClusterPopulationNumber of CasesExpected CasesObserved/ExpectedRelative RiskLog Likelihood Ratiop-ValueGini Cluster
1550.519.8810.5311.6088030.00082yes
21881.824.394.817.3299020.029yes
32082.023.954.316.4293040.070no
4520.513.954.031.5527750.991no
Publisher’s Note: MDPI stays neutral with regard to jurisdictional claims in published maps and institutional affiliations.

