Article

Impact on Sleep Quality, Mood, Anxiety, and Personal Satisfaction of Doctors Assigned to COVID-19 Units

by
Pilar Andrés-Olivera
1,2,3,*,
Judit García-Aparicio
3,4,5,
María Teresa Lozano López
1,3,
José Antonio Benito Sánchez
1,2,3,
Carmen Martín
1,2,3,
Ana Maciá-Casas
1,3,
Armando González-Sánchez
6,
Miguel Marcos
3,4,5 and
Carlos Roncero
1,2,3
1
Psychiatry Service, University of Salamanca Healthcare Complex (CAUSA), 37007 Salamanca, Spain
2
Psychiatric Unit, School of Medicine, University of Salamanca, 37007 Salamanca, Spain
3
Institute of Biomedicine of Salamanca (IBSAL), 37007 Salamanca, Spain
4
Internal Medicine Service, University of Salamanca Health Care Complex (CAUSA), 37007 Salamanca, Spain
5
Medical Department, School of Medicine, University of Salamanca, 37007 Salamanca, Spain
6
Department of Statistics, University of Salamanca, 37007 Salamanca, Spain
*
Author to whom correspondence should be addressed.
Int. J. Environ. Res. Public Health 2022, 19(5), 2712; https://doi.org/10.3390/ijerph19052712
Submission received: 25 December 2021 / Revised: 13 February 2022 / Accepted: 22 February 2022 / Published: 25 February 2022
(This article belongs to the Topic Burden of COVID-19 in Different Countries)

Abstract

:
The SARS-CoV-2 health emergency has led to a restructuring of health care systems and the reassignment of medical specialists from their usual duties to attend COVID-19 patients. The aim of this paper is to describe the levels of insomnia, anxiety, depression, and the impact on quality of life of doctors who were on the frontline of COVID-19 during the first two waves of the pandemic. Self-report surveys were conducted on said physicians during both waves, with 83 and 61 responses in the first and second waves, respectively. The reported presence of insomnia was frequent (71.8%), although it decreased in the second survey. Anxiety was moderate, decreasing from 57.1% to 43.1% between measurements. Overall, depression rates decreased between the two surveys. Substance use was found to have an indirect correlation with personal and professional satisfaction. In the light of the unforeseeable evolution of the pandemic and the medium- to long-term repercussions on professionals, we believe the adaptation of health resources is crucial to meet the new unpredictable mental health needs of this group.

1. Introduction

In March 2020, a state of alarm was declared in Spain due to the COVID-19 pandemic, unpredictably transforming the social and economic environment, as well as health care systems [1]. All these elements contributed to environmental stress in everyday situations. In addition, health professionals found themselves in an unprecedented situation that forced organizational restructuring of the social and health care services in the context of limited information and high levels of stress [2,3,4].
In the context of this pandemic, health professionals have been shown to suffer from psychological consequences such as insomnia, anxiety, depression, or stress [1,4,5,6,7,8,9,10,11], especially when they perceive a lack of resources and support [4], as well as higher levels of optimism and hope [12]. In the pandemic situation, compassion fatigue and burnout levels have remained moderated or high among healthcare professionals [13].
The presence of insomnia has been linked to several pathologies such as hypertension [5] or dissatisfaction with life. Similarly, a correlation between insomnia and depression has been found [6].
In Spain, typical levels of poor sleep quality are around 38.2% [14], with sleep disorders affecting approximately 30% of the general population [15]. According to some studies, 30% of health care professionals caring from COVID-19 patients suffered from poor sleep quality [7], 71.6% of them from anxiety, and 60.3% from depression [8].
The main objective of this study is to describe the levels of insomnia, anxiety, depression, and the impact on quality of life of doctors who were on the frontline of COVID-19 care.
A secondary objective of the study is to evaluate use of substances as way of coping with difficulties of adapting to a different way of working in the pandemic context. Another objective is to classify the participating physicians into groups of greater or lesser intensity of the symptoms studied.
The quality of sleep among the sample of doctors in this study will also be compared with another study conducted in other Spanish Hospital to see if the impact of the pandemic has been similarly affected.

2. Materials and Methods

2.1. Participants and Research Desing

The sample consisted of doctors who became part of the frontline care teams (referred to as COVID-19 units) and were reassigned to coronavirus hospital wards to provide direct attention to patients, excluding emergency and ICU physicians, as no COVID teams were created in these areas; 70% were women, and by specialties, 29% were internal medicine specialists and the rest were from all the other medical specialties working at the hospital. Ages ranged from 25 to 62 years old. These teams were composed of professionals from diverse medical specialties, including those treating similar pathologies to SARS-CoV-2 (internal medicine and pneumology), but also others with little-to-no experience with this type of pathologies (surgical, medical-surgical, central services, and other medical specialties). The survey was sent to 110 physicians reassigned to the COVID-19 units during the first wave, and 83 took the survey (75.45% of the staff). In the second wave, the survey was sent to the same group of professionals, obtaining 61 responses (55.45%). However, only some of them were assigned back into the COVID-19 units, while the rest returned to their usual specialties.
Two cross-sectional studies were carried out at two different times, coinciding with the first and second waves and with two similar samples.
The University of Salamanca Health Care Complex was composed of three different hospitals at the beginning of the pandemic. During the first wave, one of them treated only patients with pathologies unrelated to COVID. The other two were set up for the care of SARS-CoV-2 diseases. The clinical hospital provided 12 of its 14 wards available. In the second wave, only half of these wards were needed. The care of these patients admitted for COVID was carried out only by the physicians to whom the survey was sent. The rest continued with their usual work with the necessary adaptations.

2.2. Survey Instrument

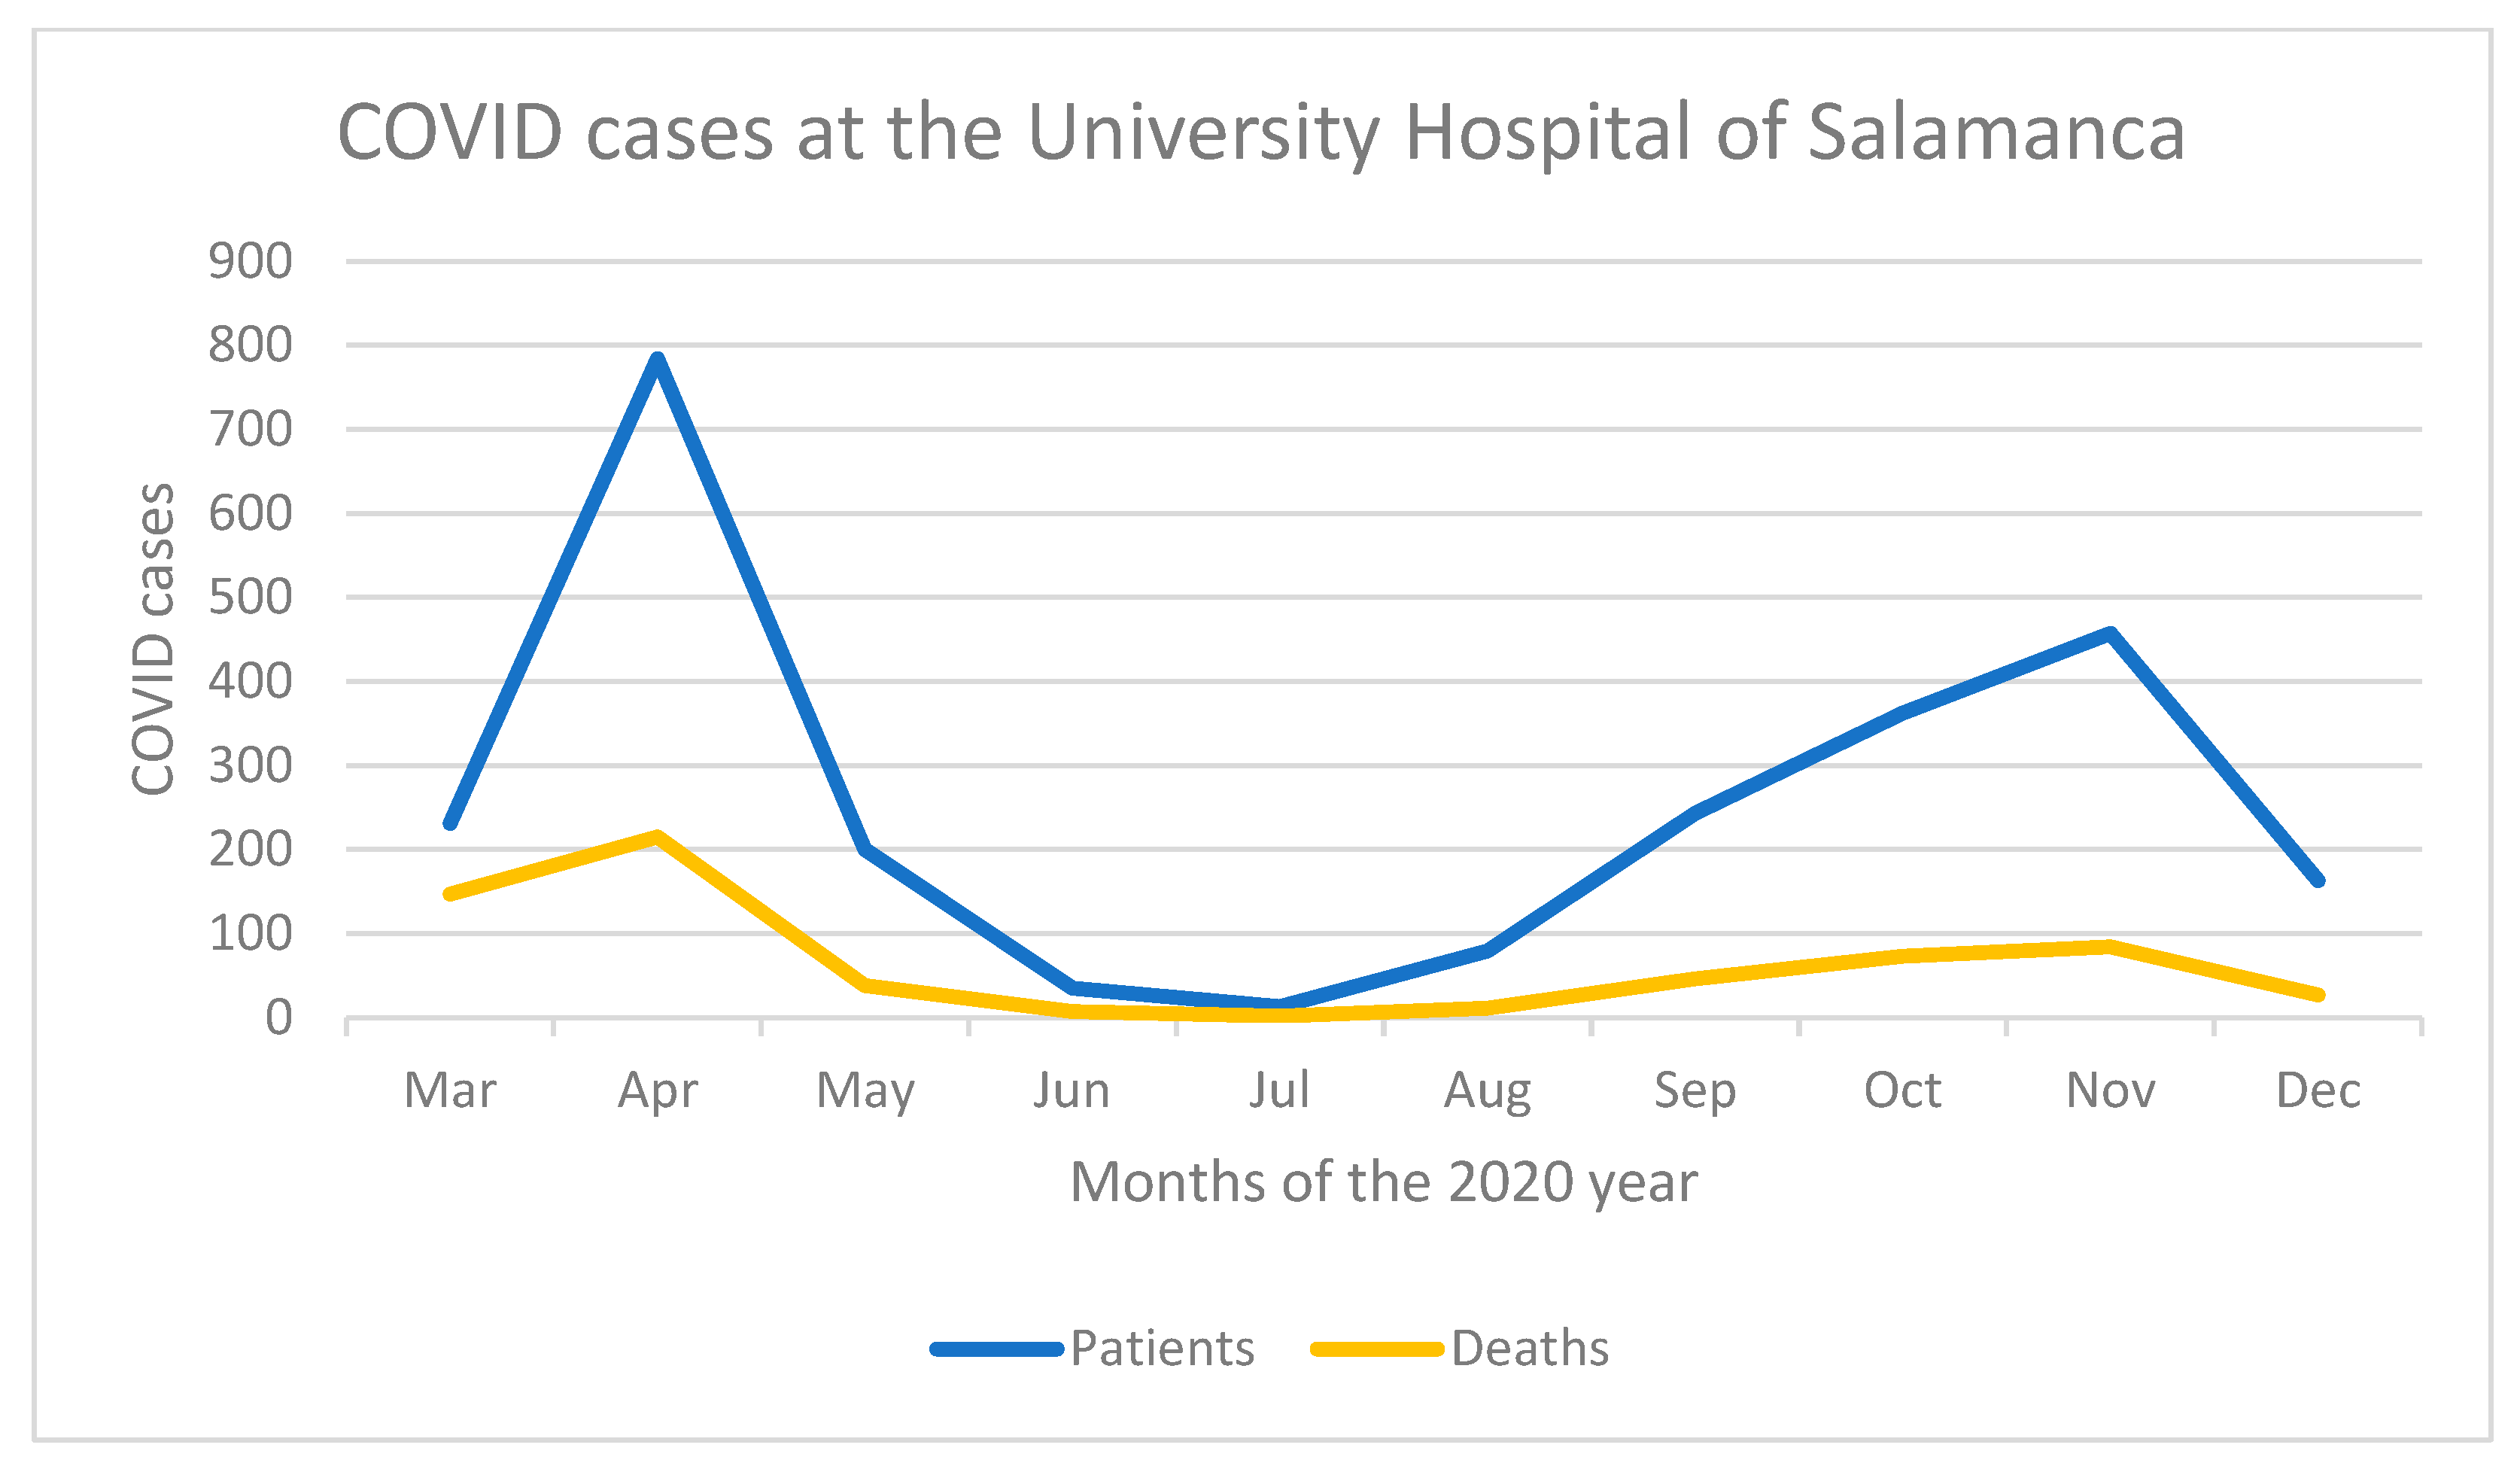
The invitation to participate in the study was sent out electronically on both occasions, using an official mailing list that had been set up during the first wave of the pandemic for the distribution of information to COVID-19 units. The Ethics Committee was informed in advance, and registered under the Ethics Committee code number 2020 06 500. Responses were collected from 20 to 26 April 2020, partly coinciding with a decrease of COVID-19 cases during the first wave (Figure 1). The second survey took place between 7 August 2020 and 11 November 2020, coinciding with the rise, peak, and fall of the second wave of COVID-19 cases.
The questionnaire sent to the participants was available on the Google Forms platform. It included the Spanish adaptations of the Insomnia Severity Index (ISI) [16], the Beck Anxiety Inventory (BAI) [17], the Beck Depression Inventory (BDI-II) [18], and an ad hoc questionnaire on life satisfaction, as well as a questionnaire on substance use that was only included in the second wave.
The Spanish version of the ISI [16] is an improved translation [19] of the original questionnaire [20]. This scale consists of seven items: the first three are related to sleep difficulties; item 4 corresponds to sleep satisfaction; and items 5, 6, and 7 to the impact of insomnia. The thresholds of the scale are as follows: no clinically significant insomnia (0–7), subthreshold insomnia (8–14), clinical insomnia (moderate severity) (15–21), and clinical insomnia (severe) (22–28).
The BAI [17] has been widely used as a screening test in the general population. This scale provides an overrepresentation of the somatic dimensions of anxiety, and is consistent with the DSM-IV diagnostic criteria [21]. The correction was based on the sum of the values of those items, ranging from 0 to 3, according to their degree of severity. In a non-clinical Spanish population, a score of 12 is accurate for diagnosing 81% of cases of anxiety disorder, reaching 90% of accuracy when the score increases to 19 [22]. However, the inventory for the Spanish population suggests using a range of 0 to 9 for non-anxiogenic, 10 to 18 for moderate anxiety, 19 to 29 for moderate to severe anxiety, and over 30 for severe anxiety [17]. It presents a bifactorial structure: the first factor evaluates somatic symptoms, and the second one evaluates subjective anxiety and panic symptoms.
Depression was assessed according to the second version of the Beck Depression Inventory (BDI-II) [22,23,24,25], i.e., the Spanish adaptation of the original 1961 test [26]. It includes two factors: the cognitive-affective and the somatic-motivational factors. Normative data on general population were obtained from the BDI-II validation study [23]. The thresholds of the scale are minimal depression (0–13), mild depression (14–19), moderate depression (20–28), and severe depression (29–63)
The ad hoc questionnaire consisted of items specifically designed for this study, comparing the current situation with the tasks performed before the reassignment in COVID-19 units. In both surveys, satisfaction was rated on a scale from 1 (dissatisfied) to 5 (very satisfied). The substance use questionnaire assessed the use of benzodiazepines, tobacco, and other substances, as well as regular alcohol consumption. This scale used the values of “never used”, “started”, “decreased”, “stable”, or “increased”.
The insomnia results of the study sample were compared with another sample of health professionals (no only doctors) from the Health Care Complex of the Hospital 12 de Octubre and a control group [27].
A p-value < 0.05 was considered significant. Means and standard deviations (SD) were used to analyze the descriptive statistics, as well as percentage differences and coefficients of variation (CV). Cohen’s d, Hedge’s g, Δ2 Glass, and R
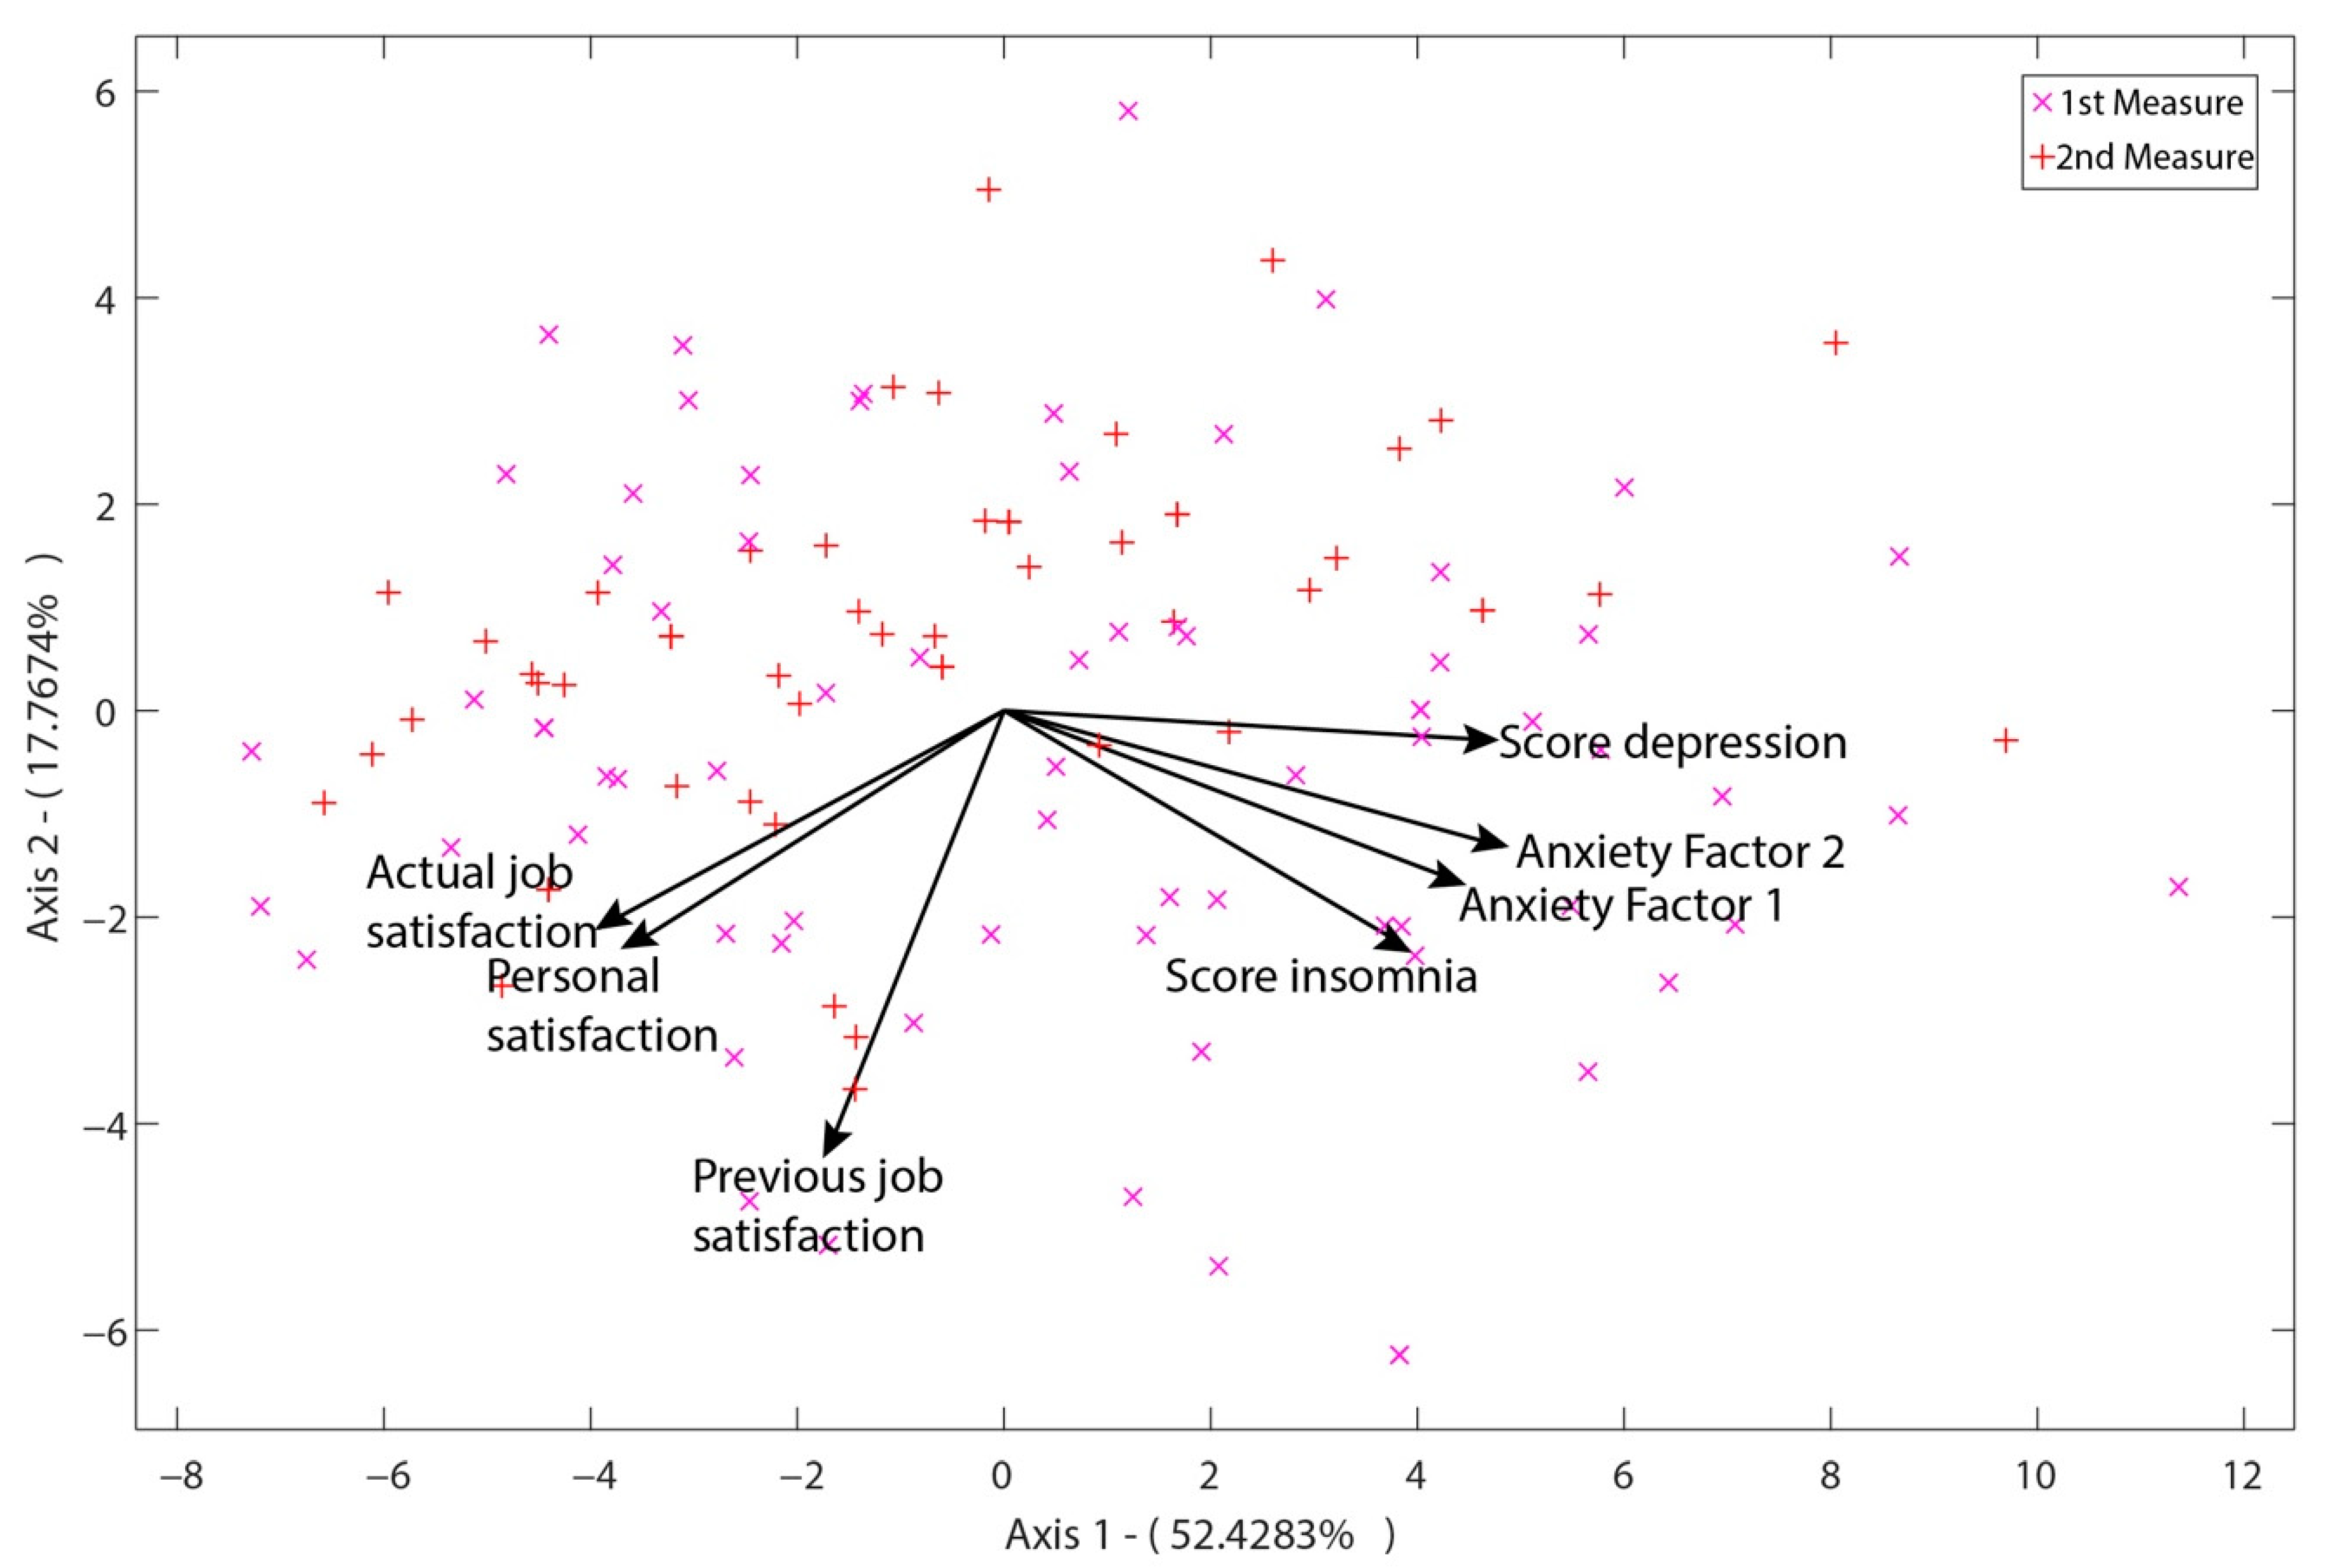
2 were also used as indicators of effect size. For the analysis of insomnia, our sample was compared with a very similar sample made up of health professionals (doctors and others) from the 12 de Octubre hospital in Madrid and people whose jobs were not health care (control group). For the analysis of the correlations between variables, bivariate correlations using Pearson’s correlation coefficient were used. The multivariate analysis of satisfaction, anxiety, depression, and insomnia was performed using principal component analysis of HJ-Biplot [28] and the MultBiplot software, 09-01-2020 version [29]. Additionally, SPSS v.25 [30] was used for the remaining analyses.
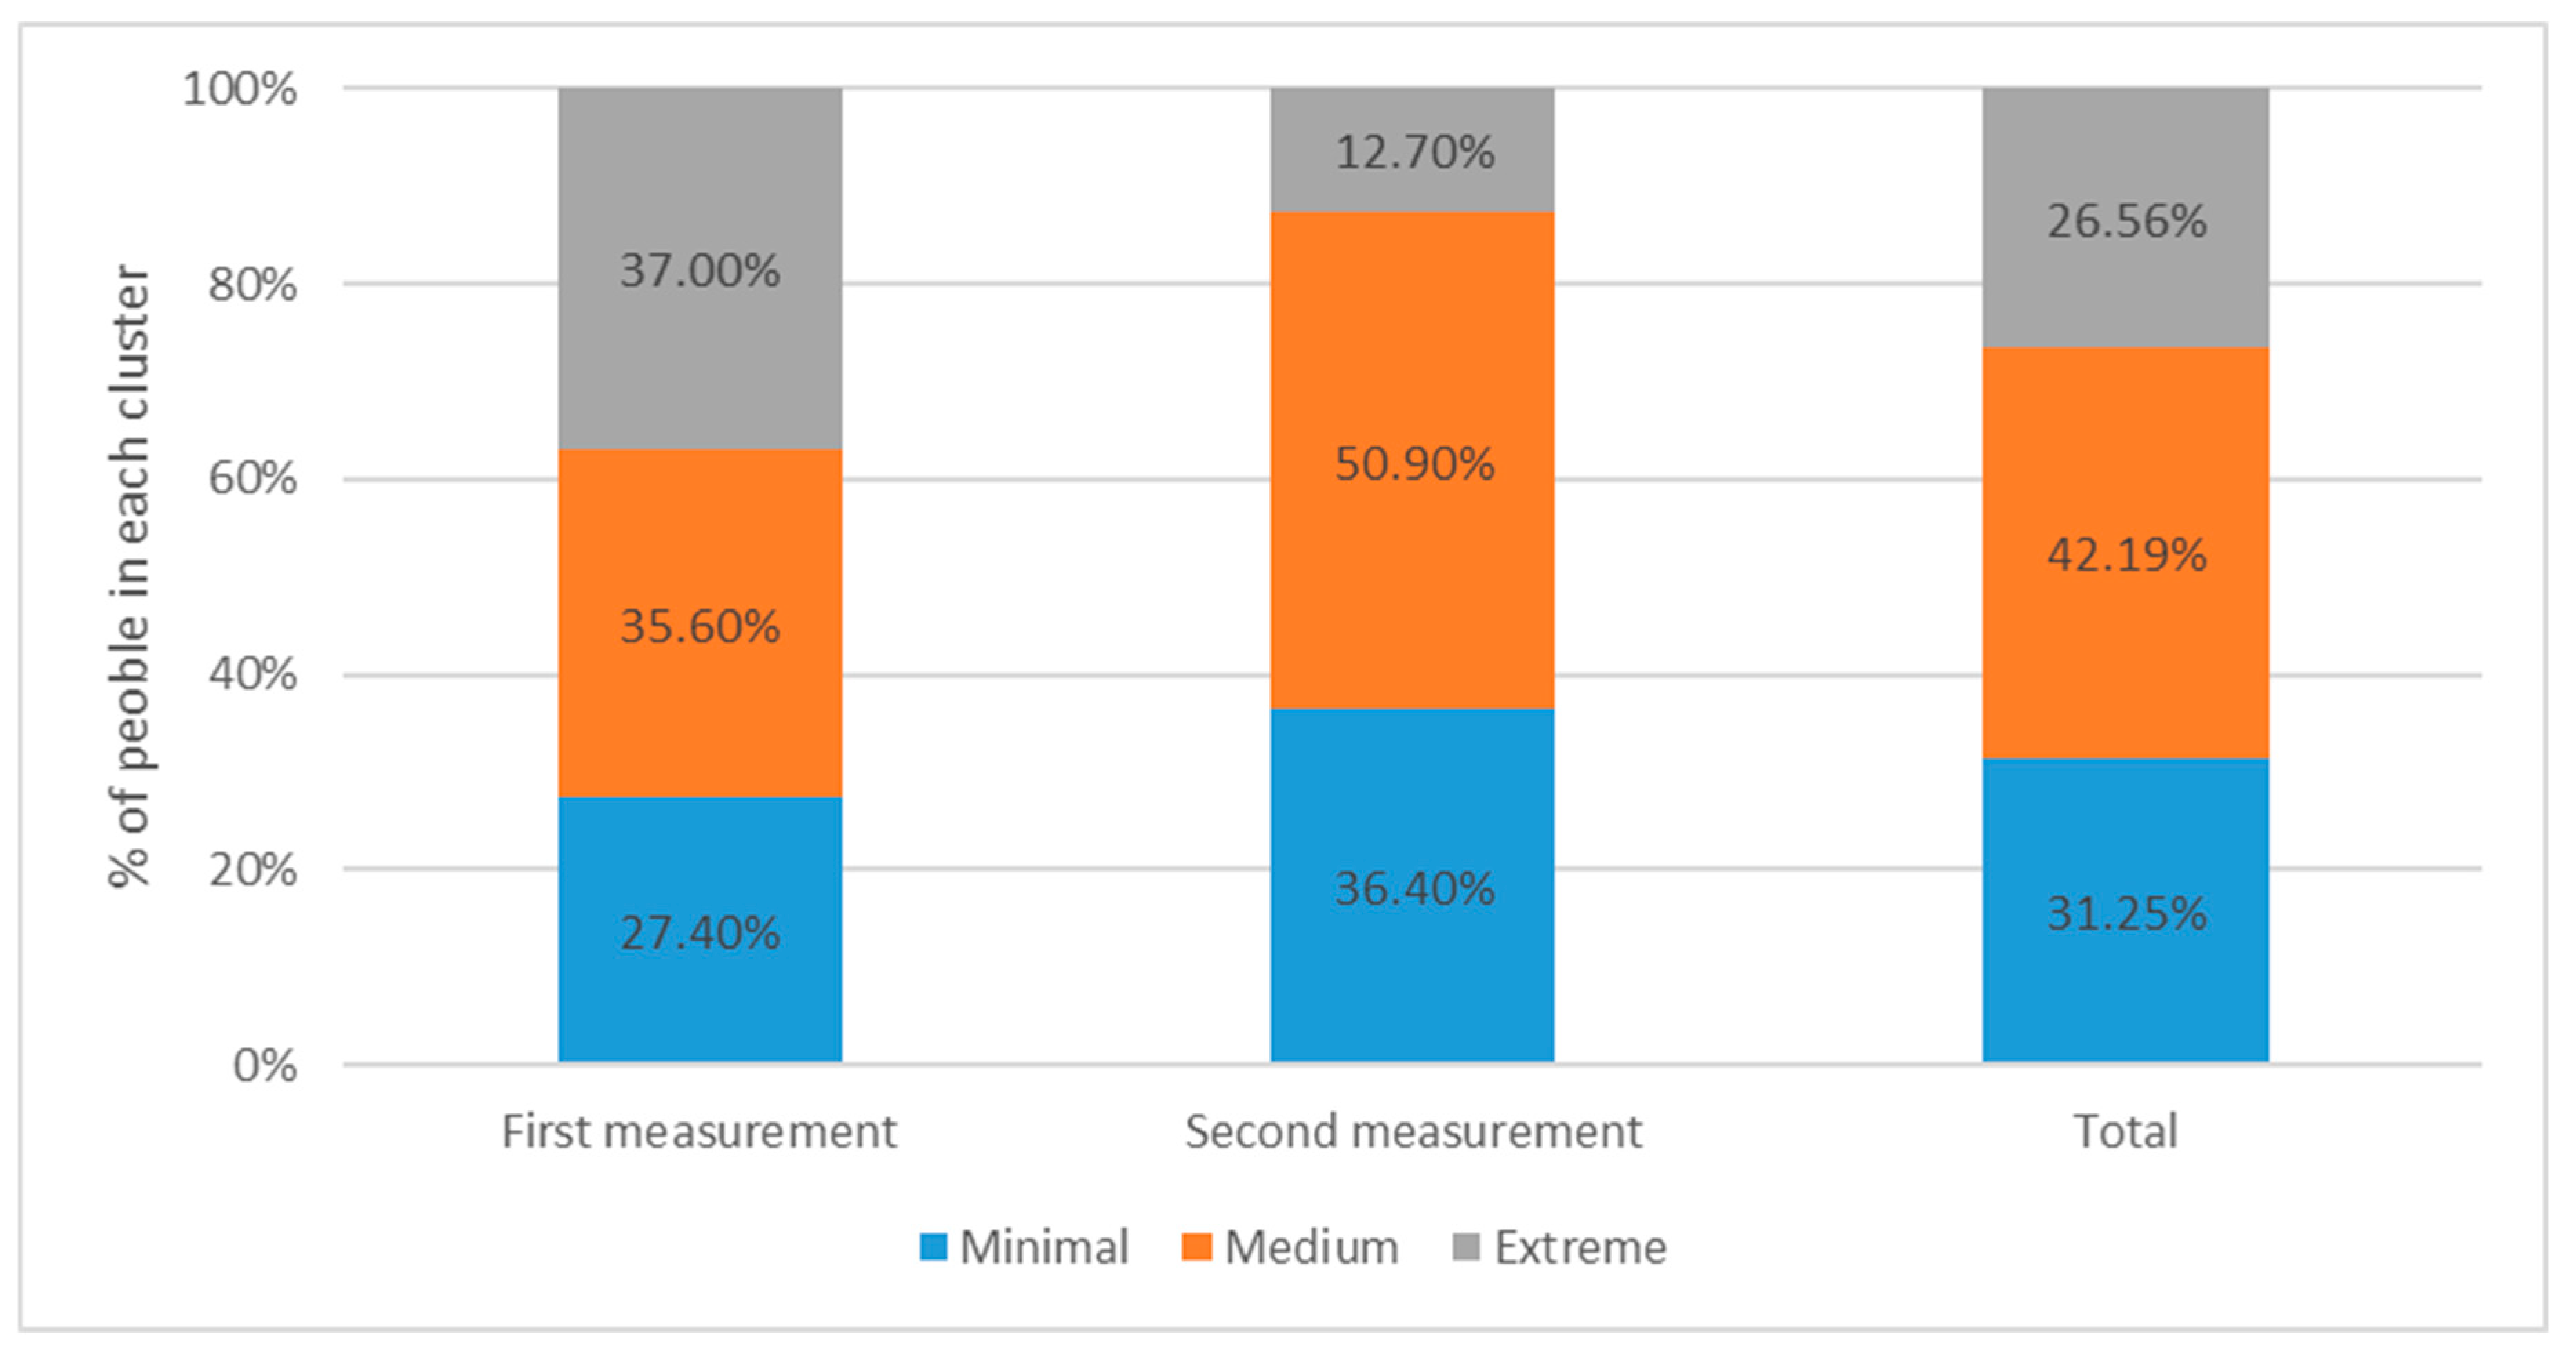
In order to classify respondents, segments were formed according to the different mental health conditions. For the segmentation analysis, only those respondents who answered all the questions were included. The examined variables were insomnia, anxiety, and depression, with a new variable created to integrate them. From the latter variable, three segments were created using Ward’s method. Substance use was contrasted with the severity of the mental health condition, in order to analyze its impact on people’s behavior.
For the segmentation analysis, only those respondents who answered all the questions were included. The examined variables were insomnia, anxiety, and depression, with a new variable created to integrate them. From the latter variable, three segments were created using Ward’s method. Substance use was contrasted with the severity of the mental health condition, in order to be able to analyze its impact on people’s behavior.

3. Results

The sample was composed solely of physicians whose professional practice was carried out in any unit of Salamanca Hospital. The overall results are presented in the following table (Table 1)

3.1. Sleep

The results obtained in the first wave revealed the presence of mild insomnia, while the second wave showed a clinical absence of insomnia.
The prevalence of insomnia during the first wave was high (71.8%), decreasing to 50.9% in the second wave. No doctors were affected by severe clinical insomnia. ISI scores went from a mean value of 10.91 (SD ± 5.46) to 7.88 (SD ± 2.89) (d = 0.66). Overall, there was a decrease in the severity of sleep difficulties (including sleep onset, maintenance, and early morning) and the distress caused by sleep problems. There was an increase in the interference of sleep problems with daily functioning and sleep dissatisfaction.
As for the perceived external noticeability of this problem in daily life, the results showed a decrease in extreme values, while the intermediate values increased. The quality of sleep improved (from mean 10.91 to 7.88), reaching similar values to those of other samples of health workers (not exclusively doctors) (mean = 7.83) [27], but not as high as those of the general population (mean = 6.32). The results indicated that the quality of sleep of doctors increased between the first and second wave (Table 2). There was a decrease in the moderate severity of sleep difficulties, while the percentage of no clinically significant insomnia and subthreshold insomnia increased (Table 2).
The severity of insomnia decreased in the dimensions of sleep difficulty (onset, maintenance, and awakening) and satisfaction. However, the impact of insomnia increased in terms of interference with daily functioning. Sleep-related distress significantly diminished, while external noticeability of sleep problems clustered at intermediate scores (Table 3).
The results were compared with the sample from the Hospital 12 de Octubre in Madrid (Spain), which was constituted by COVID-19 frontline healthcare workers, including nurses, auxiliary nurses, orderlies, and cleaning staff. In the first measurement of our study, insomnia was significantly higher than in the control group, and moderately higher than the general healthcare sample of the Hospital 12 de Octubre. In the first measurement of our sample, 30.8% of participants presented moderate severity insomnia. When compared to the control group, the effect size obtained was considerable [31].
The values obtained in the second survey were close to those of the general healthcare sample of the Hospital 12 de Octubre. The differences between this second measurement and the control group showed a medium effect size (Table 4).

3.2. Anxiety

Anxiety was moderate in both the first wave with a mean value of 14.32 (SD ± 10.30), and in the second wave with a mean value of 11.58 (SD ± 7.38). Scores were obtained for all symptoms, with the most severe item being “difficulty in breathing”, while the item “feeling hot” was the only one that increased in severity (Table 5).
Comparing the first and the second wave, anxiety decreased from 57.2% of participants classified as anxious to 43.10%, with a small to medium effect size (d = 0.29). Subjective anxiety symptoms and panic symptoms predominated over somatic anxiety on both measurements.
Anxiety factors presented differences with a small to moderate effect size (d = 0.33), showing a higher prevalence in subjective anxiety and panic symptoms than in somatic anxiety (Table 6).

3.3. Depression

Depression scores were low, with a mean value of 14.76 (SD ± 7.51) in the first wave, and minimal levels with a mean of 11.80 (SD ± 8.74) in the second wave. In both waves, the highest scoring items were the changes in sleep patterns, fatigue, loss of energy and difficulty concentrating, whereas the least frequently displayed and mild symptoms were the thoughts about suicide and punishment. However, feelings of sadness and failure were found to be higher in this sample than in other general population samples [24,32,33] (Table 7 and Table 8).
Compared to the norm, the first measurement showed a large effect size (d = 0.88), while the second measurement showed a medium effect size (d = 0.46) [23]. When comparing the two measurements, there was a reduction in depression with a medium size (d = 0.36). While most depressive symptoms decreased, the following items increased: pessimism, indecisiveness, irritability, self-dislike, suicide (five more people in this item), and punishment.

3.4. Satisfaction

Personal and job satisfaction of doctors mostly consisted of “average” and “slightly above average” values, with mean scores of 3.47 (SD ± 0.82) in the first wave and 3.34 (SD ± 0.76) in the second wave (Table 9).
When comparing both measurements, the average scores for the current personal and job satisfaction increased, while the extreme scores decreased. Overall, the participants’ satisfaction increased.
The number of people who reported to be “not very satisfied” or “dissatisfied” decreased, i.e., their level of satisfaction increased. The amount of people who stated they were “very satisfied” also decreased. Consequently, the number of people who reported intermediate scores of “normal” or only “satisfied” on a personal level increased. These changes in extreme values affected the means of the first and second wave, making the difference between them minimal in terms of personal satisfaction (d = 0.02), and small for previous job satisfaction (d = 0.29). Nevertheless, there were changes within the sample, even if they were not reflected in the mean.

3.5. Substance Use

The levels of substance use were low. Most respondents reported not using benzodiazepines (68.9%), alcohol (75.4%), or tobacco (86.9%); no other substance was mentioned in the survey. Lower personal satisfaction was found to be associated with a higher use of benzodiazepines (r = −0.30; p = 0.01). Furthermore, a correlation was found between alcohol consumption and job satisfaction: the lower the job satisfaction (both before (r = −0.38, p = 0.002) and after (r = −0.37, p = 0.006) reassignment to COVID-19 units) the higher the alcohol consumption (Table 10).

3.6. Correlation between Variables

The results show that higher levels of job satisfaction were linked to a better quality of sleep and lower levels of anxiety; no correlation was found between the previous working situation and sleep or anxiety (Table 11). Similarly, no differences were found between regular alcohol consumption and the working situation before or after participants were reassigned to COVID-19 units. Regardless of whether it referred to the current or previous position, a higher job satisfaction implied lower alcohol consumption. On the other hand, depression was inversely related to personal satisfaction, as well as the employment situation (both the previous and current position); depression is positively related to anxiety (r = 0.69; p < 0.001), insomnia, and the use of benzodiazepines. No correlation was found between depression and tobacco or alcohol use.

3.6.1. Multivariate Analysis

As shown in Figure 2, axes 1–2 show 70.2% of the variance, making the HJ-Biplot a good indicator to assess the variability of scores on depression, anxiety, job, and personal satisfaction and insomnia.
The acute angle formed by the two factors of the BAI anxiety scale show that they were closely related to each other. Anxiety factor 1 (somatic symptoms) was more strongly related to sleep, while factor 2 (subjective anxiety and panic symptoms) had a closer correlation with depression.
The variables of depression, anxiety, and sleep were found to be independent in relation to job satisfaction before respondents were assigned to COVID-19 units. Our analysis revealed an inverse correlation between the variables of depression, anxiety, and sleep with personal and job satisfaction during assignment to COVID-19 units. The said correlation was stronger in the case of the depression variable and weaker in the sleep variable (Figure 2).

3.6.2. Segmentation of the Sample According to Psychological Dimensions and Their Characterization

Three groups were created for the segmentation analysis, classifying them according to mental health severity as follows: cluster 1, minimal mental health distress; cluster 2, medium mental health distress; and cluster 3, extreme mental health distress (Figure 3).
Differences were found between the two measurements, with an increase in clusters 1 and 2 and a decrease in cluster 3. The number of people with extreme mental health distress decreased, while the number of people who were reported to have minimal to medium mental health distress increased (Table 12).
Cluster 1 was constituted by people who reduced their use of benzodiazepines or did not use them at all, while clusters 2 and 3 represented those respondents using benzodiazepines. As can be seen, the percentage of clusters 2 and 3 decreased between measurements. This was consistent with the correlation of benzodiazepine use with sleep, depression, and anxiety.
Alcohol and tobacco use were not related to anxiety, depression, or insomnia; therefore, the correlation with the clusters was non-existent.
As satisfaction was negatively correlated with insomnia, anxiety, and depression, the respondents belonging to cluster 1 had higher sample percentages in the options “satisfied” or “very satisfied”. Meanwhile, the level of satisfaction decreased in cluster 2, and was even lower in cluster 3.

4. Discussion

There was a reduction in the severity of all variables (insomnia, anxiety, and depression) between the two measurements in our study. This study allowed us to measure the evolution of the variables (insomnia, anxiety, and depression) between the two measurements in a group of doctors who were assigned to the COVID-19 units during the first wave.
The presence of insomnia was significant (71.8%), with a decrease in insomnia levels in the second wave, which had a tendency towards homogeneity. Insomnia was correlated with depression and anxiety. No major psychopathological alterations were detected as a result of this forced reorganization, although there were significant effects on the quality of sleep.
Anxiety was moderate, decreasing from 57.1% to 43.1% between measurements. Overall, levels of depression decreased, but they did increase in certain cases that presented severe symptoms, such as the small group with suicidal thoughts. This said group was detected in only one item, although it was considered well-founded on its own as a measure for suicidal ideation [32] and was a valid pathological indicator [33]. Depression had a correlation with personal and job dissatisfaction. There was no observed correlation between COVID-19 care and depression or anxiety. The source of stress was rather attributed to the uncertainty of not knowing when the pandemic would be under control [34].
A decrease in the variable scores was observed, which could be due both to the fact that a certain number of doctors did not participate in the COVID-19 units in the second wave, and to a more effective management of the situation. This said improvement could be the result of the following elements: the different organization of care shifts, less hardship, a broader knowledge of the situation, reduced distress, better knowledge of the disease, and a reduced risk of contagion.
The use of substances was found to have an indirect correlation with personal and professional satisfaction.
Even though personal dissatisfaction was correlated with insomnia (R2 = −0.26 **), it should be noted that the dissatisfaction-insomnia correlation was unidirectional. That is, insomnia does not produce dissatisfaction with life, but dissatisfaction with life does produce insomnia [35].
A correlation was found between benzodiazepine use and depression, insomnia, and anxiety (even more closely related to factor 2 of subjective anxiety and panic symptoms). There was also a correlation between alcohol use and job dissatisfaction, but no correlation was found between tobacco use and job dissatisfaction in any of the variables studied. Increased use of benzodiazepines was also reported in the general US population during the pandemic. In the case of doctors, this use seemed to be linked to the appearance of psychopathological distress.
A high prevalence of insomnia and moderate levels of anxiety and depression were identified, as they had already been described in other studies conducted at the beginning of the pandemic [11].
Differences were detected with other similar samples (higher levels of insomnia), although this could be explained by the type of professionals that participated in our study, who were exclusively doctors [36].
The values of anxiety were consistent with the ones obtained in the samples of COVID-19 frontline healthcare professionals (43%) [36].
Although substance use can be considered a maladaptive type of resilience that is more prevalent in males [37], no significant increase in substance use was found compared to pre-pandemic levels.
This is a real-life study that could potentially help to understand the real professional performance of doctors. However, the second survey was conducted during the second wave. At this point in time, most doctors were no longer in COVID-19 units but were performing their usual tasks. However, unlike in the general population, symptomatology was not reduced in this group. This could be a result of the uncertainty surrounding the issues of disease control and its effectiveness.
One of the limitations of this study is a sampling bias, as it is possible that the subjects who responded to the survey on the two occasions were different, which could mean that they were self-selected, with, for example, the most affected subjects not responding.
Another limitation of the study is that the two times the survey was sent out, although the responses in the first wave were available for the same amount of time, they were recorded in the first week, while in the second wave, they took longer to be recorded, which may have implications for comparisons.
We were not able to ask each participant their sex, age, or specialty, as these data would have allowed us to identify the respondents, which is a limitation for interpreting results.
While this study has the potential to help understand the real challenges of medical practice, it does have limitations in terms of generalizability of the results, like with other naturalistic studies. There were several elements that differentiated the first wave from the second: initially, there was greater scientific-technical lack of knowledge regarding medical decisions, uncertainty about the effectiveness of political decisions on the epidemic, absence of historical references in our immediate environment, prolonged home confinement, etc. These factors, together with the employment situation of the respondents, hindered the identification of specific causal attributions. Furthermore, the study was exclusively limited to those doctors in the COVID-19 units working in the University of Salamanca Health Care Complex during the pandemic, so the results shown may not be fully applicable to other contexts or population groups.
However, the fact that the general population still maintained high COVID-19 symptomatology may be due, among other factors, to the reorganization of COVID-19 units. Thus, it is possible that our data are not directly applicable to other hospitals, which may have structured COVID-19 units differently, or did not experience such an acute first wave, as it was the case in our province.
This study could be extended to second-line professionals who have not treated COVID-19 patients directly, but whose routine has also been affected by this situation.
It would be interesting to study the psychopathological consequences of traumatic manifestations during the following waves of the pandemic, as well as its long-term evolution.

5. Conclusions

This study shows that it is necessary to implement preventive and therapeutic measures in order to detect mental health problems. This forced medical reorganization did not cause any major psychopathological distress, only affecting the quality of sleep. However, we must bear in mind that the statistics can “hide” significant health data (almost 8% of the doctors in the first wave sample presented severe anxiety scores (Table 5) and almost 7% had severe depression (Table 8). In addition, measures with a central tendency could possibly counteract scores on uncollected variables (e.g., no differentiation was made between professionals who volunteered and those who felt forced to take on the reassignment).
However, the severity decreased in the second measurement, coinciding with the second wave of the pandemic, when most of the COVID-19-unit members remained in their usual position, although their working conditions had been partly modified by the pandemic. Another study described a decrease in the intensity of symptoms, although it pointed out the lack of consistency due to the uncertainty surrounding the situation, warning of the possible development of irritability, hypervigilance, or nightmares derived from the experience [38]. Fear, uncertainty, and stigmatization are recurring elements in every biological disaster and can become an obstacle to provide adequate medical and mental health treatment [39].
Although we observed high scores on the scales, they were not as high as in other studies conducted later; possibly one of the factors that influenced this was that the reorganization of attention was effective.
As a final conclusion, this study shows that the psychological impacts studied generally decreased between the two surveys. However, in a population with presumably available coping resources, consequences may manifest in other dimensions such as grief, trauma, or guilt, as well as traumatic reactions that may resurface when recalling participation in COVID-19 units. Nevertheless, feelings of sadness and failure were higher in this sample than in other general population samples [24,32,33].
Given the uncertainty of how the pandemic will actually evolve and when it will end, as well as the medium- and long-term repercussions on professionals, we believe it is important to adapt health resources to the new and unpredictable mental health needs of this group.

Author Contributions

P.A.-O., M.T.L.L., J.G.-A., J.A.B.S., C.M. and A.M.-C., conceptualization, study design, and data collection. A.G.-S. and C.R., formal analysis and data analysis. P.A.-O., A.G.-S. and C.R., writing and preparation of the original draft. M.M. and C.R., writing, revising, and editing. All authors have read and agreed to the published version of the manuscript.

Funding

This study has been funded by the Regional Ministry of Health (Gerencia Regional de Salud de Castilla y León) no. exp: GRS COVID 57/A/20.

Institutional Review Board Statement

The study was conducted in accordance with the Declaration of Helsinki, and approved by the Ethics Committee of SALAMANCA HEALTHCARE AREA (protocol code 2020 06 500 and date of approval 15 June 2020).

Informed Consent Statement

This study was conducted in accordance with the guidelines of the Declaration of Helsinki, the appropriate measures have been taken to guarantee the complete confidentiality of the personal data of those participating in this study and in accordance with the “Organic Law 15/1999 of 13 December on the Protection of Personal Data” of the Government of Spain.

Data Availability Statement

The data presented in this study are available upon request from the corresponding author. Data have not been made public due to ethical issues.

Conflicts of Interest

The authors have no conflict of interest to declare. The funding entity had no role in the design, collection, analysis or interpretation of the data; in the process of writing the manuscript; or in the decision to publish the results.

References

  1. Vieta, E.; Pérez, V.; Arango, C. Psychiatry in the aftermath of COVID-19. Rev. Psiquiatr. Salud Ment. 2020, 13, 105–110. [Google Scholar] [CrossRef] [PubMed]
  2. Roncero, C.; García-Ullán, L.; de la Iglesia-Larrad, J.I.; Martín, C.; Andrés, P.; Ojeda, A.; González-Parra, D.; Pérez, J.; Fombellida, C.; Álvarez-Navares, A.; et al. The response of the mental health network of the Salamanca area to the COVID-19 pandemic: The role of the telemedicine. Psychiatry Res. 2020, 291, 113252. [Google Scholar] [CrossRef] [PubMed]
  3. Martin, C.; Andrés, P.; Bullón, A.; Villegas, J.L.; de la Iglesia-Larrad, J.I.; Bote, B.; Prieto, N.; Roncero, C. COVID pandemic as an opportunity for improving mental health treatments of the homeless people. Int. J. Soc. Psychiatry 2021, 67, 335–343. [Google Scholar] [CrossRef] [PubMed]
  4. Brooks, S.K.; Webster, R.K.; Smith, L.E.; Woodland, L.; Wessely, S.; Greenberg, N.; Rubin, G.J. The psychological impact of quarantine and how to reduce it: Rapid review of the evidence. Lancet 2020, 395, 912–920. [Google Scholar] [CrossRef] [Green Version]
  5. Fernandez-Mendoza, J.; Vgontzas, A.N.; Liao, D.; Shaffer, M.L.; Vela-Bueno, A.; Basta, M.; Bixler, E.O. Insomnia with Objective Short Sleep Duration and Incident Hypertension The Penn State Cohort. Hypertension 2012, 62, 1068–1073. [Google Scholar] [CrossRef]
  6. Baglioni, C.; Battagliese, G.; Feige, B.; Spiegelhalder, K.; Nissen, C.; Voderholzer, U.; Lombardo, C.; Riemann, D. Insomnia as a predictor of depression: A meta-analytic evaluation of longitudinal epidemiological studies. J. Affect. Disord. 2011, 135, 10–19. [Google Scholar] [CrossRef]
  7. Zhang, C.; Yang, L.; Liu, S.; Ma, S.; Wang, Y.; Cai, Z.; Du, H.; Li, R.; Kang, L.; Su, M.; et al. Survey of Insomnia and Related Social Psychological Factors Among Medical Staff Involved in the 2019 Novel Coronavirus Disease Outbreak. Front. Psychiatry 2020, 11, 306. [Google Scholar] [CrossRef] [Green Version]
  8. Erquicia, J.; Valls, L.; Barja, A.; Gil, S.; Miquel, J.; Leal-Blanquet, J.; Schmidt, C.; Checa, J.; Vega, D. Emotional impact of the COVID-19 pandemic on healthcare workers in one of the most important infection outbreaks in Europe. Med. Clin. (Barc). 2020, 155, 434–440. [Google Scholar] [CrossRef]
  9. Dosil Santamaría, M.; Ozamiz-Etxebarria, N.; Redondo Rodríguez, I.; Jaureguizar Alboniga-Mayor, J.; Picaza Gorrotxategi, M. Psychological impact of COVID-19 on a sample of Spanish health professionals. Rev. Psiquiatr. Salud Ment. 2021, 14, 106–112. [Google Scholar] [CrossRef]
  10. García-Iglesias, J.J.; Gómez-Salgado, J.; Martín-Pereira, J.; Fagundo-Rivera, J.; Ayuso-Murillo, D.; Martínez-Riera, J.R.; Ruiz Frutos, C. Impact of SARS-CoV-2 (COVID-19) on the mental health of healthcare professionals: A systematic review. Rev. Esp. Salud Publica 2020, 94, 1–20. [Google Scholar]
  11. Liu, S.; Yang, L.; Zhang, C.; Xiang, Y.T.; Liu, Z.; Hu, S.; Zhang, B. Online mental health services in China during the COVID-19 outbreak. Lancet Psychiatry 2020, 7, e17–e18. [Google Scholar] [CrossRef]
  12. Prazeres, F.; Passos, L.; Simões, J.; Simões, P.; Martins, C.; Teixeira, A. COVID-19-related fear and anxiety: Spiritual-religious coping in healthcare workers in portugal. Int. J. Environ. Res. Public Health 2020, 18, 220. [Google Scholar] [CrossRef] [PubMed]
  13. Pérez-López, F.R.; Tajada, M.; Savirón-Cornudella, R.; Sánchez-Prieto, M.; Chedraui, P.; Terán, E. Coronavirus disease 2019 and gender-related mortality in European countries: A meta-analysis. Maturitas 2020, 141, 59–62. [Google Scholar] [CrossRef] [PubMed]
  14. Madrid-Valero, J.J.; Martínez-Selva, J.M.; Ribeiro do Couto, B.; Sánchez-Romera, J.F.; Ordoñana, J.R. Age and gender effects on the prevalence of poor sleep quality in the adult population. Gac. Sanit. 2017, 31, 18–22. [Google Scholar] [CrossRef] [Green Version]
  15. National Institutes of Health. National Institutes of Health State of the Science Conference Statement. Sleep 2005, 28, 1049–1057. [Google Scholar] [CrossRef] [Green Version]
  16. Fernandez-Mendoza, J.; Rodriguez-Muñoz, A.; Vela-Bueno, A.; Olavarrieta-Bernardino, S.; Calhoun, S.L.; Bixler, E.O.; Vgontzas, A.N. The Spanish version of the Insomnia Severity Index: A confirmatory factor analysis. Sleep Med. 2012, 13, 207–210. [Google Scholar] [CrossRef]
  17. Beck, A.T.; Epstein, N.; Brown, G.; Steer, R.A. An inventory for measuring clinical anxiety: Psychometric properties. J. Consult. Clin. Psychol. 1988, 56, 893–897. [Google Scholar] [CrossRef]
  18. Beck, A.T.; Steer, R.A.; Ball, R.; Ranieri, W.F. Comparison of Beck Depression Inventories-IA and-II in Psychiatric Outpatients. J. Pers. Assess. 1996, 67, 588–597. [Google Scholar] [CrossRef]
  19. Morin, C.M.; Estivill, E. Insomnia: Assistance and Psychological Treatment; Ariel: Barcelona, Spain, 1998; ISBN 84-344-0875-9. [Google Scholar]
  20. Bastien, C. Validation of the Insomnia Severity Index as an outcome measure for insomnia research. Sleep Med. 2001, 2, 297–307. [Google Scholar] [CrossRef]
  21. Bell, C.C. DSM-IV: Diagnostic and Statistical Manual of Mental Disorders. JAMA 1994, 272, 828–829. [Google Scholar] [CrossRef]
  22. Sanz, J. Recommendations for the use of the Spanish adaptation of the Beck Anxiety Inventory (BAI) in clinical practice. Clínica Salud 2014, 25, 39–48. [Google Scholar] [CrossRef]
  23. Sanz, J.; Perdigón, A.L.; Vázquez, C. The spanish adaptation of Beck’s Depression Inventory-II (BDI-II): 2. Psychometric properties in the general population. Clin. Salud 2003, 14, 249–280. [Google Scholar]
  24. Sanz, J.; Eugenia, M.; Vázquez, C. The spanish adaptation of Beck’s Depression Inventory-II (BDI-II): 2. Psychometric properties in the student population. Análisis Modif. Conduct. 2003, 29, 239–288. [Google Scholar]
  25. Sanz, J.; García-Vera, M.P.; Espinosa, R.; Fortún, M.; Vázquez, C. Spanish adaptation of the Beck Depression Inventory-II (BDI-II): 3. Psychometric features in patiens with psychological disorders. Clínica Salud 2005, 16, 121–142. [Google Scholar]
  26. BECK, A.T. An Inventory for Measuring Depression. Arch. Gen. Psychiatry 1961, 4, 561. [Google Scholar] [CrossRef] [Green Version]
  27. Herrero San Martin, A.; Parra Serrano, J.; Diaz Cambriles, T.; Arias Arias, E.M.; Muñoz Méndez, J.; del Yerro Álvarez, M.J.; González Sánchez, M. Sleep characteristics in health workers exposed to the COVID-19 pandemic. Sleep Med. 2020, 75, 388–394. [Google Scholar] [CrossRef]
  28. Galindo, P. An alternative for simultaneous representation: HJ-Biplot. Questiió: Quaderns d’Estadística, Sistemes, Informatica I Investigació Operativa. Questiio 1986, 10, 13–23. [Google Scholar]
  29. Vicente-Villardón, J.L. MultBiplotR: Multivariate Analysis Using Biplots 2021. Available online: https://cran.r-project.org/web/packages/MultBiplotR/MultBiplotR.pdf (accessed on 11 November 2021).
  30. SPSS Corp. Inc. IBM SPSS Statistics for Windows v.25; IBM Corp: Armonk, NY, USA, 2017. [Google Scholar]
  31. Cohen, J. Statistical Power Analysis for the Behavioral Sciences; Academic Press, Inc.: Cambridge, MA, USA, 2013. [Google Scholar]
  32. Casey, P.R.; Dunn, G.; Kelly, B.D.; Birkbeck, G.; Dalgard, O.S.; Lehtinen, V.; Britta, S.; Ayuso-Mateos, J.L.; Dowrick, C. Factors associated with suicidal ideation in the general population. Br. J. Psychiatry 2006, 189, 410–415. [Google Scholar] [CrossRef] [Green Version]
  33. Larroy, C.; Estupiña, F.; Fernández-Arias, I.; Hervás, G.; Valiente, C.; Gómez, M.; Crespo, M.; Rojo, N.; Roldán, L.; Vázquez, C.; et al. Guide for the Remote Approach of the Psychological Consequences of the Epidemic Outbreak of COVID-19 in the General Population; Universidad Complutense Madrid: Madrid, Spain, 2020; Available online: https://www.ucm.es/clinicadepsicologia/file/guia-COVID-19-ucmprofesionalesversion-12 (accessed on 11 November 2021).
  34. Hummel, S.; Oetjen, N.; Du, J.; Posenato, E.; Resende de Almeida, R.M.; Losada, R.; Ribeiro, O.; Frisardi, V.; Hopper, L.; Rashid, A.; et al. Mental Health Among Medical Professionals During the COVID-19 Pandemic in Eight European Countries: Cross-sectional Survey Study. J. Med. Internet Res. 2021, 23, e24983. [Google Scholar] [CrossRef]
  35. Paunio, T.; Korhonen, T.; Hublin, C.; Partinen, M.; Kivimaki, M.; Koskenvuo, M.; Kaprio, J. Longitudinal Study on Poor Sleep and Life Dissatisfaction in a Nationwide Cohort of Twins. Am. J. Epidemiol. 2008, 169, 206–213. [Google Scholar] [CrossRef] [Green Version]
  36. Santabárbara, J.; Bueno-Notivol, J.; Lipnicki, D.M.; Olaya, B.; Pérez-Moreno, M.; Gracia-García, P.; Idoiaga-Mondragon, N.; Ozamiz-Etxebarria, N. Prevalence of anxiety in health care professionals during the COVID-19 pandemic: A rapid systematic review (on published articles in Medline) with meta-analysis. Prog. Neuro-Psychopharmacol. Biol. Psychiatry 2021, 107, 110244. [Google Scholar] [CrossRef] [PubMed]
  37. Eng, J.; Drabwell, L.; Stevenson, F.; King, M.; Osborn, D.; Pitman, A. Use of Alcohol and Unprescribed Drugs after Suicide Bereavement: Qualitative Study. Int. J. Environ. Res. Public Health 2019, 16, 4093. [Google Scholar] [CrossRef] [PubMed] [Green Version]
  38. Arnoso Martinez, M.; Arnoso Martinez, A.; Perez Sales, P. Argentina (1976–1983): Impacto y afrontamiento psicosocial. [Argentina (1976–1983): Impact and psychosocial coping]. Univ. Psychol. 2015, 14, 833–842. [Google Scholar] [CrossRef] [Green Version]
  39. Xiang, Y.-T.; Yang, Y.; Li, W.; Zhang, L.; Zhang, Q.; Cheung, T.; Ng, C.H. Timely mental health care for the 2019 novel coronavirus outbreak is urgently needed. Lancet Psychiatry 2020, 7, 228–229. [Google Scholar] [CrossRef] [Green Version]
Figure 1. Evolution of COVID-19 cases at the Clinical Hospital of Salamanca for 2020.
Ijerph 19 02712 g001
Figure 2. Two-dimensional representation of the HJ Biplot analysis using axes 1–2. Barycentric scaling. First measurement (x), second measurement (+).
Ijerph 19 02712 g002
Figure 3. Measurement-based segmentation.
Ijerph 19 02712 g003
Table 1. Summary of scale scores between waves.
1st Wave2nd Wave
ISI (+8)71.850.8
BAI (+10)57.143.1
BDI (+14)46.758.3
Note: percentage of sample who scored that punctuation or more, which means significant results.
Table 2. Frequency of ISI scores.
ISI Results1st Meas.2nd Meas.Dif %
n%n%
No clinically significant insomnia (0–7)2228.22949.221.00
Subthreshold insomnia (8–14)3241.02949.28.20
Clinical insomnia (moderate severity) (15–21)2430.811.7−29.10
Clinical insomnia (severe) (22–28)00000
Total7810059100
Table 3. Frequency of ISI dimensions.
Sleep Difficulty
Onset Maintenance Early Morning
1st Meas.2nd Meas.Dif %1st Meas.2nd Meas.Dif %1st Meas.2nd Meas.Dif %
Intensityn%n% n%n% n%n%
None141717281117211931112125233812
Mild1822274423232818301.8212520337.5
Moderate42511728−2334412439−222271321−5
Severe89.600−1091100−11151834.9−13
Very severe11.200−10000044.800−5
n8310061100 8310061100 8310059100
Impact of Insomnia Dissatisfaction with Sleep Quality
Interference Noticeability Distress Satisfaction
1st Meas.2nd Meas.Dif %1st Meas.2nd Meas.Dif %1st Meas.2nd Meas.Dif %1st Meas.2nd Meas.Dif %
n%n% n%n% n%n% n%n%
None161934.9−1432391728−11182239644278.411.6−7
Slight2227712−1525301830−130361626−10283411.6−32
Some1923294825161917288.6131669.8−626311321−10
High212519315.844.87126.7161900−191923274421
Very high33.634.91.322.411.6−133.600−422.4193129
n811006110007910060100 8010061100 82100611000
Table 4. Comparison between samples of health care professionals through effect size.
1st Meas. Clinical Hospital of SalamancanMeanSDCVCohen’s dHedge’s gΔ2 GlassR2
7910.915.4650.05
Other studiesHospital 12 de Octubre1007.835.2967.560.570.570.580.08
Control706.324.2867.720.920.921.070.16
2nd Meas. Clinical Hospital of Salamanca597.882.8936.67
Other studiesHospital 12 de Octubre 0.010.010.01<0.001
Control 0.420.410.360.001
1st Meas. and 2nd Meas. Clinical Hosp. of Salamanca 0.660.660.550.13
Table 5. Frequency of BAI test results.
BAI ResultsMeas. 1Meas. 2Dif %
n%n%
Non-anxiogenic (0–9)3342.93356.914.00
Moderate anxiety (10–18)1823.41525.82.46
Moderate to severe anxiety (19–29)2026.0915.5−10.48
Severe anxiety (30–63)67.811.7−6.08
Total7710058100
Table 6. Effect size between BAI factors. First measurement.
MeasuresFactorsnMeanSDComparisonCohen’s dHedge’s gGlass’s Δ2
1st Meas.F1786.225.14F1 and F20.330.330.32
F2777.985.49
Total7714.3210.301st and 2nd Meas.0.290.290.37
2nd Meas.F1605.083.74F1 and F20.380.380.36
F2596.574.04
Total5811.587.38
Note. F1: Anxiety Factor 1 (somatic symptoms); F2: Anxiety Factor 2 (subjective and panic symptoms); BAI: Beck Anxiety Inventory.
Table 7. Difference in means of BDI-II scores, before (Dep1) and after (Dep2).
No.ItemMeanDep1 (SD)MeanDep2 (SD)Dif
16Changes in sleep patterns1.32 (0.80)0.82 (0.62)−0.50
21Loss of sexual interest0.90 (0.92)0.46 (0.74)−0.44
1Sadness0.67 (0.70)0.30 (0.49)−0.37
10Crying0.59 (0.63)0.23 (0.50)−0.36
18Changes in appetite0.81 (0.76)0.57 (0.67)−0.24
19Difficulty concentrating1.00 (0.76)0.77 (0.62)−0.23
4Loss of pleasure0.83 (0.70)0.61 (0.59)−0.22
11Irritability0.72 (0.48)0.51 (0.50)−0.21
20Tiredness or fatigue1.04 (0.76)0.85 (0.68)−0.19
3Failure0.53 (1.02)0.43 (0.62)−0.10
5Guilt0.47 (0.64)0.42 (0.59)−0.05
8Self-criticism0.69 (0.65)0.64 (0.66)−0.05
12Loss of interest0.74 (0.75)0.69 (0.74)−0.05
15Loss of energy1.00 (0.65)0.95 (0.76)−0.05
14Devaluation0.53 (0.85)0.52 (0.72)−0.01
2Pessimism0.79 (0.67)0.80 (0.65)0.01
13Indecisiveness0.55 (0.62)0.57 (0.72)0.02
17Agitation0.79 (0.59)0.82 (0.65)0.03
7Self-dislike0.36 (0.66)0.44 (0.70)0.08
9Suicidal ideation0.01 (0.11)0.10 (0.30)0.09
6Punishment0.22 (0.58)0.33 (0.79)0.11
Table 8. Frequency of BDI-II test results.
DBI-II Results1st Meas.2nd Meas.Dif
n%n%
Minimal depression (0–13)3546.73558.311.63
Mild depression (14–19)2229.31626.7−2.63
Moderate depression (20–28)1317.358.3−8.97
Severe depression (29–63)56.746.7−0.03
Total7510060100
Table 9. Frequencies and differences in the satisfaction dimension in both measurements.
SatisfactionSatisfaction 1st Meas.Satisfaction 2nd Meas.
PersonalJobPersonalJob
CurrentPreviousCurrentPrevious
n%n%n%n%Difn%Difn%Dif
Dissatisfied11.31012.80000−1.346.6−6.31.01.61.6
Not very satisfied1316.71924.41012.8711.5−5.22032.88.45.08.2−4.6
Normal2228.21519.21721.82236.17.91727.98.618.029.57.7
Satisfied3139.72633.32228.22642.62.91626.2−7.130.049.221.0
Very satisfied1114.1810.32937.269.8−4.346.6−3.77.011.5−25.7
Total78100781007810061100 61100 61100
Table 10. Frequency of substance use.
UseBenzodiazepines %Alcohol%Tobacco%
Never 4268.94675.45386.9
Started 69.846.611.6
Decreased34.934.934.9
Stable813.1711.534.9
Increased23.311.611.6
n611006110061100
Table 11. Bivariate correlations using Pearson’s correlation coefficient.
SatisfactionInsomniaDepressionAnxietySubstances
PersonalCurrent JobPrevious JobTotalF1F2BenzoAlcoholTobacco
Personal satisfaction1
Current job satisfaction0.55 **1
Previous job satisfaction0.32 **0.36 **1
Insomnia−0.26 **−0.29 **NS 1
Depression−0.44 **−0.57 **−0.26 **0.59 **1
Anxiety−0.43**−0.47 **NS 0.58 **0.69 **1
Somatic symptoms of anxiety−0.38 **−0.39 **NS0.54 **0.65 **0.949 **1
Subjective anxiety and panic symptoms−0.47 **−0.53 **NS0.57 **0.69 **0.953 **0.809 **1
Benzodiazepines−0.30 *NS NS0.37 **0.33 **0.497 **0.379 **0.556 **1
AlcoholNS−0.34 **−0.38 **NS NS NSNSNSNS1
TobaccoNS NS NSNS NSNSNSNSNSNS1
Note. * p < 0.05; ** p < 0.01. NS: non-significant.
Table 12. Characterization of the segments according to anxiety, depression, and insomnia. Percentages.
ClusterAnxiety
Non-anxiogenicModerateModerate to severeSevereTotal
195.05.00.00.0100
244.446.39.30.0100
30.011.867.620.6100
Total48.424.221.95.5100
Depression
Minimal/non-existentMildModerateSevereTotal
197.52.50.00.0100
248.138.97.45.6100
38.835.341.214.7100
Total53.126.614.16.3100
Insomnia
Clinical absenceSubthresholdModerately severeSevereTotal
185.015.00.00.0100
222.270.47.40.0100
35.938.255.90.0100
Total37.544.518.00.0100
Note. Percentage belonging to each mental health segment to show the behavior within each cluster and the severity of mental health conditions.
Publisher’s Note: MDPI stays neutral with regard to jurisdictional claims in published maps and institutional affiliations.

