
Differences in the Correlation between the Built Environment and Walking, Moderate, and Vigorous Physical Activity among the Elderly in Low- and High-Income Areas

 ,
, 
Abstract
:1. Introduction
1.1. Benefits of Physical Activity
1.2. The Influence of Built Environment on Physical Activity
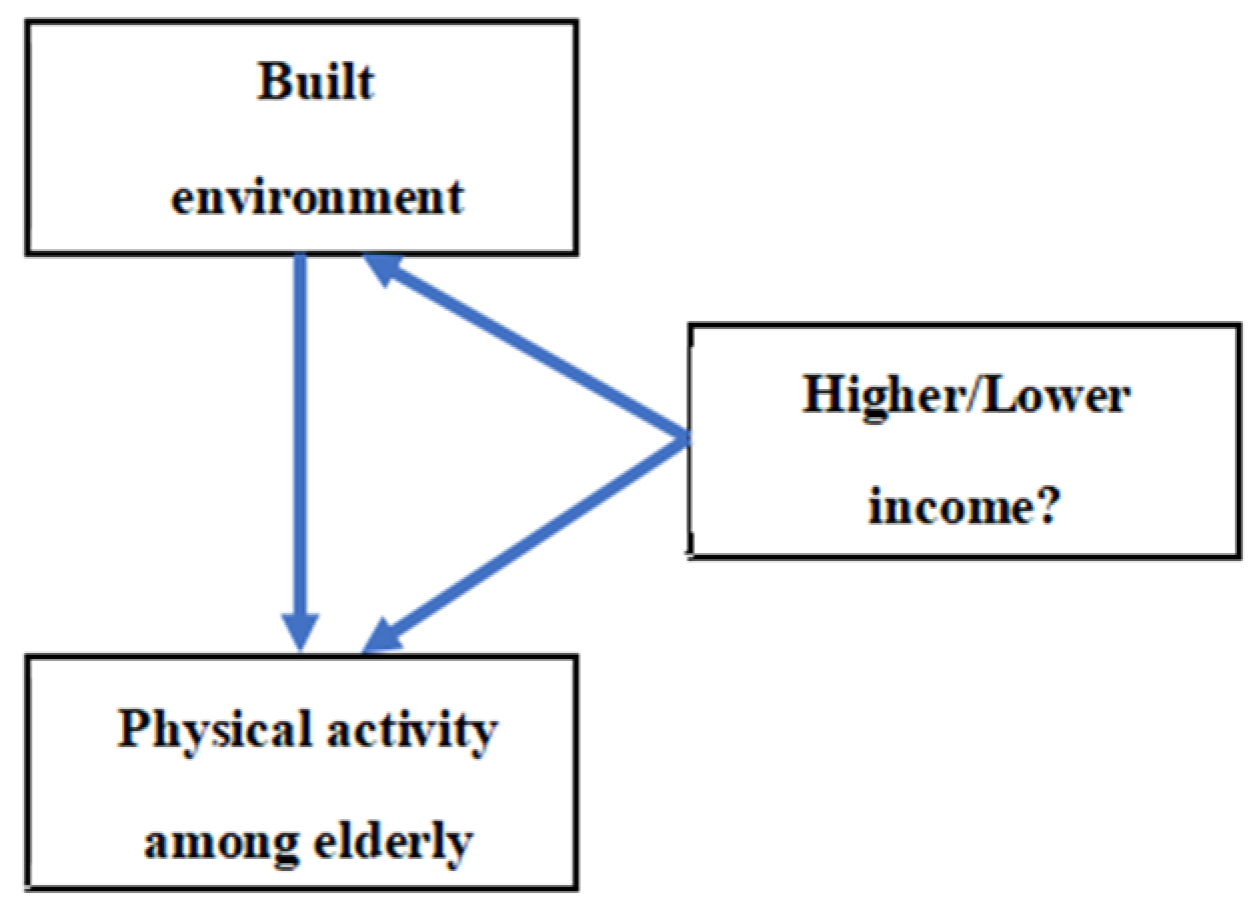
1.3. Thrust of Our Research
2. Materials and Methods
2.1. Selection of Research Objects and Research Areas
2.2. Built Environment Data
2.3. Physical Activity Data
2.4. Data Analysis
3. Results
3.1. Descriptive Statistics
3.2. Correlation Analysis
3.3. Regression Analysis
4. Discussion
5. Conclusions
Author Contributions
Funding
Institutional Review Board Statement
Informed Consent Statement
Data Availability Statement
Conflicts of Interest
References
- Garber, C.E.; Blissmer, B.; Deschenes, M.R.; Franklin, B.A.; Lamonte, M.J.; Lee, I.M.; Nieman, D.C.; Swain, D.P. Quantity and Quality of Exercise for Developing and Maintaining Cardiorespiratory, Musculoskeletal, and Neuromotor Fitness in Apparently Healthy Adults: Guidance for Prescribing Exercise. Med. Sci. Sports Exerc. 2011, 43, 1334–1359. [Google Scholar] [CrossRef]
- Fletcher, G.F.; Ades, P.A.; Kligfield, P.; Arena, R.; Balady, G.J.; Bittner, V.A.; Coke, L.A.; Fleg, J.L.; Forman, D.E.; Gerber, T.C.; et al. Exercise Standards for Testing and Training: A Scientific Statement From the American Heart Association. Circulation 2013, 128, 873–934. [Google Scholar] [CrossRef] [PubMed]
- Benjamin, E.J.; Muntner, P.; Alonso, A.; Bittencourt, M.S.; Callaway, C.W.; Carson, A.P.; Chamberlain, A.M.; Chang, A.R.; Cheng, S.; Das, S.R.; et al. Heart Disease and Stroke Statistics-2019 Update A Report From the American Heart Association. Circulation 2019, 139, E56–E528. [Google Scholar] [CrossRef]
- Cruz, B.D.; Biddle, S.J.H.; Gardiner, P.A.; Ding, D. Light-Intensity Physical Activity and Life Expectancy: National Health and Nutrition Survey. Am. J. Prev. Med. 2021, 61, 428–433. [Google Scholar] [CrossRef] [PubMed]
- Nathan, A.; Pereira, G.; Foster, S.; Hooper, P.; Saarloos, D.; Giles-Corti, B. Access to commercial destinations within the neighbourhood and walking among Australian older adults. Int. J. Behav. Nutr. Phys. Act. 2012, 9, 133. [Google Scholar] [CrossRef] [Green Version]
- Wong, R.; Yang, L.; Szeto, W.Y. Wearable fitness trackers and smartphone pedometer apps: Their effect on transport mode choice in a transit-oriented city. Travel Behav. Soc. 2021, 22, 244–251. [Google Scholar] [CrossRef]
- Yang, L.; Liu, J.; Liang, Y.; Lu, Y.; Yang, H. Spatially varying effects of street greenery on walking time of older adults. ISPRS Int. J. Geo-Inf. 2021, 10, 596. [Google Scholar] [CrossRef]
- Li, S.X.; Duan, H.Y.; Smith, T.E.; Hu, H.Y. Time-varying accessibility to senior centers by public transit in Philadelphia. Transp. Res. Part A-Policy Pract. 2021, 151, 245–258. [Google Scholar] [CrossRef]
- Wu, J.N.; Zhao, C.L.; Li, C.Y.; Wang, T.; Wang, L.J.; Zhang, Y. Non-linear Relationships Between the Built Environment and Walking Frequency Among Older Adults in Zhongshan, China. Front. Public Health 2021, 9, 1090. [Google Scholar] [CrossRef]
- Zhang, Z.F.; Wang, M.W.; Xu, Z.; Wang, T.; Wang, L.J.; Zhang, Y. The influence of Community Sports Parks on residents’ subjective well-being: A case study of Zhuhai City, China. Habitat Int. 2021, 117, 102439. [Google Scholar] [CrossRef]
- Li, K.; Yang, D. Identification of the key built environment factors that affect the walking efficiency of the elderly. Transp. Syst. Eng. Inf. Technol. 2021, 21, 245–250. [Google Scholar]
- Michael, Y.L.; Keast, E.M.; Chaudhury, H.; Day, K.; Mahmood, A.; Sarte, A. Revising the senior walking environmental assessment tool. Prev. Med. 2009, 48, 247–249. [Google Scholar] [CrossRef] [PubMed] [Green Version]
- Wahl, H.W.; Hoppmann, C.A.; Ram, N.; Gerstorf, D. Healthy Aging-Relevant Goals: The Role of Person-Context Co-construction. J. Gerontol. Ser. B Psychol. Sci. Soc. Sci. 2021, 76, S181–S190. [Google Scholar] [CrossRef] [PubMed]
- Liu, Z.Y.; Huang, W.L.; Lu, Y.; Peng, Y. Older Adults’ Choice of Patterns of Outdoor Physical Activity Duration: A Mixed Multinomial Logit Model. Int. J. Environ. Res. Public Health 2021, 18, 8199. [Google Scholar] [CrossRef] [PubMed]
- Lee, C.; Lee, C.; Stewart, O.T.; Carlos, H.A.; Adachi-Mejia, A.; Berke, E.M.; Doescher, M.P. Neighborhood Environments and Utilitarian Walking Among Older vs. Younger Rural Adults. Front. Public Health 2021, 9, 532. [Google Scholar] [CrossRef]
- Ma, Y.; Zou, G.; Shin, J.-H.; Kang, Y.; Gao, S.; Siu, K.W.M.; Zhang, S. Locating Community-Based Comprehensive Service Facilities for Older Adults Using the GIS-NEMA Method in Harbin, China. J. Urban Plan. Dev. 2021, 147, 05021010. [Google Scholar] [CrossRef]
- King, A.C.; Sallis, J.F.; Frank, L.D.; Saelens, B.E.; Cain, K.; Conway, T.L.; Chapman, J.E.; Ahn, D.K.; Kerr, J. Aging in neighborhoods differing in walkability and income: Associations with physical activity and obesity in older adults. Soc. Sci. Med. 2011, 73, 1525–1533. [Google Scholar] [CrossRef] [Green Version]
- Kwan, R.Y.C.; Lee, D.; Lee, P.H.; Tse, M.; Cheung, D.S.K.; Thiamwong, L.; Choi, K.S. Effects of an mHealth Brisk Walking Intervention on Increasing Physical Activity in Older People With Cognitive Frailty: Pilot Randomized Controlled Trial. JMIR mHealth uHealth 2020, 8, e16596. [Google Scholar] [CrossRef]
- Zang, P.; Xue, Q.L.; Lu, Y. A Study on the Adaptability of the Elderly Population in Hong Kong Community. Archit. J. 2017, S2, 51–56. [Google Scholar]
- An, K.Y.; Morielli, A.R.; Kang, D.W.; Friedenreich, C.M.; McKenzie, D.C.; Gelmon, K.; Mackey, J.R.; Reid, R.D.; Courneya, K.S. Effects of exercise dose and type during breast cancer chemotherapy on longer-term patient-reported outcomes and health-related fitness: A randomized controlled trial. Int. J. Cancer 2020, 146, 150–160. [Google Scholar] [CrossRef]
- An, K.-Y. Comparison between walking and moderate-to-vigorous physical activity: Associations with metabolic syndrome components in Korean older adults. Epidemiol. Health 2020, 42, e2020066. [Google Scholar] [CrossRef]
- Amagasa, S.; Inoue, S.; Fukushima, N.; Kikuchi, H.; Nakaya, T.; Hanibuchi, T.; Sallis, J.F.; Owen, N. Associations of neighborhood walkability with intensity- and bout-specific physical activity and sedentary behavior of older adults in Japan. Geriatr. Gerontol. Int. 2019, 19, 861–867. [Google Scholar] [CrossRef] [PubMed]
- Lee, I.; Shiroma, E.J.; Lobelo, F.; Puska, P.; Blair, S.N.; Katzmarzyk, P.T. Effect of physical inactivity on major non-communicable diseases worldwide: An analysis of burden of disease and life expectancy. Lancet 2012, 380, 219–229. [Google Scholar] [CrossRef] [Green Version]
- Manas, A.; del Pozo-Cruz, B.; Rodriguez-Gomez, I.; Losa-Reyna, J.; Rodriguez-Manas, L.; Garcia-Garcia, F.J.; Ara, I. Can Physical Activity Offset the Detrimental Consequences of Sedentary Time on Frailty? A Moderation Analysis in 749 Older Adults Measured With Accelerometers. J. Am. Med. Dir. Assoc. 2019, 20, 634–639. [Google Scholar] [CrossRef]
- Tsunoda, K.; Tsuji, T.; Kitano, N.; Mitsuishi, Y.; Okura, T. Associations of physical activity with neighborhood environments and transportation modes in older Japanese adults. Prev. Med. 2012, 55, 113–118. [Google Scholar] [CrossRef] [Green Version]
- Elshahat, S.; O’Rorke, M.; Adlakha, D. Built environment correlates of physical activity in low- and middle-income countries: A systematic review. PLoS ONE 2020, 15, e0230454. [Google Scholar] [CrossRef]
- Hawkesworth, S.; Silverwood, R.J.; Armstrong, B.; Pliakas, T.; Nanchalal, K.; Jefferis, B.J.; Sartini, C.; Amuzu, A.A.; Wannamethee, S.G.; Ramsay, S.E.; et al. Investigating associations between the built environment and physical activity among older people in 20 UK towns. J. Epidemiol. Community Health 2018, 72, 121–131. [Google Scholar] [CrossRef] [Green Version]
- Zhai, Y.J.; Li, D.Y.; Wu, C.Z.; Wu, H.B. Urban park facility use and intensity of seniors’ physical activity—An examination combining accelerometer and GPS tracking. Landsc. Urban Plan. 2021, 205, 289–328. [Google Scholar] [CrossRef]
- Aoyagi, Y.; Shephard, R.J. Steps per Day the Road to Senior Health? Sports Med. 2009, 39, 423–438. [Google Scholar] [CrossRef]
- Amagasa, S.; Fukushima, N.; Kikuchi, H.; Oka, K.; Chastin, S.; Tudor-Locke, C.; Owen, N.; Inoue, S. Older Adults’ Daily Step Counts and Time in Sedentary Behavior and Different Intensities of Physical Activity. J. Epidemiol. 2021, 31, 350–355. [Google Scholar] [CrossRef]
- Buman, M.P.; Hekler, E.B.; Haskell, W.L.; Pruitt, L.; Conway, T.L.; Cain, K.L.; Sallis, J.F.; Saelens, B.E.; Frank, L.D.; King, A.C. Objective Light-Intensity Physical Activity Associations with Rated Health in Older Adults. Am. J. Epidemiol. 2010, 172, 1155–1165. [Google Scholar] [CrossRef] [Green Version]
- Sardinha, L.B.; Santos, D.A.; Silva, A.M.; Baptista, F.; Owen, N. Breaking-up Sedentary Time Is Associated With Physical Function in Older Adults. J. Gerontol. 2015, 70, 119–124. [Google Scholar] [CrossRef] [PubMed] [Green Version]
- Tse, A.C.Y.; Wong, T.W.L.; Lee, P.H. Effect of Low-intensity Exercise on Physical and Cognitive Health in Older Adults: A Systematic Review. Sports Med. Open 2015, 1, 37. [Google Scholar] [CrossRef] [PubMed] [Green Version]
- Forsyth, A.; Oakes, J.M.; Lee, B.; Schmitz, K.H. The built environment, walking, and physical activity: Is the environment more important to some people than others? Transp. Res. Part D Transp. Environ. 2009, 14, 42–49. [Google Scholar] [CrossRef]
- Sallis, J.; Cerin, E.; Conway, T.; Adams, M.; Frank, L.; Pratt, M.; Salvo, D.; Schipperijn, J.; Smith, G.; Cain, K. Physical activity in relation to urban environments in 14 cities worldwide: A cross-sectional study. Lancet 2016, 6736, 348. [Google Scholar] [CrossRef] [Green Version]
- Rosso, A.L.; Harding, A.B.; Clarke, P.J.; Studenski, S.A.; Rosano, C. Associations of Neighborhood Walkability and Walking Behaviors by Cognitive Trajectory in Older Adults. Gerontology 2021, 61, 1053–1061. [Google Scholar] [CrossRef] [PubMed]
- Annear, M.; Keeling, S.; Wilkinson, T.; Cushman, G.; Gidlow, B.; Hopkins, H. Environmental influences on healthy and active ageing: A systematic review. Ageing Soc. 2014, 34, 590–622. [Google Scholar] [CrossRef]
- Akinci, Z.S.; Delclos-Alio, X.; Vich, G.; Miralles-Guasch, C. Neighborhood Urban Design and Outdoor Later Life: An Objective Assessment of Out-of-Home Time and Physical Activity Among Older Adults in Barcelona. J. Aging Phys. Act. 2021, 29, 781–792. [Google Scholar] [CrossRef]
- Brownson, R.C.; Hoehner, C.M.; Day, K.; Forsyth, A.; Sallis, J.F. Measuring the Built Environment for Physical Activity: State of the Science. Am. J. Prev. Med. 2009, 36, 99–123. [Google Scholar] [CrossRef] [PubMed] [Green Version]
- Carlson, J.A.; Sallis, J.F.; Conway, T.L.; Saelens, B.E.; Frank, L.D.; Kerr, J.; Cain, K.L.; King, A.C. Interactions between psychosocial and built environment factors in explaining older adults’ physical activity. Prev. Med. 2012, 54, 68–73. [Google Scholar] [CrossRef] [Green Version]
- Berke, E.M.; Koepsell, T.D.; Moudon, A.V.; Hoskins, R.E.; Larson, E.B. Association of the Built Environment with Physical Activity and Obesity in Older Persons. Am. J. Public Health 2007, 97, 486–492. [Google Scholar] [CrossRef] [PubMed]
- Fonseca, F.; Ribeiro, P.J.G.; Conticelli, E.; Jabbari, M.; Papageorgiou, G.; Tondelli, S.; Ramos, R.A.R. Built environment attributes and their influence on walkability. Int. J. Sustain. Transp. 2021, 1–40. [Google Scholar] [CrossRef]
- Yen, I.H.; Michael, Y.L.; Perdue, L. Neighborhood Environment in Studies of Health of Older Adults A Systematic Review. Am. J. Prev. Med. 2009, 37, 455–463. [Google Scholar] [CrossRef] [Green Version]
- Cheng, L.; Chen, X.; Yang, S.; Cao, Z.; Vos, J.D.; Witlox, F. Active travel for active ageing in China: The role of built environment. J. Transp. Geogr. 2019, 76, 142–152. [Google Scholar] [CrossRef]
- Haselwandter, E.M.; Corcoran, M.P.; Folta, S.C.; Hyatt, R.; Fe Nton, M.; Nelson, M.E. The Built Environment, Physical Activity and Aging in the United States: A State of the Science Review. J. Aging Phys. Act. 2015, 23, 867–877. [Google Scholar] [CrossRef]
- Shendell, D.; Nowakowski, A. Senior safety zones: Community built environment factors around senior wellness centers. J. Public Health Policy 2011, 31, 115–118. [Google Scholar] [CrossRef] [PubMed]
- Moran, M.; Cauwenberg, J.V.; Hercky-Linnewiel, R.; Cerin, E.; Deforche, B.; Plaut, P. Understanding the relationships between the physical environment and physical activity in older adults: A systematic review of qualitative studies. Int. J. Behav. Nutr. Phys. Act. 2014, 11, 79. [Google Scholar] [CrossRef] [PubMed] [Green Version]
- Veerle, V.H.; Jelle, V.C.; Ilse, D.B.; Benedicte, D.; Nico, V.; Delfien, V.D. Interactions between neighborhood social environment and walkability to explain Belgian older adults’ physical activity and sedentary time. Int. J. Environ. Res. Public Health 2016, 13, 569. [Google Scholar]
- Zandieh, R.; Johannes, F.; Martinez, J.; Jones, J.; Martin, V. Do Inequalities in Neighborhood Walkability Drive Disparities in Older Adults’ Outdoor Walking. Int. J. Environ. Res. Public Health 2017, 14, 740. [Google Scholar] [CrossRef] [PubMed] [Green Version]
- Cerin, E.; Lee, K.Y.; Barnett, A.; Sit, C.; Cheung, M.C.; Chan, W.M. Objectively-measured neighborhood environments and leisure-time physical activity in Chinese urban elders. Prev. Med. 2013, 56, 86–89. [Google Scholar] [CrossRef]
- Cauwenberg, J.V.; Clarys, P.; Bourdeaudhuij, I.D.; Holle, V.V.; Deforche, B. Older adults’ transportation walking: A cross-sectional study on the cumulative influence of physical environmental factors. Int. J. Health Geogr. 2013, 12, 37. [Google Scholar] [CrossRef] [Green Version]
- Sugiyama, T.; Thompson, C.W. Associations between characteristics of neighbourhood open space and older people’s walking. Urban For. Urban Green. 2008, 7, 41–51. [Google Scholar] [CrossRef]
- Distefano, N.; Pulvirenti, G.; Leonardi, S. Neighbourhood walkability: Elderly’s priorities. Res. Transp. Bus. Manag. 2021. [Google Scholar] [CrossRef]
- Cauwenberg, J.V.; Holle, V.V.; Simons, D.; Deridder, R.; Clarys, P.; Goubert, L.; Nasar, J.; Salmon, J.; Bourdeaudhuij, I.D.; Deforche, B. Environmental factors influencing older adults’ walking for transportation: A study using walk-along interviews. Int. J. Behav. Nutr. Phys. Act. 2012, 9, 85. [Google Scholar] [CrossRef] [PubMed] [Green Version]
- Razieh, Z.; Javier, M.; Johannes, F.; Phil, J.; Martin, V.M. Older Adults’ Outdoor Walking: Inequalities in Neighbourhood Safety, Pedestrian Infrastructure and Aesthetics. Int. J. Environ. Res. Public Health 2016, 13, 1179. [Google Scholar]
- Hirsch, J.A.; Winters, M.; Clarke, P.; Mckay, H. Generating GPS activity spaces that shed light upon the mobility habits of older adults: A descriptive analysis. Int. J. Health Geogr. 2014, 13, 51. [Google Scholar] [CrossRef] [Green Version]
- Herbolsheimer, F.; Mahmood, A.; Michael, Y.L.; Chaudhury, H. Everyday Walking Among Older Adults and the Neighborhood Built Environment: A Comparison Between Two Cities in North America. Front. Public Health 2020, 8, 929. [Google Scholar] [CrossRef]
- Cerin, E.; Nathan, A.; Cauwenberg, J.V.; Ba Rnett, D.W.; Ba Rnett, A. The neighbourhood physical environment and active travel in older adults: A systematic review and meta-analysis. Int. J. Behav. Nutr. Phys. Act. 2017, 14, 15. [Google Scholar] [CrossRef] [Green Version]
- Liu, Z.; Kemperman, A.; Timmermans, H. Correlates of older adults’ walking trip duration. J. Transp. Health 2020, 18, 100889. [Google Scholar] [CrossRef]
- Cheng, L.; Vos, J.D.; Zhao, P.; Yang, M.; Witlox, F. Examining non-linear built environment effects on elderly’s walking: A random forest approach. Transp. Res. Part D Transp. Environ. 2020, 88, 102552. [Google Scholar] [CrossRef]
- Barnett, D.W.; Barnett, A.; Nathan, A.; Van Cauwenberg, J.; Cerin, E. Built environmental correlates of older adults’ total physical activity and walking: A systematic review and meta-analysis. Int. J. Behav. Nutr. Phys. Act. 2017, 14, 1–24. [Google Scholar] [CrossRef] [PubMed] [Green Version]
- Lindgren, M.; Brjesson, M.; Ekblom, R.; Bergstrm, G.; Lappas, G.; Rosengren, A. Physical activity pattern, cardiorespiratory fitness, and socioeconomic status in the SCAPIS pilot trial—A cross-sectional study. Prev. Med. Rep. 2016, 4, 44–49. [Google Scholar] [CrossRef] [PubMed] [Green Version]
- Adkins, A.; Makarewicz, C.; Scanze, M.; Ingram, M.; Luhr, G. Contextualizing Walkability: Do Relationships Between Built Environments and Walking Vary by Socioeconomic Context? J. Am. Plan. Assoc. 2017, 83, 296–314. [Google Scholar] [CrossRef] [PubMed] [Green Version]
- Zhang, Z.; Ouyang, G. Changsha Metro: How to serve the elderly? Chin. Overseas Archit. 2017, 10, 38–40. [Google Scholar]
- Heath, G.W.; Brownson, R.C.; Kruger, J.; Miles, R.; Powell, K.E.; Ramsey, L.T. The Effectiveness of Urban Design and Land Use and Transport Policies and Practices to Increase Physical Activity: A Systematic Review. J. Phys. Act. Health 2006, 3 (Suppl. S1), S55–S76. [Google Scholar] [CrossRef] [PubMed]
- Peng, Z.; Xue, Q.; Yi, L.; Tu, K. Neighbourhood adaptability for Hong Kong’s ageing population. Urban Des. Int. 2019, 24, 187–205. [Google Scholar]
- Cheng, L.; Vos, J.D.; Shi, K.; Yang, M.; Witlox, F. Do residential location effects on travel behavior differ between the elderly and younger adults? Transp. Res. Part D Transp. Environ. 2019, 73, 367–380. [Google Scholar] [CrossRef]
- Cda, B.; Yl, A.; Chao, L.C. Exploring the influence of built environment on tour-based commuter mode choice: A cross-classified multilevel modeling approach. Transp. Res. Part D Transp. Environ. 2014, 32, 230–238. [Google Scholar]
- Fox, E.H.; Chapman, J.E.; Moland, A.M.; Alfonsin, N.E.; Frank, L.D.; Sallis, J.F.; Conway, T.L.; Cain, K.L.; Geremia, C.; Cerin, E.; et al. International evaluation of the Microscale Audit of Pedestrian Streetscapes (MAPS) Global instrument: Comparative assessment between local and remote online observers. Int. J. Behav. Nutr. Phys. Act. 2021, 18, 84. [Google Scholar] [CrossRef]


| Low-Density | Medium-Density | High-Density | |
|---|---|---|---|
| Low-income | Li Cheng Central District Huadong Town | Chia Cao He Bin North Road | Dong Long Osmanthus Valley |
| High-income | Han Xi Agile | Chang Xing Tianhe Park | Hang Kou Guang Gang New Town |
| Low SES | High SES | |||||
|---|---|---|---|---|---|---|
| Percentage | Mean | Standard Deviation | Percentage | Mean | Standard Deviation | |
| Total | 50.25 | 49.75 | ||||
| Age | ||||||
| 65–74. | 88.70 | 84.80 | ||||
| 75–84. | 10.30 | 13.10 | ||||
| 85+ | 1.00 | 2.00 | ||||
| Education level | ||||||
| Medium and above | 10.30 | 7.10 | ||||
| Elementary education | 83.70 | 74.70 | ||||
| None | 6.00 | 18.20 | ||||
| Self-assessed health | ||||||
| Good | 19.00 | 22.20 | ||||
| General | 78.70 | 72.10 | ||||
| Bad | 2.30 | 5.70 | ||||
| Population density | 1.17 | 1.31 | 1.30 | 0.66 | ||
| Sitting | 330.02 | 274.33 | 307.54 | 240.97 | ||
| Walking | 387.44 | 628.29 | 461.12 | 624.42 | ||
| MPA | 522.29 | 907.95 | 712.18 | 1794.85 | ||
| VPA | 104.20 | 328.83 | 188.35 | 807.98 | ||
| Land use diversity | 0.43 | 0.21 | 0.48 | 0.10 | ||
| Street connectivity | 1.77 | 0.19 | 1.71 | 0.18 | ||
| Intersection density | 92.72 | 59.73 | 120.09 | 38.16 | ||
| Proximity centrality 300 m | 0.48 | 0.08 | 0.46 | 0.15 | ||
| Proximity centrality 500 m | 0.54 | 0.05 | 0.53 | 0.04 | ||
| Proximity centrality 800 m | 0.51 | 0.05 | 0.51 | 0.07 | ||
| Proximity centrality 1000 m | 0.51 | 0.07 | 0.51 | 0.06 | ||
| Intermediate centrality 300 m | 0.14 | 0.04 | 0.13 | 0.03 | ||
| Intermediate centrality 500 m | 0.13 | 0.02 | 0.13 | 0.04 | ||
| Intermediate centrality 800 m | 0.13 | 0.04 | 0.12 | 0.05 | ||
| Intermediate centrality 1000 m | 0.14 | 0.04 | 0.12 | 0.03 | ||
| Commercial POIs | 120.62 | 105.69 | 154.71 | 104.07 | ||
| Recreational POIs | 14.72 | 11.75 | 23.12 | 14.39 | ||
| Medical POIs | 19.62 | 18.21 | 19.58 | 11.06 | ||
| Education POIs | 27.06 | 24.05 | 45.98 | 43.88 | ||
| Public Administration POIs | 43.42 | 42.04 | 35.84 | 22.42 | ||
| Number of bus stops | 18.60 | 15.81 | 21.38 | 10.95 | ||
| Bus station distance | 222.52 | 193.45 | 195.75 | 199.58 | ||
| Number of subway stations | 4.53 | 8.01 | 6.88 | 3.30 | ||
| Distance to subway stations | 424.88 | 493.27 | 784.61 | 409.17 | ||
| Number of overpasses | 1.17 | 1.78 | 1.51 | 1.71 | ||
| Number of broken roads | 93.51 | 37.44 | 113.65 | 46.72 | ||
| 300 m Buffer Zone | 500 m Buffer Zone | 800 m Buffer Zone | 1000 m Buffer Zone | ||||||||||
|---|---|---|---|---|---|---|---|---|---|---|---|---|---|
| sitting | walking | MPA | sitting | walking | MPA | sitting | walking | MPA | sitting | walking | MPA | ||
| Self-report health | R | 0.088 | −0.270 ** | 0.117 | 0.088 | −0.270 ** | 0.117 | 0.088 | −0.270 ** | 0.117 | 0.088 | −0.270 ** | 0.117 |
| p-value | 0.129 | 0.000 | 0.080 | 0.129 | 0.000 | 0.080 | 0.129 | 0.000 | 0.080 | 0.129 | 0.000 | 0.080 | |
| Street connectivity | R | 0.049 | 0.020 | 0.149 * | 0.024 | − 0.172 * | 0.095 | 0.011 | −137 * | 0.098 | 0.004 | 0.123 | 0.081 |
| p-value | 0.397 | 0.766 | 0.025 | 0.674 | 0.011 | 0.153 | 0.854 | 0.044 | 0.142 | 0.949 | 0.072 | 0.225 | |
| Intersection density | R | 0.084 | 0.020 | 0.062 | 0.099 | 0.003 | 0.002 | 0.132 * | 0.039 | 0.014 | 0.137 * | 0.052 | 0.015 |
| p-value | 0.148 | 0.765 | 0.349 | 0.087 | 0.970 | 0.971 | 0.023 | 0.563 | 0.829 | 0.018 | 0.448 | 0.823 | |
| Proximity centrality 500 m | R | 0.059 | 0.079 | 0.141 * | 0.059 | 0.079 | 0.141 * | 0.061 | 0.079 | 0.138 * | |||
| p-value | 0.310 | 0.247 | 0.034 | 0.310 | 0.247 | 0.034 | 0.293 | 0.249 | 0.038 | ||||
| Proximity centrality 800 m | R | −0.135 * | 0.004 | 0.067 | −0.138 * | 0.003 | 0.063 | ||||||
| p-value | 0.020 | 0.952 | 0.312 | 0.017 | 0.970 | 0.345 | |||||||
| Proximity centrality 1000 m | R | −0.134 * | 0.041 | 0.077 | |||||||||
| p-value | 0.021 | 0.547 | 0.249 | ||||||||||
| Intermediate centrality 500 m | R | 0.057 | 0.161 * | 0.133 * | 0.057 | 0.161 * | 0.133 * | 0.057 | 0.163 * | 0.131 * | |||
| p-value | 0.328 | 0.018 | 0.045 | 0.328 | 0.018 | 0.045 | 0.323 | 0.016 | 0.049 | ||||
| Intermediate centrality 800 m | R | 0.061 | 0.209 ** | 0.111 | 0.060 | 0.209 ** | 0.112 | ||||||
| p-value | 0.293 | 0.002 | 0.094 | 0.299 | 0.002 | 0.093 | |||||||
| Intermediate centrality 1000 m | R | 0.049 | 0.172 * | 0.094 | |||||||||
| p-value | 0.395 | 0.011 | 0.159 | ||||||||||
| Commercial POIs | R | 0.156 * | 0.089 | 0.088 | 0.172 ** | 0.082 | 0.043 | 0.163 ** | 0.079 | 0.071 | 0.160 ** | 0.084 | 0.089 |
| p-value | 0.014 | 0.226 | 0.224 | 0.003 | 0.227 | 0.521 | 0.005 | 0.247 | 0.288 | 0.006 | 0.218 | 0.184 | |
| Recreational POIs | R | 0.133 * | 0.106 | 0.072 | 0.146 * | 0.128 | 0.140 | 0.140 * | 0.125 | −160 * | 0.137 * | 0.066 | 0.103 |
| p-value | 0.037 | 0.150 | 0.315 | 0.021 | 0.082 | 0.051 | 0.027 | 0.090 | 0.026 | 0.018 | 0.335 | 0.122 | |
| Medical POIs | R | 0.116 | 0.067 | 0.005 | 0.123 | 0.057 | 0.007 | 0.144 * | 0.074 | 0.067 | 0.167 ** | 0.071 | 0.039 |
| p-value | 0.068 | 0.364 | 0.940 | 0.053 | 0.436 | 0.918 | 0.023 | 0.318 | 0.356 | 0.004 | 0.296 | 0.555 | |
| Education POIs | R | 0.152 ** | 0.082 | 0.019 | 0.152.* | 0.069 | 0.002 | 0.163 ** | 0.080 | 0.059 | 0.164 ** | 0.078 | 0.064 |
| p-value | 0.008 | 0.230 | 0.772 | 0.008 | 0.313 | 0.980 | 0.005 | 0.240 | 0.379 | 0.004 | 0.256 | 0.337 | |
| Public administration POIs | R | 0.144 * | 0.082 | 0.046 | 0.160 ** | 0.054 | 0.014 | 0.157 ** | 0.052 | 0.035 | 0.165 ** | 0.070 | 0.050 |
| p-value | 0.023 | 0.268 | 0.521 | 0.006 | 0.427 | 0.836 | 0.007 | 0.445 | 0.599 | 0.004 | 0.307 | 0.458 | |
| Number of bus stops | R | 0.167 * | 0.132 | 0.021 | 0.154 * | 0.016 | 0.033 | 0.160 * | 0.010 | 0.042 | 0.163 ** | 0.024 | 0.046 |
| p-value | 0.018 | 0.111 | 0.793 | 0.015 | 0.829 | 0.657 | 0.012 | 0.892 | 0.570 | 0.010 | 0.752 | 0.527 | |
| Number of subway stations | R | .c | .c | .c | .c | .c | .c | 0.166 | −0.250 * | −0.281 * | 0.092 | 0.121 | −0.217 * |
| p-value | 0.094 | 0.036 | 0.013 | 0.260 | 0.211 | 0.020 | |||||||
| Distance to subway stations | R | .c | .c | .c | .c | .c | .c | −0.222 * | 0.153 | 0.333 ** | 0.027 | 0.138 | 0.042 |
| p-value | 0.025 | 0.203 | 0.003 | 0.744 | 0.154 | 0.654 | |||||||
| Number of overpasses | R | .c | .c | .c | 0.050 | 0.103 | −0.211 * | 0.043 | 0.113 | −0.201 * | 0.041 | 0.115 | −0.200 * |
| p-value | 0.546 | 0.280 | 0.024 | 0.601 | 0.236 | 0.032 | 0.617 | 0.231 | 0.034 | ||||
| 300 m Buffer Zone | 500 m Buffer Zone | 800 m Buffer Zone | 1000 m Buffer Zone | ||||||
|---|---|---|---|---|---|---|---|---|---|
| sitting | walking | sitting | walking | sitting | walking | sitting | walking | ||
| Self-report health | R | 0.028 | −0.160 * | 0.028 | −0.160 * | 0.028 | −0.160 * | 0.028 | −0.160 * |
| p-value | 0.637 | 0.015 | 0.637 | 0.015 | 0.637 | 0.015 | 0.637 | 0.015 | |
| Proximity centrality 500 m | R | 0.127 * | 0.001 | 0.127 * | 0.001 | 0.127 * | 0.000 | ||
| p-value | 0.029 | 0.990 | 0.029 | 0.990 | 0.030 | 0.997 | |||
| Number of subway stations | R | 0.200 * | 0.127 | 0.200 * | 0.127 | 0.002 | 0.108 | 0.029 | 0.075 |
| p-value | 0.046 | 0.260 | 0.046 | 0.260 | 0.970 | 0.138 | 0.616 | 0.254 | |
| Distance to subway stations | R | −0.200 * | 0.127 | −0.200 * | 0.127 | 0.030 | 0.038 | 0.039 | 0.055 |
| p-value | 0.046 | 0.260 | 0.046 | 0.260 | 0.637 | 0.606 | 0.505 | 0.405 | |
| Number of overpasses | R | −0.200 * | 0.127 | 0.134 | 0.083 | 0.139 | 0.052 | −0.139 * | 0.061 |
| p-value | 0.046 | 0.260 | 0.058 | 0.297 | 0.050 | 0.513 | 0.050 | 0.445 | |
| In a 500 m buffer zone at low socioeconomic level | ||||||||
| Sitting | Walking | MPA | VPA | |||||
| Beta (95% CI) | p-value | Beta (95% CI) | p-value | Beta (95% CI) | p-value | Beta (95% CI) | p-value | |
| Age | 0.105 | 0.411 | 0.084 | 0.656 | 0.704 | 0.034 | ||
| Education level | 0.365 | 0.009 | 0.009 | 0.964 | 0.245 | 0.411 | ||
| Self-report health | 0.282 | 0.041 | 0.306 | 0.095 | 0.120 | 0.694 | ||
| In an 800 m buffer zone at low socioeconomic level | ||||||||
| Age | 0.542 | 0.030 | ||||||
| Education level | 0.417 | 0.000 | 0.179 | 0.112 | 1.327 | 0.207 | ||
| Street connectivity | 0.283 | 0.019 * | 0.238 | 0.812 | ||||
| Proximity centrality 800 m | 0.166 | 0.074 | 0.414 | 0.680 | 0.347 | 0.002 ** | 1.130 | 0.279 |
| In a 1000 m buffer zone at low socioeconomic level | ||||||||
| Age | 0.158 | 0.148 | 0.542 | 0.030 | ||||
| Education level | 0.417 | 0.000 | 0.192 | 0.087 | ||||
| Intersection density | 1.018 | 0.311 | 0.285 | 0.018 * | 0.034 | 0.805 | 0.266 | 0.279 |
| Proximity centrality 800 m | 0.166 | 0.074 | 0.347 | 0.002 ** | ||||
| In a 300 m buffer zone at high socioeconomic level | ||||||||
| Sitting | Walking | MPA | VPA | |||||
| Beta (95% CI) | p-value | Beta (95% CI) | p-value | Beta (95% CI) | p-value | Beta (95% CI) | p-value | |
| Age | 0.201 | 0.075 * | ||||||
| Self-report health | 0.128 | 0.211 | 0.381 | 0.107 | ||||
| Recreational POIs | 0.200 | 0.046 * | 0.079 | 0.499 | 0.040 | 0.869 | ||
| In a 500 m buffer zone at high socioeconomic level | ||||||||
| Age | 0.122 | 0.230 | 0.201 | 0.075 * | ||||
| Self-report health | 0.049 | 0.626 | 0.381 | 0.107 | ||||
| Street connectivity | 0.209 | 0.037 * | 0.092 | 0.424 | 0.040 | 0.869 | ||
| In an 800 m buffer zone under high socioeconomic level | ||||||||
| Education level | 0.319 | 0.095 | 0.237 | 0.010 * | ||||
| Proximity centrality 800 m | 0.177 | 0.034 * | ||||||
| In a 1000 m buffer zone under high socioeconomic level | ||||||||
| Population density | 0.153 | 0.053 | ||||||
| Self-report health | 0.068 | 0.384 | 0.270 | 0.141 | ||||
| Distance to bus station | 0.059 | 0.536 | 0.025 | 0.755 | 0.124 | 0.114 | 0.063 | 0.733 |
| Number of guillotines | 0.141 | 0.046 * | 0.068 | 0.478 | 0.014 | 0.892 | ||
Publisher’s Note: MDPI stays neutral with regard to jurisdictional claims in published maps and institutional affiliations. |
© 2022 by the authors. Licensee MDPI, Basel, Switzerland. This article is an open access article distributed under the terms and conditions of the Creative Commons Attribution (CC BY) license (https://creativecommons.org/licenses/by/4.0/).
Share and Cite
Zang, P.; Xian, F.; Qiu, H.; Ma, S.; Guo, H.; Wang, M.; Yang, L. Differences in the Correlation between the Built Environment and Walking, Moderate, and Vigorous Physical Activity among the Elderly in Low- and High-Income Areas. Int. J. Environ. Res. Public Health 2022, 19, 1894. https://doi.org/10.3390/ijerph19031894
Zang P, Xian F, Qiu H, Ma S, Guo H, Wang M, Yang L. Differences in the Correlation between the Built Environment and Walking, Moderate, and Vigorous Physical Activity among the Elderly in Low- and High-Income Areas. International Journal of Environmental Research and Public Health. 2022; 19(3):1894. https://doi.org/10.3390/ijerph19031894
Chicago/Turabian StyleZang, Peng, Fei Xian, Hualong Qiu, Shifa Ma, Hongxu Guo, Mengrui Wang, and Linchuan Yang. 2022. "Differences in the Correlation between the Built Environment and Walking, Moderate, and Vigorous Physical Activity among the Elderly in Low- and High-Income Areas" International Journal of Environmental Research and Public Health 19, no. 3: 1894. https://doi.org/10.3390/ijerph19031894