
The Effects of Non-Pharmaceutical Interventions on COVID-19 Epidemic Growth Rate during Pre- and Post-Vaccination Period in Asian Countries


Abstract
:1. Introduction
2. Materials and Methods
2.1. Study Design
2.2. Variables
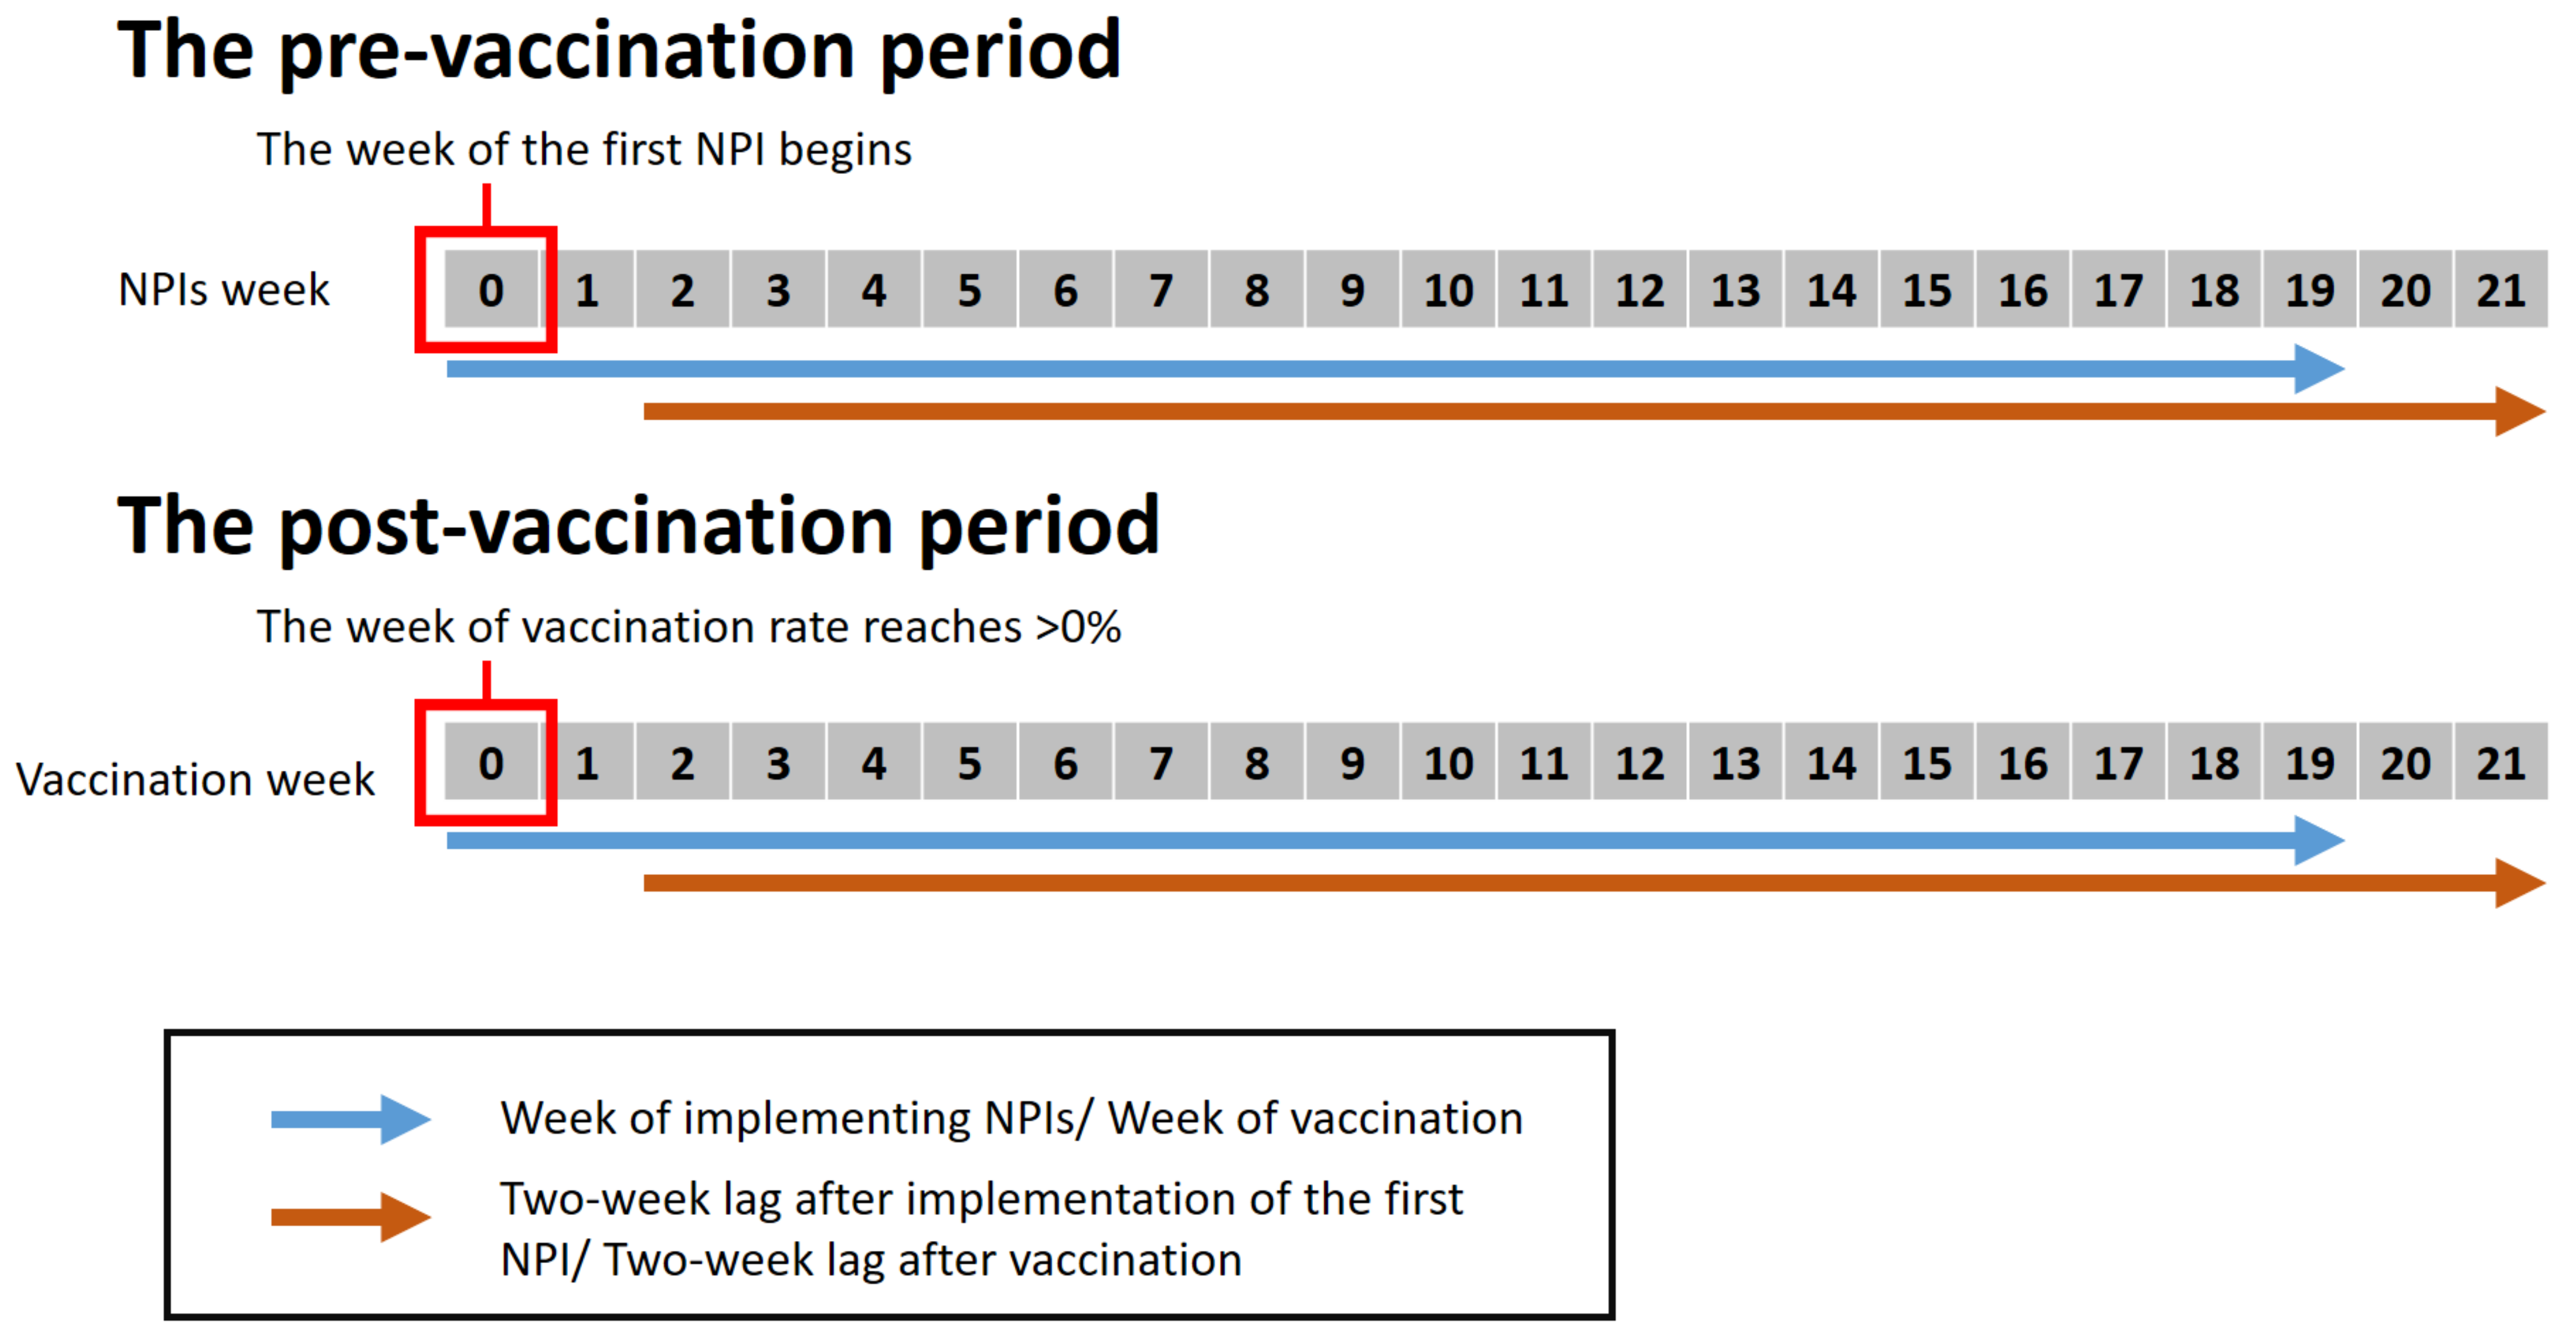
2.3. Study Periods
2.3.1. The Pre-Vaccination Period
2.3.2. Post-Vaccination Period
2.4. Statistical Analysis
3. Results
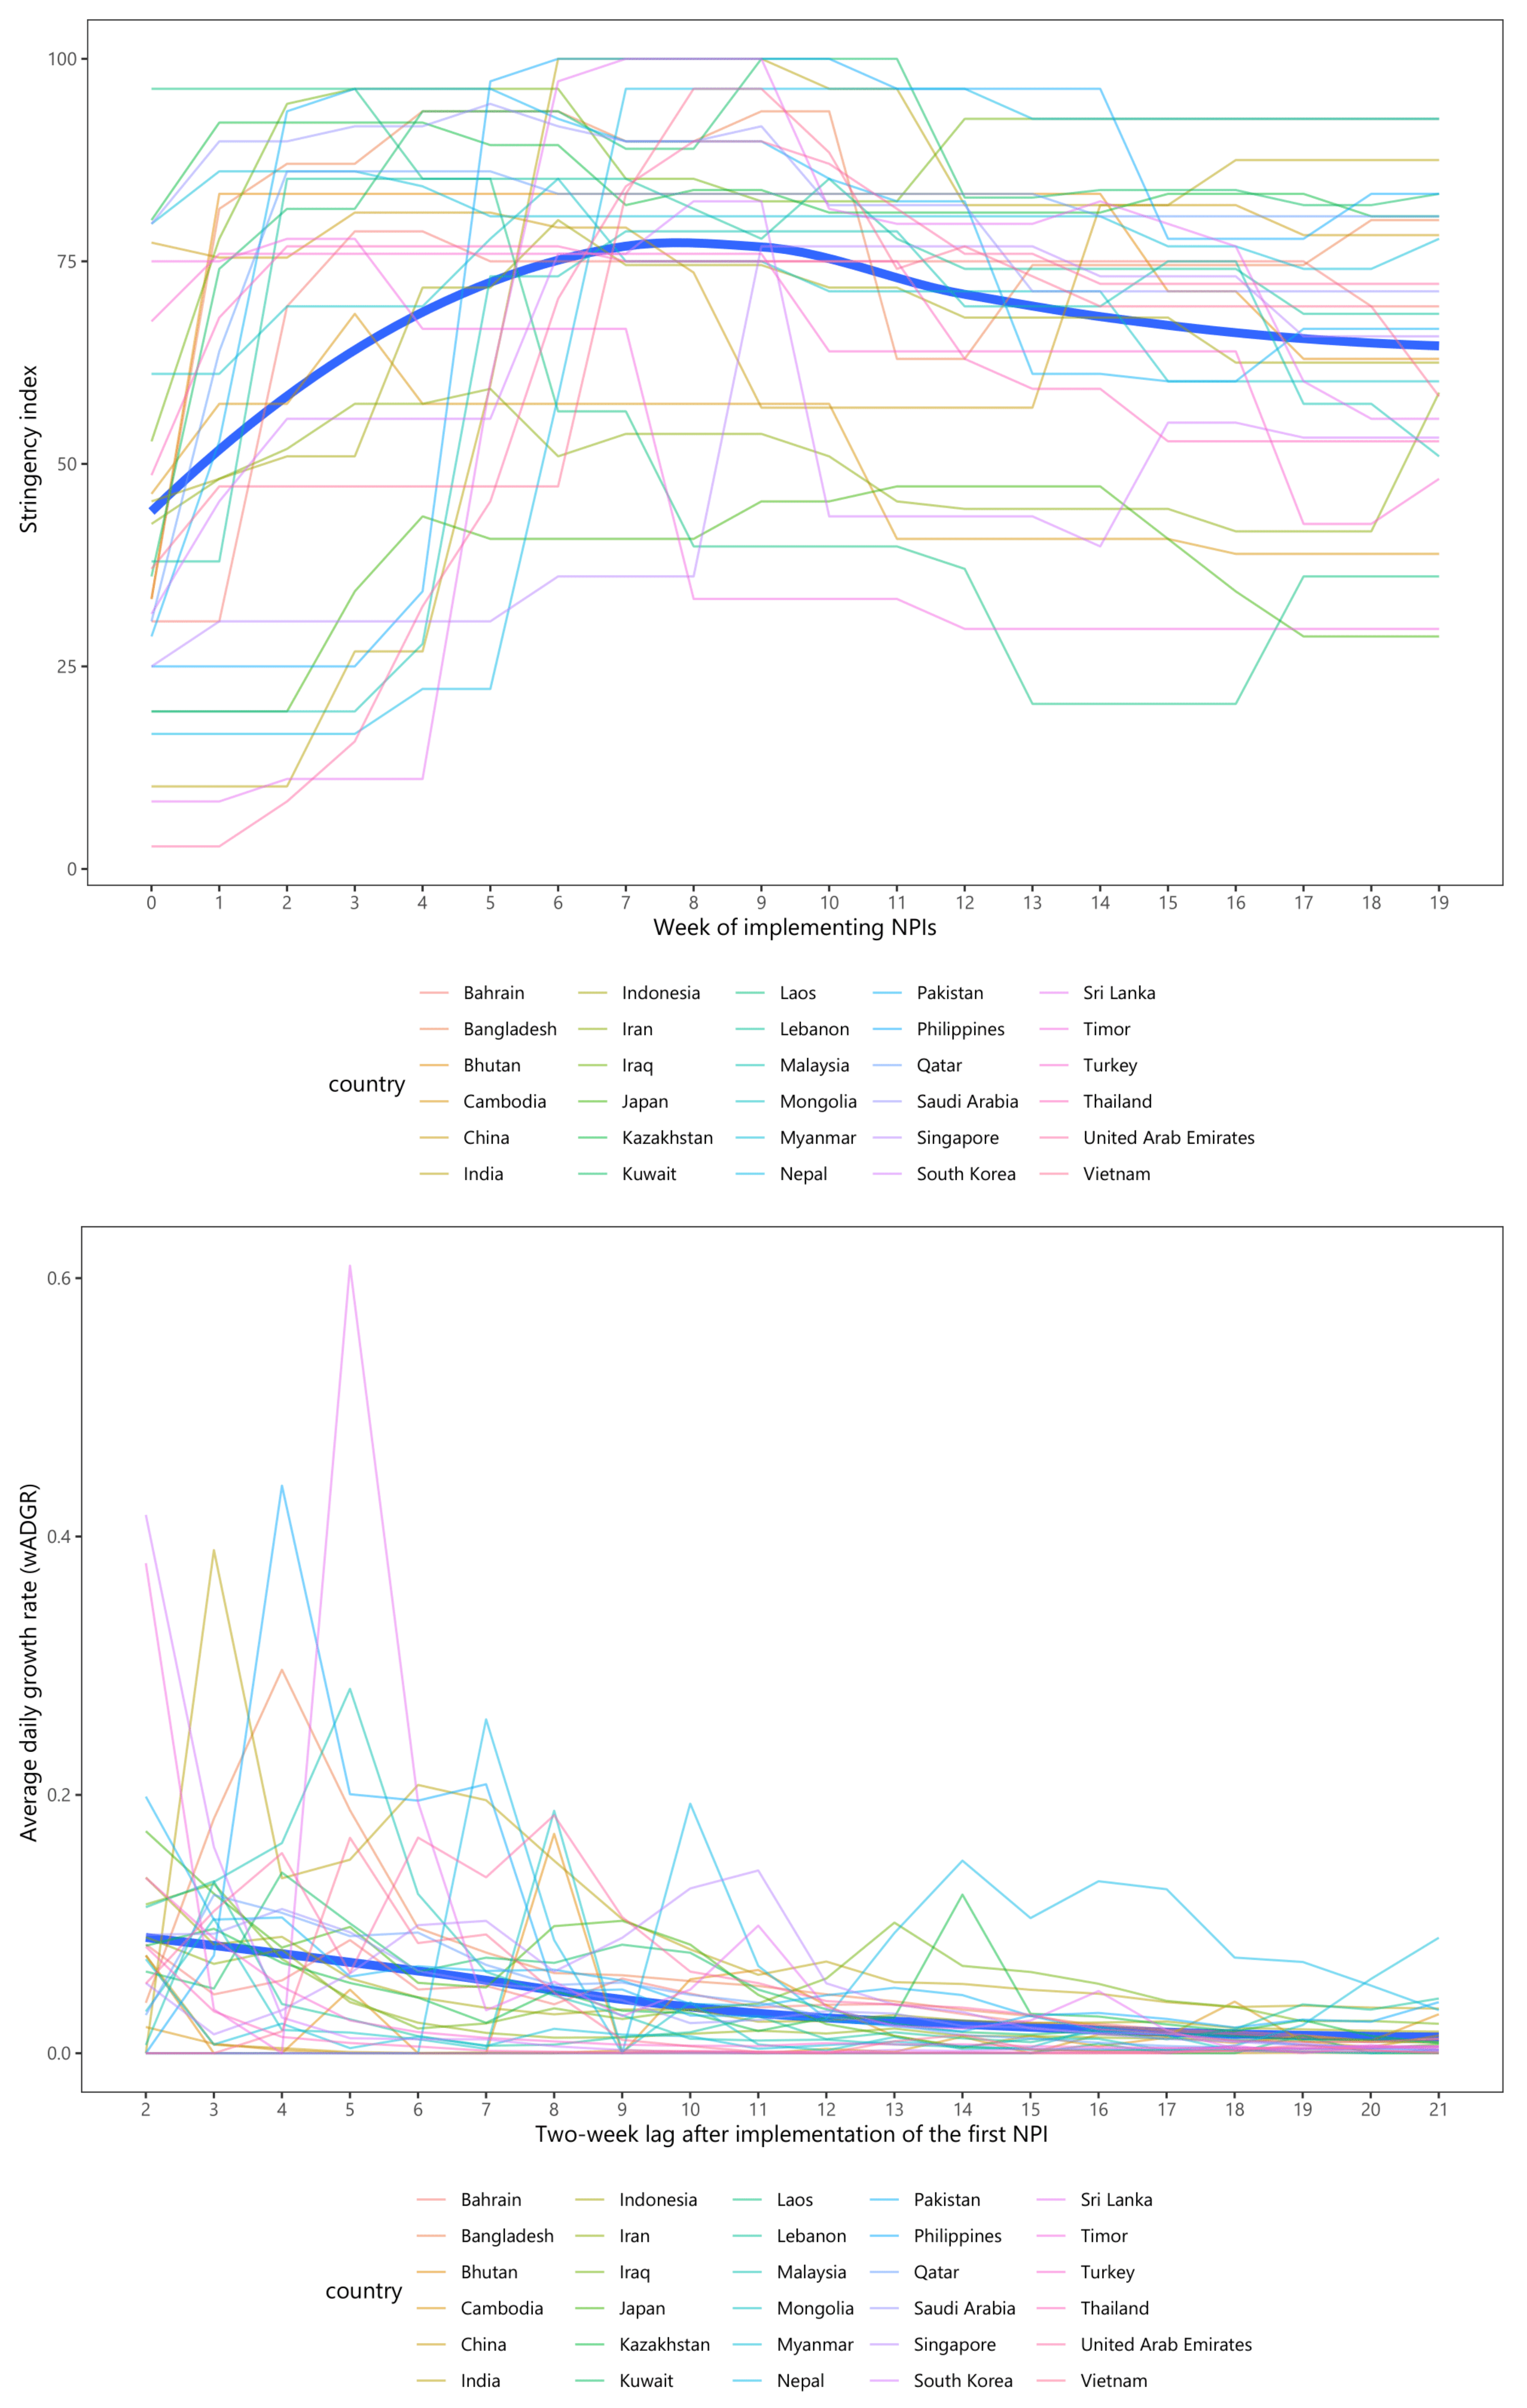
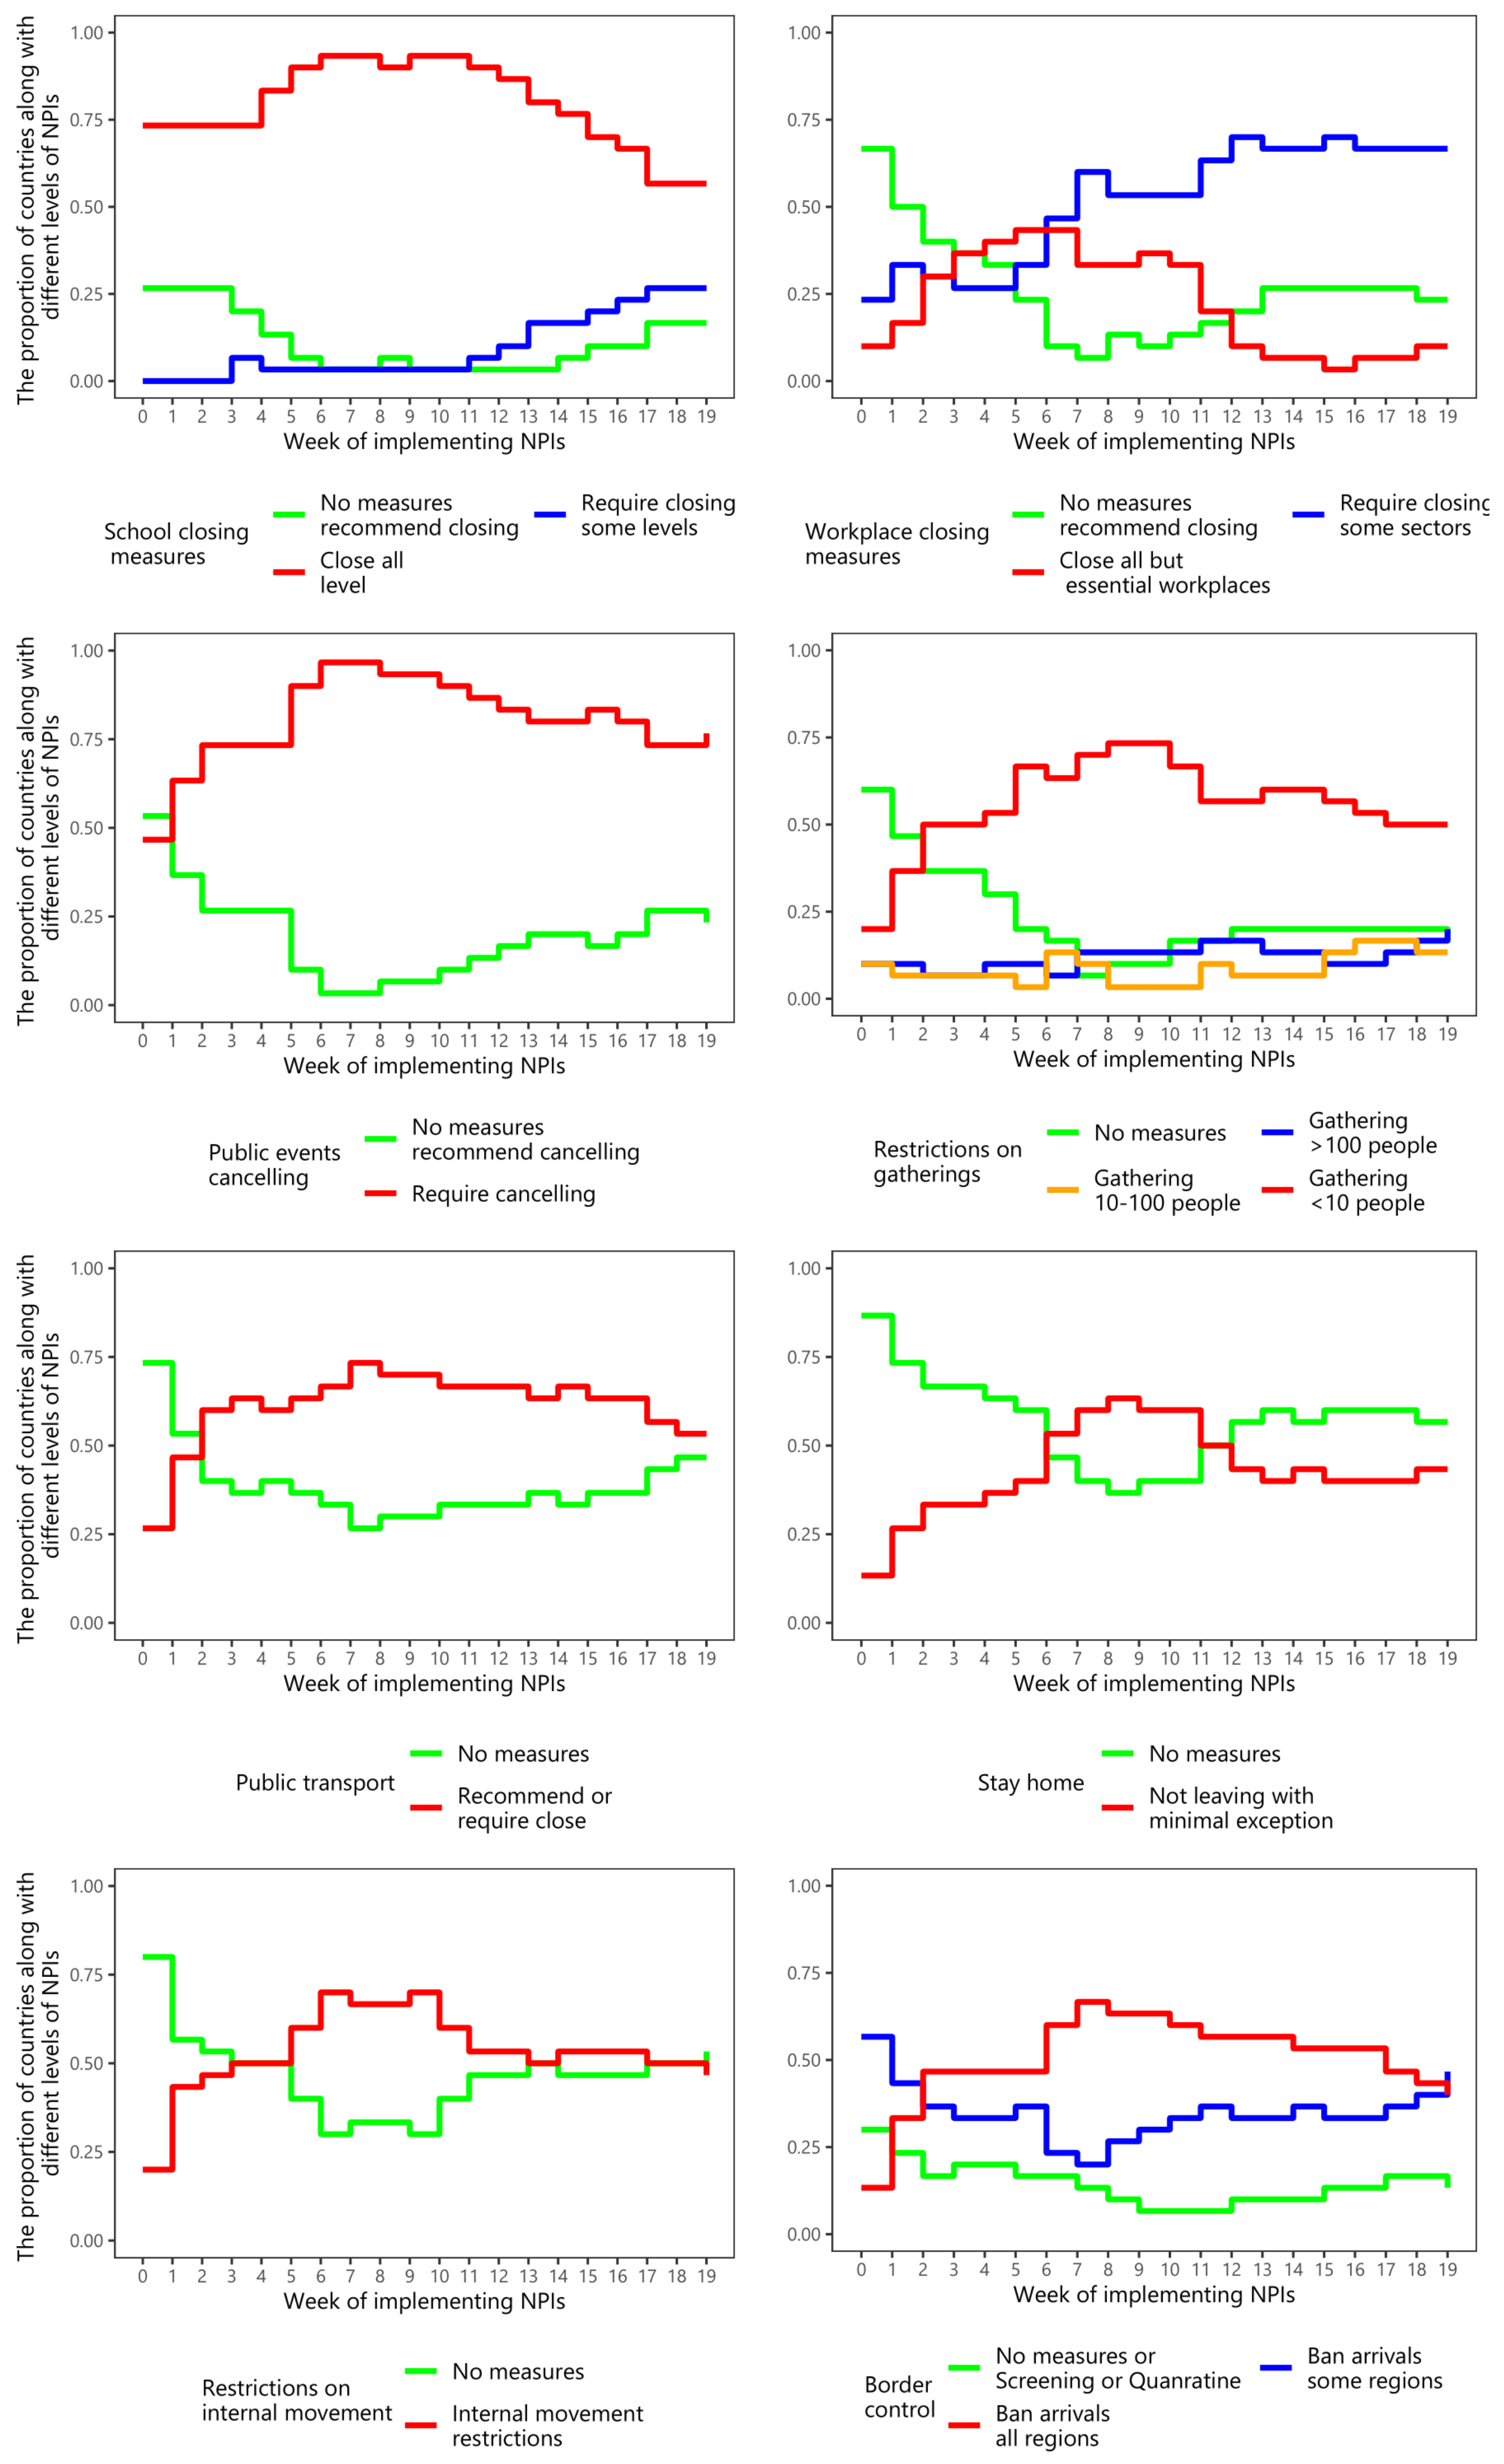
3.1. The Pre-Vaccination Period
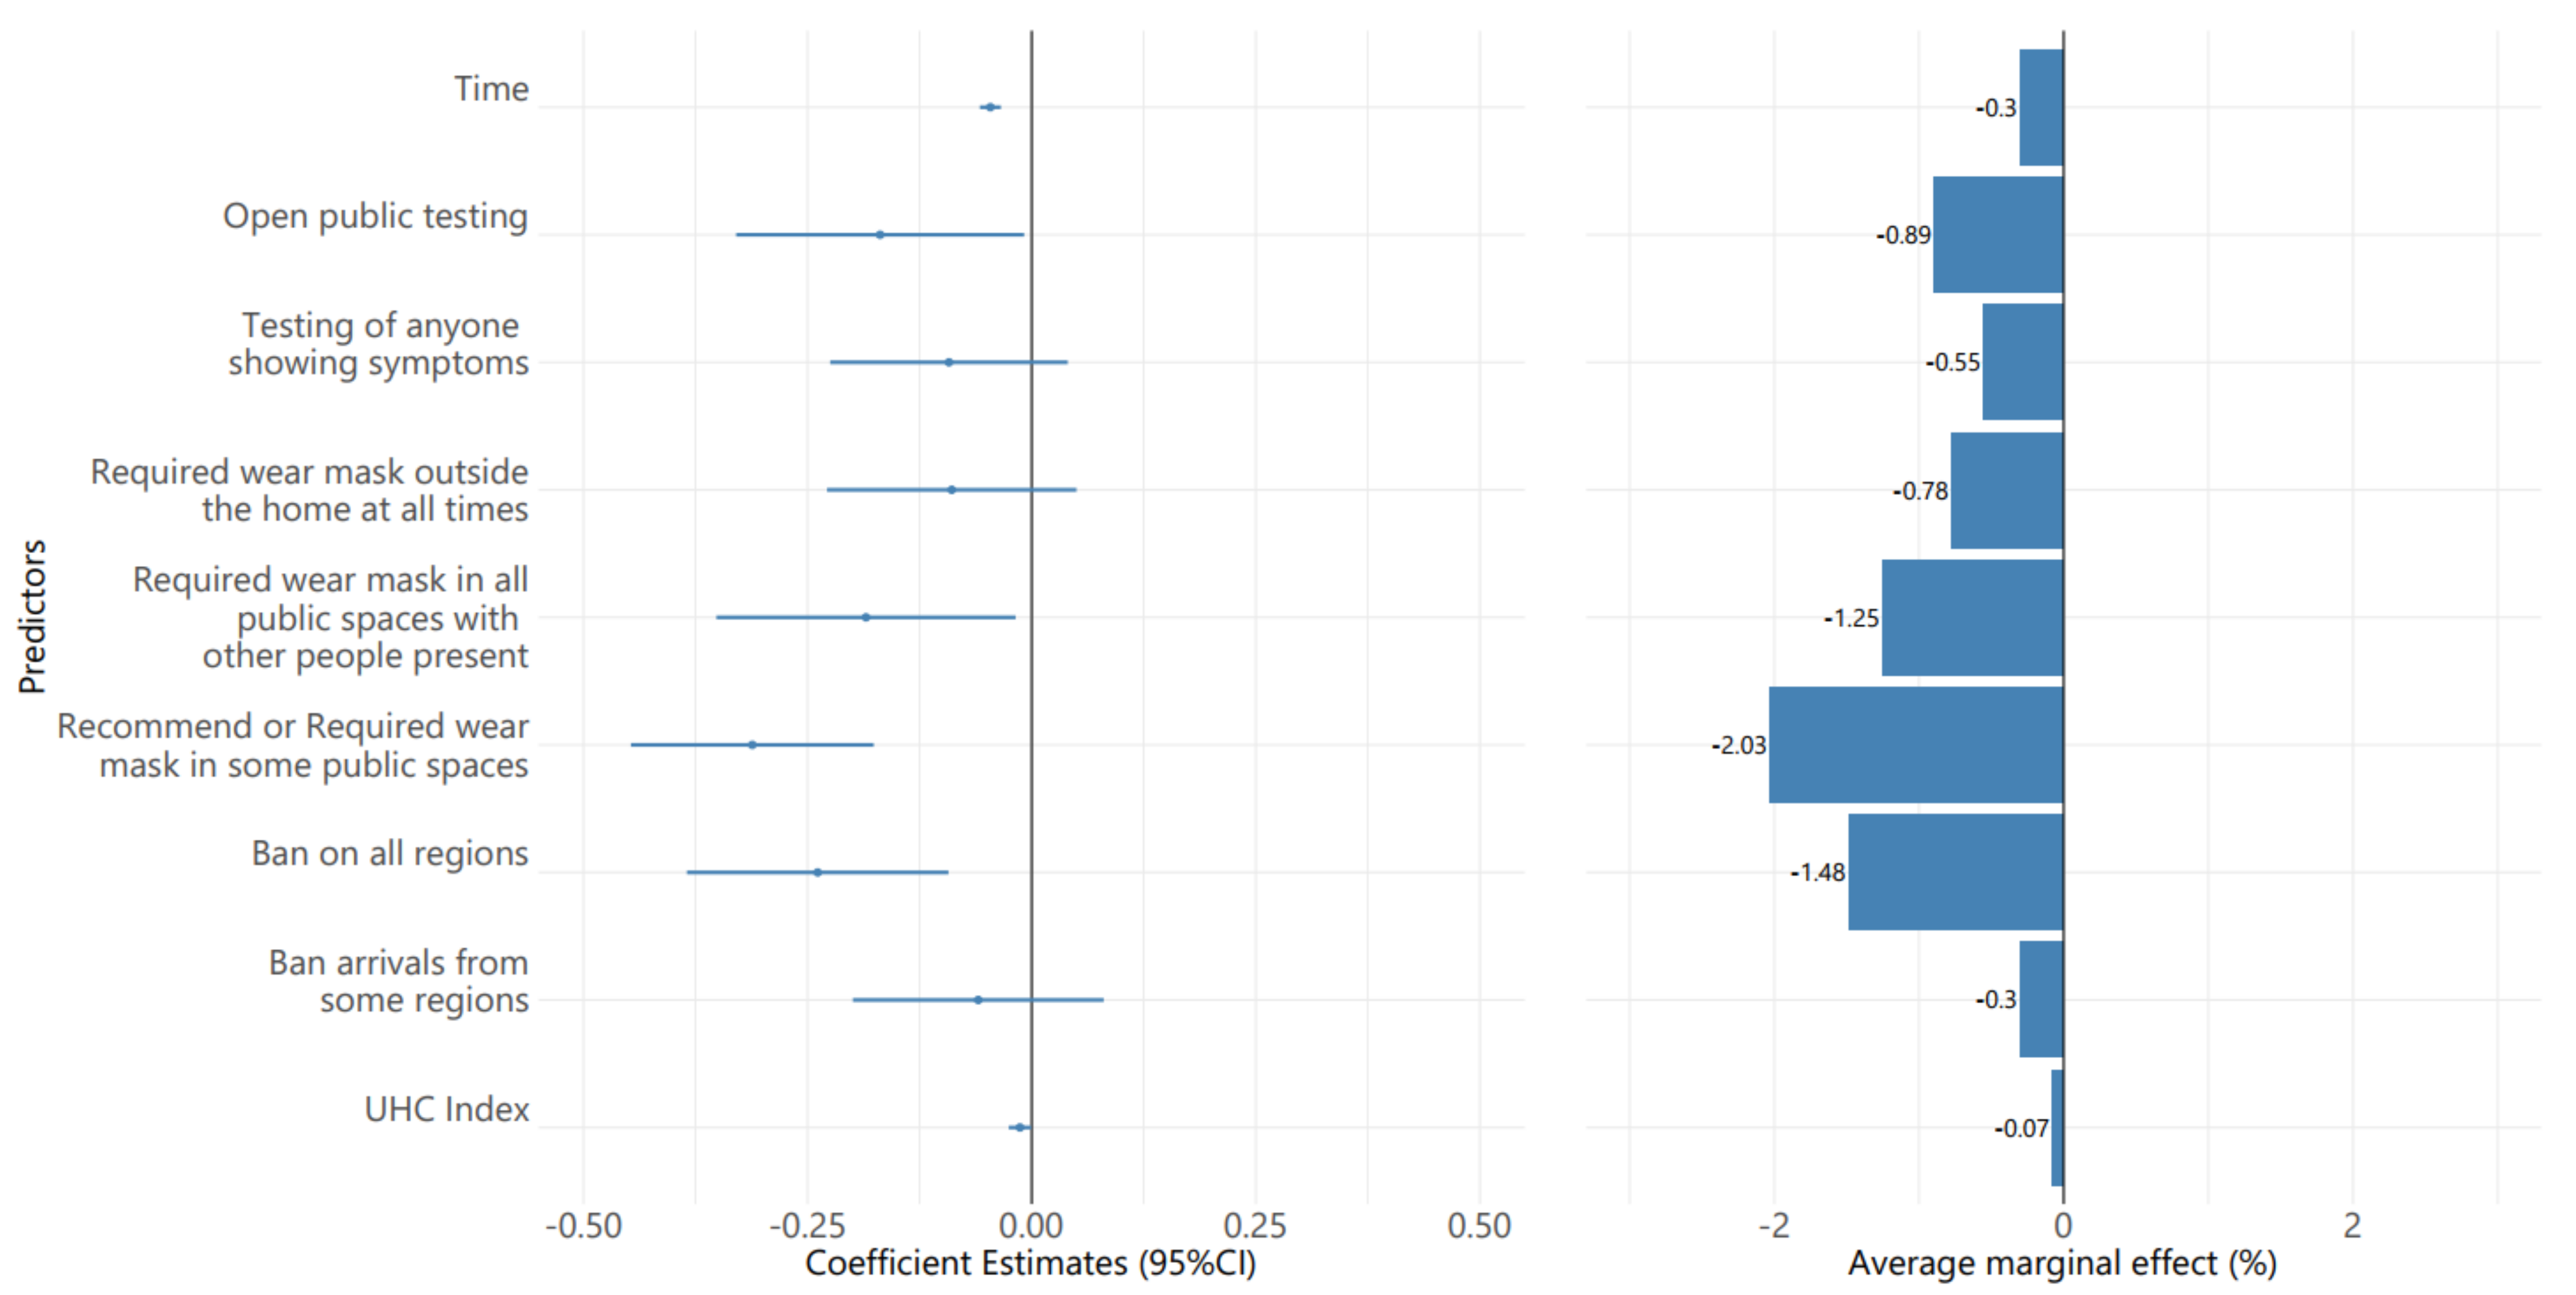
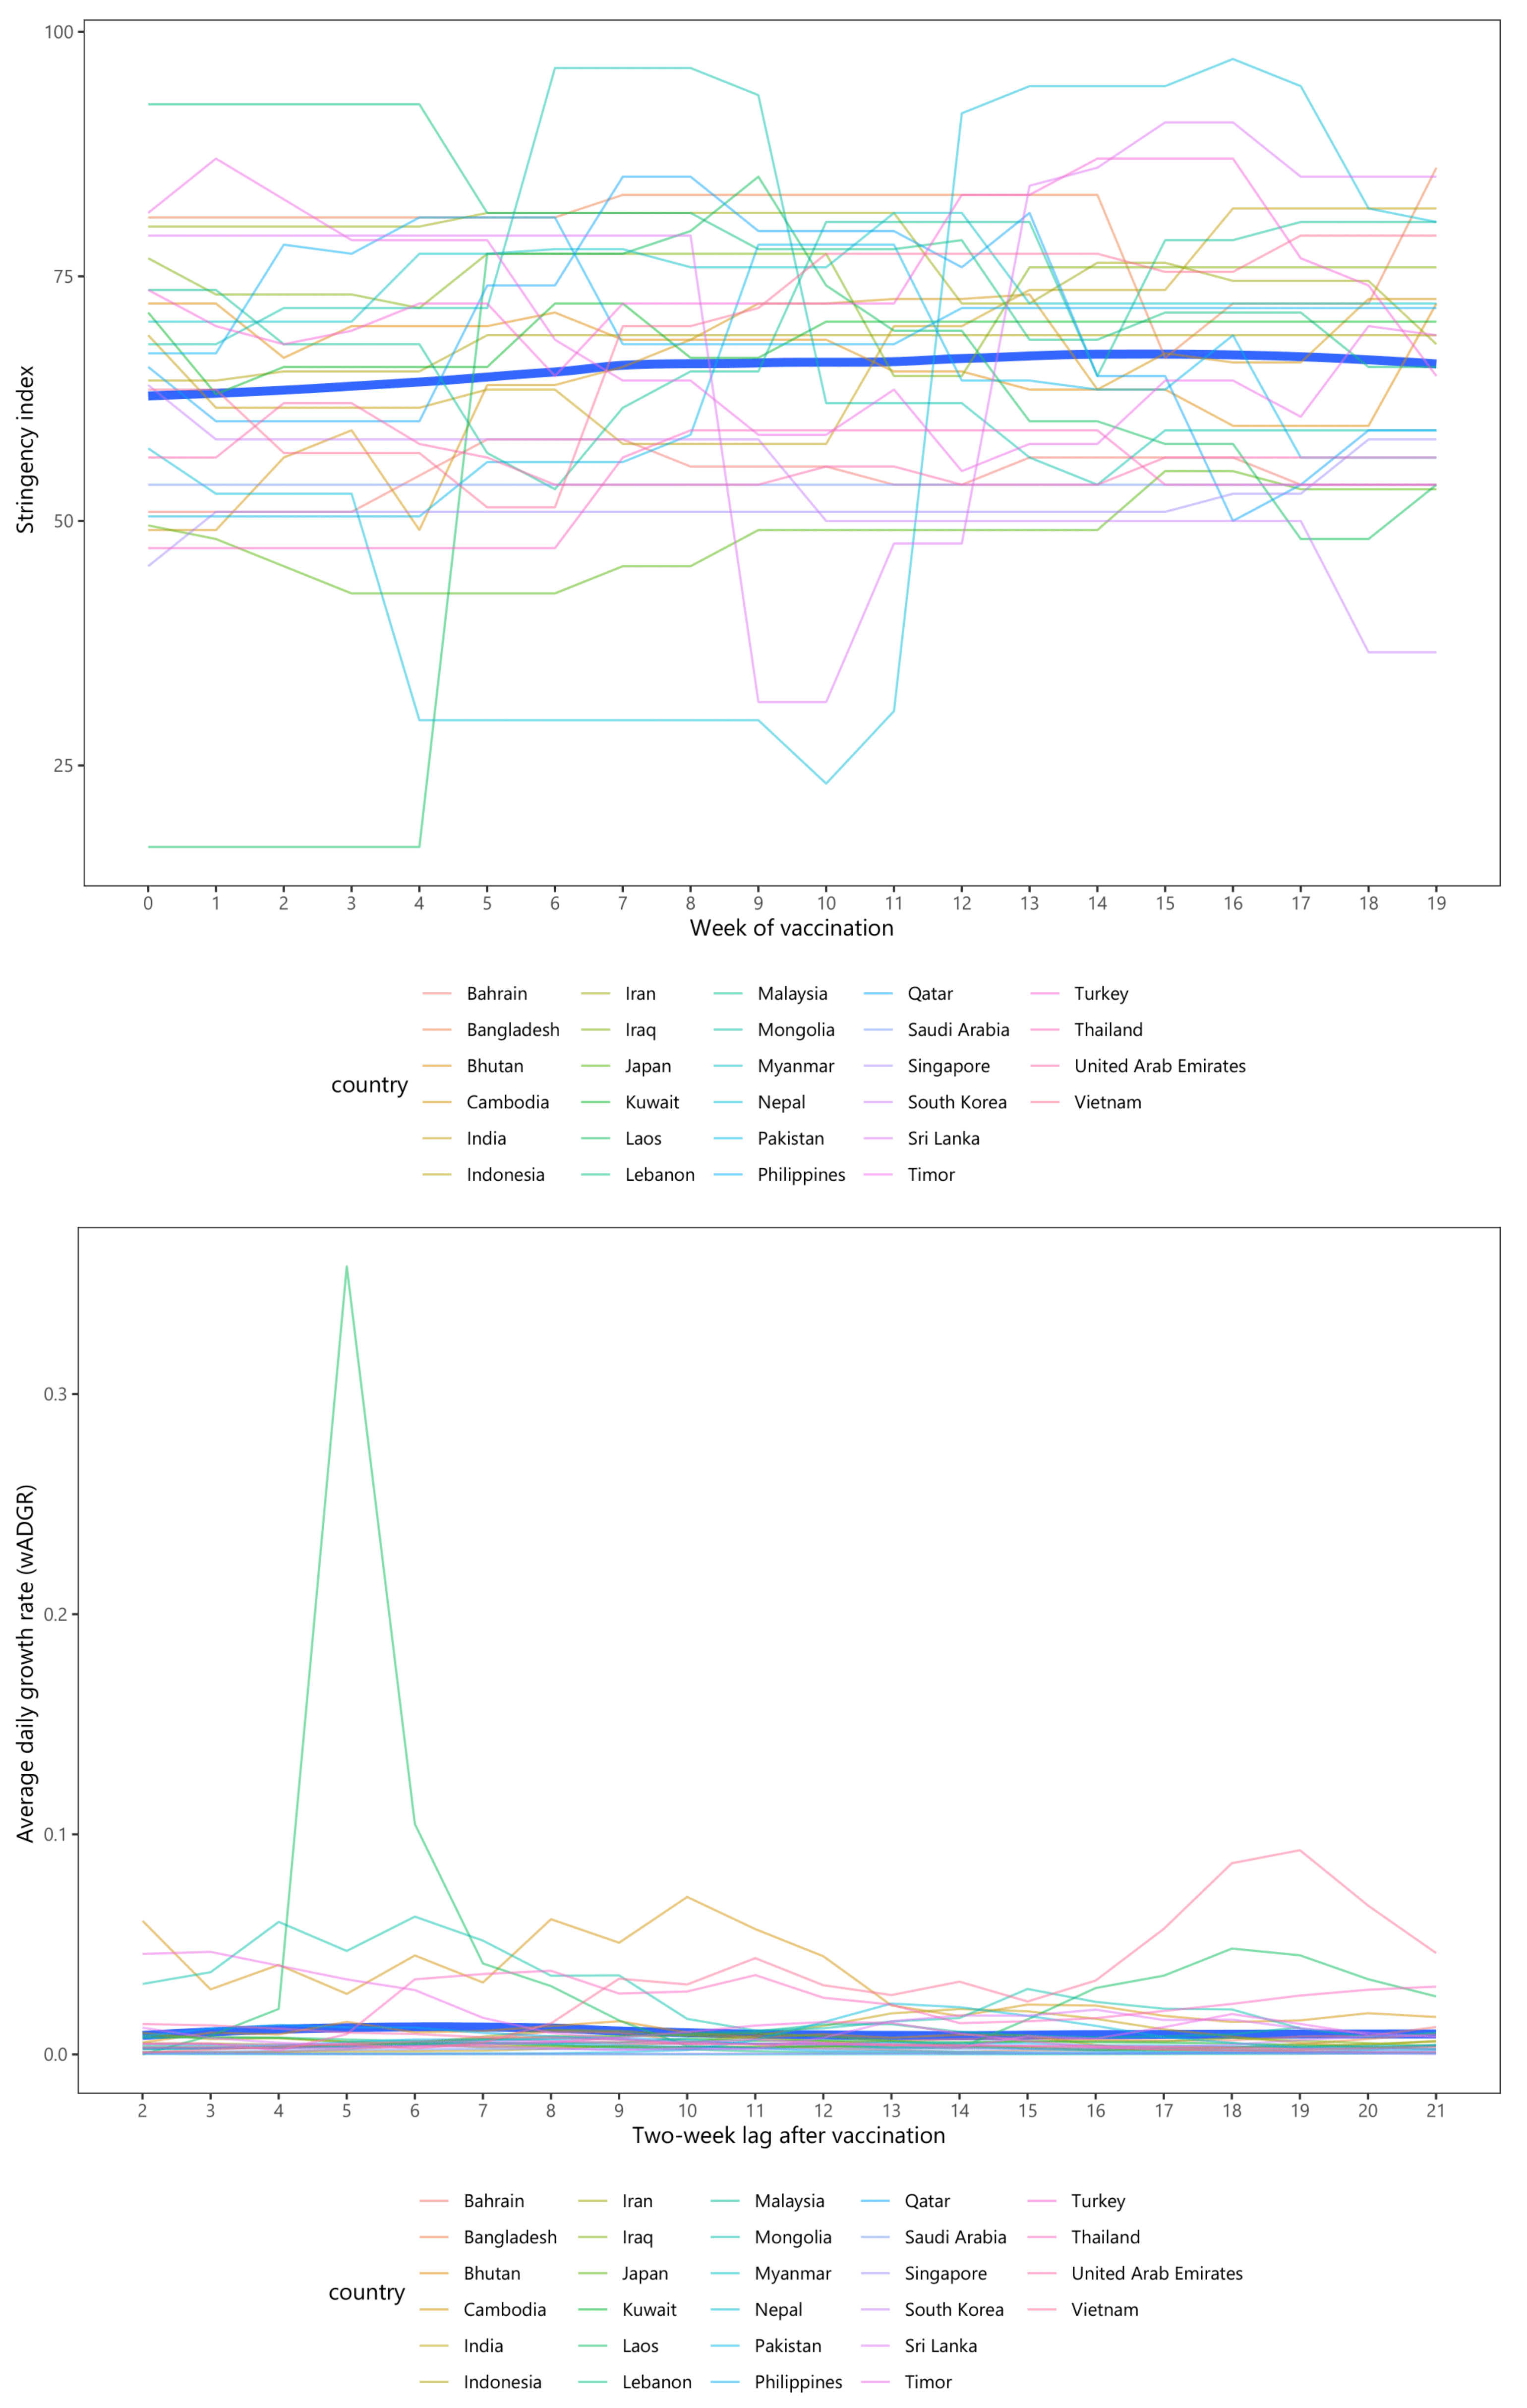
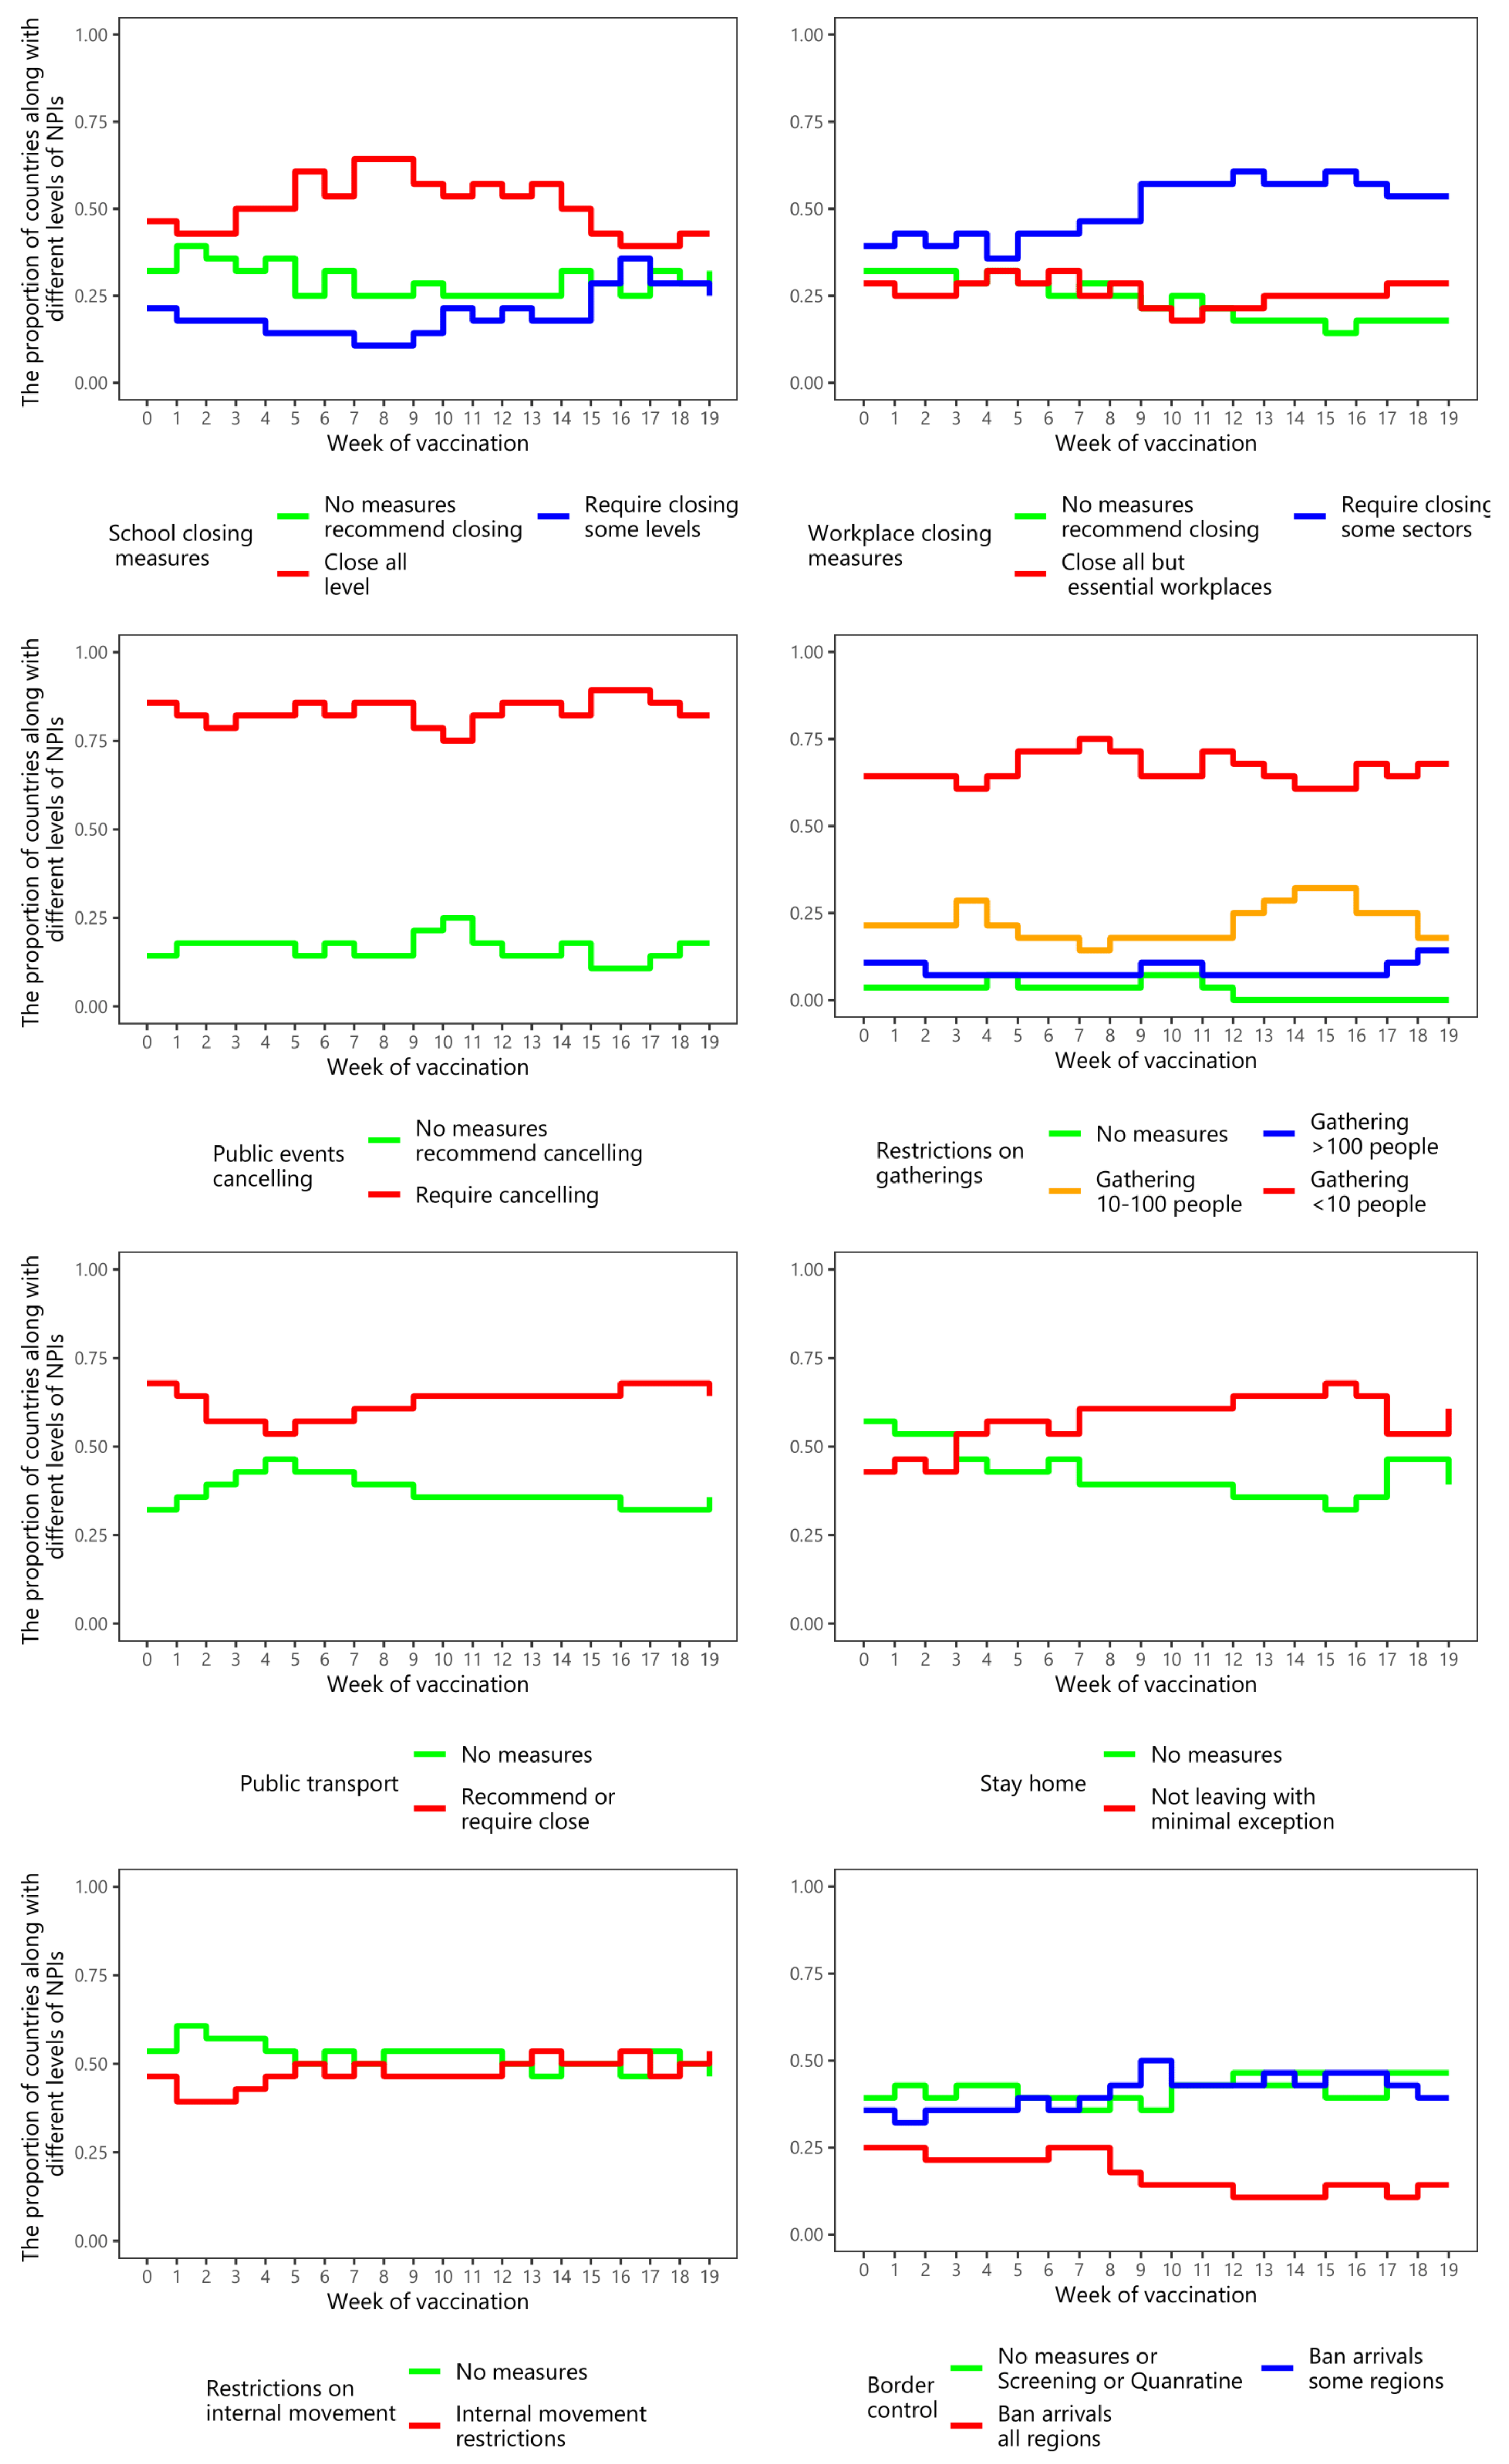
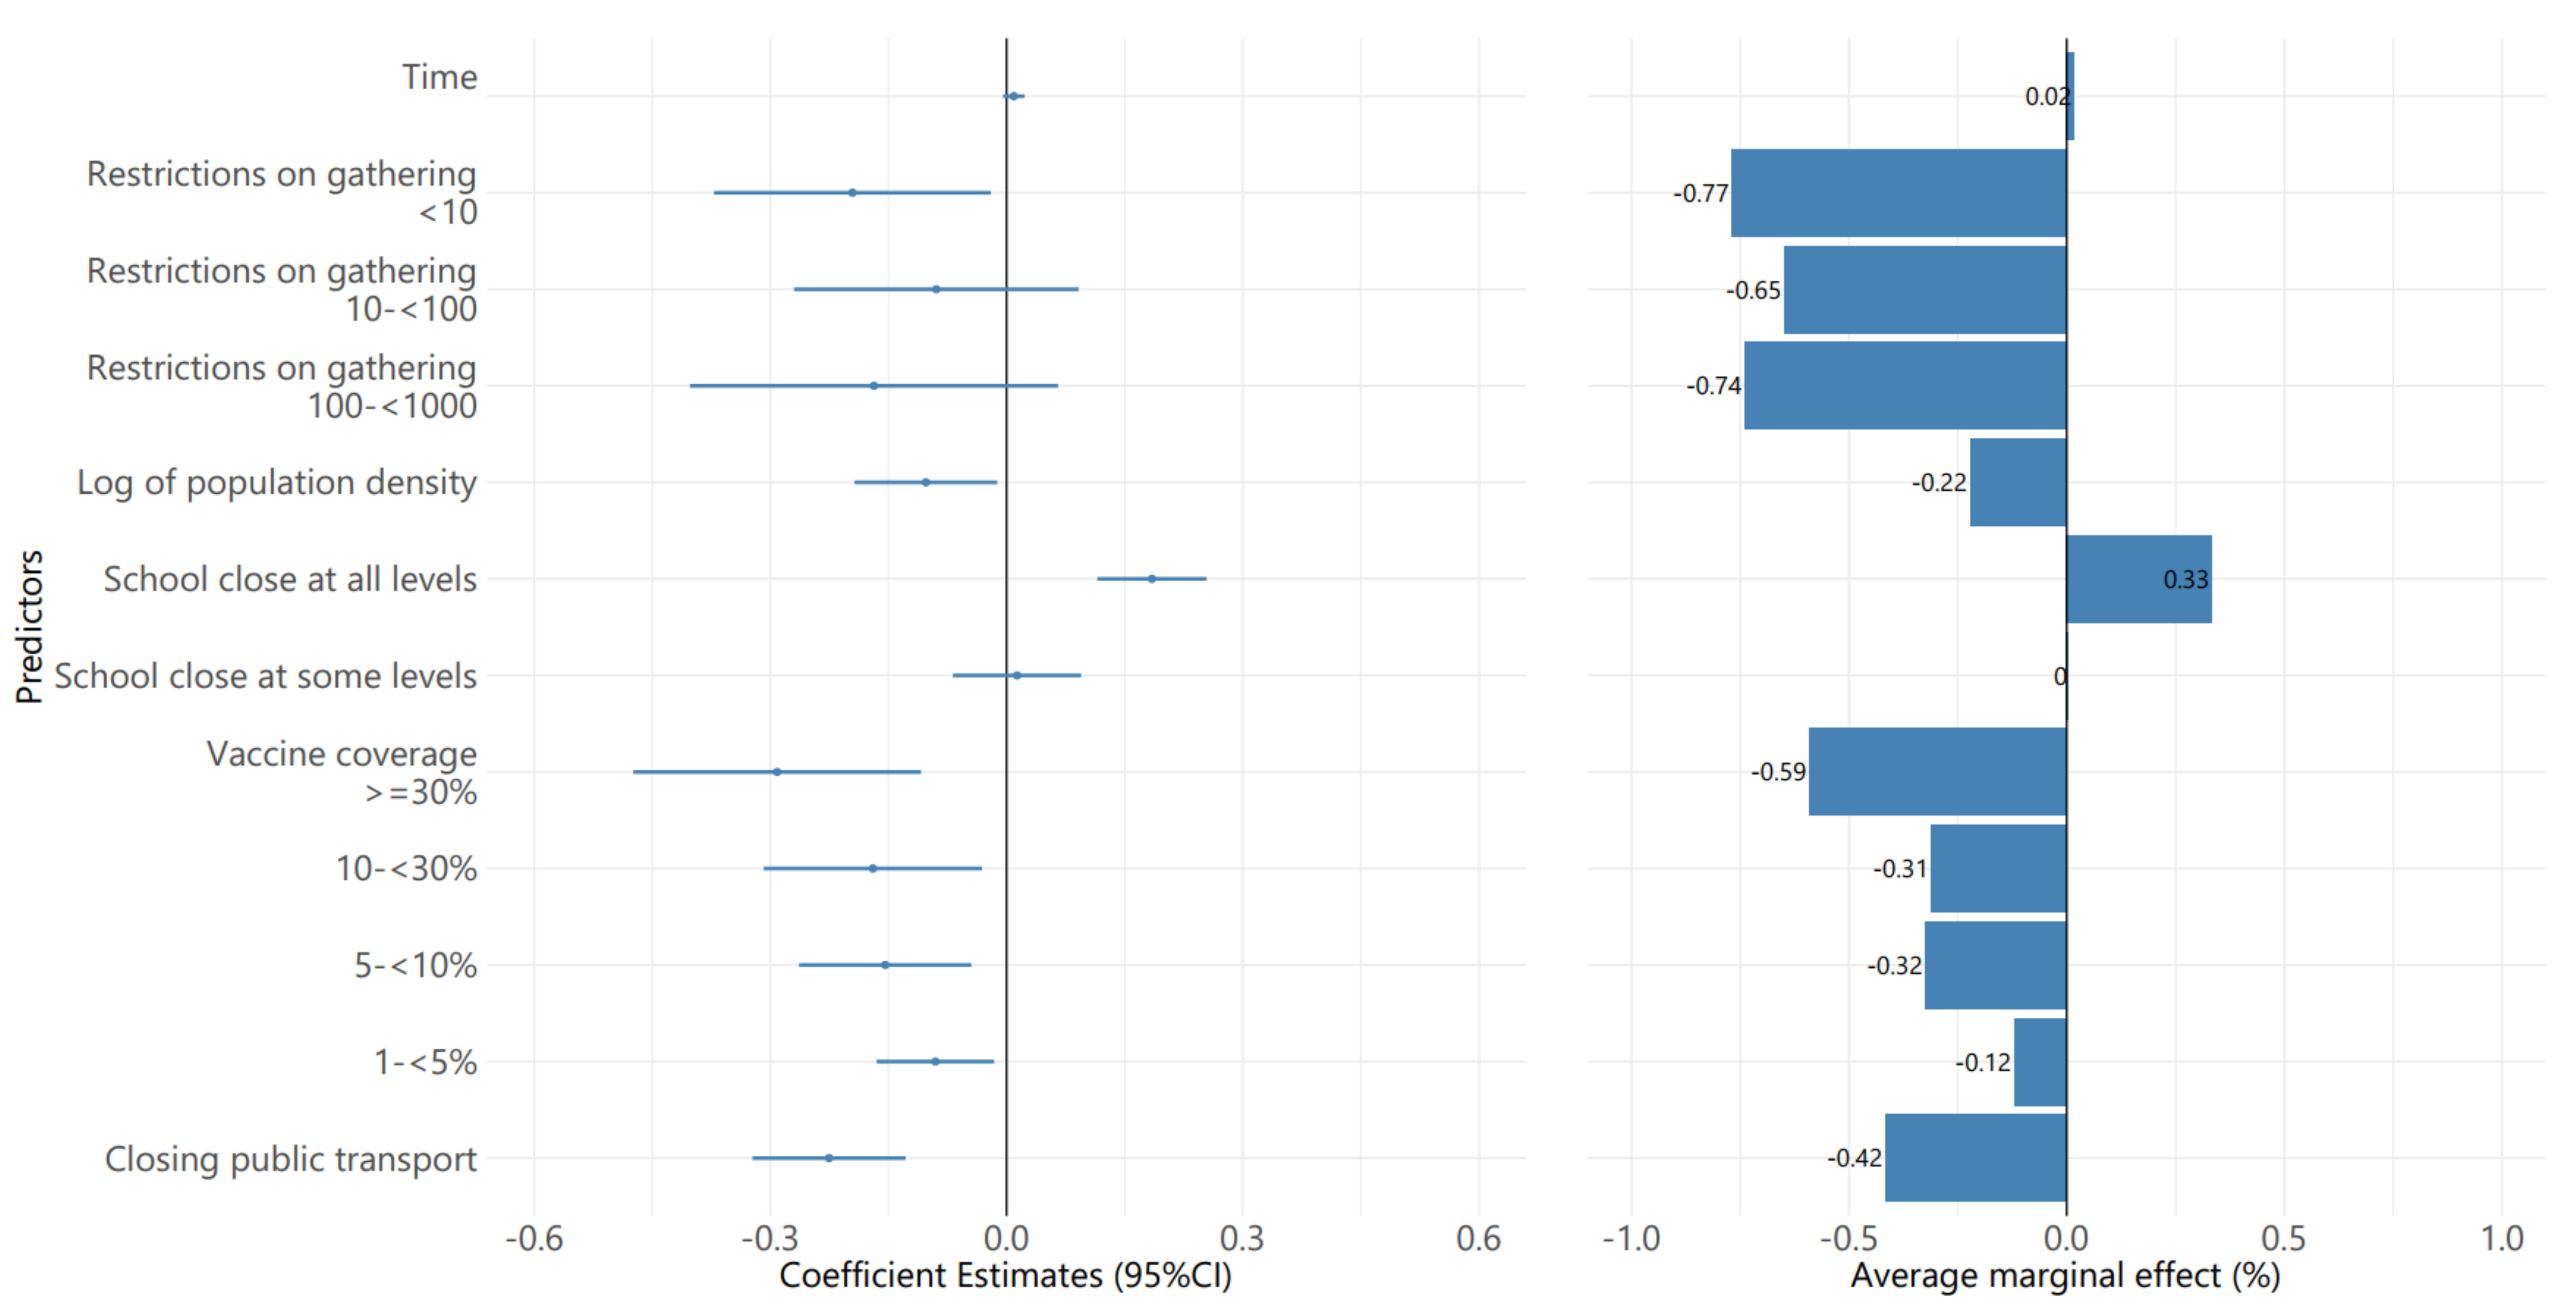
3.2. Post-Vaccination Period
4. Discussion
4.1. The Pre-Vaccination Period
4.2. The Post-Vaccination Period
5. Conclusions
Supplementary Materials
Author Contributions
Funding
Institutional Review Board Statement
Informed Consent Statement
Data Availability Statement
Acknowledgments
Conflicts of Interest
References
- Johns Hopkins Coronavirus Resource Center Pandemic Data Initiative. Available online: https://coronavirus.jhu.edu/pandemic-data-initiative (accessed on 19 May 2021).
- Landoni, G.; Maimeri, N.; Fedrizzi, M.; Fresilli, S.; Kuzovlev, A.; Likhvantsev, V.; Nardelli, P.; Zangrillo, A. Why Are Asian Countries Outperforming the Western World in Controlling COVID-19 Pandemic? Pathog. Glob. Health 2021, 115, 70–72. [Google Scholar] [CrossRef]
- Hale, T.; Angrist, N.; Goldszmidt, R.; Kira, B.; Petherick, A.; Phillips, T.; Webster, S.; Cameron-Blake, E.; Hallas, L.; Majumdar, S.; et al. A Global Panel Database of Pandemic Policies (Oxford COVID-19 Government Response Tracker). Nat. Hum. Behav. 2021, 5, 529–538. [Google Scholar] [CrossRef]
- Haug, N.; Geyrhofer, L.; Londei, A.; Dervic, E.; Desvars-Larrive, A.; Loreto, V.; Pinior, B.; Thurner, S.; Klimek, P. Ranking the Effectiveness of Worldwide COVID-19 Government Interventions. Nat. Hum. Behav. 2020, 4, 1303–1312. [Google Scholar] [CrossRef]
- Wang, W.; Wu, Q.; Yang, J.; Dong, K.; Chen, X.; Bai, X.; Chen, X.; Chen, Z.; Viboud, C.; Ajelli, M.; et al. Global, Regional, and National Estimates of Target Population Sizes for COVID-19 Vaccination: Descriptive Study. BMJ 2020, 371, m4704. [Google Scholar] [CrossRef]
- Burki, T.K. Challenges in the Rollout of COVID-19 Vaccines Worldwide. Lancet Respir. Med. 2021, 9, e42–e43. [Google Scholar] [CrossRef]
- Solís Arce, J.S.; Warren, S.S.; Meriggi, N.F.; Scacco, A.; McMurry, N.; Voors, M.; Syunyaev, G.; Malik, A.A.; Aboutajdine, S.; Adeojo, O.; et al. COVID-19 Vaccine Acceptance and Hesitancy in Low- and Middle-Income Countries. Nat. Med. 2021, 27, 1385–1394. [Google Scholar] [CrossRef] [PubMed]
- Al-Mohaithef, M.; Padhi, B.K. Determinants of COVID-19 Vaccine Acceptance in Saudi Arabia: A Web-Based National Survey. J. Multidiscip. Healthc. 2020, 13, 1657–1663. [Google Scholar] [CrossRef] [PubMed]
- Dyer, O. Covid-19: Indonesia Becomes Asia’s New Pandemic Epicentre as Delta Variant Spreads. BMJ 2021, 374, n1815. [Google Scholar] [CrossRef]
- Singh, J.; Rahman, S.A.; Ehtesham, N.Z.; Hira, S.; Hasnain, S.E. SARS-CoV-2 Variants of Concern Are Emerging in India. Nat. Med. 2021, 27, 1131–1133. [Google Scholar] [CrossRef] [PubMed]
- Chookajorn, T.; Kochakarn, T.; Wilasang, C.; Kotanan, N.; Modchang, C. Southeast Asia Is an Emerging Hotspot for COVID-19. Nat. Med. 2021, 27, 1495–1496. [Google Scholar] [CrossRef] [PubMed]
- ECDC. Integrated COVID-19 Response in the Vaccination Era; European Centre for Disease Prevention and Control: Stockholm, Sweden, 2021. [Google Scholar]
- Lai, S.; Floyd, J.; Tatem, A. Preliminary Risk Analysis of the Spread of New COVID-19 Variants from the UK, South Africa and Brazil. 2021. Available online: https://www.worldpop.org/resources/reports/risk_analysis_covid19/Preliminary_risk_analysis_of_the_spread_of_new_variants_25012021.pdf (accessed on 3 October 2021).
- Flaxman, S.; Mishra, S.; Gandy, A.; Unwin, H.J.T.; Mellan, T.A.; Coupland, H.; Whittaker, C.; Zhu, H.; Berah, T.; Eaton, J.W.; et al. Estimating the Effects of Non-Pharmaceutical Interventions on COVID-19 in Europe. Nature 2020, 584, 257–261. [Google Scholar] [CrossRef] [PubMed]
- Pozo-Martin, F.; Weishaar, H.; Cristea, F.; Hanefeld, J.; Bahr, T.; Schaade, L.; El Bcheraoui, C. The Impact of Non-Pharmaceutical Interventions on COVID-19 Epidemic Growth in the 37 OECD Member States. Eur. J. Epidemiol. 2021, 36, 629–640. [Google Scholar] [CrossRef]
- Liu, Y.; Morgenstern, C.; Kelly, J.; Lowe, R.; Munday, J.; Villabona-Arenas, C.J.; Gibbs, H.; Pearson, C.A.B.; Prem, K.; Leclerc, Q.J.; et al. The Impact of Non-Pharmaceutical Interventions on SARS-CoV-2 Transmission across 130 Countries and Territories. BMC Med. 2021, 19, 40. [Google Scholar] [CrossRef] [PubMed]
- Bo, Y.; Guo, C.; Lin, C.; Zeng, Y.; Li, H.B.; Zhang, Y.; Hossain, M.S.; Chan, J.W.M.; Yeung, D.W.; Kwok, K.O.; et al. Effectiveness of Non-Pharmaceutical Interventions on COVID-19 Transmission in 190 Countries from 23 January to 13 April 2020. Int. J. Infect. Dis. 2021, 102, 247–253. [Google Scholar] [CrossRef]
- Saez, M.; Tobias, A.; Varga, D.; Barceló, M.A. Effectiveness of the Measures to Flatten the Epidemic Curve of COVID-19. The Case of Spain. Sci. Total Environ. 2020, 727, 138761. [Google Scholar] [CrossRef] [PubMed]
- Ge, Y.; Zhang, W.-B.; Liu, H.; Ruktanonchai, C.W.; Hu, M.; Wu, X.; Song, Y.; Ruktanonchai, N.W.; Yan, W.; Cleary, E.; et al. Impacts of Worldwide Individual Non-Pharmaceutical Interventions on COVID-19 Transmission across Waves and Space. Int. J. Appl. Earth Obs. Geoinf. 2022, 106, 102649. [Google Scholar] [CrossRef]
- Petherick, A.; Goldszmidt, R.; Andrade, E.B.; Furst, R.; Hale, T.; Pott, A.; Wood, A. A Worldwide Assessment of Changes in Adherence to COVID-19 Protective Behaviours and Hypothesized Pandemic Fatigue. Nat. Hum. Behav. 2021, 5, 1145–1160. [Google Scholar] [CrossRef] [PubMed]
- WHO Regional Office for Europe. Pandemic Fatigue—Reinvigorating the Public to Prevent COVID-19; Policy Framework for Supporting Pandemic Prevention and Management; Copenhagen, Denmark. 2020. Available online: https://apps.who.int/iris/handle/10665/335820 (accessed on 3 October 2021).
- United Nations Regional Groups of Member States|Department for General Assembly and Conference Management. Available online: https://www.un.org/dgacm/en/content/regional-groups (accessed on 3 October 2021).
- Edouard, M.; Ritchie, H.; Ortiz-Ospina, E.; Roser, M.; Hasell, J.; Appel, C.; Giattino, C.; Rodés-Guirao, L. A Global Database of COVID-19 Vaccinations. Nat. Hum. Behav. 2021, 5, 947–953. [Google Scholar] [CrossRef]
- Jill, D.; Sterrett, N.; Dasgupta, S.; Kriss, J.L.; Barry, V.; Vanden Esschert, K.; Whiteman, A.; Cadwell, B.L.; Weller, D.; Qualters, J.R.; et al. COVID-19 Vaccination Coverage Among Adults—United States, 14 December 2020–22 May 2021. MMWR Morb. Mortal. Wkly. Rep. 2021, 70, 922–927. [Google Scholar] [CrossRef]
- Center for Disease Control Interim Clinical Guidance for Management of Patients with Confrmed Coronavirus Disease. Available online: https://www.cdc.gov/coronavirus/2019-ncov/hcp/clinical-guidance-management-patients.html (accessed on 3 October 2021).
- Sanderson, K. COVID Vaccines Protect against Delta, but Their Effectiveness Wanes. Nature 2021. Available online: https://www.nature.com/articles/d41586-021-02261-8 (accessed on 10 October 2021).
- World Health Organization. The Sinopharm COVID-19 Vaccine: What You Need to Know. Available online: https://www.who.int/news-room/feature-stories/detail/the-sinopharm-covid-19-vaccine-what-you-need-to-know (accessed on 3 October 2021).
- VoPham, T.; Weaver, M.D.; Adamkiewicz, G.; Hart, J.E. Social Distancing Associations with COVID-19 Infection and Mortality Are Modified by Crowding and Socioeconomic Status. Int. J. Environ. Res. Public Health 2021, 18, 4680. [Google Scholar] [CrossRef]
- Pereira-Maxwell, F. Medical Statistics: An A-Z Companion; CRC Press, Taylor & Francis Group: Boca Raton, FL, USA, 2018; ISBN 9781351634090. [Google Scholar]
- Miranda, J. Moving the Bar: Transformations in Linear Regression. The Annual Meeting of the Southwest Educational Research Association. 2000. Available online: https://files.eric.ed.gov/fulltext/ED445073.pdf (accessed on 10 October 2021).
- Bates, D.; Mächler, M.; Bolker, B.; Walker, S. Fitting Linear Mixed-Effects Models Using Lme4. J. Stat. Soft. 2015, 67, 1–48. [Google Scholar] [CrossRef]
- Brooks, M.E.; Kristensen, K.; van Benthem, K.J.; Magnusson, A.; Berg, C.W.; Nielsen, A.; Skaug, H.J.; Mächler, M.; Bolker, B.M. GlmmTMB Balances Speed and Flexibility Among Packages for Zero-Inflated Generalized Linear Mixed Modeling. R J. 2017, 9, 378–400. [Google Scholar] [CrossRef] [Green Version]
- Lüdecke, D.; Ben-Shachar, M.; Patil, I.; Waggoner, P.; Makowski, D. Performance: An R Package for Assessment, Comparison and Testing of Statistical Models. JOSS 2021, 6, 3139. [Google Scholar] [CrossRef]
- Chaabna, K.; Doraiswamy, S.; Mamtani, R.; Cheema, S. Facemask Use in Community Settings to Prevent Respiratory Infection Transmission: A Rapid Review and Meta-Analysis. Int. J. Infect. Dis. 2021, 104, 198–206. [Google Scholar] [CrossRef]
- Gómez-Ochoa, S.A.; Muka, T. Meta-Analysis on Facemask Use in Community Settings to Prevent Respiratory Infection Transmission Shows No Effect. Int. J. Infect. Dis. 2021, 103, 257–259. [Google Scholar] [CrossRef] [PubMed]
- Bou-Karroum, L.; Khabsa, J.; Jabbour, M.; Hilal, N.; Haidar, Z.; Abi Khalil, P.; Khalek, R.A.; Assaf, J.; Honein-AbouHaidar, G.; Samra, C.A.; et al. Public Health Effects of Travel-Related Policies on the COVID-19 Pandemic: A Mixed-Methods Systematic Review. J. Infect. 2021, 83, 413–423. [Google Scholar] [CrossRef]
- Thai, P.Q.; Rabaa, M.A.; Luong, D.H.; Tan, D.Q.; Quang, T.D.; Quach, H.-L.; Hoang Thi, N.-A.; Dinh, P.C.; Nghia, N.D.; Tu, T.A.; et al. The First 100 Days of Severe Acute Respiratory Syndrome Coronavirus 2 (SARS-CoV-2) Control in Vietnam. Clin. Infect. Dis. 2021, 72, e334–e342. [Google Scholar] [CrossRef] [PubMed]
- Kuzdeuov, A.; Baimukashev, D.; Karabay, A.; Ibragimov, B.; Mirzakhmetov, A.; Nurpeiissov, M.; Lewis, M.; Varol, H.A. A Network-Based Stochastic Epidemic Simulator: Controlling COVID-19 With Region-Specific Policies. IEEE J. Biomed. Health Inform. 2020, 24, 2743–2754. [Google Scholar] [CrossRef]
- Braithwaite, J.; Tran, Y.; Ellis, L.A.; Westbrook, J. The 40 Health Systems, COVID-19 (40HS, C-19) Study. Int. J. Qual. Health Care 2021, 33, mzaa113. [Google Scholar] [CrossRef]
- Karamagi, H.C.; Tumusiime, P.; Titi-Ofei, R.; Droti, B.; Kipruto, H.; Nabyonga-Orem, J.; Seydi, A.B.-W.; Zawaira, F.; Schmets, G.; Cabore, J.W. Towards Universal Health Coverage in the WHO African Region: Assessing Health System Functionality, Incorporating Lessons from COVID-19. BMJ Glob. Health 2021, 6, e004618. [Google Scholar] [CrossRef] [PubMed]
- United Nations. United Nations Policy Brief: Covid-19 and Universal Health Coverage; United Nations, New York city, United States. 2020. Available online: https://unsdg.un.org/resources/policy-brief-covid-19-and-universal-health-coverage (accessed on 8 October 2021).
- Liu, Y.; Wang, Z.; Rader, B.; Li, B.; Wu, C.-H.; Whittington, J.D.; Zheng, P.; Stenseth, N.C.; Bjornstad, O.N.; Brownstein, J.S.; et al. Associations between Changes in Population Mobility in Response to the COVID-19 Pandemic and Socioeconomic Factors at the City Level in China and Country Level Worldwide: A Retrospective, Observational Study. Lancet Digit. Health 2021, 3, e349–e359. [Google Scholar] [CrossRef]
- Liang, L.-L.; Kao, C.-T.; Ho, H.J.; Wu, C.-Y. COVID-19 Case Doubling Time Associated with Non-Pharmaceutical Interventions and Vaccination: A Global Experience. J. Glob. Health 2021, 11, 05021. [Google Scholar] [CrossRef]
- Alagoz, O.; Sethi, A.K.; Patterson, B.W.; Churpek, M.; Alhanaee, G.; Scaria, E.; Safdar, N. The Impact of Vaccination to Control COVID-19 Burden in the United States: A Simulation Modeling Approach. PLoS ONE 2021, 16, e0254456. [Google Scholar] [CrossRef] [PubMed]
- Gómez, C.E.; Perdiguero, B.; Esteban, M. Emerging SARS-CoV-2 Variants and Impact in Global Vaccination Programs against SARS-CoV-2/COVID-19. Vaccines 2021, 9, 243. [Google Scholar] [CrossRef]
- Yang, J.; Marziano, V.; Deng, X.; Guzzetta, G.; Zhang, J.; Trentini, F.; Cai, J.; Poletti, P.; Zheng, W.; Wang, W.; et al. Despite Vaccination, China Needs Non-Pharmaceutical Interventions to Prevent Widespread Outbreaks of COVID-19 in 2021. Nat. Hum. Behav. 2021, 5, 1009–1020. [Google Scholar] [CrossRef] [PubMed]
- Moore, S.; Hill, E.M.; Tildesley, M.J.; Dyson, L.; Keeling, M.J. Vaccination and Non-Pharmaceutical Interventions for COVID-19: A Mathematical Modelling Study. Lancet Infect. Dis. 2021, 21, 793–802. [Google Scholar] [CrossRef]
- Shen, M.; Zu, J.; Fairley, C.K.; Pagán, J.A.; An, L.; Du, Z.; Guo, Y.; Rong, L.; Xiao, Y.; Zhuang, G.; et al. Projected COVID-19 Epidemic in the United States in the Context of the Effectiveness of a Potential Vaccine and Implications for Social Distancing and Face Mask Use. Vaccine 2021, 39, 2295–2302. [Google Scholar] [CrossRef]
- Liang, L.-L.; Kuo, H.-S.; Ho, H.J.; Wu, C.-Y. COVID-19 Vaccinations Are Associated with Reduced Fatality Rates: Evidence from Cross-County Quasi-Experiments. J. Glob. Health 2021, 11, 05019. [Google Scholar] [CrossRef]
- Patel, M.D.; Rosenstrom, E.; Ivy, J.S.; Mayorga, M.E.; Keskinocak, P.; Boyce, R.M.; Hassmiller Lich, K.; Smith, R.L.; Johnson, K.T.; Delamater, P.L.; et al. Association of Simulated COVID-19 Vaccination and Non-Pharmaceutical Interventions with Infections, Hospitalizations, and Mortality. JAMA Netw. Open 2021, 4, e2110782. [Google Scholar] [CrossRef]
- Utsunomiya, Y.T.; Utsunomiya, A.T.H.; Torrecilha, R.B.P.; Paulan, S.d.C.; Milanesi, M.; Garcia, J.F. Growth Rate and Acceleration Analysis of the COVID-19 Pandemic Reveals the Effect of Public Health Measures in Real Time. Front. Med. 2020, 7, 247. [Google Scholar] [CrossRef]
- Zhang, Y.; Quigley, A.; Wang, Q.; MacIntyre, C.R. Non-Pharmaceutical Interventions during the Roll out of Covid-19 Vaccines. BMJ 2021, 375, n2314. [Google Scholar] [CrossRef] [PubMed]


Publisher’s Note: MDPI stays neutral with regard to jurisdictional claims in published maps and institutional affiliations. |
© 2022 by the authors. Licensee MDPI, Basel, Switzerland. This article is an open access article distributed under the terms and conditions of the Creative Commons Attribution (CC BY) license (https://creativecommons.org/licenses/by/4.0/).
Share and Cite
Huy, L.D.; Nguyen, N.T.H.; Phuc, P.T.; Huang, C.-C. The Effects of Non-Pharmaceutical Interventions on COVID-19 Epidemic Growth Rate during Pre- and Post-Vaccination Period in Asian Countries. Int. J. Environ. Res. Public Health 2022, 19, 1139. https://doi.org/10.3390/ijerph19031139
Huy LD, Nguyen NTH, Phuc PT, Huang C-C. The Effects of Non-Pharmaceutical Interventions on COVID-19 Epidemic Growth Rate during Pre- and Post-Vaccination Period in Asian Countries. International Journal of Environmental Research and Public Health. 2022; 19(3):1139. https://doi.org/10.3390/ijerph19031139
Chicago/Turabian StyleHuy, Le Duc, Nhi Thi Hong Nguyen, Phan Thanh Phuc, and Chung-Chien Huang. 2022. "The Effects of Non-Pharmaceutical Interventions on COVID-19 Epidemic Growth Rate during Pre- and Post-Vaccination Period in Asian Countries" International Journal of Environmental Research and Public Health 19, no. 3: 1139. https://doi.org/10.3390/ijerph19031139