
Study and Application of Urban Aquatic Ecosystem Health Evaluation Index System in River Network Plain Area
Abstract
:1. Introduction
2. Materials and Methods
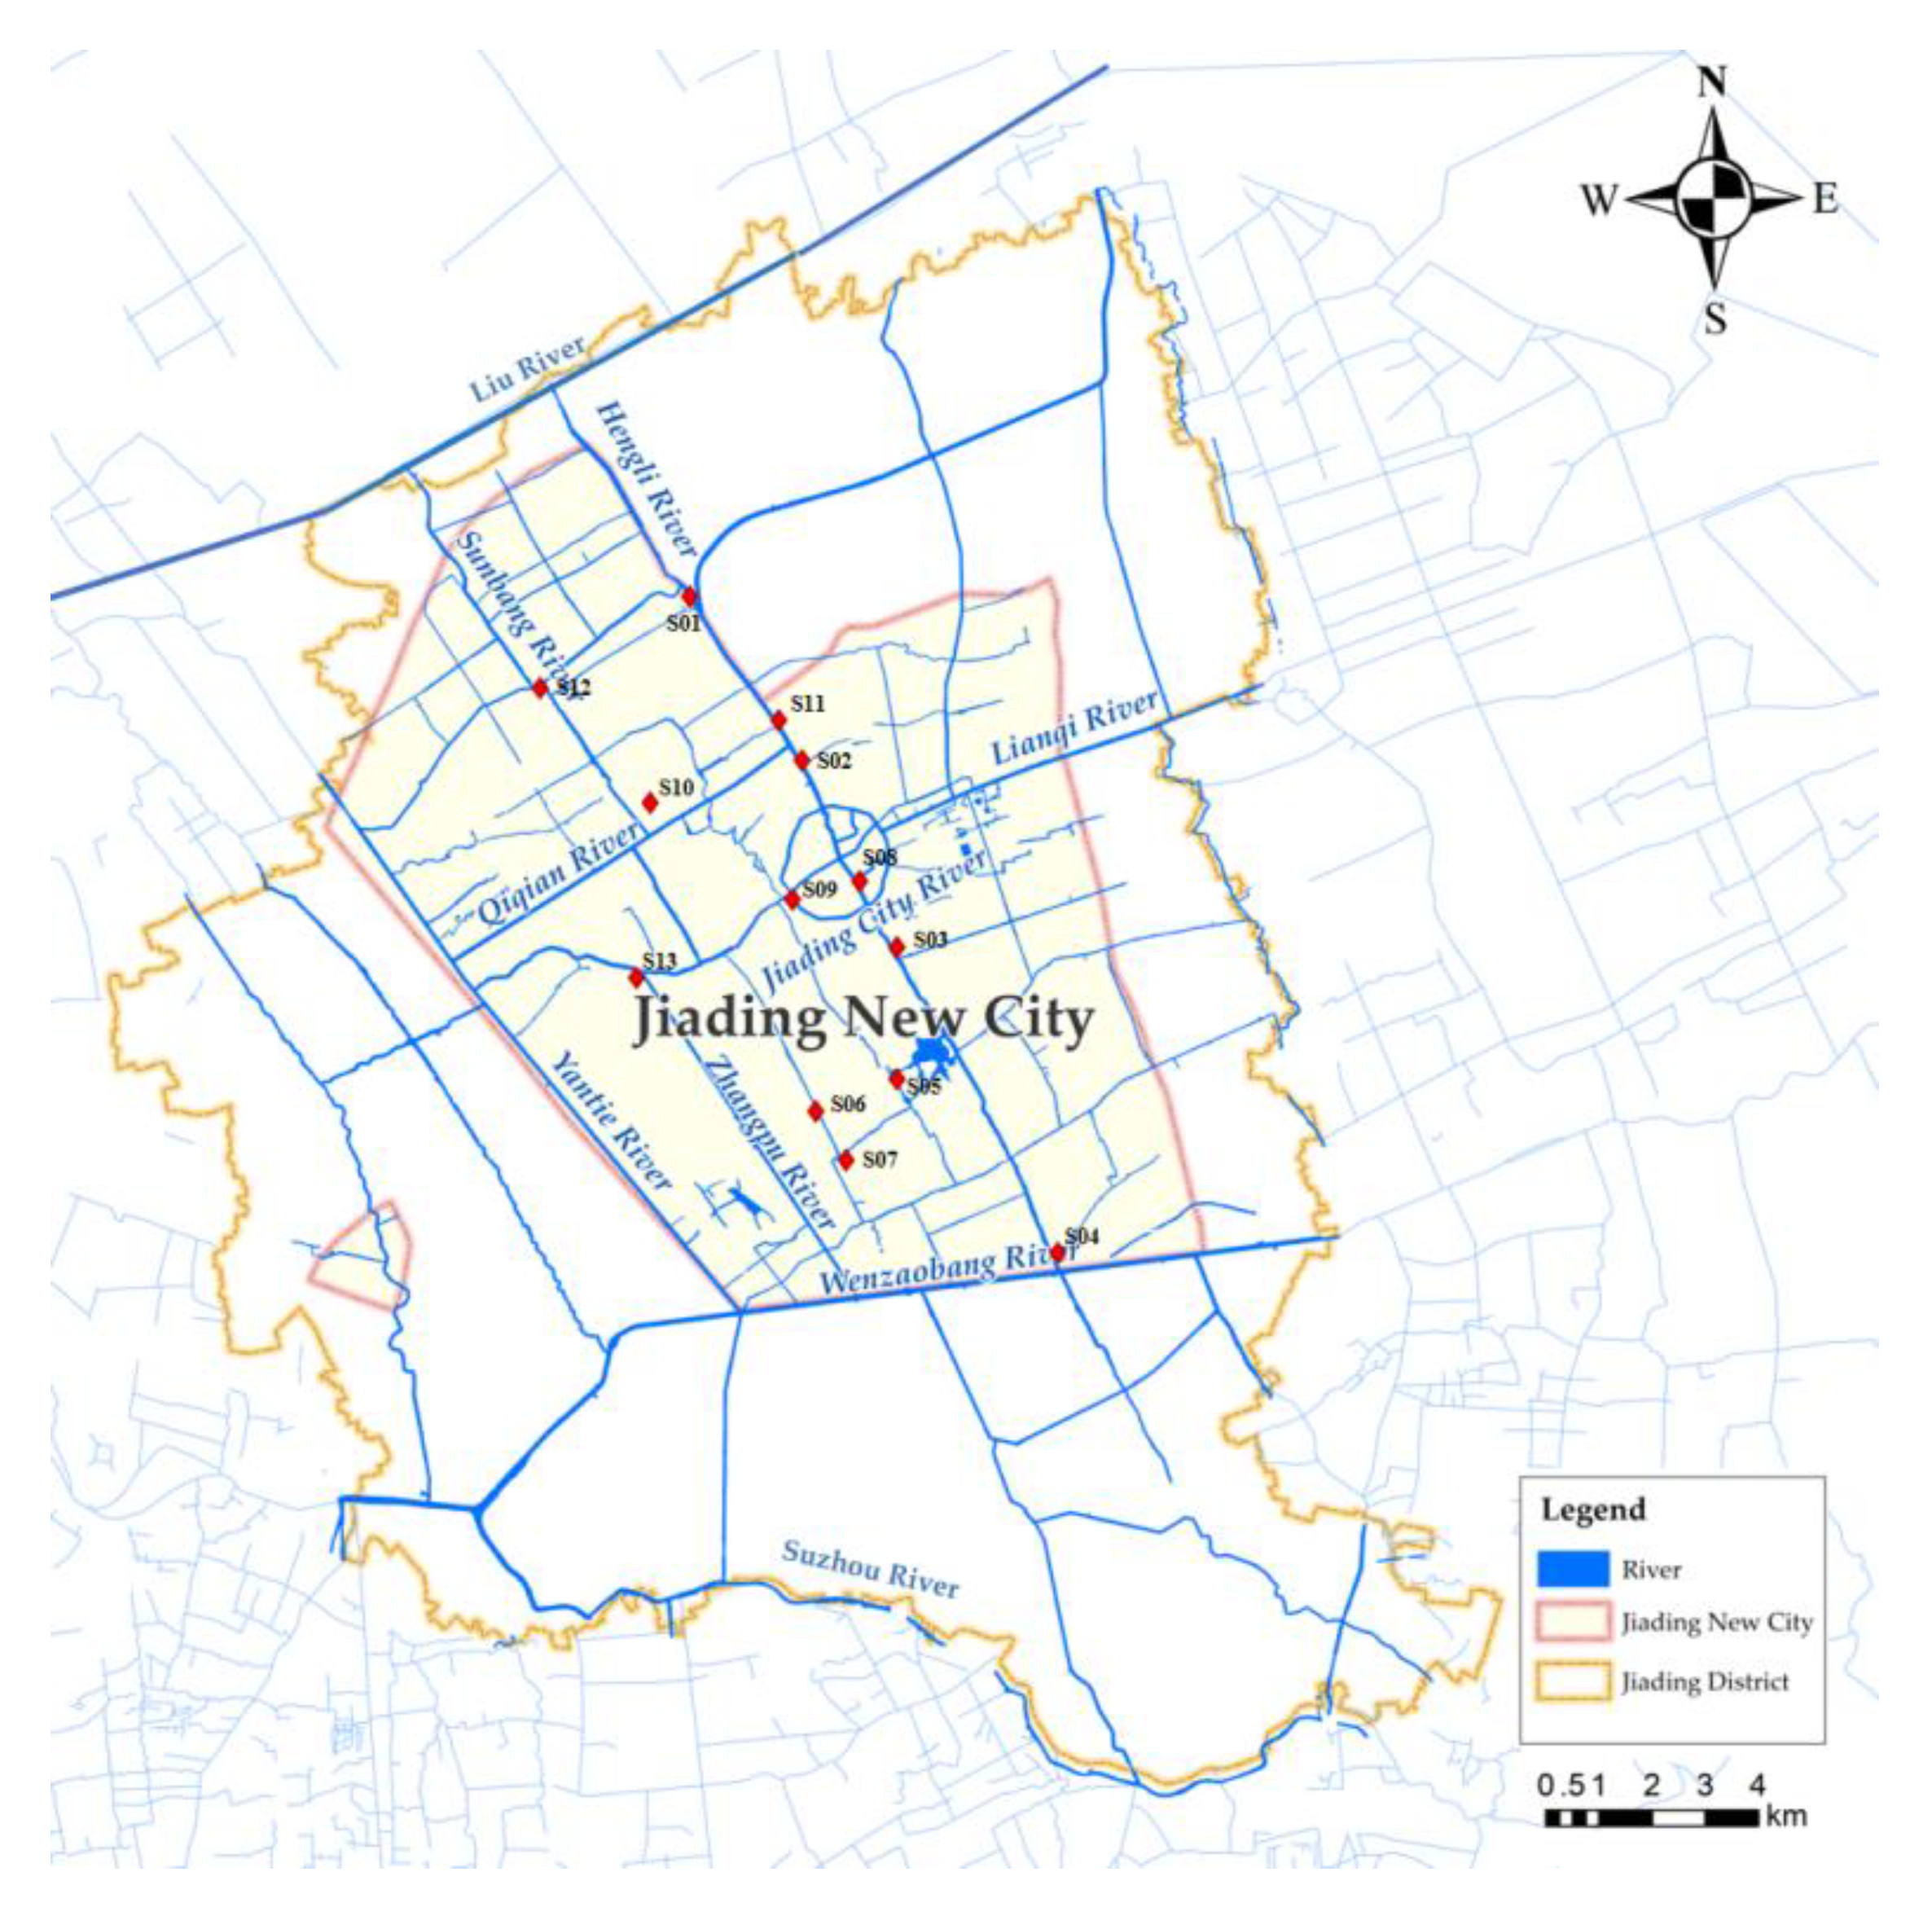
2.1. Study Region
2.2. Index System Establishmen
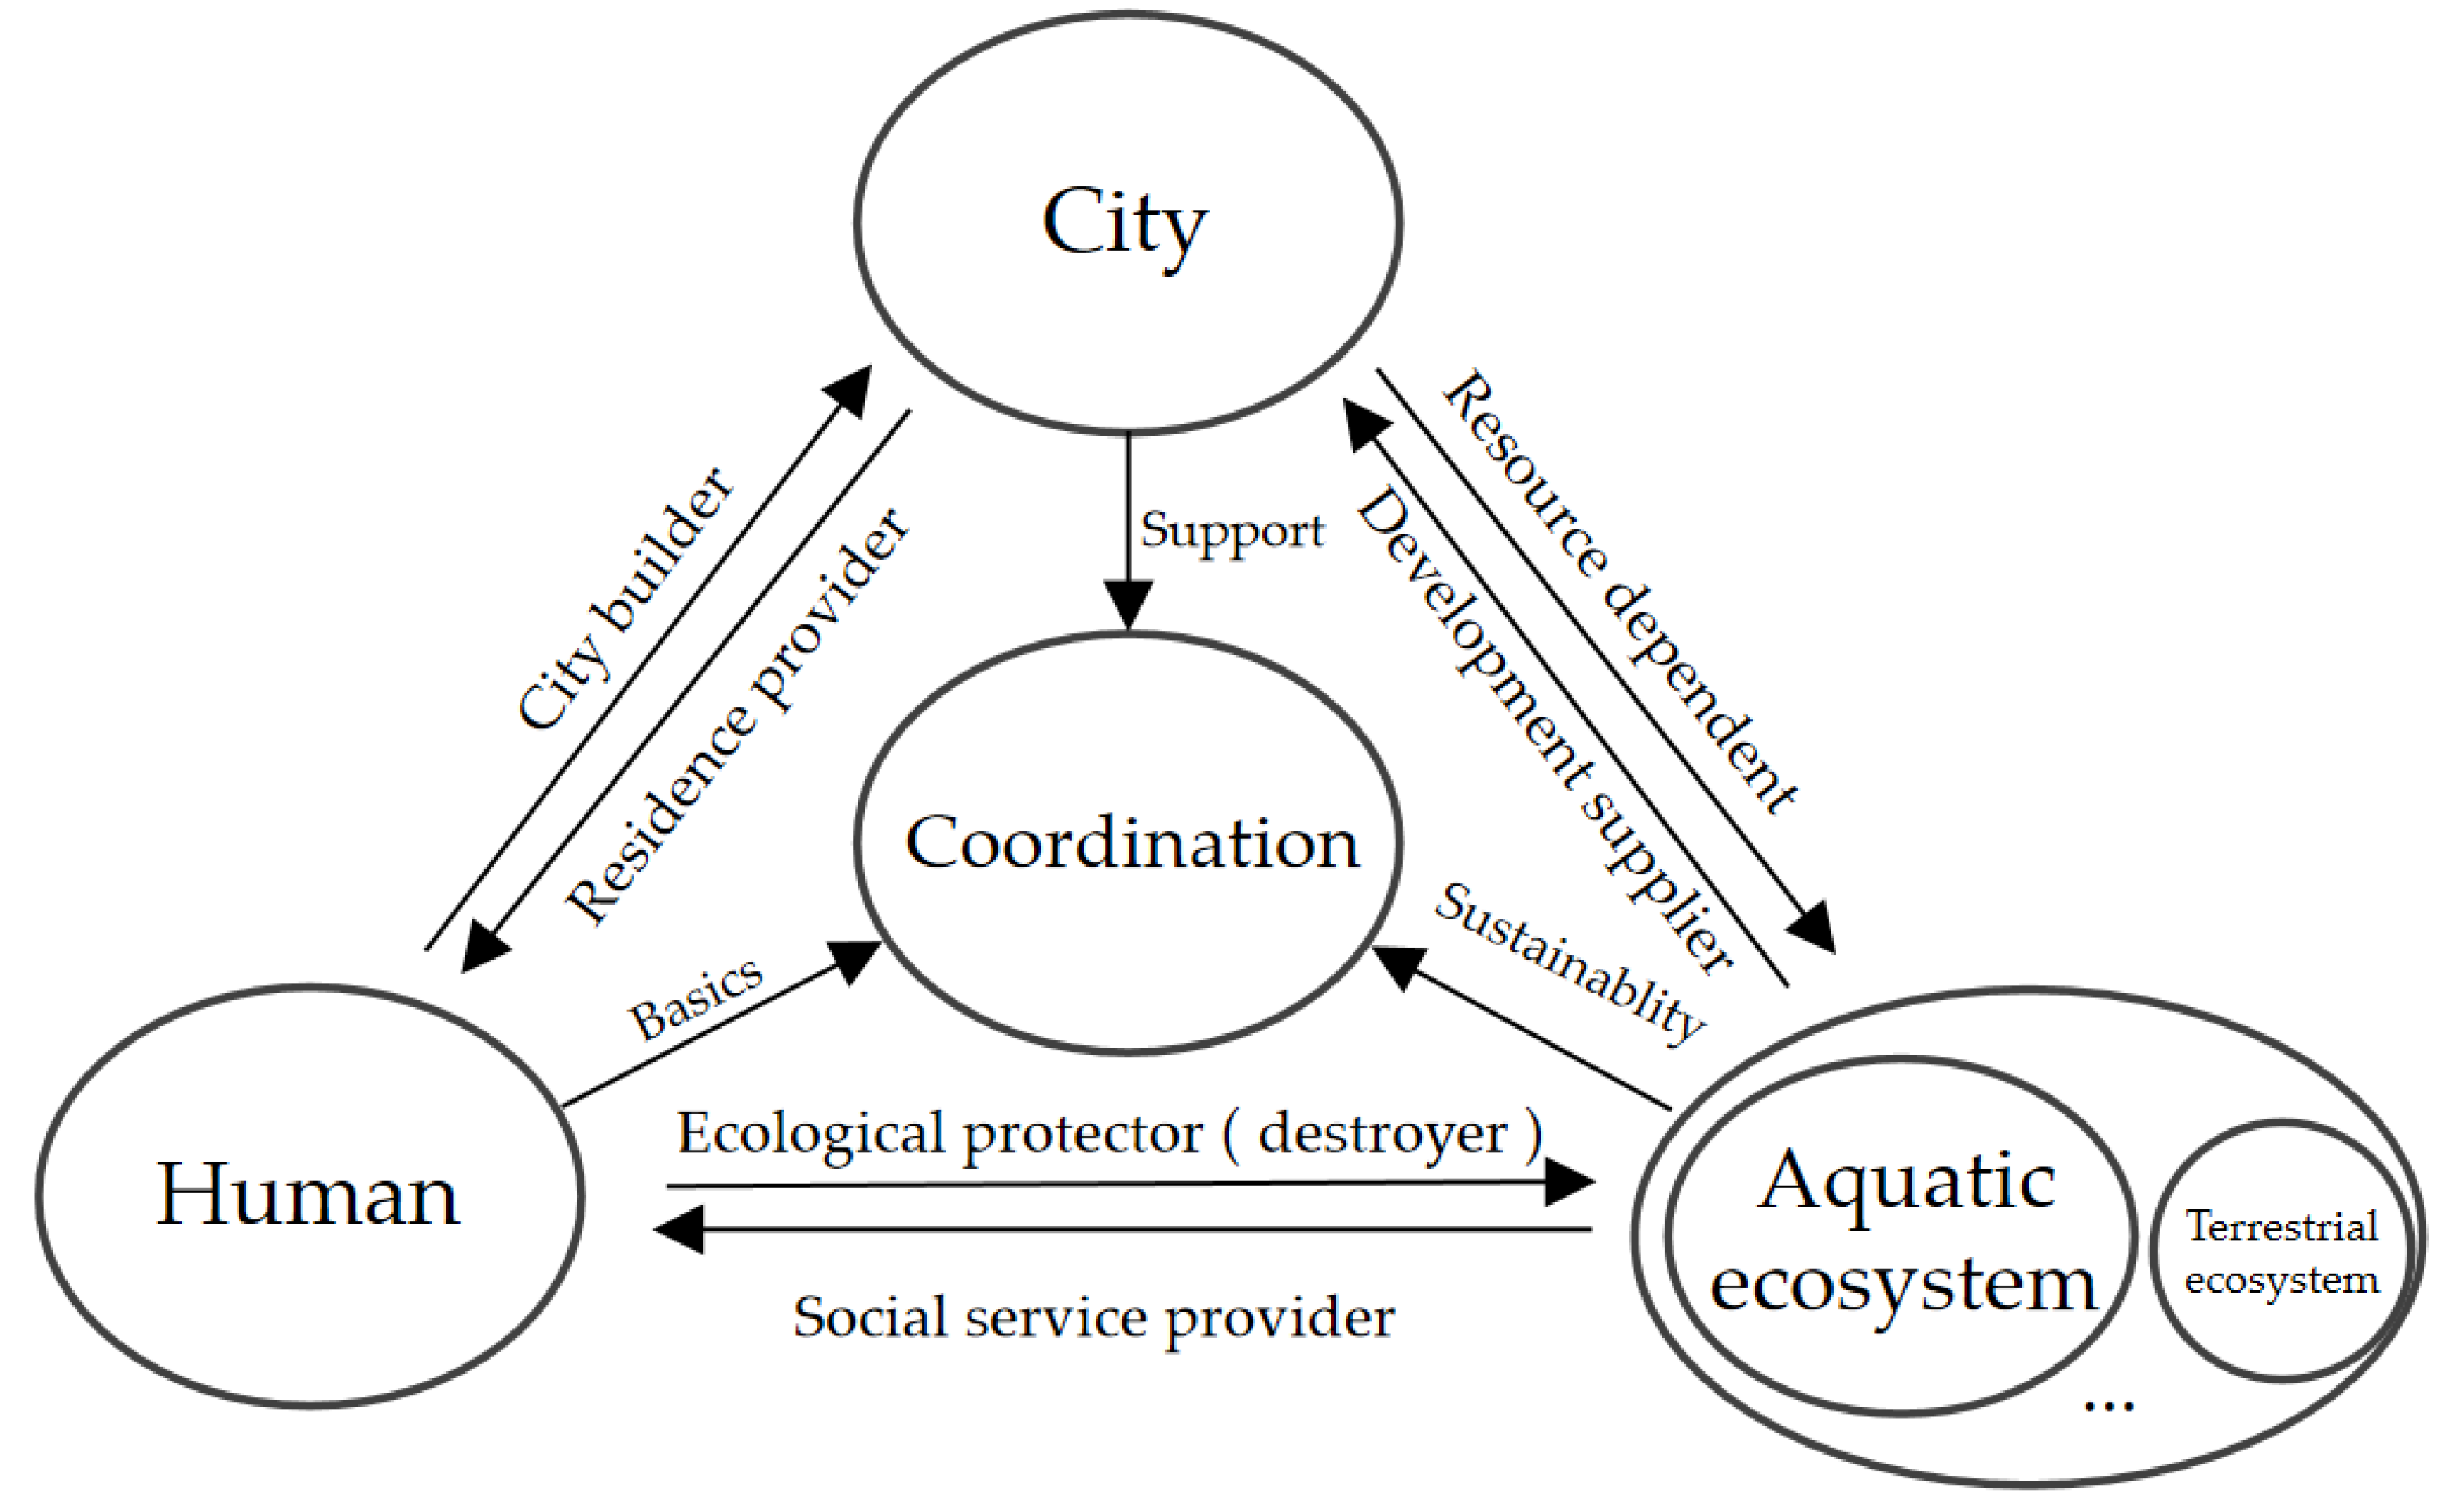
2.2.1. Conception of Urban Aquatic Ecosystem Health
2.2.2. Environmental Condition
2.2.3. Ecological Construction
2.2.4. Social Service
2.2.5. Index System Establishment
2.3. Evaluation Criteria
2.4. Evaluation Methods
- (1)
- Positive index (the larger the index value is, the healthier the aquatic ecosystem is)When xi ≤ Si1, ri1 = 1, ri2 = ri3 = ri4 = ri5 = 0;When Sij < xi < Sij+1, rij = (Sij+1 − xi)/(Sij+1 − Sij), rij+1 = (xi − Sij)/(Sij+1 − Sij), the rest of r are zero;When xi ≥ Si5, ri5 = 1, ri1 = ri2 = ri3 = ri4 = 0.
- (2)
- Negative index (the smaller the index value is, the healthier the aquatic ecosystem is)When xi ≥ Si1, ri1 = 1, ri2 = ri3 = ri4 = ri5 = 0;When Sij+1 < xi < Sij, rij = (xi − Sij+1)/(Sij − Sij+1), rij+1 = (Sij − xi)/(Sij − Sij+1), the rest of r are zero;When xi ≤ Si5, ri5 = 1, ri1 = ri2 = ri3 = ri4 = 0.
3. Results
3.1. Indicator Calculation and Weight Results
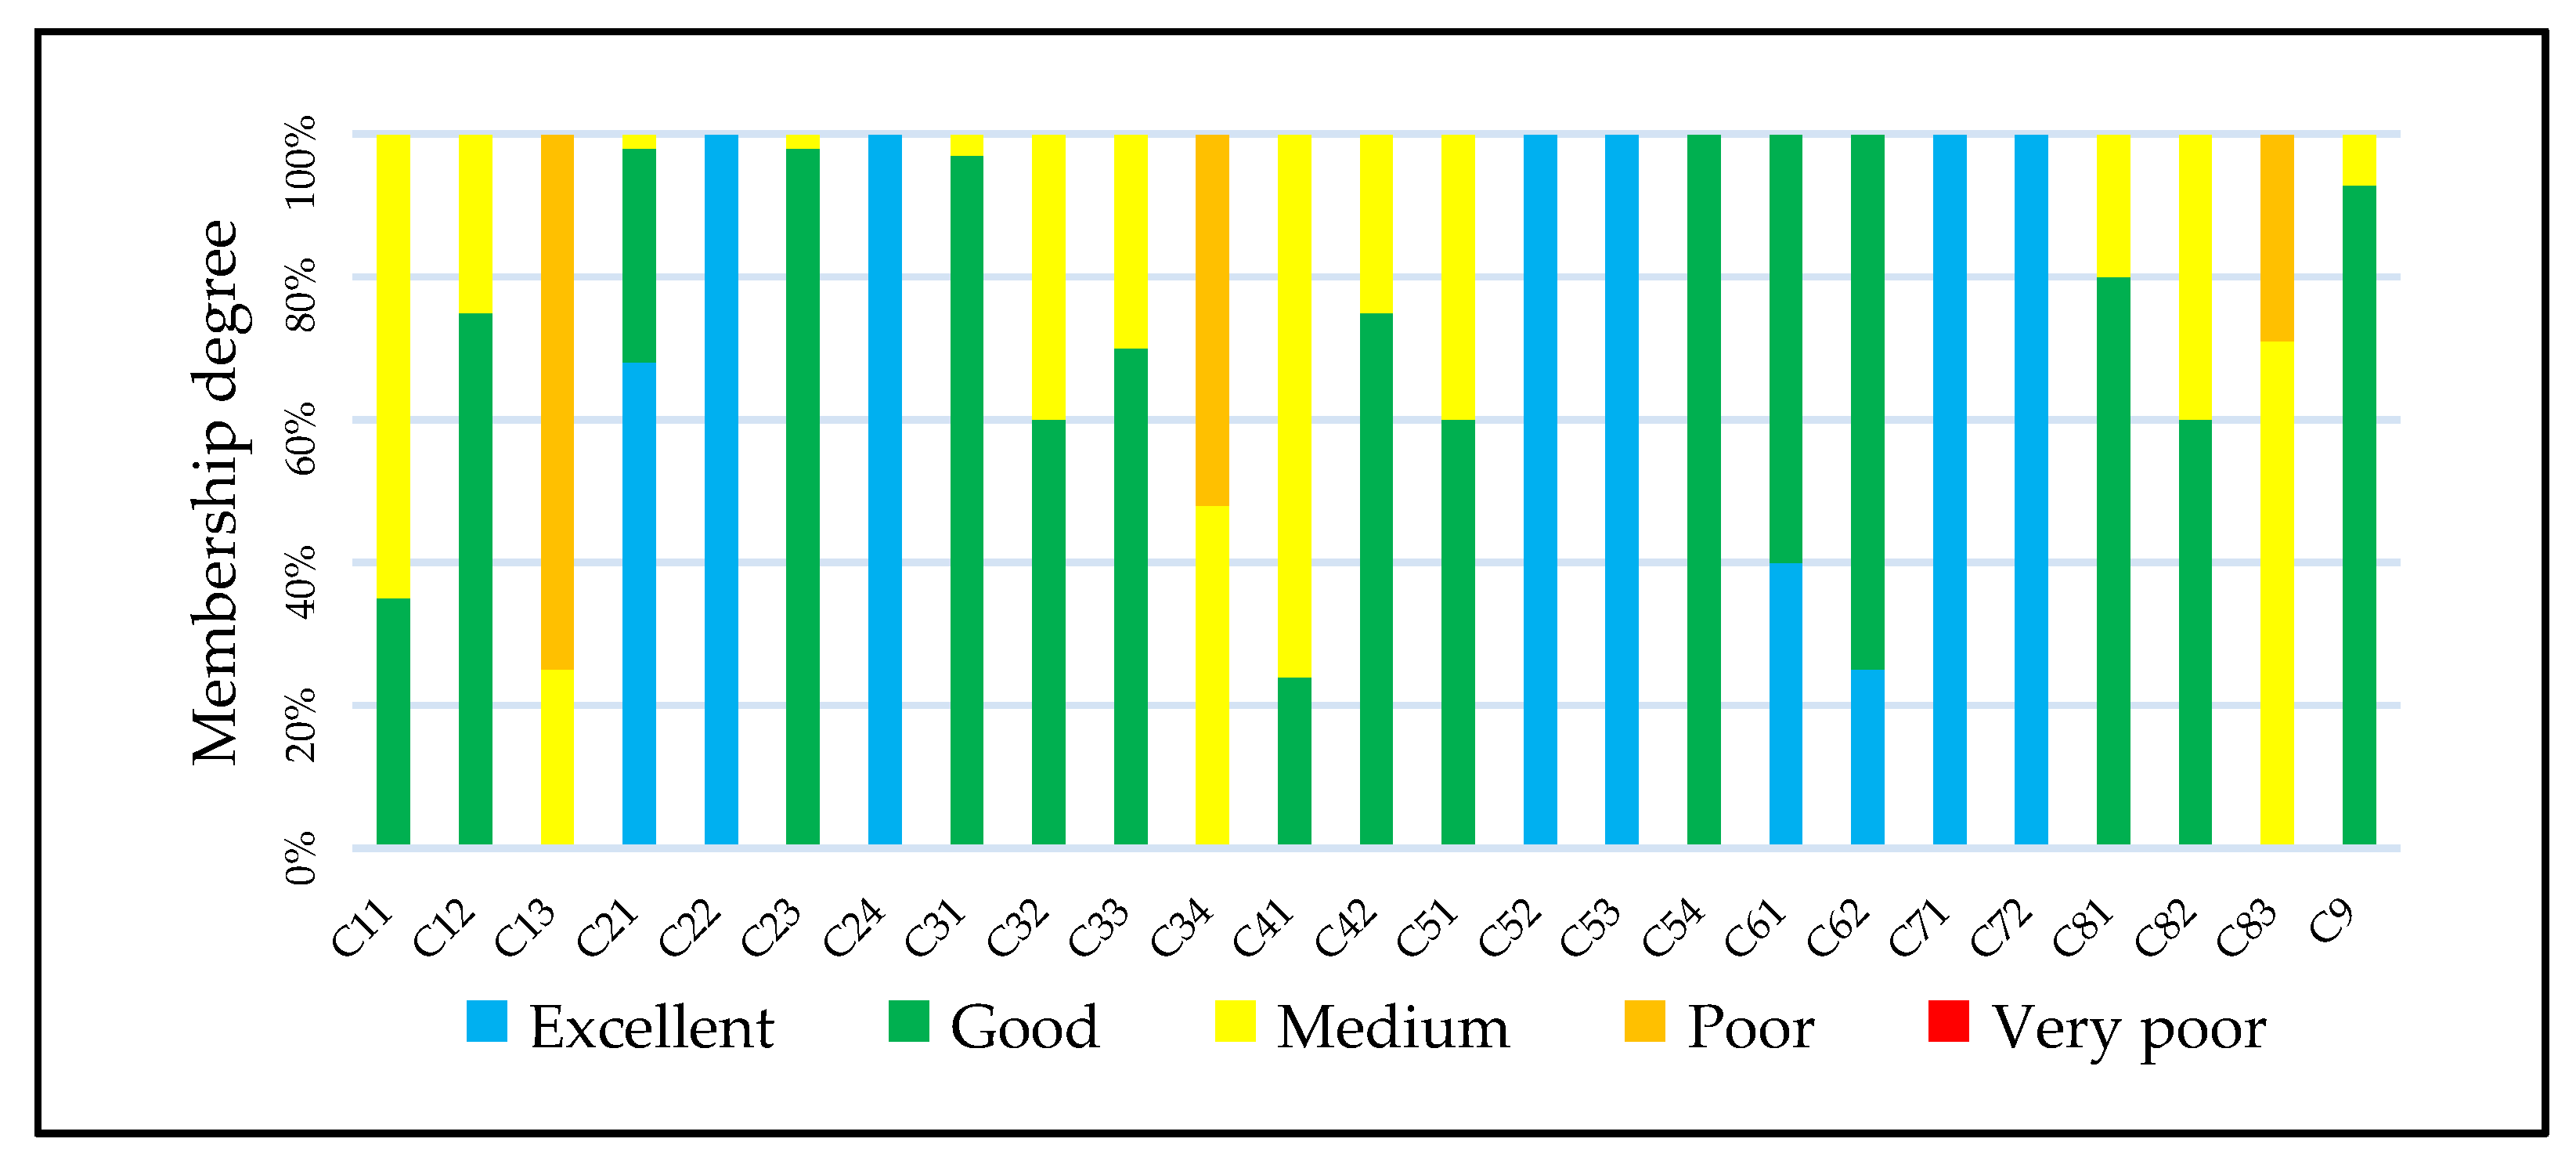
3.2. Evaluation Results
4. Discussion
5. Conclusions
Author Contributions
Funding
Institutional Review Board Statement
Informed Consent Statement
Data Availability Statement
Acknowledgments
Conflicts of Interest
References
- Su, Y.; Li, W.; Liu, L.; Hu, W.; Li, J.; Sun, X.; Li, Y. Health assessment of small-to-medium sized rivers: Comparison between comprehensive indicator method and biological monitoring method. Ecol. Indic. 2021, 126, 107686. [Google Scholar] [CrossRef]
- Moiwo, J.P.; Yang, Y.; Li, H.; Han, S.; Yang, Y. Impact of water resource exploitation on the hydrology and water storage in Baiyangdian Lake. Hydrol. Process. 2010, 24, 3026–3039. [Google Scholar] [CrossRef]
- Kavzolu, T. Determination of environmental degradation due to urbanization and industrialization in Gebze, Turkey. Environ. Eng. Sci. 2008, 25, 429–438. [Google Scholar] [CrossRef]
- Thom, R.; Clair, T.S.; Burns, R.; Anderson, M. Adaptive management of large aquatic ecosystem recovery programs in the United States. J. Environ. Manag. 2016, 183 Pt 2, 424–430. [Google Scholar] [CrossRef] [PubMed]
- Hale, R.; Coleman, R.; Pettigrove, V.; Swearer, S.E. Identifying, preventing and mitigating ecological traps to improve the management of urban aquatic ecosystems. J. Appl. Ecol. 2015, 52, 928–939. [Google Scholar] [CrossRef] [Green Version]
- Stutter, M.I.; Graeber, D.; Evans, C.D.; Wade, A.J.; Withers, P.J.A. Balancing macronutrient stoichiometry to alleviate eutrophication. Sci. Total Environ. 2018, 634, 439–447. [Google Scholar] [CrossRef]
- Lai, Z.; Li, S.; Lv, G.; Pan, Z.; Fei, G. Watershed delineation using hydrographic features and a dem in plain river network region. Hydrol. Process. 2016, 30, 276–288. [Google Scholar] [CrossRef]
- Martínez, B.; María, J.; Hernando, M.D.; Herrera, S.; Gómez, M.J.; Fernández, A.; Amadeo, R.; Bustamante, I. Pilot survey of chemical contaminants from industrial and human activities in river waters of Spain. Int. J. Environ. Anal. Chem. 2010, 90, 321–343. [Google Scholar] [CrossRef]
- Xie, C.; Yang, Y.; Liu, Y.; Liu, G.; Fan, Z.; Li, Y. A Nation-Wide Framework for Evaluating Freshwater Health in China: Background, Administration, and Indicators. Water 2020, 12, 2596. [Google Scholar] [CrossRef]
- Liao, Y.; Li, Y.; Shu, J.; Wan, Z.; Jia, B.; Fan, Z. Water transparency prediction of plain urban river network: A case study of Yangtze river delta in China. Sustainability 2021, 13, 7372. [Google Scholar] [CrossRef]
- Wan, X.; Yang, T.; Zhang, Q.; Yan, X.; Zheng, Y. A novel comprehensive model of set pair analysis with extenics for river health evaluation and prediction of semi-arid basin—A case study of Wei River Basin, China. Sci. Total Environ. 2021, 775, 145845. [Google Scholar] [CrossRef] [PubMed]
- Li, T.; Huang, X.; Jiang, X.; Wang, X. Assessment of ecosystem health of the Yellow River with fish index of biotic integrity. Hydrobiologia 2018, 814, 31–43. [Google Scholar] [CrossRef]
- Qiting, Z.; Hao, C.; Yongyong, Z. Impact factors and health assessment of aquatic ecosystem in Upper and Middle Huai River Basin. J. Hydraul. Eng. 2015, 46, 1019–1027. [Google Scholar]
- Zhang, X.; Meng, Y.; Xia, J.; Wu, B.; She, D. A Combined Model for River Health Evaluation Based Upon the Physical, Chemical, and Biological Elements. Ecol. Indic. 2018, 84, 416–424. [Google Scholar] [CrossRef]
- Chen, J.H.; Kong, Y.J.; Mei, Y.D. Riverine Health Assessment Using Coordinated Development Degree Model Based on Natural and Social Functions in the Lhasa River, China. Int. J. Environ. Res. Public Health 2022, 19, 7182. [Google Scholar] [CrossRef]
- Zhao, Y.W.; Zhou, L.Q.; Dong, B.Q.; Dai, C. Health Assessment for Urban Rivers Based on the Pressure, State and Response Framework-a Case Study of the Shiwuli River. Ecol. Indic. 2019, 99, 324–331. [Google Scholar] [CrossRef]
- Xiong, X.; Xiao, J. Evaluation of coupling coordination between urbanization and eco-environment in six central cities. Acta Ecol. Sin. 2021, 41, 5973–5987. (In Chinese) [Google Scholar]
- Wang, J.; Wang, S.; Li, S.; Feng, K. Coupling analysis of urbanization and energy-environment efficiency: Evidence from Guangdong province. Appl. Energy 2019, 254, 113650. [Google Scholar] [CrossRef]
- Wang, Y.; Jiang, Y.; Han, Z. Pedestrian System Planning Strategies for Enhancing the Vitality of New Towns: A Case Study of Central Jiading New Town. Shanghai Urban Plan. Rev. 2017, 80–87. [Google Scholar] [CrossRef]
- Jiang, L.G.; Liu, Y.; Wu, S.; Yang, C. Analyzing ecological environment change and associated driving factors in China based on NDVI time series data. Ecol. Indic. 2021, 129, 107933. [Google Scholar] [CrossRef]
- Song, J.J. Researches on Water Environmental Problems and Solutions in Chinese Cities. Res. Soil Water Conserv. 2003, 10, 114–116. (In Chinese) [Google Scholar]
- Su, M.; Fath, B.D.; Yang, Z. Urban ecosystem health assessment: A review. Sci. Total Environ. 2010, 408, 2425–2434. [Google Scholar] [CrossRef] [PubMed]
- Wang, P.F.; Wang, C.; Feng, Q.; Qian, J.; Zhou, J.R. Advances in research of urban water ecosystem construction mode. J. Hohai Univ. 2003, 485–489. (In Chinese) [Google Scholar] [CrossRef]
- Strayer, D.L.; Findlay, S.E.G.; Miller, D.; Malcom, H.M.; Fischer, D.T.; Coote, T. Biodiversity in Hudson River shore zones: Influence of shoreline type and physical structure. Aquat. Sci. 2012, 74, 597–610. [Google Scholar] [CrossRef]
- Aumeier, B.M.; Graul, H.; Müller, A.K.; Lackmann, C.; Wünsch, R.; Wintgens, T.; Hollert, H.; Wessling, M. The hydrothermal solution for self-sustaining drinking water purification at point of use. Water Res. 2019, 170, 115338. [Google Scholar] [CrossRef]
- Ma, D.C.; Yu, Z.X.; Gao, J.H.; Wang, F.Q. A study on the development of ecological cities in Beijing based on the evaluation of the value of water ecosystem services. Beijing Water 2021, 220, 1–6. (In Chinese) [Google Scholar]
- Maddock, I. The importance of physical habitat assessment for evaluating river health. Freshw. Biol. 1999, 41, 373–391. [Google Scholar] [CrossRef]
- Han, Q.; Wang, X.G.; Li, Y.; Zhang, Z.X. River ecological corridor: A conceptual framework and review of the spatial management scope. Int. J. Environ. Res. Public Health 2022, 19, 7752. [Google Scholar] [CrossRef]
- Orr, H.G.; Large, A.; Newson, M.D.; Walsh, C.L. A predictive typology for characterising hydromorphology. Geomorphology 2008, 100, 32–40. [Google Scholar] [CrossRef]
- Li, Y.; Dai, J.Y.; Fan, Z.W.; Wang, X.G. Health connotation and management key issues of river and lake. China Water Resour. 2020, 888, 17–20. (In Chinese) [Google Scholar]
- Li, Y.; Li, C.; Wang, X.; Xie, C.; Geng, L.; Zhu, L.; Bian, J.; Wang, Z. Construction and consideration of the indicator framework for evaluation river and lake health. China Water Resour. 2020, 4–7. (In Chinese) [Google Scholar] [CrossRef]
- Cheng, G.; Liu, J.; Han, C.; Wang, Z.; Shuang, H. Optimized water surface ratio and pervious surface proportion in urbanized riverside areas. Environ. Earth Sci. 2014, 72, 569–576. [Google Scholar]
- Cui, G.; Chen, X.; Xiang, L.; Zhang, Q.; Xu, Q. Evaluation of water environment improvement by interconnected river network in plain area. J. Hydraul. Eng. 2017, 48, 1429–1437. [Google Scholar]
- Yu, Q.; Zhou, R.; Wang, Y.; Feng, T.; Li, H. Corpse decomposition increases nitrogen pollution and alters the succession of nirK-type denitrifying communities in different water types. Sci. Total Environ. 2020, 747, 141472. [Google Scholar] [CrossRef] [PubMed]
- Telliard, W.A.; Rubin, M.B.; Rushneck, D.R. Control of Pollutants in Waste Water. J. Chromatogr. Sci. 1987, 25, 322–327. [Google Scholar] [CrossRef]
- Xue, L.; Hou, P.; Zhang, Z.; Shen, M.; Yang, L. Application of systematic strategy for agricultural non-point source pollution control in Yangtze River basin, China. Agric. Ecosyst. Environ. 2020, 304, 107148. [Google Scholar] [CrossRef]
- Morrison, G.; Fatoki, O.; Persson, L.; Ekberg, A. Assessment of the impact of point source pollution from the Keiskammahoek Sewage Treatment Plant on the Keiskamma River—pH, electrical conductivity, oxygen-demanding substance (COD) and nutrients. Water Sa 2001, 27, 475–480. [Google Scholar] [CrossRef]
- Fu, G. A fuzzy optimization method for multicriteria decision making: An application to reservoir flood control operation. Expert Syst. Appl. 2008, 34, 145–149. [Google Scholar] [CrossRef]
- Zhang, Q.; Wu, Z.; Guo, G.; Zhang, H.; Tarolli, P. Explicit the urban waterlogging spatial variation and its driving factors: The stepwise cluster analysis model and hierarchical partitioning analysis approach. Sci. Total Environ. 2020, 763, 143041. [Google Scholar] [CrossRef]
- Qian, J.Z.; Ru, L.; Wang, J.Q.; Yu, X.L. Environmental health risk assessment for urban water supply source. J. Hydraul. Eng. 2004, 90–93. (In Chinese) [Google Scholar] [CrossRef]
- Mcmahon, J.M.; Olley, J.M.; Brooks, A.P.; Smart, J.C.R.; Stout, J.C. Vegetation and longitudinal coarse sediment connectivity affect the ability of ecosystem restoration to reduce riverbank erosion and turbidity in drinking water. Sci. Total Environ. 2020, 707, 135904. [Google Scholar] [CrossRef] [PubMed]
- Peng, B.; Wang, H.; Wang, R.; Han, Y.; Huang, W.; Zhu, Y. Development of a River Health Assessment System for the Lower Yellow River. J. Hydroecol. 2014, 35, 81–87. [Google Scholar]
- Zhang, L.J.; Sun, C.Z.; Xin, X.B.; Kong, Q.Y. Assessment of forest function in beijing jiulong mountain based on improved TOPSIS method. For. Res. 2014, 27, 644–650. (In Chinese) [Google Scholar]
- Zhu, W.; Xia, T.; Jiang, M.Y.; Zhao, L.F. Comprehensive assessment of water environment for urban stream. Adv. Water Sci. 2007, 80, 736–744. (In Chinese) [Google Scholar]
- Chu, K.J.; Kan, L.J.; Hua, Z.L.; Liu, X.D. Construction and application of an indicator system for assessment of river ecosystem in plain tributary networks. J. Hydroelectr. Eng. 2014, 33, 138–144. (In Chinese) [Google Scholar]
- Du, C.Y. Dynamic Evaluation of Sustainable Water Resource Systems in Metropolitan Areas: A Case Study of the Beijing Megacity. Water 2020, 12, 2629. [Google Scholar] [CrossRef]
- Saaty, T.L.; Kearns, K.P. The Analytic Hierarchy Process. Anal. Plan. 1985. [Google Scholar] [CrossRef]
- Deng, X.J.; Xu, Y.P.; Zhai, L.X.; Li, Y. Establishment and application of the index system for urban river health assessment. Acta Ecol. Sin. 2014, 34, 993–1001. (In Chinese) [Google Scholar]
- Zhao, Y.W.; Yang, Z.F. Integrative fuzzy hierarchical model for river health assessment: A case study of Yong River in Ningbo City, China. Commun. Nonlinear Sci. Numer. Simul. 2009, 14, 1729–1736. [Google Scholar] [CrossRef]
- Lai, C.G.; Chen, X.H.; Chen, X.Y.; Wang, Z.L.; Wu, X.S.; Zhao, S.W. A fuzzy comprehensive evaluation model for flood risk based on the combination weight of game theory. Nat. Hazards 2015, 77, 1243–1259. [Google Scholar] [CrossRef]


| Target Layer | Criterion Layer (Weights) | Sub-Criterion Layer (Weights) | Index Layer | Index Weights | |||
|---|---|---|---|---|---|---|---|
| The Weights Relative to the Sub-Criteria Layer | The Weights Relative to the Criterion Layer | The Weights Relative to the Target Layer | Ranking | ||||
| A Urban aquatic ecosystem | B1 Environmental condition (0.3865) | C1 Water space (0.2626) | C11 Urban water surface area ratio | 0.2736 | 0.0719 | 0.0278 | 16 |
| C12 River connectivity | 0.4762 | 0.1251 | 0.0483 | 6 | |||
| C13 River complexity | 0.2502 | 0.0657 | 0.0254 | 19 | |||
| C2 Aquatic environment (0.3258) | C21 Water quality | 0.3308 | 0.1078 | 0.0417 | 7 | ||
| C22 Sediment pollution | 0.2144 | 0.0699 | 0.0270 | 17 | |||
| C23 Self-purification ability | 0.3020 | 0.0984 | 0.0380 | 10 | |||
| C24 Guarantee rate of ecological water level | 0.1527 | 0.0498 | 0.0192 | 21 | |||
| C3 Aquatic organism (0.4115) | C31 Phytoplankton diversity | 0.3048 | 0.1254 | 0.0485 | 5 | ||
| C32 Zooplankton diversity | 0.2556 | 0.1052 | 0.0407 | 9 | |||
| C33 Fish diversity | 0.2057 | 0.0847 | 0.0327 | 14 | |||
| C34 Benthic macroinvertebrate diversity | 0.2338 | 0.0962 | 0.0372 | 11 | |||
| B2 Ecological construction (0.1726) | C4 Ecological protection (0.4345) | C41 Proportion of ecological revetment construction | 0.4494 | 0.1953 | 0.0337 | 13 | |
| C42 Governance of illegal use of water shoreline | 0.5506 | 0.2392 | 0.0413 | 8 | |||
| C5 Water pollution control (0.5655) | C51 Annual chemical fertilizer use control | 0.1857 | 0.1050 | 0.0181 | 22 | ||
| C52 Domestic sewage treatment rate | 0.2677 | 0.1514 | 0.0261 | 18 | |||
| C53 Industrial wastewater discharge rate | 0.2982 | 0.1686 | 0.0291 | 15 | |||
| C54 Large-scale aquaculture sewage treatment rate | 0.2484 | 0.1404 | 0.0242 | 20 | |||
| B3 Social service (0.4410) | C6 Flood and waterlogging control (0.4624) | C61 Flood control compliance rate | 0.6250 | 0.2890 | 0.1274 | 1 | |
| C62 Waterlogging control compliance rate | 0.3750 | 0.1734 | 0.0765 | 4 | |||
| C7 Water supply (0.3718) | C71 Water quality compliance rate | 0.5327 | 0.1981 | 0.0873 | 2 | ||
| C72 Water supply guarantee rate | 0.4673 | 0.1737 | 0.0766 | 3 | |||
| C8 Water landscape (0.0870) | C81 Water surface cleanliness | 0.3929 | 0.0342 | 0.0151 | 24 | ||
| C82 Water sensory transparency | 0.4480 | 0.0390 | 0.0172 | 23 | |||
| C83 Riverbank connectivity | 0.1591 | 0.0138 | 0.0061 | 25 | |||
| C9 Public satisfaction (0.0789) | C9 Public satisfaction | 1.0000 | 0.0789 | 0.0348 | 12 | ||
| Indexes (Units) | Excellent | Good | Medium | Poor | Very Poor |
|---|---|---|---|---|---|
| C11 (%) | 12 | 10 | 8 | 6 | 4 |
| C12 (%) | 100 | 80 | 60 | 40 | 0 |
| C13 | 1.14 | 1.12 | 1.08 | 1.04 | 1.02 |
| C21 | I–III | IV | V | Inferior V | Black-odorous water |
| C22 | 1 | 1.5 | 2 | 2.5 | 3 |
| C23 (mg/L) | 7.5 | 6 | 5 | 3.5 | 0 |
| C24 (%) | 95 | 90 | 85 | 80 | 75 |
| C31 | 3 | 2 | 1 | 0.5 | 0 |
| C32 | 3 | 2 | 1 | 0.5 | 0 |
| C33 | 3 | 2 | 1 | 0.5 | 0 |
| C34 | 3 | 2 | 1 | 0.5 | 0 |
| C41 (%) | 100 | 80 | 60 | 40 | 0 |
| C42 (%) | 100 | 80 | 60 | 40 | 0 |
| C51 (%) | 10 | 5 | 0 | −5 | −10 |
| C52 (%) | 95 | 90 | 85 | 80 | 75 |
| C53 (%) | 100 | 95 | 90 | 85 | 80 |
| C54 (%) | 95 | 90 | 85 | 80 | 75 |
| C61 (%) | 95 | 90 | 85 | 80 | 50 |
| C62 (%) | 100 | 80 | 60 | 50 | 40 |
| C71 (%) | 95 | 80 | 65 | 50 | 40 |
| C72 (%) | 95 | 85 | 60 | 40 | 20 |
| C81 (m2) | 0.5 | 1 | 2 | 3 | 4 |
| C82 (cm) | 80 | 60 | 40 | 30 | 20 |
| C83 (%) | 90 | 80 | 60 | 50 | 40 |
| C9 (grade) | 95 | 85 | 60 | 40 | 0 |
| Indexes (Units) | Calculations | Data Sources |
|---|---|---|
| C11 (%) | Surface area under normal water level/study area × 100% (by Remote sensing) | Water conservancy bureau |
| C12 (%) | Average annual opening time percentage of sluice | |
| C13 | River length/length of a straight line from the beginning to the end of a river (by Remote sensing) | |
| C21 | Evaluation of dissolved oxygen, ammonia nitrogen, biochemical oxygen demand, permanganate index, total phosphorus, total nitrogen (Environmental Quality Standards for Surface Water GB 3838-2002 and Technical Specifications for Automatic Monitoring of Surface Water HJ 915-2017) | Hydrographic office |
| C22 | Concentration of maximum pollutants in sediment/corresponding standard value | Field investigation |
| C23 (mg/L) | Dissolved oxygen concentration | Hydrographic office |
| C24 (%) | Proportion of control section samples with ten-day average water level greater than or equal to guarantee target | Water conservancy bureau |
| C31 | Shannon-Wiener biodiversity index [26] | Field investigation |
| C32 | ||
| C33 | ||
| C34 | ||
| C41 (%) | Length of ecological shoreline for river reconstruction/total length of river shoreline × 100% | Water conservancy bureau |
| C42 (%) | The number of shorelines used in regulated illegal waters/number of illegal use × 100% | |
| C51 (%) | (Fertilizer use in previous period/fertilizer use in the current period−1) × 100% | Water conservancy |
| C52 (%) | Domestic sewage treatment quantity/total amount of sewage × 100% | |
| C53 (%) | Standard industrial wastewater discharge/total amount of sewage × 100% | |
| C54 (%) | Sewage treatment amount of large-scale aquaculture/total amount of sewage × 100% | |
| C61 (%) | The embankment length reached the flood control project/total length of embankment × 100% | Hydrographic office |
| C62 (%) | Weighted average of each polder area meeting flood control standard | |
| C71 (%) | Number of qualified drinking water sources/total drinking water sources × 100% | Hydrographic office |
| C72 (%) | Number of days reaching guaranteed water level or flow/365 × 100% | |
| C81 (m2) | Cumulative area of surface garbage per 5000 m2 water area | Field investigation |
| C82 (cm) | Measure transparency of observation section by secchi disc | |
| C83 (%) | River-lake shoreline penetration length/total length of river and lake shoreline × 100% | Hydrographic office |
| C9 (grade) | The proportion of the people whose scores on the questionnaire including water scape, flood control, drinking water and other indicators that reflect people’s needs are more than the “satisfactory” level | Questionnaire |
| Indexes (Units) | Results | Indexes (Units) | Results |
|---|---|---|---|
| C11 (%) | 8.7 | C51 (%) | 3 |
| C12 (%) | 75 | C52 (%) | 95 |
| C13 | 1.05 | C53 (%) | 100 |
| C21 | III 67.82% IV 29.88% V 2.30% | C54 (%) | 90 |
| C22 | 0.9 | C61 (%) | 92 |
| C23 (mg/L) | 5.98 | C62 (%) | 85 |
| C24 (%) | 95 | C71 (%) | 100 |
| C31 | 1.97 (Major creatures: Skeletonema sp. and Merismopedia convolute) | C72 (%) | 95 |
| C32 | 1.60 (Major creatures: Diaphanosoma brachyurum) | C81 (m2) | 1.2 |
| C33 | 1.70 | C82 (cm) | 52 |
| C34 | 0.74 (Major creatures: Limnodrilus hoffmeisteri and Bellamya aeruginosa) | C83 (%) | 57.1 |
| C41 (%) | 64.8 | C9 (grade) | 83.2 |
| C42 (%) | 75 |
| Factors | Excellent | Good | Medium | Poor | Very Poor | Evaluation Grade | ||
|---|---|---|---|---|---|---|---|---|
| A | B1 | C1 | 0 | 0.4529 | 0.3594 | 0.1877 | 0 | Good |
| C2 | 0.5921 | 0.3952 | 0.0127 | 0 | 0 | Excellent | ||
| C3 | 0 | 0.5930 | 0.2854 | 0.1216 | 0 | Good | ||
| Overall situation | 0.1929 | 0.4918 | 0.2160 | 0.0993 | 0 | Good | ||
| B2 | C4 | 0 | 0.5208 | 0.4792 | 0 | 0 | Good | |
| C5 | 0.5659 | 0.3598 | 0.0743 | 0 | 0 | Excellent | ||
| Overall situation | 0.3200 | 0.4298 | 0.2502 | 0 | 0 | Good | ||
| B3 | C6 | 0.3438 | 0.6562 | 0 | 0 | 0 | Good | |
| C7 | 1 | 0 | 0 | 0 | 0 | Excellent | ||
| C8 | 0 | 0.5832 | 0.3707 | 0.0461 | 0 | Good | ||
| C9 | 0 | 0.9280 | 0.0720 | 0 | 0 | Good | ||
| Overall situation | 0.5307 | 0.4273 | 0.0380 | 0.0040 | 0 | Excellent | ||
| Overall situation | 0.3638 | 0.4527 | 0.1434 | 0.0402 | 0 | Good | ||
Publisher’s Note: MDPI stays neutral with regard to jurisdictional claims in published maps and institutional affiliations. |
© 2022 by the authors. Licensee MDPI, Basel, Switzerland. This article is an open access article distributed under the terms and conditions of the Creative Commons Attribution (CC BY) license (https://creativecommons.org/licenses/by/4.0/).
Share and Cite
Ding, R.; Yu, K.; Fan, Z.; Liu, J. Study and Application of Urban Aquatic Ecosystem Health Evaluation Index System in River Network Plain Area. Int. J. Environ. Res. Public Health 2022, 19, 16545. https://doi.org/10.3390/ijerph192416545
Ding R, Yu K, Fan Z, Liu J. Study and Application of Urban Aquatic Ecosystem Health Evaluation Index System in River Network Plain Area. International Journal of Environmental Research and Public Health. 2022; 19(24):16545. https://doi.org/10.3390/ijerph192416545
Chicago/Turabian StyleDing, Rui, Kai Yu, Ziwu Fan, and Jiaying Liu. 2022. "Study and Application of Urban Aquatic Ecosystem Health Evaluation Index System in River Network Plain Area" International Journal of Environmental Research and Public Health 19, no. 24: 16545. https://doi.org/10.3390/ijerph192416545