
Urbanization Impact on Regional Sustainable Development: Through the Lens of Urban-Rural Resilience


Abstract
:1. Introduction
2. Materials and Methods
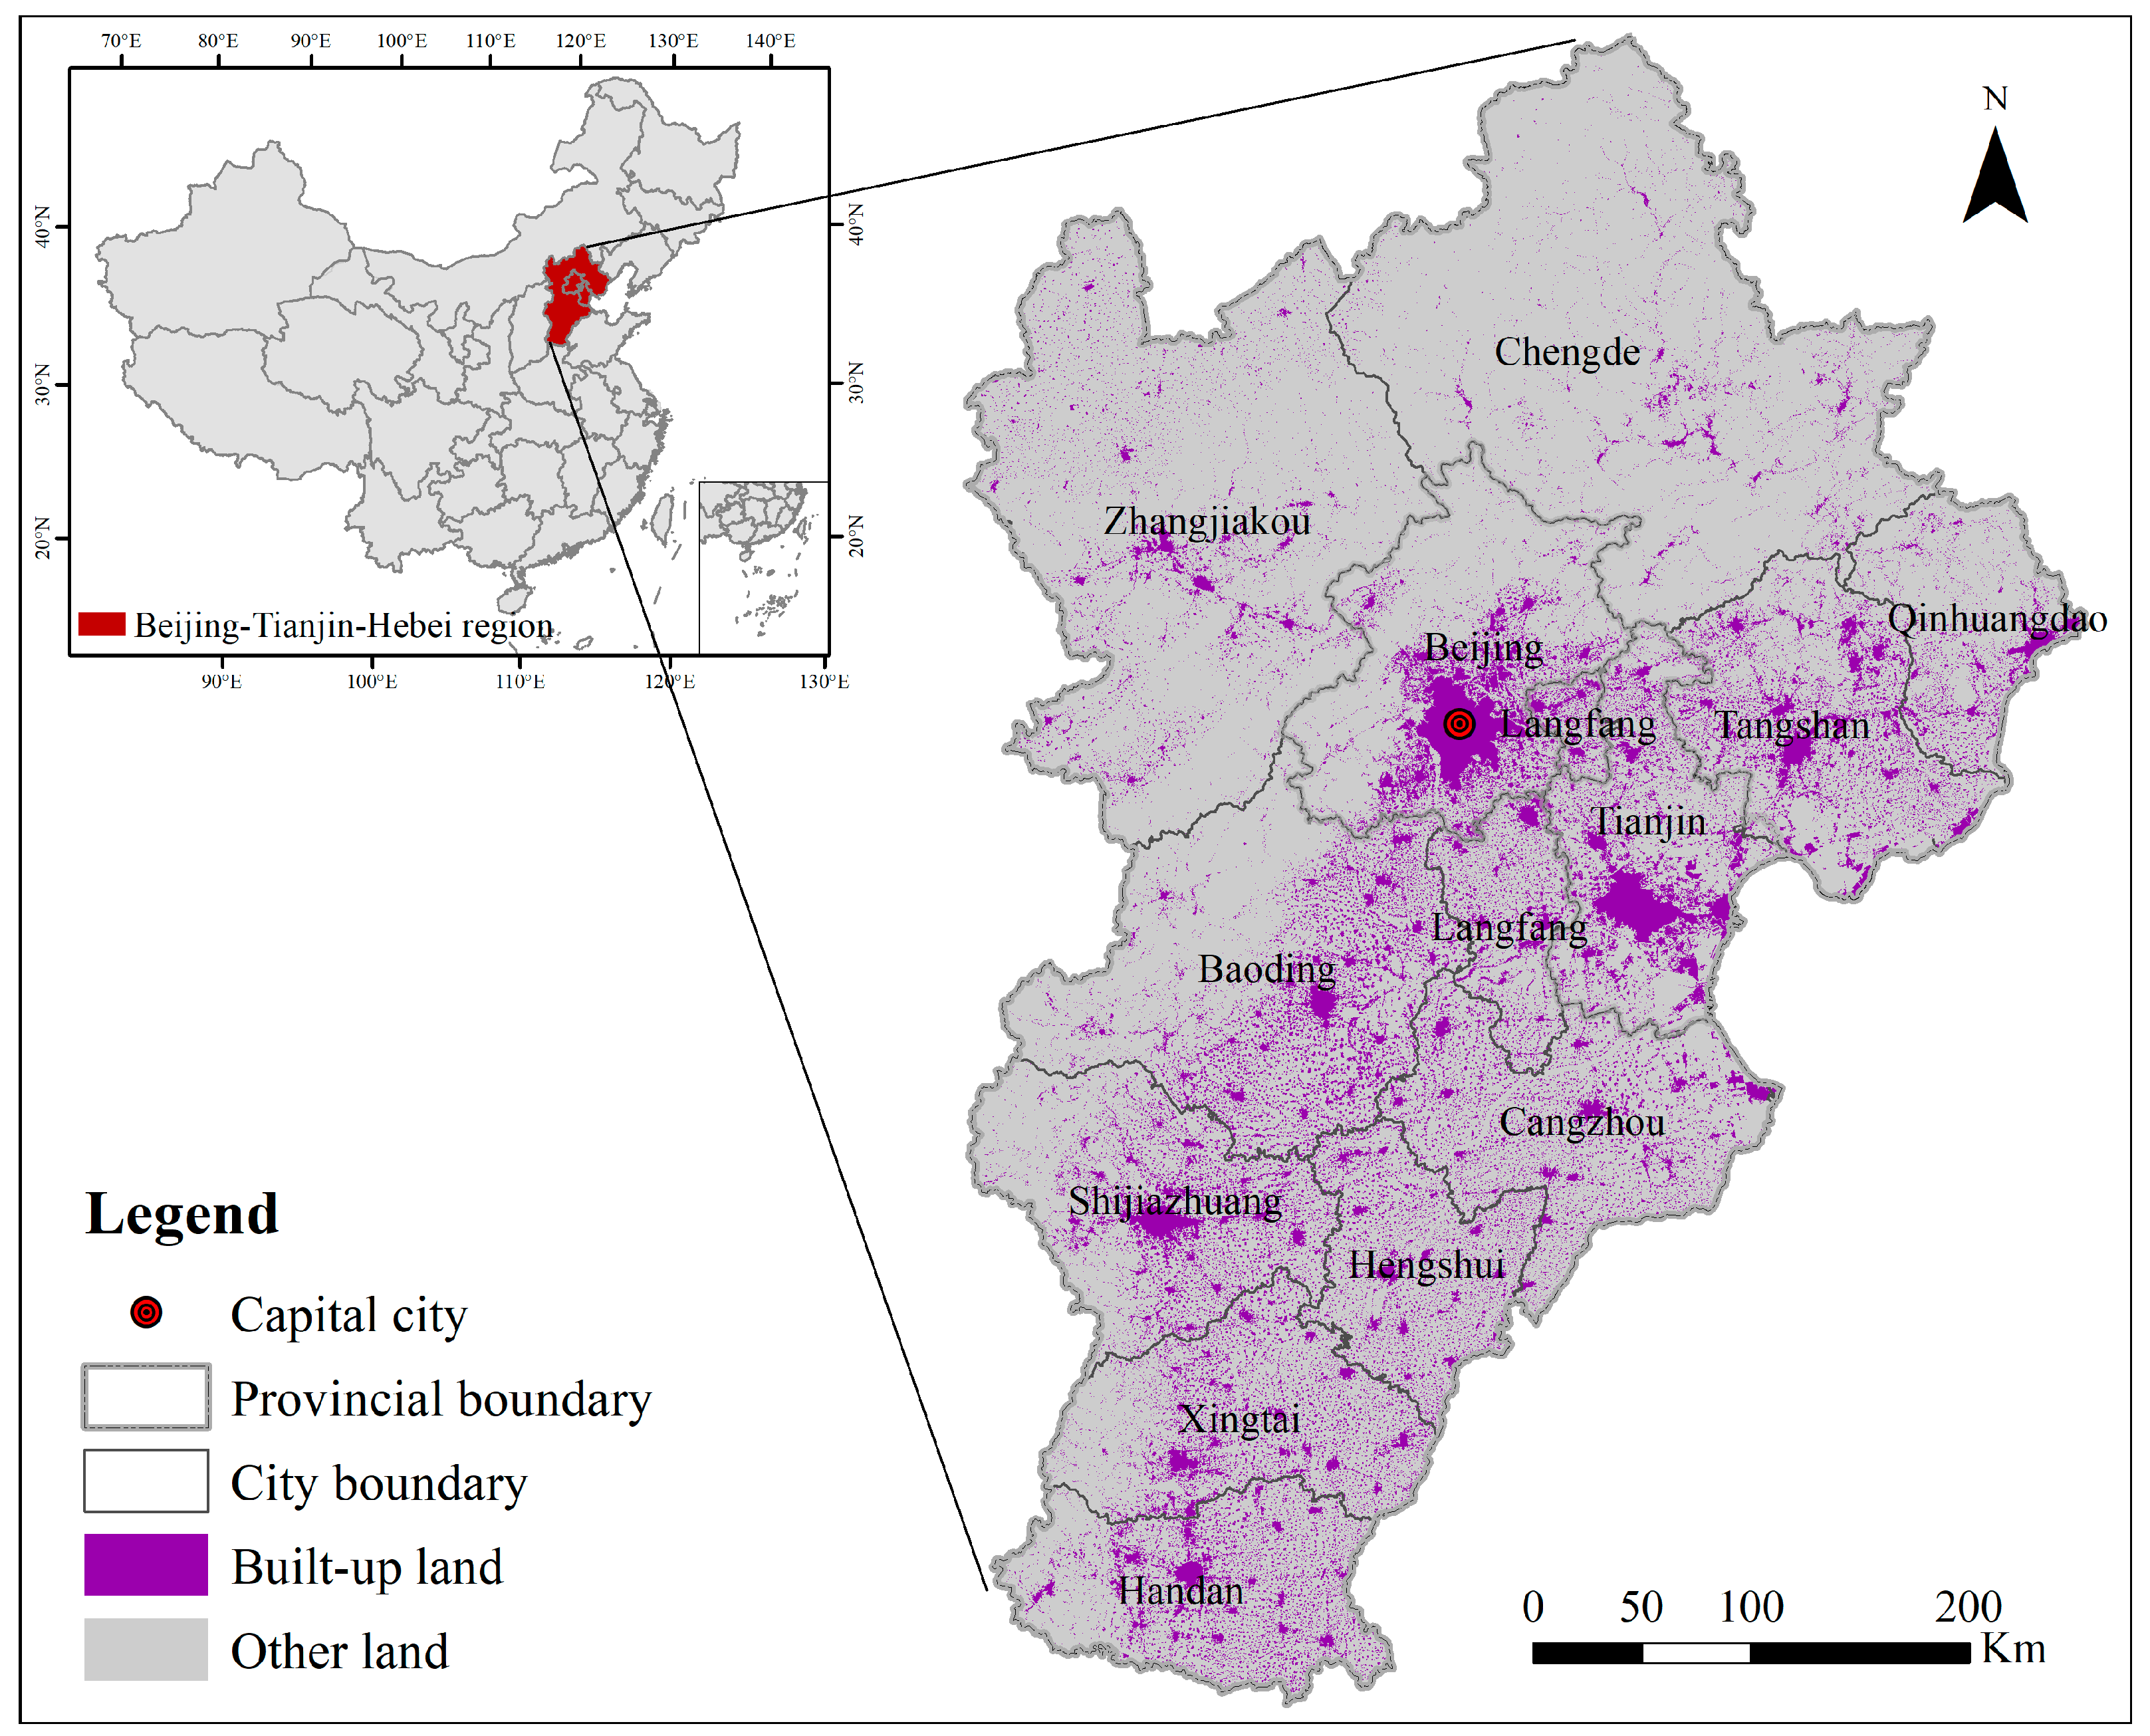
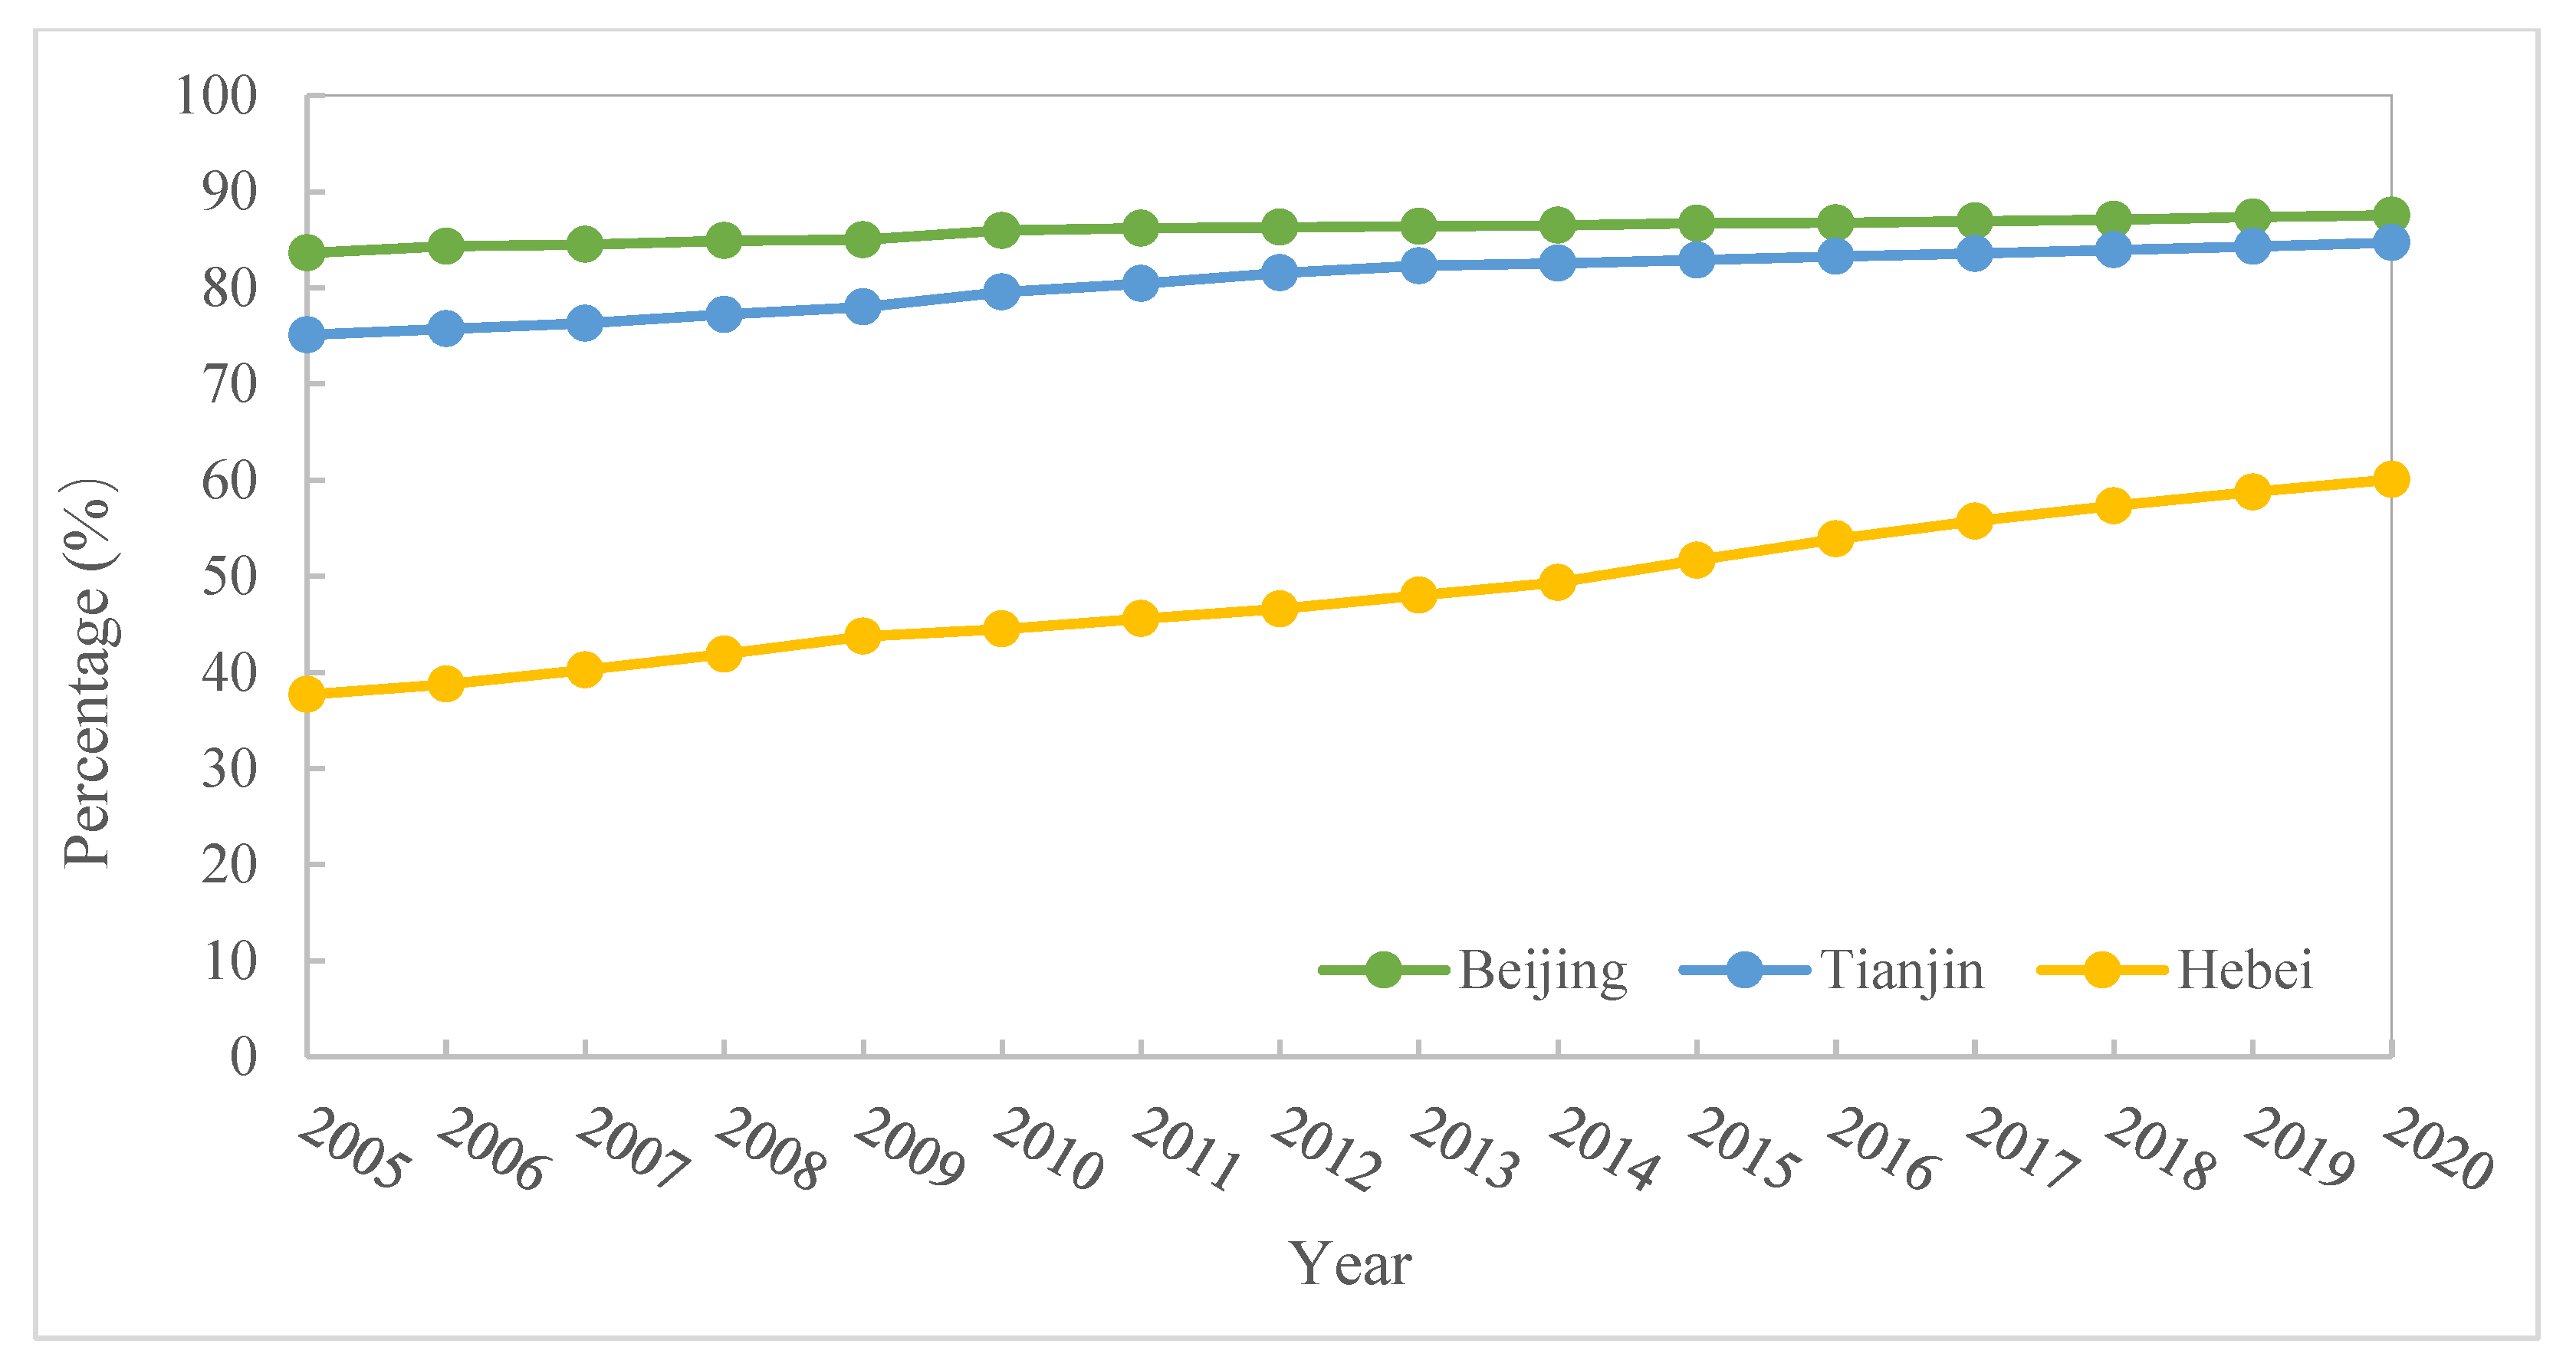
2.1. Case Study
2.2. Data Source
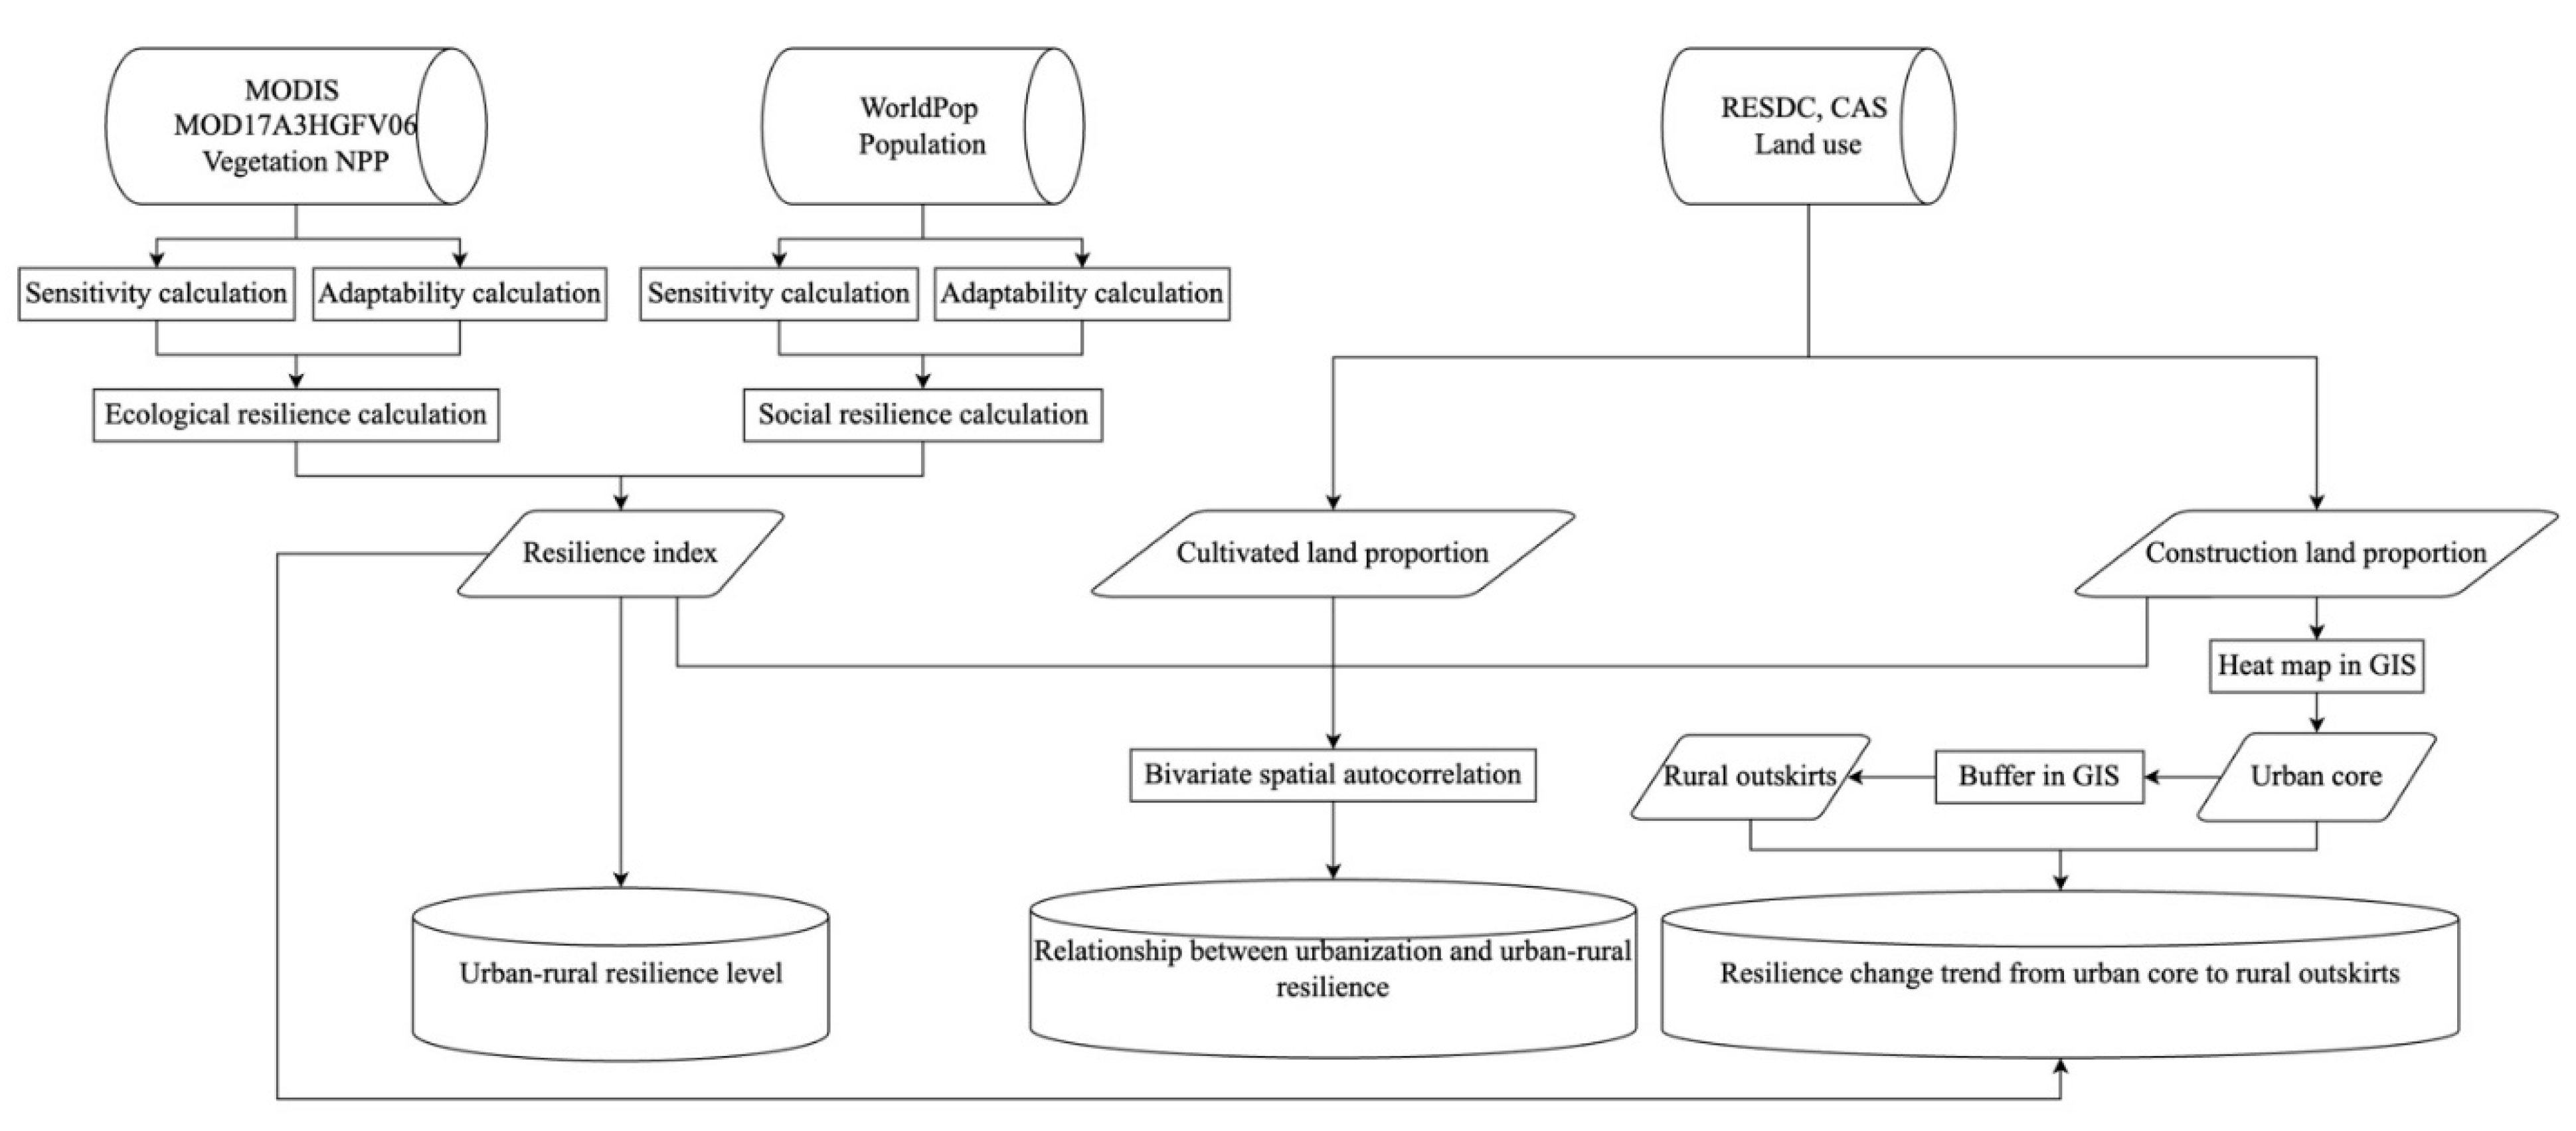
2.3. Method
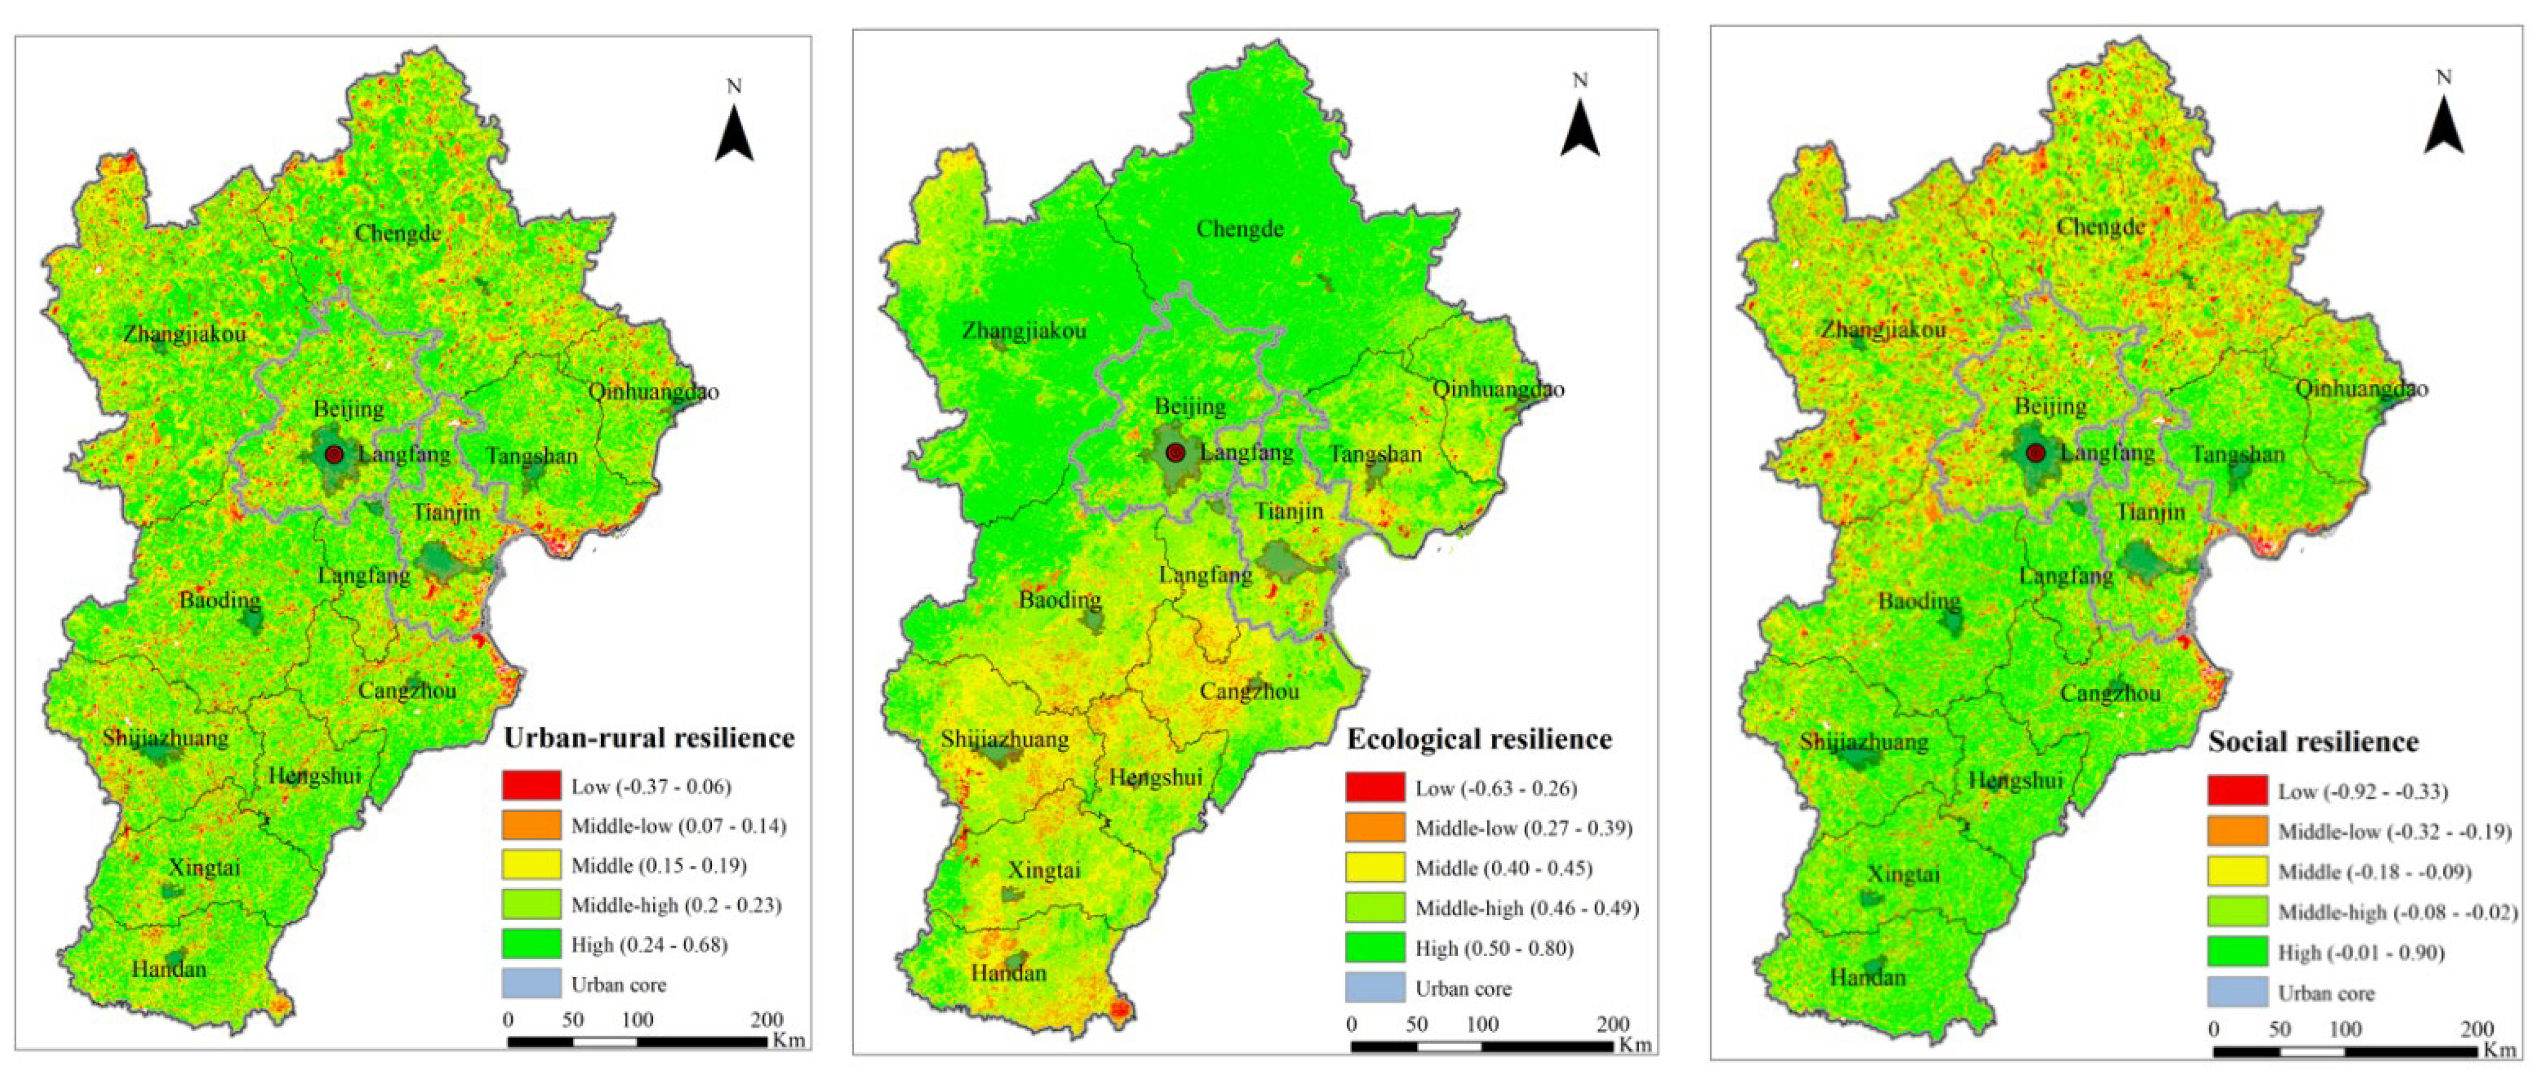
3. Urban–Rural Resilience in Beijing-Tianjin-Hebei Urban Agglomeration
4. Land Use Change Impact on Urban–Rural System Resilience
4.1. Relationship between Urbanization and Urban–Rural Resilience
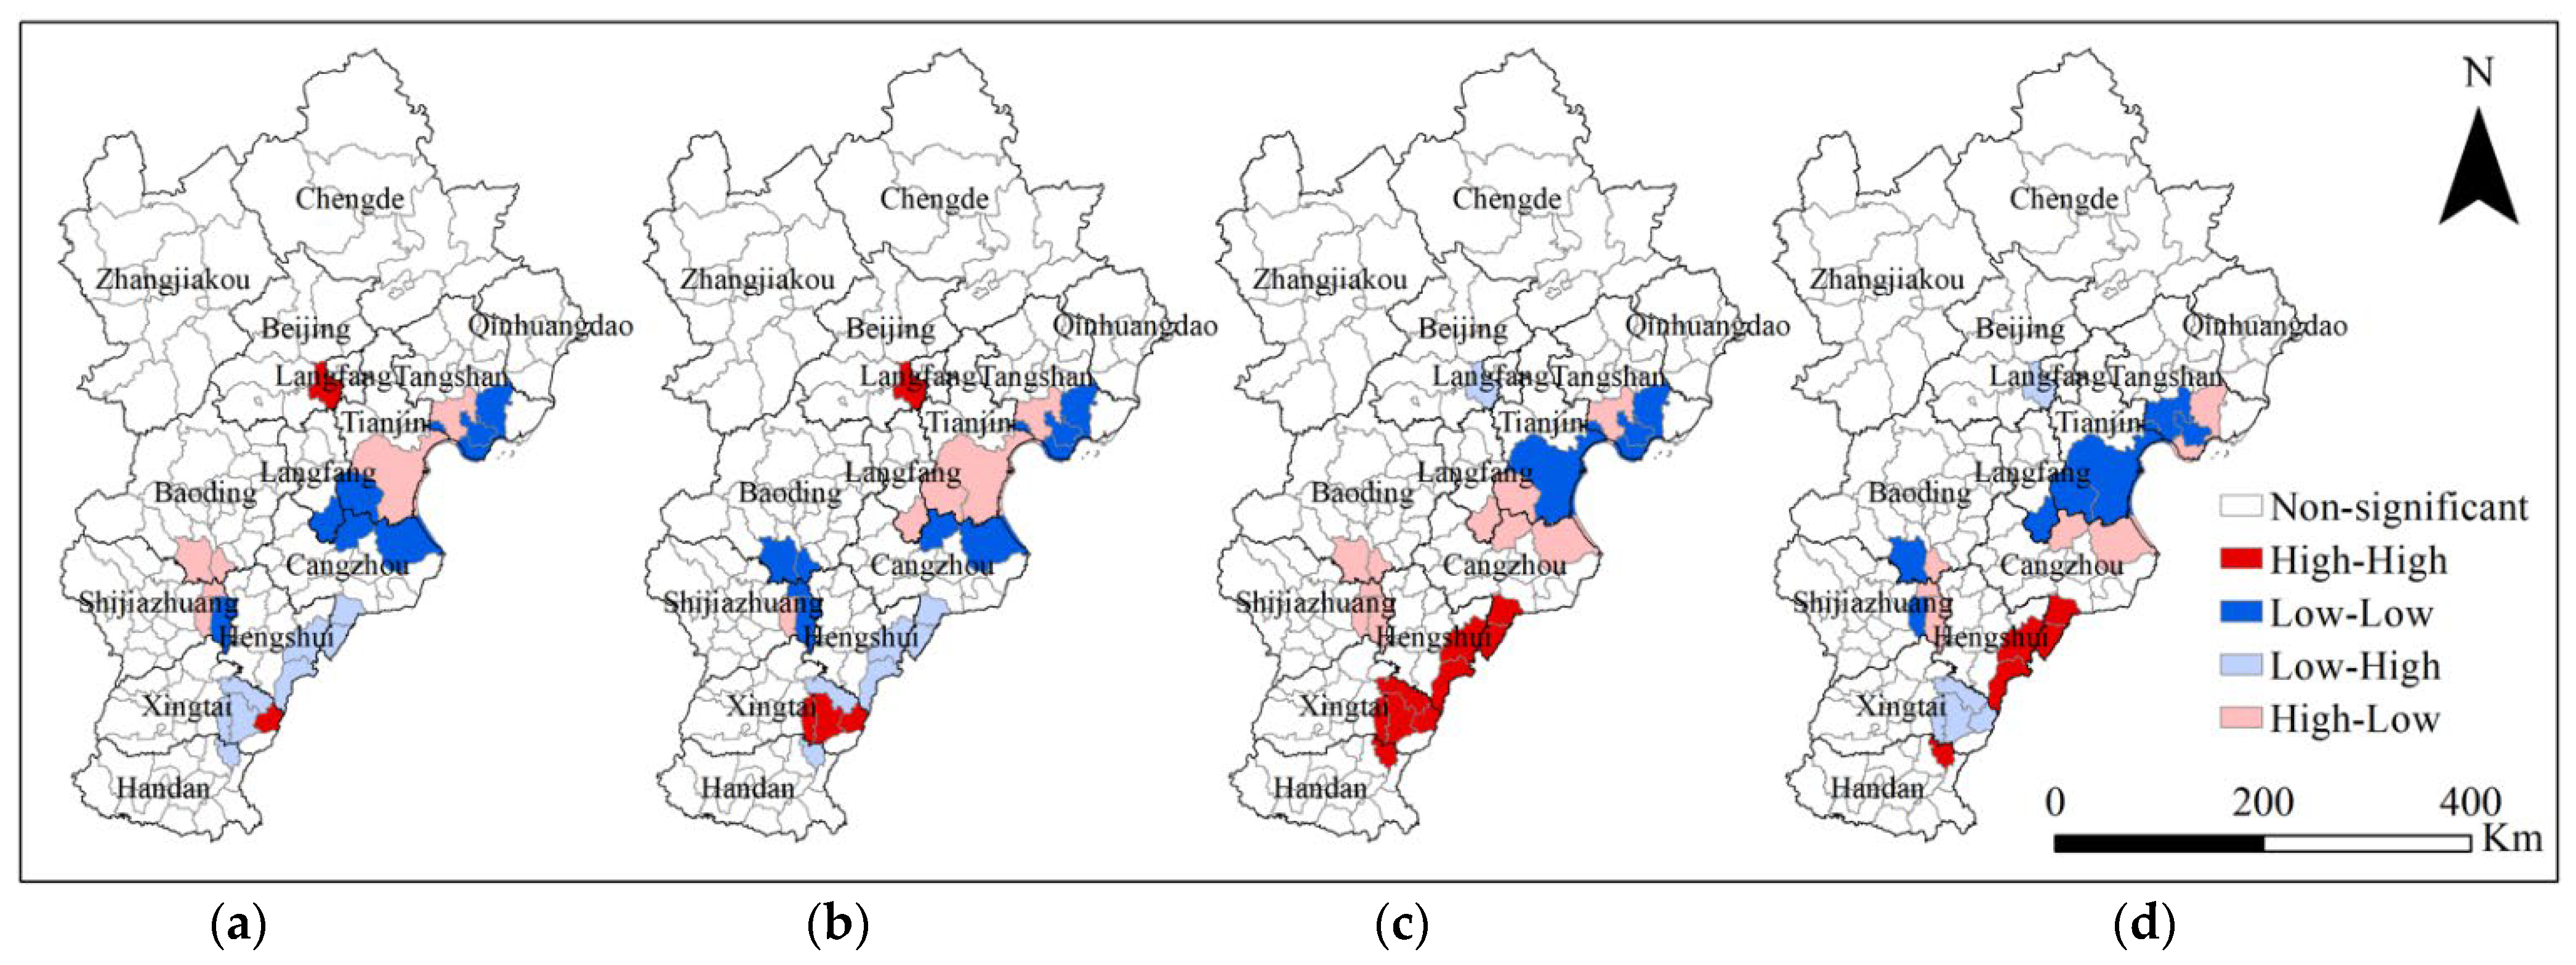
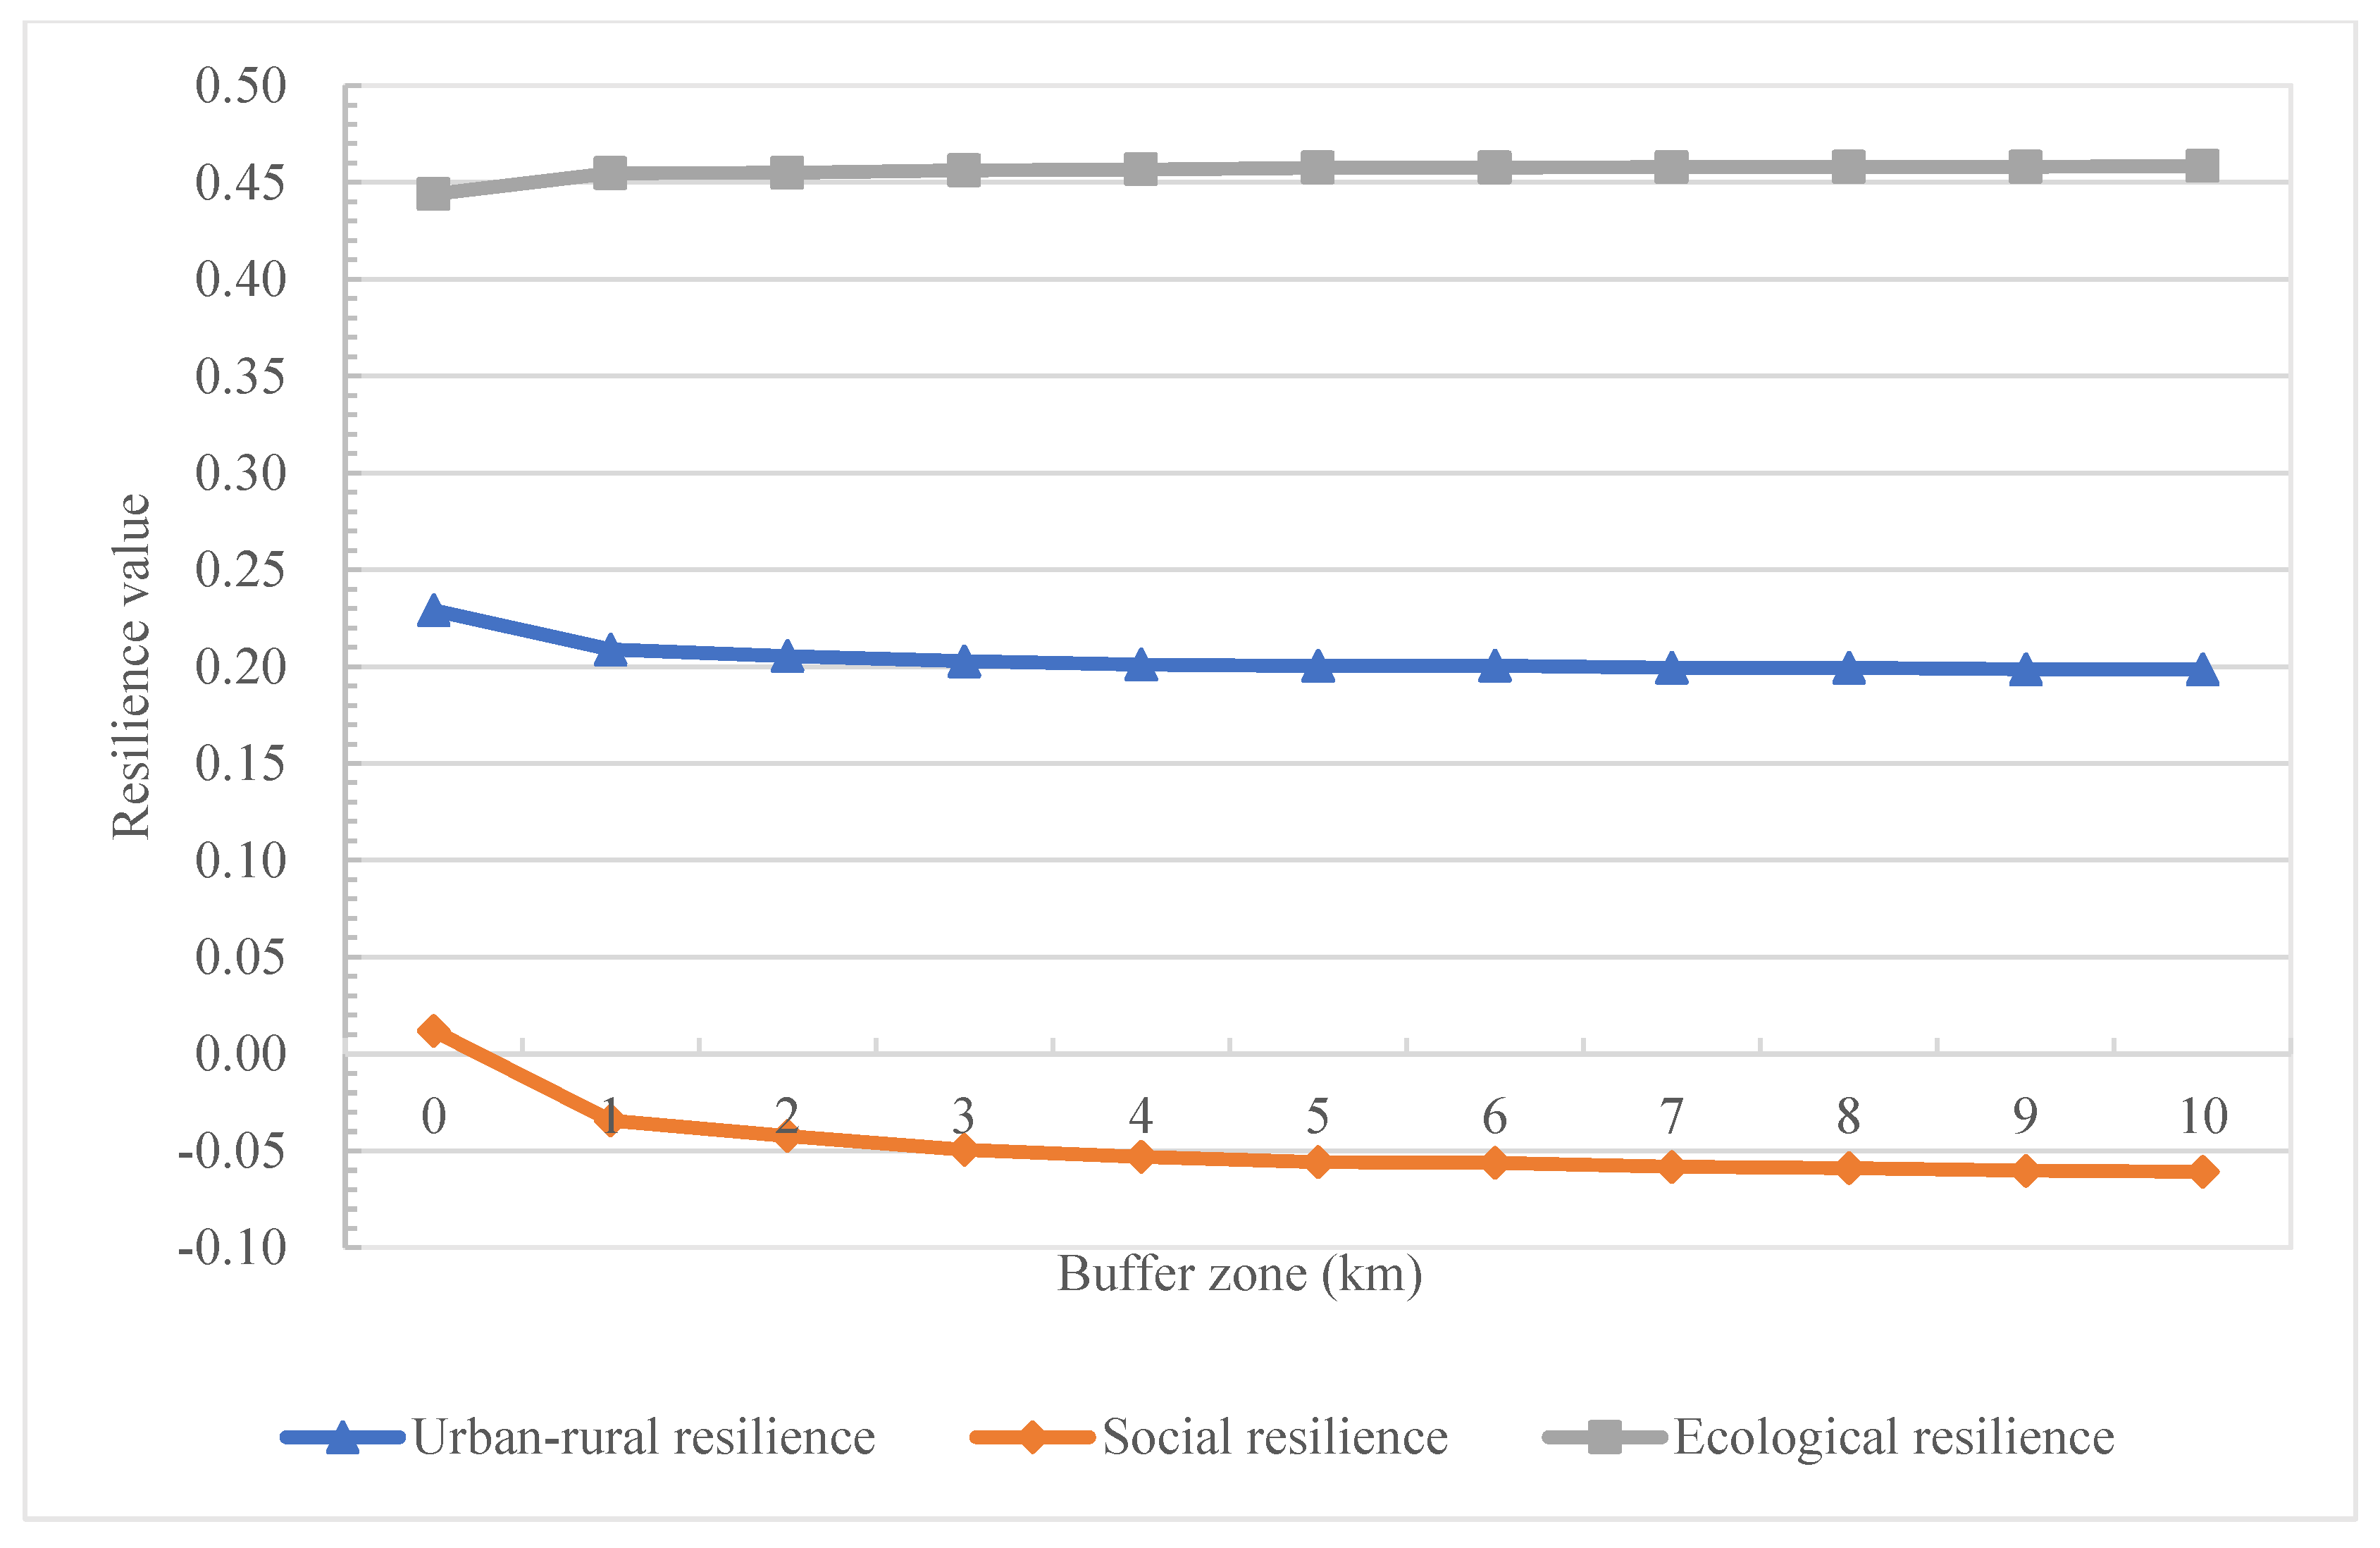
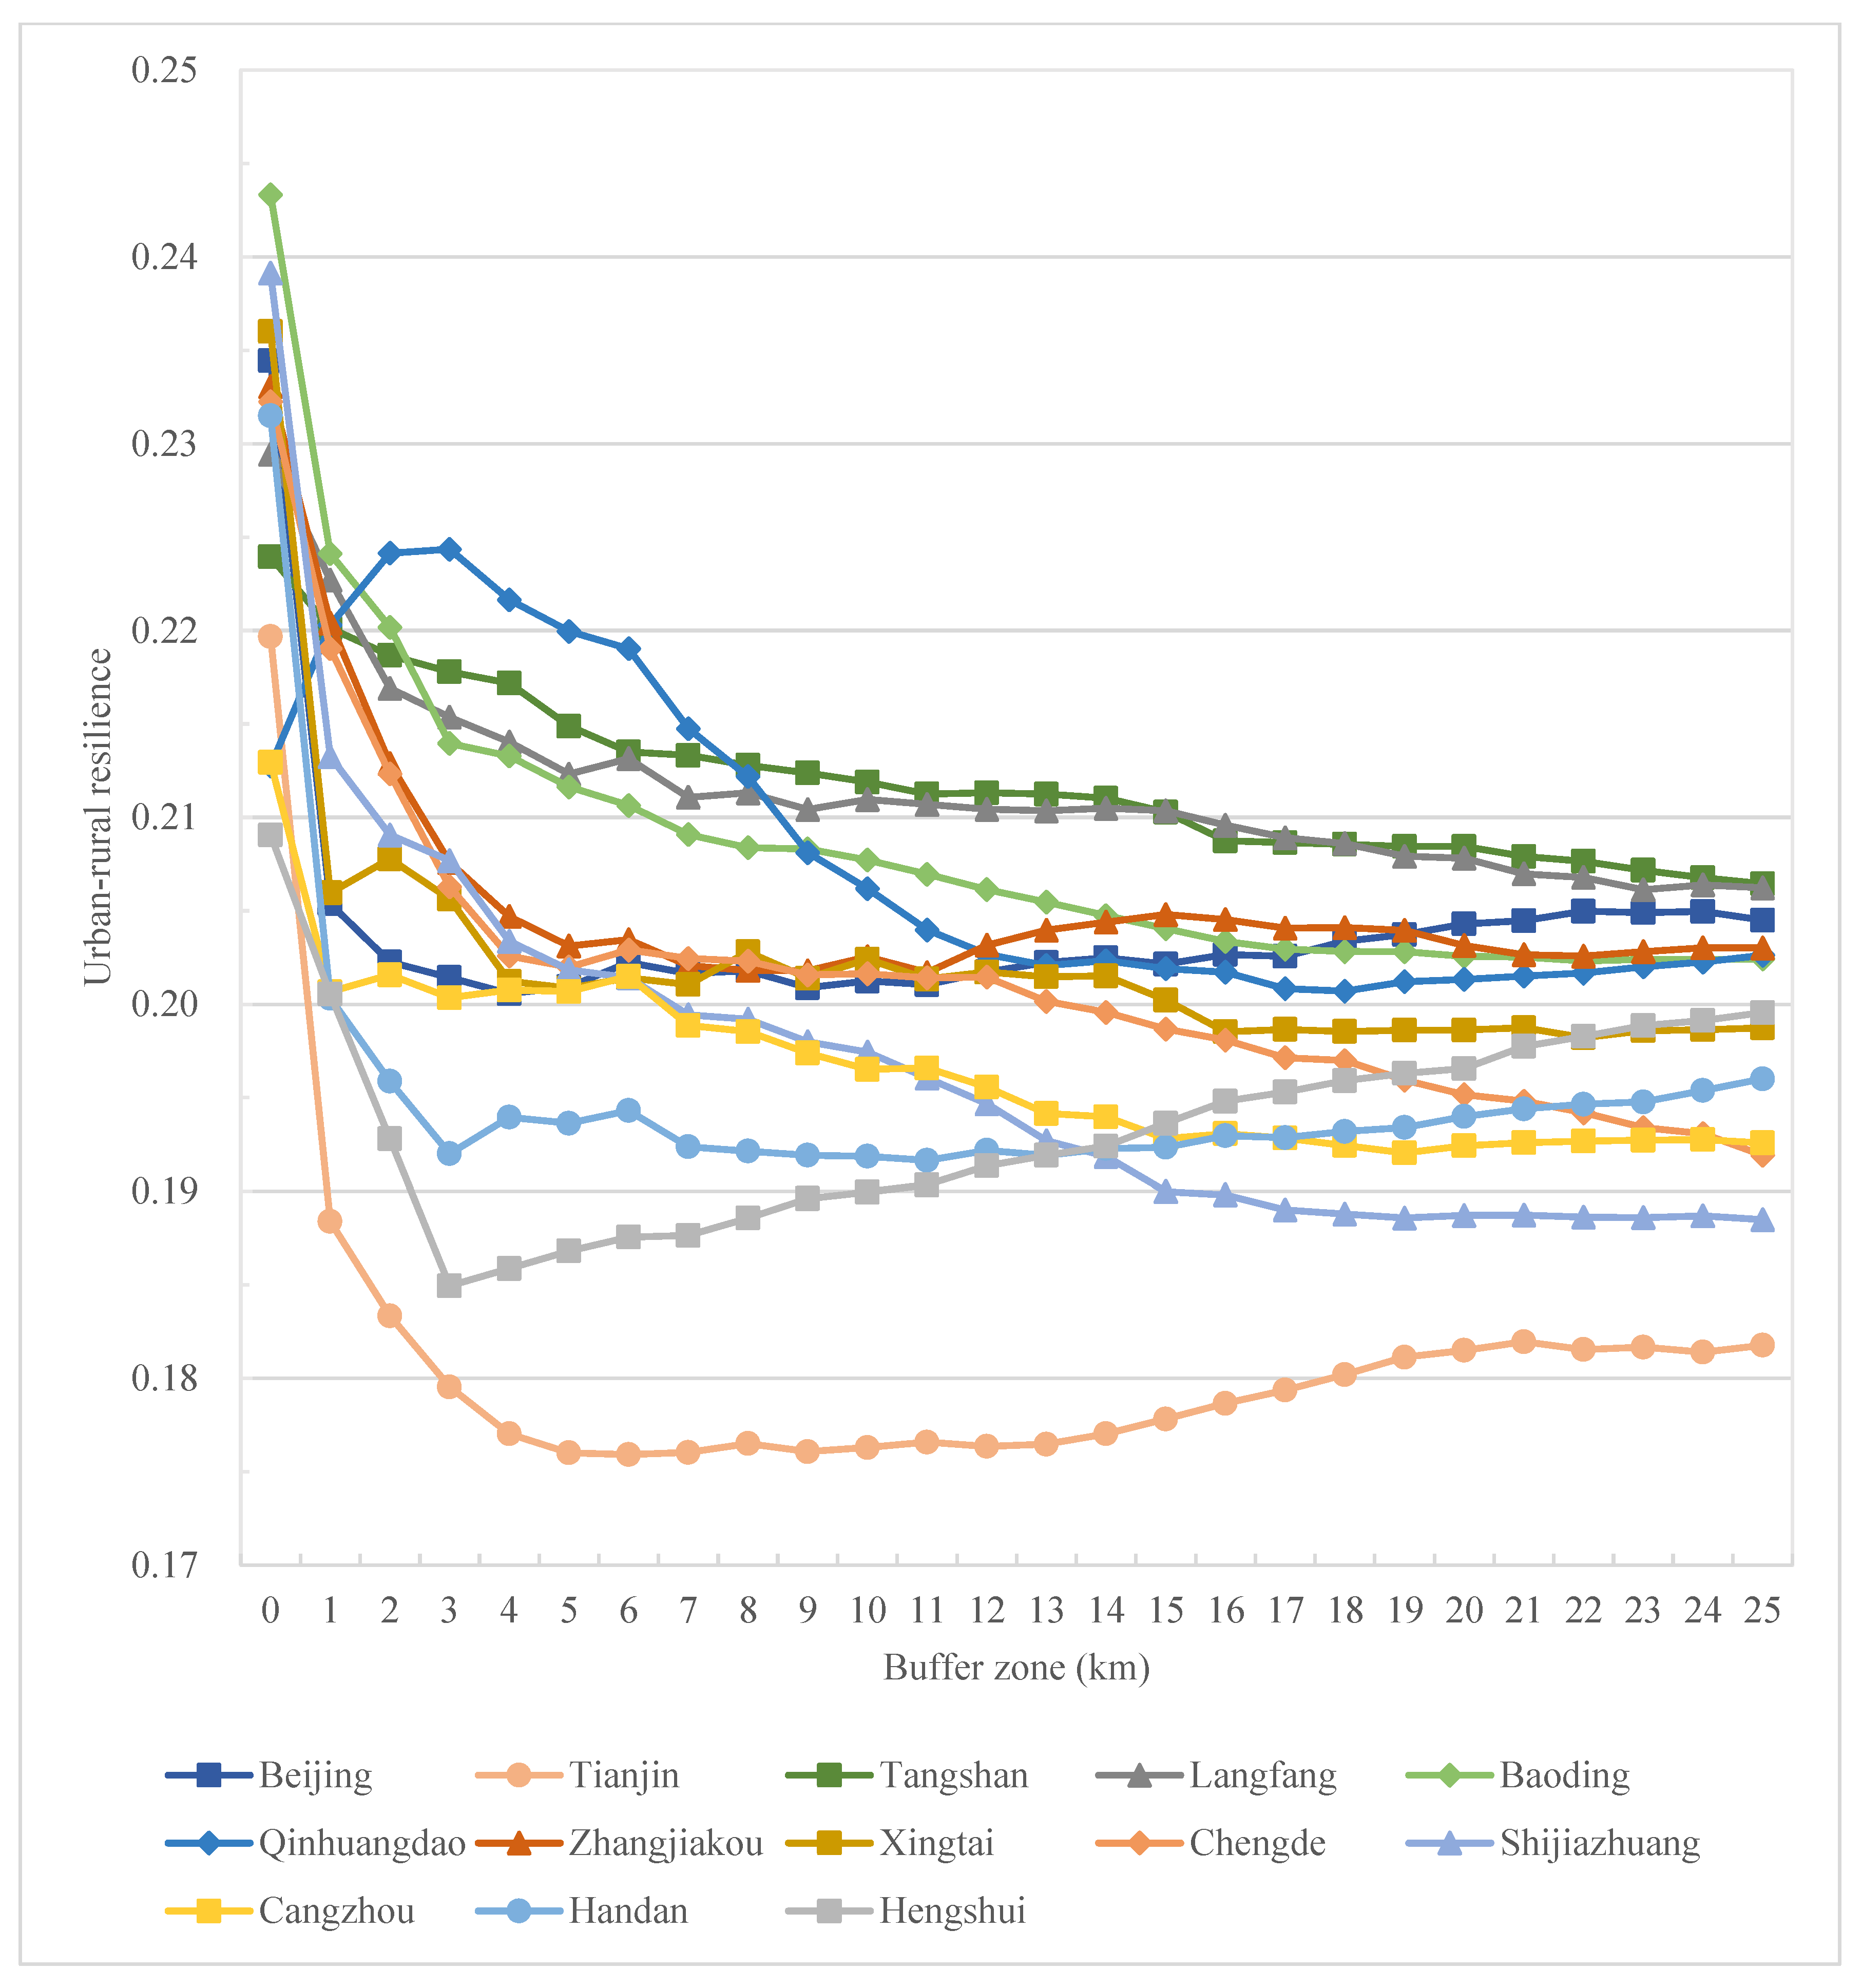
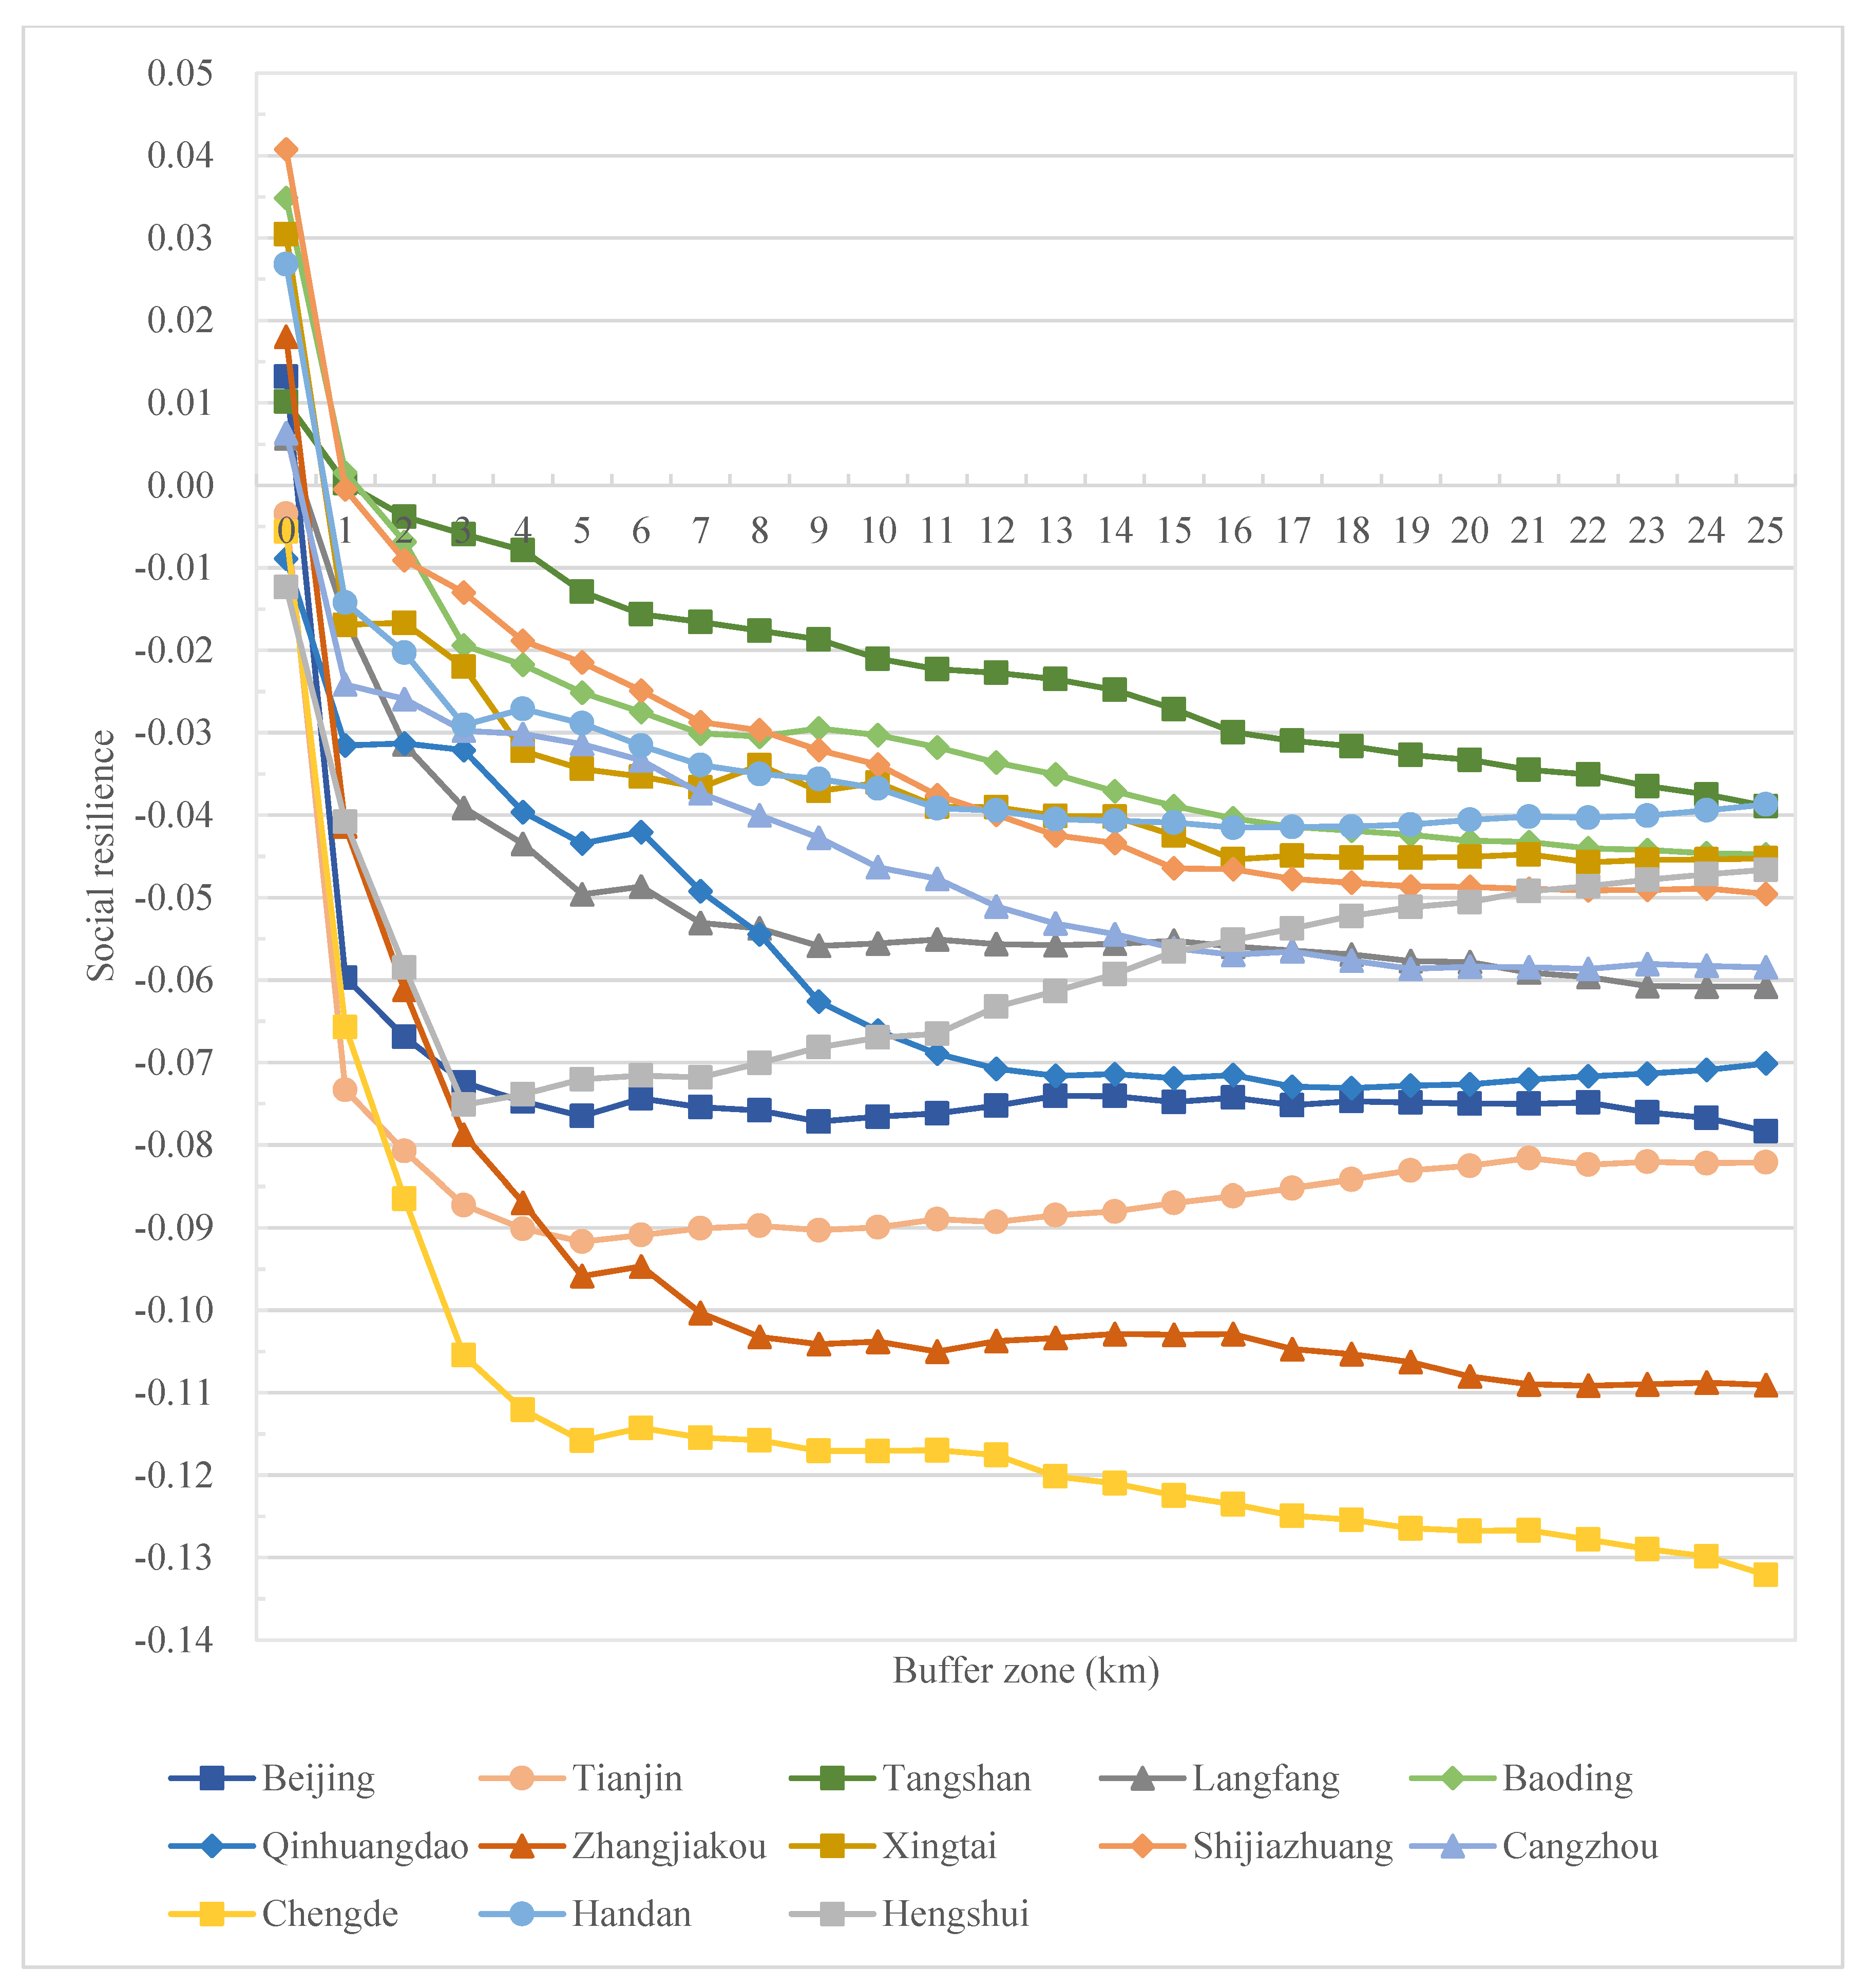
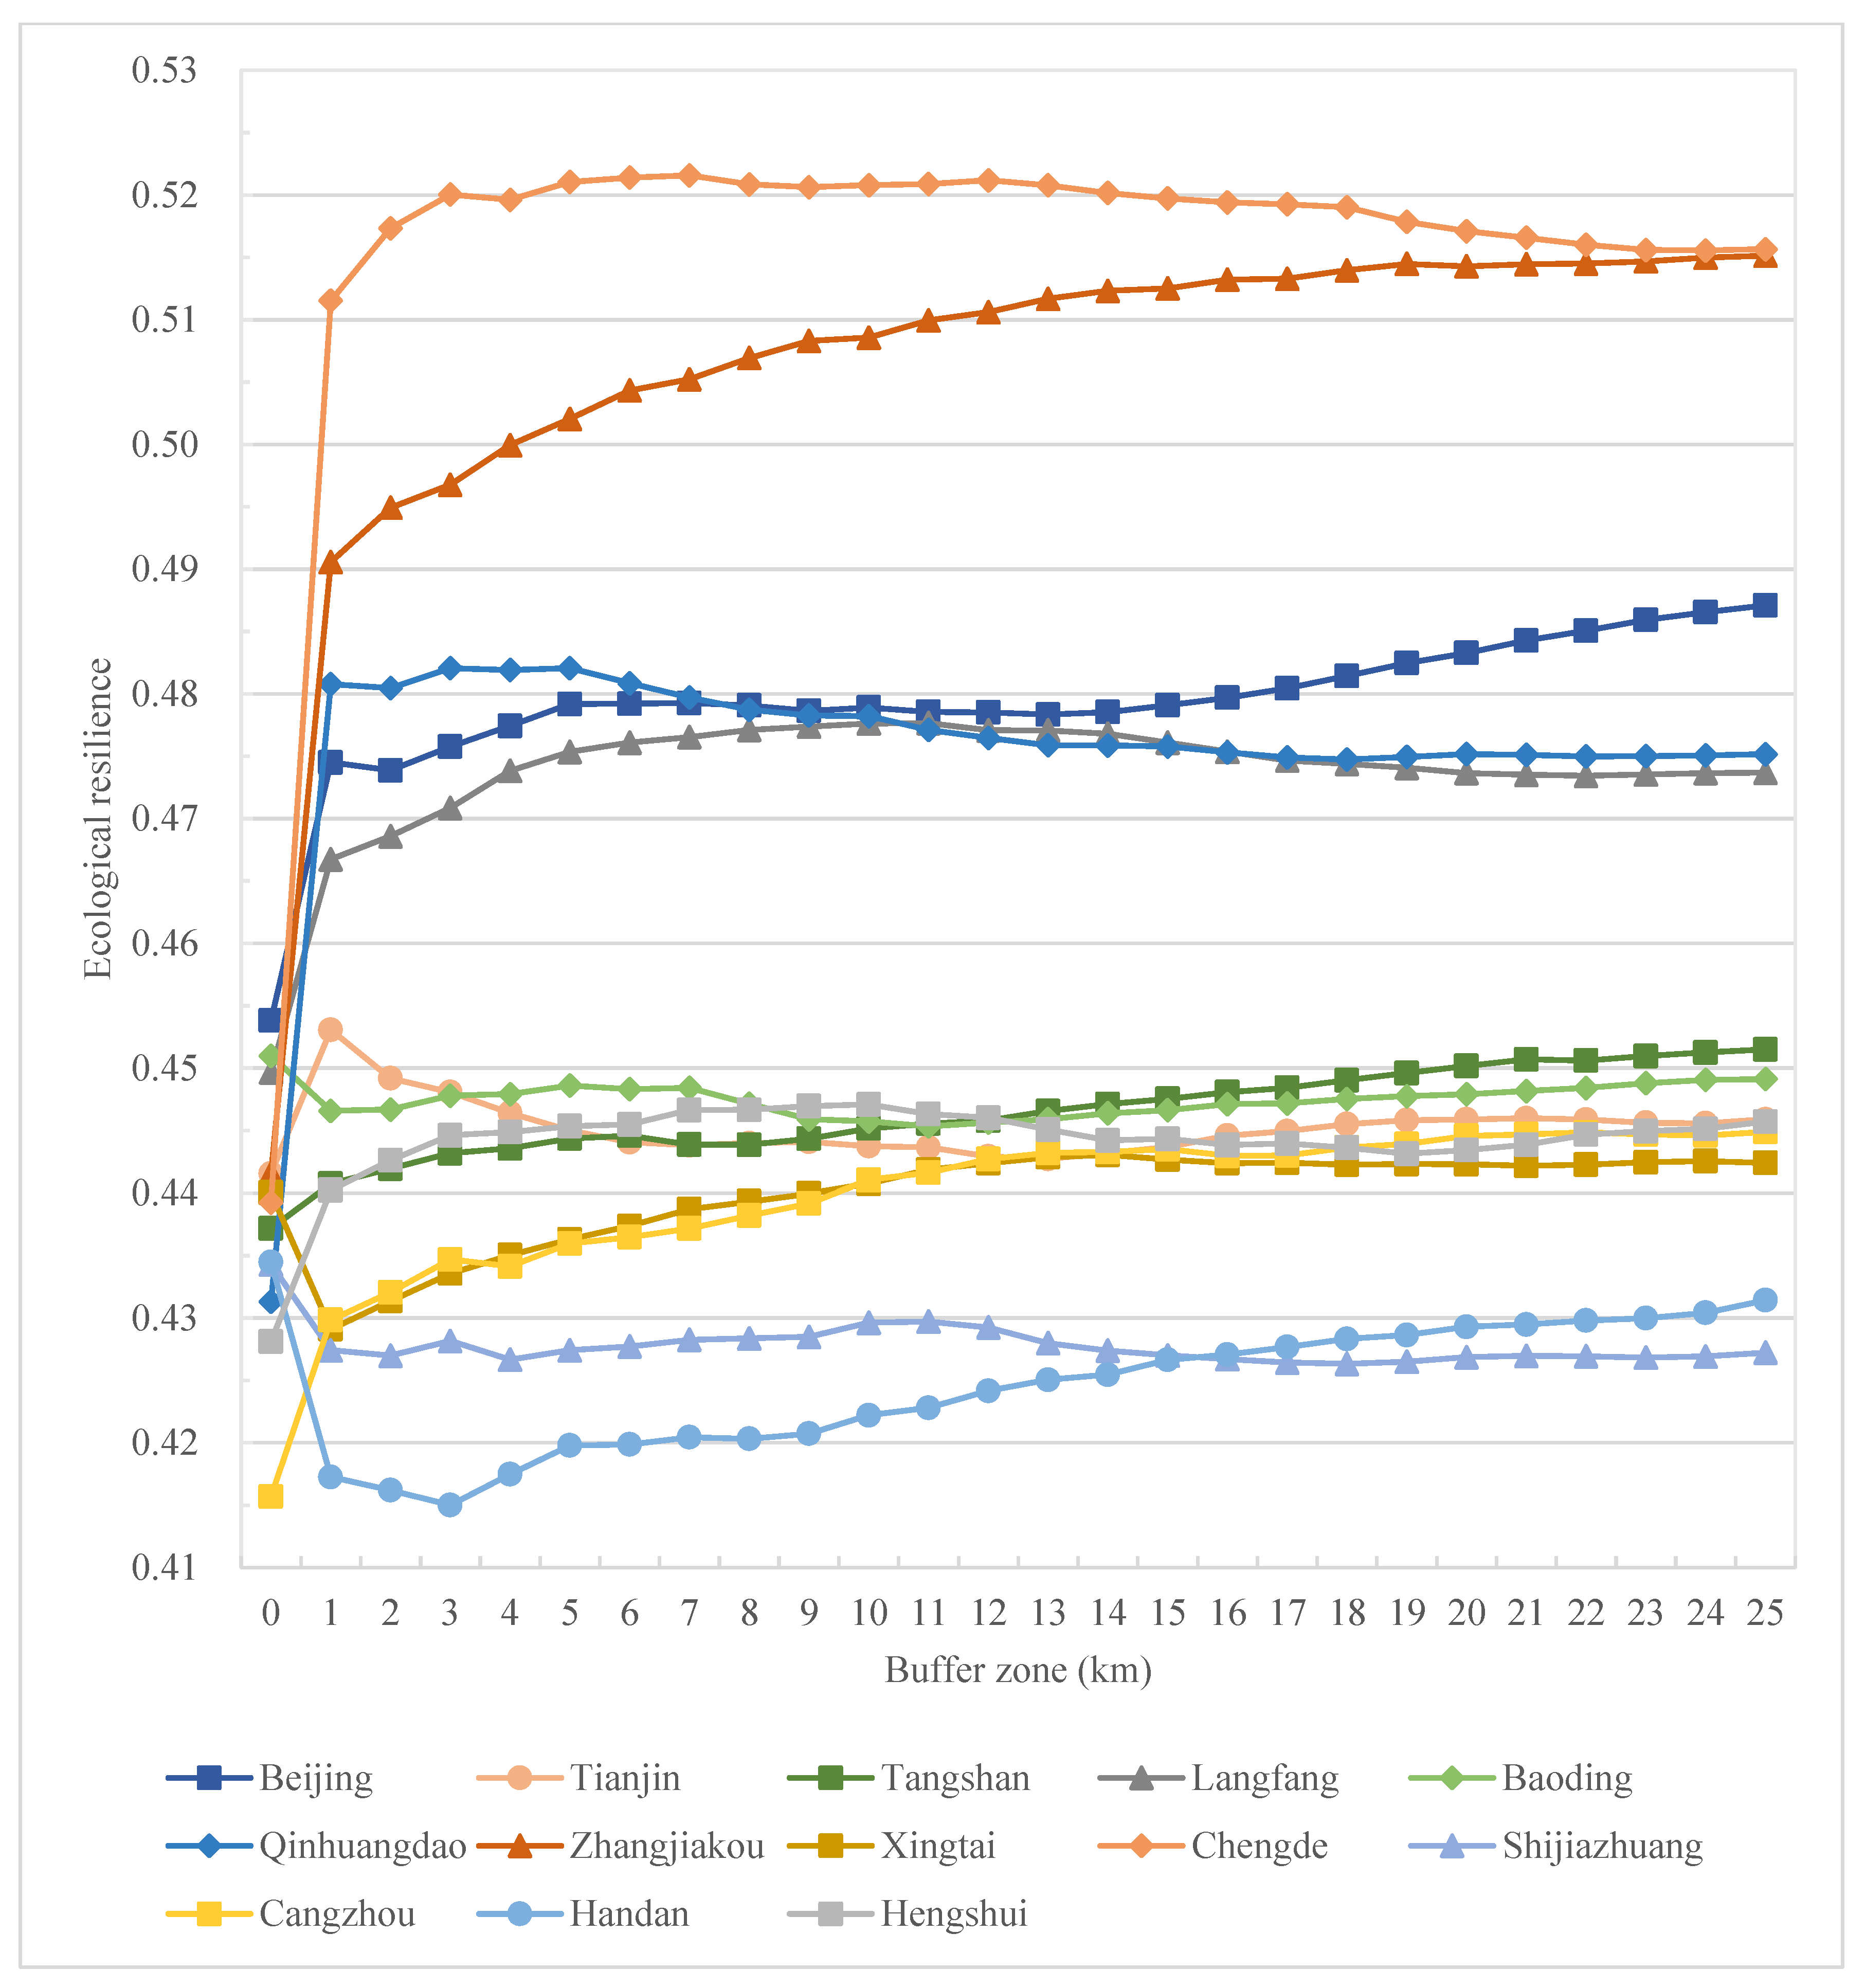
4.2. Resilience Change Trend from the Urban Core to Rural Outskirts
5. Discussion
6. Conclusions
Author Contributions
Funding
Institutional Review Board Statement
Informed Consent Statement
Data Availability Statement
Acknowledgments
Conflicts of Interest
References
- World Cities Report 2022: Envisaging the Future of Cities; UN-Habitat: Nairobi, Kenya, 2022; ISBN 978-92-1-132894-3.
- Turner, B.L.; Kasperson, R.E.; Matson, P.A.; McCarthy, J.J.; Corell, R.W.; Christensen, L.; Eckley, N.; Kasperson, J.X.; Luers, A.; Martello, M.L.; et al. A Framework for Vulnerability Analysis in Sustainability Science. Proc. Natl. Acad. Sci. USA 2003, 100, 8074–8079. [Google Scholar] [CrossRef] [PubMed] [Green Version]
- Ostrom, E. A Diagnostic Approach for Going beyond Panaceas. Proc. Natl. Acad. Sci. USA 2007, 104, 15181–15187. [Google Scholar] [CrossRef] [PubMed] [Green Version]
- Anderies, J.M.; Janssen, M.A.; Ostrom, E. A Framework to Analyze the Robustness of Social-Ecological Systems from an Institutional Perspective. Ecol. Soc. 2004, 9, 18. [Google Scholar] [CrossRef]
- Liu, J.; Hull, V.; Batistella, M.; DeFries, R.; Dietz, T.; Fu, F.; Hertel, T.W.; Izaurralde, R.C.; Lambin, E.F.; Li, S.; et al. Framing Sustainability in a Telecoupled World. Ecol. Soc. 2013, 18, art26. [Google Scholar] [CrossRef]
- Wu, J. Landscape Sustainability Science: Ecosystem Services and Human Well-Being in Changing Landscapes. Landsc. Ecol. 2013, 28, 999–1023. [Google Scholar] [CrossRef]
- Anderies, J.M.; Folke, C.; Walker, B.; Ostrom, E. Aligning Key Concepts for Global Change Policy: Robustness, Resilience, and Sustainability. Ecol. Soc. 2013, 18, 8. [Google Scholar] [CrossRef] [Green Version]
- Meerow, S.; Newell, J.P.; Stults, M. Defining Urban Resilience: A Review. Landsc. Urban Plan. 2016, 147, 38–49. [Google Scholar] [CrossRef]
- Rockefeller Foundation, Arup. City Resilience Index; City resilience framework; Rockefeller Foundation, Arup: London, UK, 2014. [Google Scholar]
- Heijman, W.; Hagelaar, G.; van der Heide, M. Rural Resilience as a New Development Concept. In EU Bioeconomy Economics and Policies: Volume II; Dries, L., Heijman, W., Jongeneel, R., Purnhagen, K., Wesseler, J., Eds.; Palgrave Advances in Bioeconomy: Economics and Policies; Springer International Publishing: Cham, Switzerland, 2019; pp. 195–211. ISBN 978-3-030-28641-5. [Google Scholar]
- Folke, C. Resilience: The Emergence of a Perspective for Social–Ecological Systems Analyses. Glob. Environ. Chang. 2006, 16, 253–267. [Google Scholar] [CrossRef]
- Su, Q.; Chang, H.-S.; Pai, S.-E. A Comparative Study of the Resilience of Urban and Rural Areas under Climate Change. Int. J. Environ. Res. Public. Health 2022, 19, 8911. [Google Scholar] [CrossRef]
- Song, J.; Pandey, R.; Dong, G.; Sharifi, A.; Subedi, B.P. Urban-Rural Disparity in Community Resilience: A Multilevel Analysis of the Relief Progress after the 2015 Nepal Earthquake. Sustain. Cities Soc. 2022, 79, 103698. [Google Scholar] [CrossRef]
- Halfacree, K.H. Urban–Rural Continuum. In International Encyclopedia of Human Geography; Elsevier: Amsterdam, The Netherlands, 2009; pp. 119–124. ISBN 978-0-08-044910-4. [Google Scholar]
- Scott, A.; Gilbert, A.; Gelan, A. The Urban-Rural Divide: Myth or Reality? Macaulay Institute Aberdeen: Aberdeen, UK, 2007; ISBN 0-7084-0671-8. [Google Scholar]
- Banzhaf, E.; Anderson, S.; Grandin, G.; Hardiman, R.; Jensen, A.; Jones, L.; Knopp, J.; Levin, G.; Russel, D.; Wu, W.; et al. Urban-Rural Dependencies and Opportunities to Design Nature-Based Solutions for Resilience in Europe and China. Land 2022, 11, 480. [Google Scholar] [CrossRef]
- Pang, P.; Guo, Z.; Wang, Y. Assessing Urban-rural Climate Resilience of Metropolitan Yangon, Myanmar. Singap. J. Trop. Geogr. 2021, 42, 451–468. [Google Scholar] [CrossRef]
- Giannakis, E.; Bruggeman, A. Regional Disparities in Economic Resilience in the European Union across the Urban–Rural Divide. Reg. Stud. 2020, 54, 1200–1213. [Google Scholar] [CrossRef] [Green Version]
- Lynch, C. CityStrength Diagnostic: Methodological Guidebook; The World Bank: Washington, DC, USA, 2018. [Google Scholar]
- Herrera, H.; Kopainsky, B. Using System Dynamics to Support a Participatory Assessment of Resilience. Environ. Syst. Decis. 2020, 40, 342–355. [Google Scholar] [CrossRef] [Green Version]
- Cutter, S.L.; Ash, K.D.; Emrich, C.T. The Geographies of Community Disaster Resilience. Glob. Environ. Change 2014, 29, 65–77. [Google Scholar] [CrossRef]
- Cutter, S.L.; Burton, C.G.; Emrich, C.T. Disaster Resilience Indicators for Benchmarking Baseline Conditions. J. Homel. Secur. Emerg. Manag. 2010, 7, 1–24. [Google Scholar] [CrossRef]
- Carpenter, S.R.; Westley, F.; Turner, M.G. Surrogates for Resilience of Social–Ecological Systems. Ecosystems 2005, 8, 941–944. [Google Scholar] [CrossRef]
- Bruneau, M.; Chang, S.E.; Eguchi, R.T.; Lee, G.C.; O’Rourke, T.D.; Reinhorn, A.M.; Shinozuka, M.; Tierney, K.; Wallace, W.A.; Von Winterfeldt, D. A Framework to Quantitatively Assess and Enhance the Seismic Resilience of Communities. Earthq. Spectra 2003, 19, 733–752. [Google Scholar] [CrossRef] [Green Version]
- Cimellaro, G.P.; Koh, Y.; Roh, H. Applying control theories and abm to improve resilience-based design of systems. Network for Earthquake Engineering Simulation. In Proceedings of the Tenth U.S. National Conference on Earthquake Engineering Frontiers of Earthquake Engineering, Anchorage, Alaska, 21–25 July 2014; p. 11. [Google Scholar]
- Hallegatte, S. Economic Resilience: Definition and Measurement; World Bank: Washington, DC, USA, 2014. [Google Scholar]
- Ouyang, M.; Dueñas-Osorio, L.; Min, X. A Three-Stage Resilience Analysis Framework for Urban Infrastructure Systems. Struct. Saf. 2012, 36–37, 23–31. [Google Scholar] [CrossRef]
- Egli, L.; Weise, H.; Radchuk, V.; Seppelt, R.; Grimm, V. Exploring Resilience with Agent-Based Models: State of the Art, Knowledge Gaps and Recommendations for Coping with Multidimensionality. Ecol. Complex. 2019, 40, 100718. [Google Scholar] [CrossRef]
- Datola, G.; Bottero, M.; De Angelis, E.; Romagnoli, F. Operationalising Resilience: A Methodological Framework for Assessing Urban Resilience through System Dynamics Model. Ecol. Model. 2022, 465, 109851. [Google Scholar] [CrossRef]
- Li, G.; Kou, C.; Wang, Y.; Yang, H. System Dynamics Modelling for Improving Urban Resilience in Beijing, China. Resour. Conserv. Recycl. 2020, 161, 104954. [Google Scholar] [CrossRef]
- Boston, M.; Liu, Z.; Jacques, C.C.; Mitrani-Reiser, J. Towards assessing the resilience of a community in seismic events using agent based modeling. In Network for Earthquake Engineering Simulation; Earthquake Engineering Research Institute: Oakland, CA, USA, 2014; p. 11. [Google Scholar]
- Parsons, M.; Morley, P. The Australian Natural Disaster Resilience Index. Aust. J. Emerg. Manag. 2017, 32, 20–22. [Google Scholar] [CrossRef]
- Wamsler, C.; Brink, E.; Rivera, C. Planning for Climate Change in Urban Areas: From Theory to Practice. J. Clean. Prod. 2013, 50, 68–81. [Google Scholar] [CrossRef] [Green Version]
- Chen, Y.; Su, X.; Zhou, Q. Study on the Spatiotemporal Evolution and Influencing Factors of Urban Resilience in the Yellow River Basin. Int. J. Environ. Res. Public. Health 2021, 18, 10231. [Google Scholar] [CrossRef]
- Shi, C.; Zhu, X.; Wu, H.; Li, Z. Assessment of Urban Ecological Resilience and Its Influencing Factors: A Case Study of the Beijing-Tianjin-Hebei Urban Agglomeration of China. Land 2022, 11, 921. [Google Scholar] [CrossRef]
- Scheffer, M.; Carpenter, S.R. Catastrophic Regime Shifts in Ecosystems: Linking Theory to Observation. Trends Ecol. Evol. 2003, 18, 648–656. [Google Scholar] [CrossRef]
- Lu, H.; Lu, X.; Jiao, L.; Zhang, Y. Evaluating Urban Agglomeration Resilience to Disaster in the Yangtze Delta City Group in China. Sustain. Cities Soc. 2022, 76, 103464. [Google Scholar] [CrossRef]
- Ma, F.; Wang, Z.; Sun, Q.; Yuen, K.F.; Zhang, Y.; Xue, H.; Zhao, S. Spatial–Temporal Evolution of Urban Resilience and Its Influencing Factors: Evidence from the Guanzhong Plain Urban Agglomeration. Sustainability 2020, 12, 2593. [Google Scholar] [CrossRef] [Green Version]
- Chen, M.; Liu, W.; Lu, D. Challenges and the Way Forward in China’s New-Type Urbanization. Land Use Policy 2016, 55, 334–339. [Google Scholar] [CrossRef]
- CNKI Data. Available online: https://data.cnki.net/new (accessed on 1 September 2022).
- National Bureau of Statistics. China City Statistic Yearbook 2020; China Statistics Press: Beijing, China, 2021; ISBN 978-7-5037-9465-0. [Google Scholar]
- Fang, C.; Wang, Y.; Fang, J. A Comprehensive Assessment of Urban Vulnerability and Its Spatial Differentiation in China. J. Geogr. Sci. 2016, 26, 153–170. [Google Scholar] [CrossRef]
- Shi, T.; Qiao, Y.; Zhou, Q. Spatiotemporal Evolution and Spatial Relevance of Urban Resilience: Evidence from Cities of China. Growth Chang. 2021, 52, 2364–2390. [Google Scholar] [CrossRef]
- Liu, X.; Li, S.; Xu, X.; Luo, J. Integrated Natural Disasters Urban Resilience Evaluation: The Case of China. Nat. Hazards 2021, 107, 2105–2122. [Google Scholar] [CrossRef]
- Beijing Municipal Commission of Planning and Natural Resources, Beijing Master Plan (2016–2035). Available online: http://www.beijing.gov.cn/gongkai/guihua/wngh/cqgh/201907/t20190701_100008.html (accessed on 15 July 2022).
- Department of Natural Resources of Hebei Province, Territoral Spatial Planning of Hebei Province (2021–2035). Available online: http://zrzy.hebei.gov.cn/heb/gongk/gkml/gggs/qtgg/gtkjhh/10589515282567294976.html (accessed on 15 July 2022).
- Chen, Z.; Yu, G. Spatial Variations and Controls of Carbon Use Efficiency in China’s Terrestrial Ecosystems. Sci. Rep. 2019, 9, 19516. [Google Scholar] [CrossRef] [Green Version]
- Li, Z.; Xia, J.; Deng, X.; Yan, H. Multilevel Modelling of Impacts of Human and Natural Factors on Ecosystem Services Change in an Oasis, Northwest China. Resour. Conserv. Recycl. 2021, 169, 105474. [Google Scholar] [CrossRef]
- Gaughan, A.E.; Stevens, F.R.; Linard, C.; Jia, P.; Tatem, A.J. High Resolution Population Distribution Maps for Southeast Asia in 2010 and 2015. PLoS ONE 2013, 8, e55882. [Google Scholar] [CrossRef]
- Bai, Z.; Wang, J.; Wang, M.; Gao, M.; Sun, J. Accuracy Assessment of Multi-Source Gridded Population Distribution Datasets in China. Sustainability 2018, 10, 1363. [Google Scholar] [CrossRef] [Green Version]
- Yang, Y.; Zhang, H.; Zhao, X.; Chen, Z.; Wang, A.; Zhao, E.; Cao, H. Effects of Urbanization on Ecosystem Services in the Shandong Peninsula Urban Agglomeration, in China: The Case of Weifang City. Urban Sci. 2021, 5, 54. [Google Scholar] [CrossRef]
- Liu, J.; Kuang, W.; Zhang, Z.; Xu, X.; Qin, Y.; Ning, J.; Zhou, W.; Zhang, S.; Li, R.; Yan, C.; et al. Spatiotemporal Characteristics, Patterns, and Causes of Land-Use Changes in China since the Late 1980s. J. Geogr. Sci. 2014, 24, 195–210. [Google Scholar] [CrossRef]
- Ribeiro, P.J.G.; Pena Jardim Gonçalves, L.A. Urban Resilience: A Conceptual Framework. Sustain. Cities Soc. 2019, 50, 101625. [Google Scholar] [CrossRef]
- Anselin, L.; Syabri, I.; Smirnov, O. Visualizing Multivariate Spatial Correlation with Dynamically Linked Windows; Citeseer: Gothenburg, Sweden, 2002. [Google Scholar]
- Deng, X.; Huang, J.; Rozelle, S.; Uchida, E. Growth, Population and Industrialization, and Urban Land Expansion of China. J. Urban Econ. 2008, 63, 96–115. [Google Scholar] [CrossRef]
- Jiang, B.; Miao, Y. The Evolution of Natural Cities from the Perspective of Location-Based Social Media. Prof. Geogr. 2015, 67, 295–306. [Google Scholar] [CrossRef] [Green Version]
- Smith, L.M.; Harwell, L.C.; Summers, J.K.; Bousquin, J.; Buck, K.D.; Harvey, J.E.; McLaughlin, M. Using Re-Scaled Resilience Screening Index Results and Location Quotients for Socio-Ecological Characterizations in U.S. Coastal Regions. Front. Environ. Sci. 2019, 7, 96. [Google Scholar] [CrossRef]
- Armitage, D.; Johnson, D. Can Resilience Be Reconciled with Globalization and the Increasingly Complex Conditions of Resource Degradation in Asian Coastal Regions? Ecol. Soc. 2006, 11, 19. [Google Scholar] [CrossRef] [Green Version]
- Zheng, Y.; Xie, X.-L.; Lin, C.-Z.; Wang, M.; He, X.-J. Development as Adaptation: Framing and Measuring Urban Resilience in Beijing. Adv. Clim. Chang. Res. 2018, 9, 234–242. [Google Scholar] [CrossRef]
- Feng, X.; Lei, J.; Xiu, C.; Li, J.; Bai, L.; Zhong, Y. Analysis of Spatial Scale Effect on Urban Resilience: A Case Study of Shenyang, China. Chin. Geogr. Sci. 2020, 30, 1005–1021. [Google Scholar] [CrossRef]
- Ma, W.; Jiang, G.; Chen, Y.; Qu, Y.; Zhou, T.; Li, W. How Feasible Is Regional Integration for Reconciling Land Use Conflicts across the Urban–Rural Interface? Evidence from Beijing–Tianjin–Hebei Metropolitan Region in China. Land Use Policy 2020, 92, 104433. [Google Scholar] [CrossRef]
- Bettencourt, L.M.A. The Origins of Scaling in Cities. Science 2013, 340, 1438–1441. [Google Scholar] [CrossRef]


Publisher’s Note: MDPI stays neutral with regard to jurisdictional claims in published maps and institutional affiliations. |
© 2022 by the authors. Licensee MDPI, Basel, Switzerland. This article is an open access article distributed under the terms and conditions of the Creative Commons Attribution (CC BY) license (https://creativecommons.org/licenses/by/4.0/).
Share and Cite
Shi, C.; Zhu, X.; Wu, H.; Li, Z. Urbanization Impact on Regional Sustainable Development: Through the Lens of Urban-Rural Resilience. Int. J. Environ. Res. Public Health 2022, 19, 15407. https://doi.org/10.3390/ijerph192215407
Shi C, Zhu X, Wu H, Li Z. Urbanization Impact on Regional Sustainable Development: Through the Lens of Urban-Rural Resilience. International Journal of Environmental Research and Public Health. 2022; 19(22):15407. https://doi.org/10.3390/ijerph192215407
Chicago/Turabian StyleShi, Chenchen, Xiaoping Zhu, Haowei Wu, and Zhihui Li. 2022. "Urbanization Impact on Regional Sustainable Development: Through the Lens of Urban-Rural Resilience" International Journal of Environmental Research and Public Health 19, no. 22: 15407. https://doi.org/10.3390/ijerph192215407