

Age- and Sex-Specific Physical Fitness Reference and Association with Body Mass Index in Hong Kong Chinese Schoolchildren
 ,
,  , , , , and
Abstract
:1. Introduction
2. Materials and Methods
2.1. Database
2.1.1. Anthropometric Measurements
2.1.2. Physical Fitness Assessment
2.2. Statistical Analysis
3. Results
3.1. Descriptive Characteristics
BMI Status Comparison
3.2. The Fitted Models
3.3. Normative Values of Fitness Tests
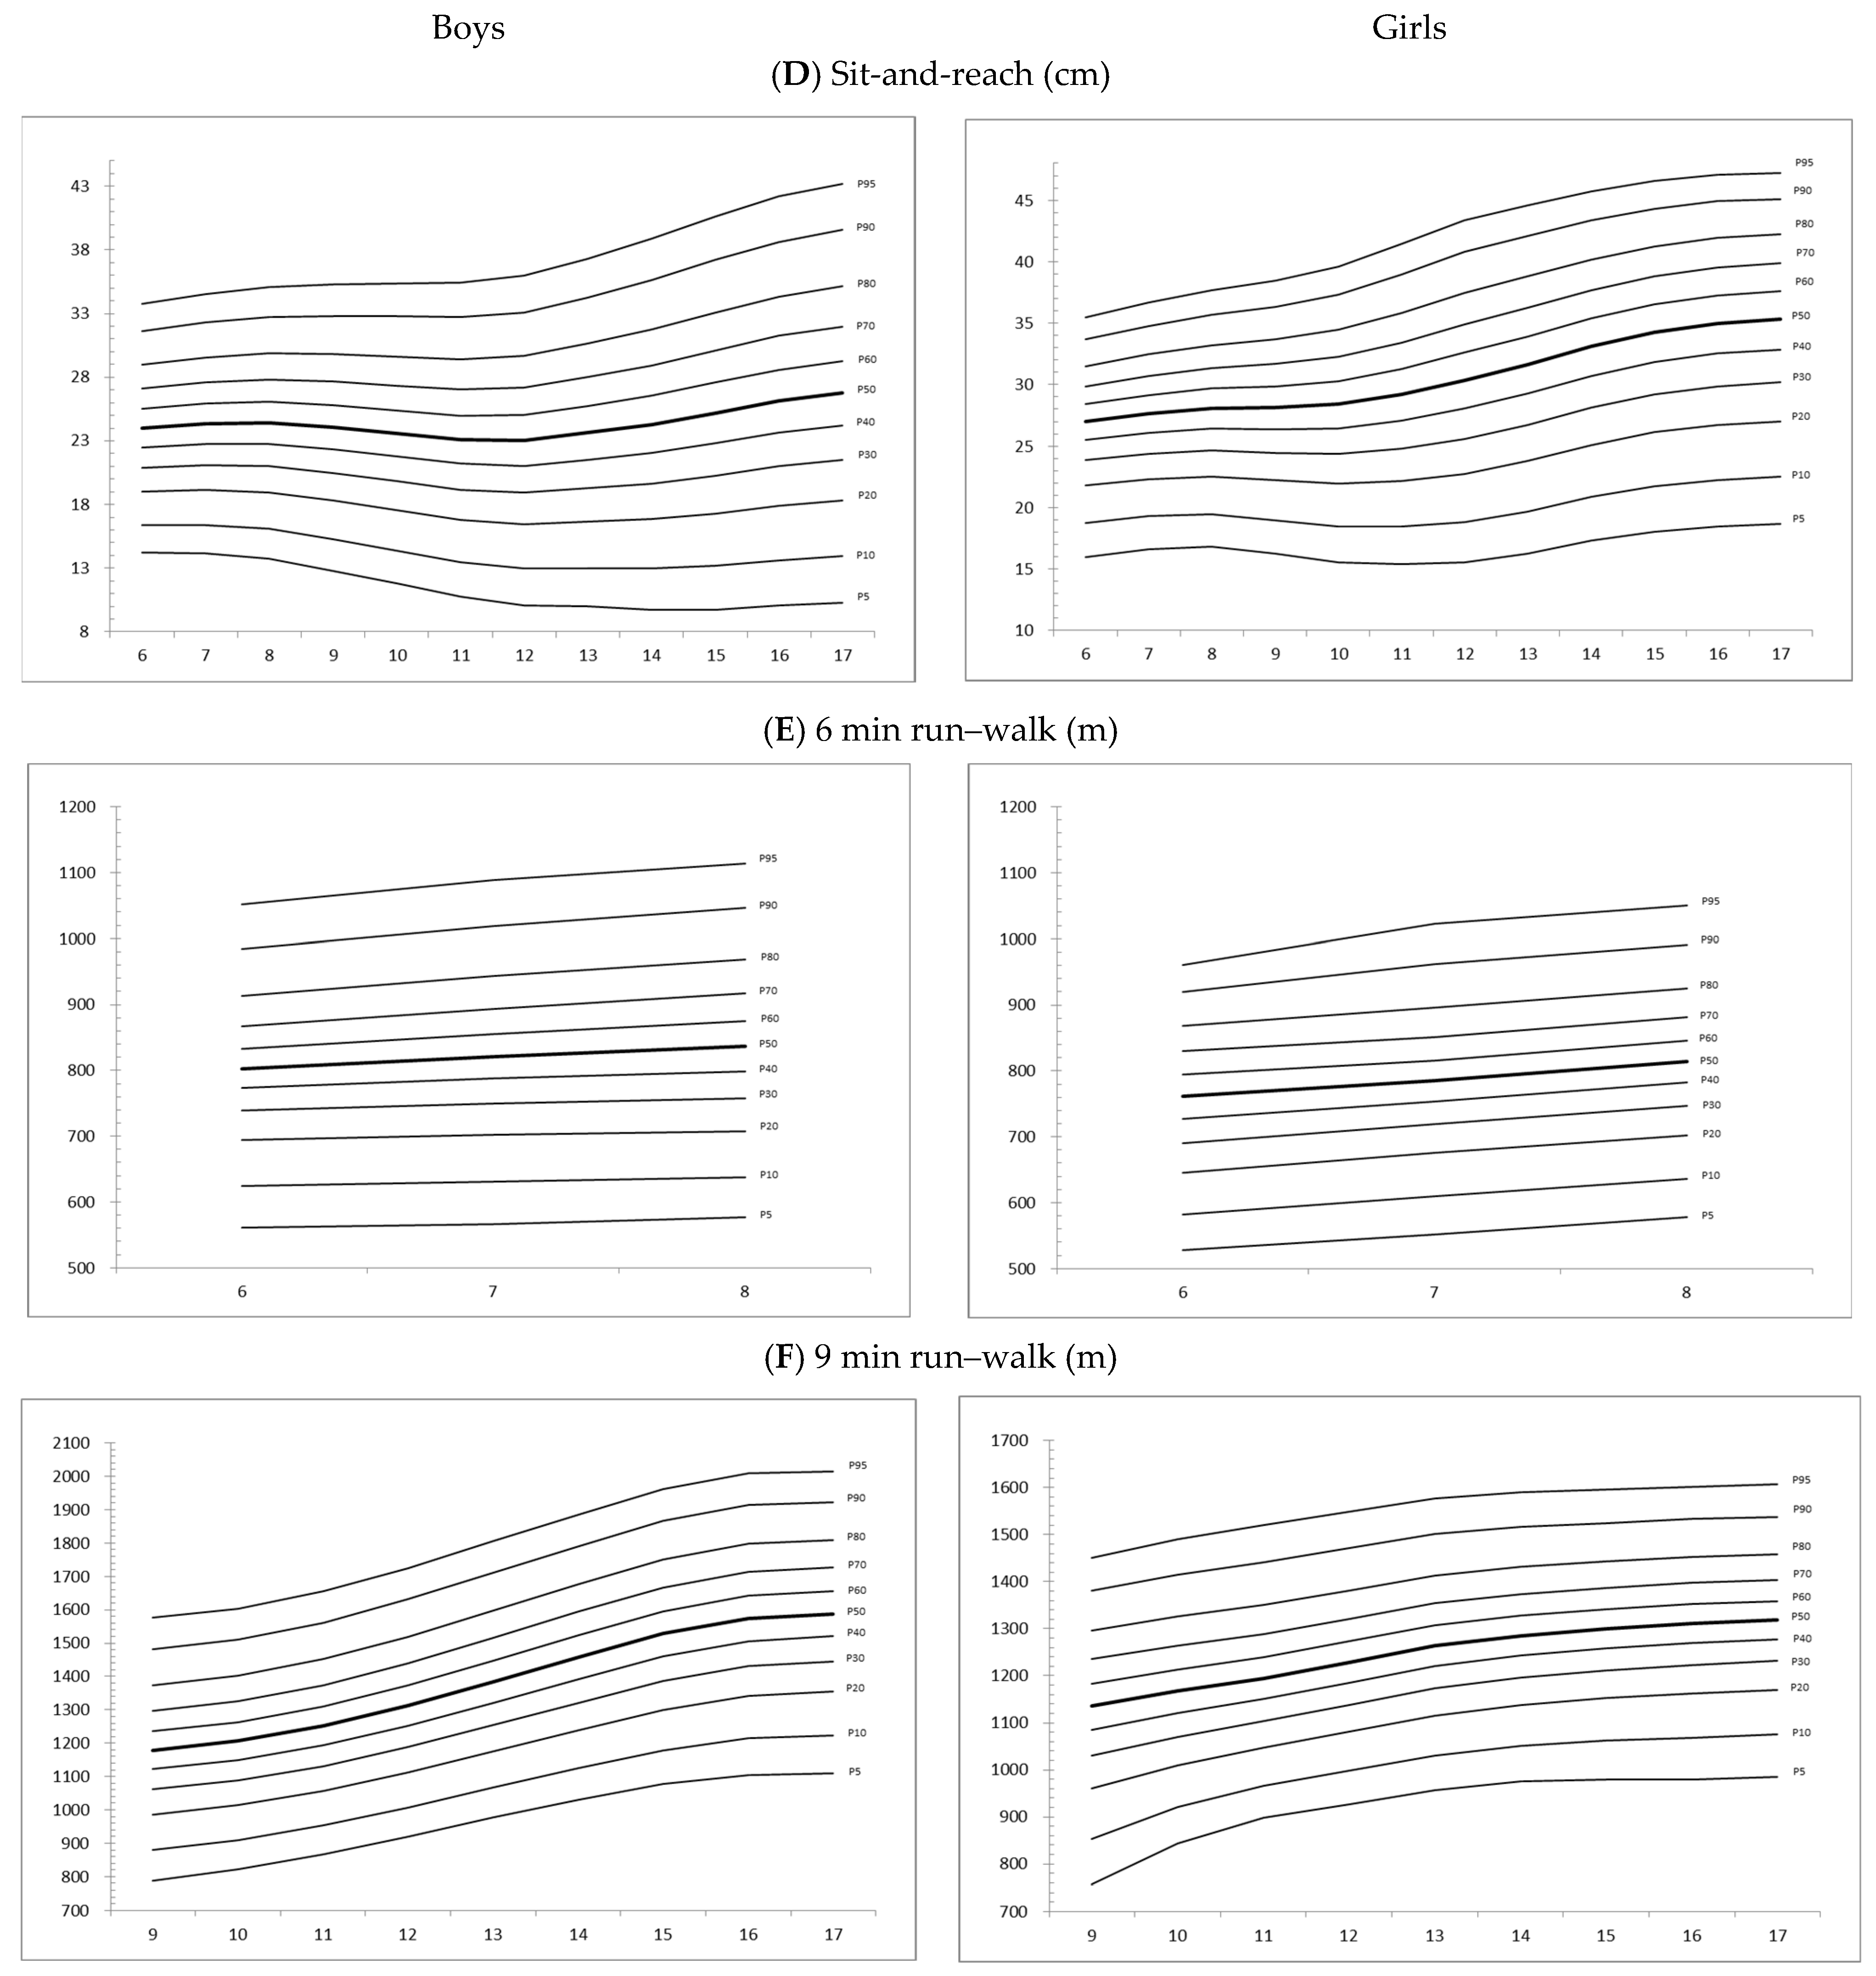
Centile Curves
4. Discussion
4.1. Classification of Fitness
4.2. Health Education
4.3. Policy
4.4. Strengths and Limitations
5. Conclusions
Author Contributions
Funding
Institutional Review Board Statement
Informed Consent Statement
Data Availability Statement
Acknowledgments
Conflicts of Interest
References
- Blasquez Shigaki, G.; Barbosa, C.C.L.; Batista, M.B.; Romanzini, C.L.; Gonçalves, E.M.; Serassuelo Junior, H.; Ronque, E.R. Tracking of health-related physical fitness between childhood and adulthood. Am. J. Hum. Biol. 2019, 32, e23381. [Google Scholar] [CrossRef] [PubMed]
- Telama, R. Tracking of physical activity from childhood to adulthood: A review. Obes. Facts 2009, 2, 187–195. [Google Scholar] [CrossRef] [PubMed]
- Corbin, C.B.; Pangrazi, R.P.; Franks, B.D. Definitions: Health, fitness and physical activity. Pres. Counc. Phys. Fit. Sports Res. Dig. 2000, 3, 1–8. [Google Scholar]
- World Health Organization. Diet and Physical Activity: A Public Health Priority. 2020. Available online: https://apps.who.int/gb/archive/pdf_files/WHA55/ea5516.pdf (accessed on 2 February 2022).
- The Centre for Health Protection. Promoting Health in Hong Kong: A Strategic Framework for Prevention and Control of Non-Communicable Diseases; HKSAR: Department of Health for Disease Prevention and Control: Hong Kong, China, 2013.
- Dong, Y.; Lau, P.W.C.; Dong, B.; Zou, Z.; Yang, Y.; Wen, B.; Ma, Y.; Hu, P.; Song, Y.; Ma, J.; et al. Trends in physical fitness, growth, and nutritional status of Chinese children and adolescents: A retrospective analysis of 1.5 million students from six successive national surveys between 1985 and 2014. Lancet Child Adolesc. Health 2019, 3, 871–880. [Google Scholar] [CrossRef]
- Malecka-Tendera, E.; Mazur, A. Childhood obesity: A pandemic of the twenty-first century. Int. J. Obes. 2006, 30, S1–S3. [Google Scholar] [CrossRef] [PubMed] [Green Version]
- Maffeis, C.; Zaffanello, M.; Schutz, Y. Relationship between physical inactivity and adiposity in prepubertal boys. J. Pediatr. 1997, 131, 288–292. [Google Scholar] [CrossRef]
- Ho, F.K.; So, H.; Wong, R.S.; Tung, K.T.S.; Louie, L.H.T.; Tung, J.; Mirpuri, S.; Chow, B.; Wong, W.H.S.; Lee, A.; et al. The reciprocal relationship between body mass index categories and physical fitness: A 4-year prospective cohort study of 20000 Chinese children. Pediatr. Obes. 2020, 15, e12646. [Google Scholar] [CrossRef] [PubMed]
- Lafortuna, C.L.; Fumagalli, E.; Vangeli, V.; Sartorio, A. Lower limb alactic anaerobic power output assessed with different techniques in morbid obesity. J. Endocrinol. Investig. 2002, 25, 134–141. [Google Scholar] [CrossRef] [PubMed]
- Tomkinson, G.R.; Leger, L.A.; Olds, T.S.; Cazorla, G. Secular trends in the performance of children and adolescents (1980–2000): An analysis of 55 studies of the 20m shuttle run test in 11 countries. Sports Med. 2003, 33, 285–300. [Google Scholar] [CrossRef]
- O’Malley, G.; Hussey, J.; Roche, E. A pilot study to profile the lower limb musculoskeletal health in children with obesity. Pediatr. Phys. Ther. 2012, 24, 292–298. [Google Scholar] [CrossRef] [Green Version]
- Huang, Y.C.; Malina, R.M. BMI and health-related physical fitness in Taiwanese youth 9-18 years. Med. Sci. Sports Exerc. 2007, 39, 701–708. [Google Scholar] [CrossRef]
- Xu, Y.; Mei, M.; Wang, H.; Yan, Q.; He, G. Association between Weight Status and Physical Fitness in Chinese Mainland Children and Adolescents: A Cross-Sectional Study. Int. J. Environ. Res. Public Health 2020, 17, 2468. [Google Scholar] [CrossRef] [PubMed] [Green Version]
- Yi, X.; Fu, Y.; Burns, R.D.; Bai, Y.; Zhang, P. Body mass index and physical fitness among Chinese adolescents from Shandong Province: A cross-sectional study. BMC Public Health 2019, 19, 81. [Google Scholar] [CrossRef] [PubMed]
- Shang, X.; Liu, A.; Li, Y.; Hu, X.; Du, L.; Ma, J.; Xu, G.; Li, Y.; Guo, H.; Ma, G. The Association of Weight Status with Physical Fitness among Chinese Children. Int. J. Pediatr. 2010, 2010, 515414. [Google Scholar] [CrossRef] [Green Version]
- Mak, K.-K.; Ho, S.-Y.; Lo, W.-S.; Thomas, G.N.; McManus, A.M.; Day, J.R.; Lam, T.-H. Health-related physical fitness and weight status in Hong Kong adolescents. BMC Public Health 2010, 10, 88. [Google Scholar] [CrossRef] [PubMed] [Green Version]
- Swinburn, B.; Egger, G.; Raza, F. Dissecting obesogenic environments: The development and application of a framework for identifying and prioritizing environmental interventions for obesity. Prev. Med. 1999, 29, 563–570. [Google Scholar] [CrossRef]
- Ip, P.; Ho, F.K.-W.; Louie, L.H.-T.; Chung, T.W.-H.; Cheung, Y.-F.; Lee, S.-L.; Hui, S.S.-C.; Ho, W.K.-Y.; Ho, D.S.-Y.; Wong, W.H.-S.; et al. Childhood Obesity and Physical Activity-Friendly School Environments. J. Pediatr. 2017, 191, 110–116. [Google Scholar] [CrossRef] [PubMed]
- Guan, H.; Okely, A.D.; Aguilar-Farias, N.; Del Pozo Cruz, B.; Draper, C.E.; El Hamdouchi, A.; Florindo, A.A.; Jáuregui, A.; Katzmarzyk, P.T.; Kontsevaya, A.; et al. Promoting healthy movement behaviours among children during the COVID-19 pandemic. Lancet Child Adolesc. Health 2020, 4, 416–418. [Google Scholar] [CrossRef]
- Guerrero, M.D.; Vanderloo, L.M.; Rhodes, R.E.; Faulkner, G.; Moore, S.A.; Tremblay, M.S. Canadian children’s and youth’s adherence to the 24-h movement guidelines during the COVID-19 pandemic: A decision tree analysis. J. Sport Health Sci. 2020, 9, 313–321. [Google Scholar] [CrossRef]
- Dayton, J.D.; Ford, K.; Carroll, S.J.; Flynn, P.A.; Kourtidou, S.; Holzer, R.J. The Deconditioning Effect of the COVID-19 Pandemic on Unaffected Healthy Children. Pediatr. Cardiol. 2021, 42, 554–559. [Google Scholar] [CrossRef]
- The Hong Kong Child Health Foundation. Physical Education-School Physical Fitness Award Scheme; Education Bureau, HKSAR: Hong Kong, China, 2020. Available online: https://www.edb.gov.hk/en/curriculum-development/kla/pe/references_resource/spfas/ (accessed on 2 February 2022).
- Ortega, F.B.; Ruiz, J.R.; Castillo, M.J.; Sjostrom, M. Physical fitness in childhood and adolescence: A powerful marker of health. Int. J. Obes. 2008, 32, 1–11. [Google Scholar] [CrossRef] [PubMed]
- Adam, C.; Klissouras, V.; Ravazzolo, M.; Renson, R.; Tuxworth, W.; Kemper, H. EUROFIT-European Test of Physical Fitness, 2nd ed.; Council of Europe: Strasbourg, France, 1993. [Google Scholar]
- Li, A.M.; Yin, J.; Au, J.T.; So, H.K.; Tsang, T.; Wong, E.; Fok, T.F.; Ng, P.C. Standard reference for the six-minute-walk test in healthy children aged 7 to 16 years. Am. J. Respir. Crit. Care Med. 2007, 176, 174–180. [Google Scholar] [CrossRef] [PubMed]
- Cole, T.J.; Bellizzi, M.C.; Flegal, K.M.; Dietz, W.H. Establishing a standard definition for child overweight and obesity worldwide: International survey. BMJ 2000, 320, 1240–1243. [Google Scholar] [CrossRef] [PubMed] [Green Version]
- Cole, T.J.; Stanojevic, S.; Stocks, J.; Coates, A.L.; Hankinson, J.L.; Wade, A.M. Age- and size-related reference ranges: A case study of spirometry through childhood and adulthood. Stat. Med. 2009, 28, 880–898. [Google Scholar] [CrossRef] [Green Version]
- Rigby, R.A.; Stasinopoulos, D.M. Smooth centile curves for skew and kurtotic data modelled using the Box-Cox power exponential distribution. Stat. Med. 2004, 23, 3053–3076. [Google Scholar] [CrossRef] [PubMed]
- Stasinopoulos, D.M.; Rigby, R.A. Generalized Additive Models for Location Scale and Shape (GAMLSS) in R. J. Stat. Softw. 2007, 23, 1–46. [Google Scholar] [CrossRef] [Green Version]
- Royston, P.; Wright, E.M. Goodness-of-fit statistics for age-specific reference intervals. Stat. Med. 2000, 19, 2943–2962. [Google Scholar] [CrossRef]
- Van Buuren, S.; Fredriks, M. Worm plot: A simple diagnostic device for modelling growth reference curves. Stat. Med. 2001, 20, 1259–1277. [Google Scholar] [CrossRef]
- Ortega, F.B.; Labayen, I.; Ruiz, J.R.; Kurvinen, E.; Loit, H.-M.; Harro, J.; Veidebaum, T.; Sjöström, M. Improvements in fitness reduce the risk of becoming overweight across puberty. Med. Sci. Sports Exerc. 2011, 43, 1891–1897. [Google Scholar] [CrossRef] [PubMed]
- Mahar, M.; Rowe, D. Practical Guidelines for Valid and Reliable Youth Fitness Testing. Meas. Phys. Educ. Exerc. Sci. 2008, 12, 126–145. [Google Scholar] [CrossRef]
- Tomkinson, G.R.; Carver, K.D.; Atkinson, F.; Daniell, N.D.; Lewis, L.K.; Fitzgerald, J.S.; Lang, J.J.; Ortega, F.B. European normative values for physical fitness in children and adolescents aged 9–17 years: Results from 2 779 165 Eurofit performances representing 30 countries. Br. J. Sports Med. 2018, 52, 1445–14563. [Google Scholar] [CrossRef] [PubMed]
- Catley, M.J.; Tomkinson, G.R. Normative health-related fitness values for children: Analysis of 85347 test results on 9–17-year-old Australians since 1985. Br. J. Sports Med. 2013, 47, 98–108. [Google Scholar] [CrossRef] [PubMed]
- Ortega, F.B.; Artero, E.G.; Ruiz, J.R.; Vicente-Rodriguez, G.; Bergman, P.; Hagströmer, M.; Ottevaere, C.; Nagy, E.; Konsta, O.; Rey-López, J.P.; et al. Reliability of health-related physical fitness tests in European adolescents. The HELENA Study. Int. J. Obes. 2008, 32, S49–S57. [Google Scholar] [CrossRef] [PubMed] [Green Version]
- Colan, S.D. The why and how of Z scores. J. Am. Soc. Echocardiogr. 2013, 26, 38–40. [Google Scholar] [CrossRef] [PubMed]
- O’Keeffe, B.T.; MacDonncha, C.; Ng, K.; Donnelly, A. Health-Related Fitness Monitoring Practices in Secondary School-Based Physical Education Programs. J. Teach. Phys. Educ. 2019, 12, 1–27. [Google Scholar]
- Casajus, J.A.; Leiva, M.T.; Villarroya, A.; Legaz, A.; Moreno, L.A. Physical performance and school physical education in overweight Spanish children. Ann. Nutr. Metab. 2007, 51, 288–296. [Google Scholar] [CrossRef]
- Hager-Ross, C.; Rosblad, B. Norms for grip strength in children aged 4–16 years. Acta Paediatr. 2002, 91, 617–625. [Google Scholar] [CrossRef]
- Ervin, R.B.; Fryar, C.D.; Wang, C.Y.; Miller, I.M.; Ogden, C.L. Strength and body weight in US children and adolescents. Pediatrics 2014, 134, e782–e789. [Google Scholar] [CrossRef] [Green Version]
- Yu, C. Handgrip Strength and Vertical Jump and their Relationship with Body Fat in Hong Kong Chinese Children and Adolescents. Open Access J. Biog. Sci. Res. 2021, 25, 7. [Google Scholar]
- Cale, L.; Harris, J.; Chen, M.H. Monitoring health, activity and fitness in physical education: Its current and future state of health. Sport Educ. Soc. 2014, 19, 376–397. [Google Scholar] [CrossRef] [Green Version]
- Mercier, K.; Silverman, S. High School Students’ Attitudes toward Fitness Testing. J. Teach. Phys. Educ. 2014, 33, 269–281. [Google Scholar] [CrossRef]
- Hobold, E.; Pires-Lopes, V.; Gómez-Campos, R.; de Arruda, M.; Andruske, C.L.; Pacheco-Carrillo, J.; Cossio-Bolaños, M.A. Reference standards to assess physical fitness of children and adolescents of Brazil: An approach to the students of the Lake Itaipu region-Brazil. PeerJ 2017, 5, e4032. [Google Scholar] [CrossRef] [PubMed] [Green Version]
- Castelli, D.M.; Hillman, C.H.; Buck, S.M.; Erwin, H.E. Physical fitness and academic achievement in third- and fifth-grade students. J. Sport Exerc. Psychol. 2007, 29, 239–252. [Google Scholar] [CrossRef] [PubMed]
- Pate, R.R.; Davis, M.G.; Robinson, T.N.; Stone, E.J.; McKenzie, T.L.; Young, J.C. Promoting physical activity in children and youth: A leadership role for schools: A scientific statement from the American Heart Association Council on Nutrition, Physical Activity, and Metabolism (Physical Activity Committee) in collaboration with the Councils on Cardiovascular Disease in the Young and Cardiovascular Nursing. Circulation 2006, 114, 1214–1224. [Google Scholar] [PubMed] [Green Version]
- Guinhouya, C.B.; Soubrier, S.; Vilhelm, C.; Ravaux, P.; Lemdani, M.; Durocher, A.; Hubert, H. Physical activity and sedentary lifestyle in children as time-limited functions: Usefulness of the principal component analysis method. Behav. Res. Methods 2007, 39, 682–688. [Google Scholar] [CrossRef] [PubMed]
- Arundell, L.; Hinkley, T.; Veitch, J.; Salmon, J. Contribution of the After-School Period to Children’s Daily Participation in Physical Activity and Sedentary Behaviours. PLoS ONE 2015, 10, e0140132. [Google Scholar] [CrossRef] [PubMed] [Green Version]
- Gao, Z.; Chen, S.; Huang, C.C.; Stodden, D.F.; Xiang, P. Investigating elementary school children’s daily physical activity and sedentary behaviours during weekdays. J. Sports Sci. 2017, 35, 99–104. [Google Scholar] [CrossRef] [Green Version]
- Census and Statistics Department. Healthy Exercise for All Campaign-Physical Fitness Test for the Community. Hong Kong Monthly Digest of Statistics; Hong Kong Special Administrative Region: Hong Kong, China, 2013. Available online: https://www.censtatd.gov.hk/en/EIndexbySubject.html?scode=380&pcode=FA100265 (accessed on 16 November 2022).
- Alsharairi, N.A. Current Government Actions and Potential Policy Options for Reducing Obesity in Queensland Schools. Children 2018, 5, 18. [Google Scholar] [CrossRef] [Green Version]
- So, H.K.; Chua, G.T.; Yip, K.M.; Tung, K.T.; Wong, R.S.; Louie, L.H.; Tso, W.W.; Wong, I.C.; Yam, J.C.; Kwan, M.Y.; et al. Impact of COVID-19 Pandemic on School-Aged Children’s Physical Activity, Screen Time, and Sleep in Hong Kong: A Cross-Sectional Repeated Measures Study. Int. J. Environ. Res. Public Health 2022, 19, 10539. [Google Scholar] [CrossRef]
- Joob, B.; Wiwanitkit, V. COVID-19, School Closings, and Weight Gain. Obesity 2020, 28, 1006. [Google Scholar] [CrossRef] [Green Version]
- Rundle, A.G.; Park, Y.; Herbstman, J.B.; Kinsey, E.W.; Wang, Y.C. COVID-19-Related School Closings and Risk of Weight Gain among Children. Obesity 2020, 28, 1008–1009. [Google Scholar] [CrossRef] [PubMed] [Green Version]
- Mannocci, A.; D’Egidio, V.; Backhaus, I.; Federici, A.; Sinopoli, A.; Varela, A.R.; Villari, P.; La Torre, G. Are There Effective Interventions to Increase Physical Activity in Children and Young People? An Umbrella Review. Int. J. Environ. Res. Public Health 2020, 17, 3528. [Google Scholar] [CrossRef] [PubMed]
- Smolianov, P.; Keating, X.; Liu, X.; Castro-Pinero, J.; Smith, J. Youth Fitness Testing Practices: Global Trends and New Development. Sport J. 2018, 21, 1. [Google Scholar]


| All (n = 119,693) | Boys (n = 61,679) | Girls (n = 58,014) | |||||
|---|---|---|---|---|---|---|---|
| n/Mean | %/Sd | n/Mean | %/Sd | n/Mean | %/Sd | p-Value ^ | |
| School type | |||||||
| Primary | 89,438 | 74.70% | 45,728 | 74.10% | 43,710 | 75.30% | <0.01 ** |
| Secondary | 30,255 | 25.30% | 15,951 | 25.90% | 14,304 | 24.70% | |
| Age (year) | 10.89 | 2.99 | 10.94 | 3.02 | 10.85 | 2.96 | <0.01 ** |
| 6 | 9366 | 7.80% | 4802 | 7.80% | 4564 | 7.90% | |
| 7 | 10,902 | 9.10% | 5651 | 9.20% | 5251 | 9.10% | |
| 8 | 14,724 | 12.30% | 7513 | 12.20% | 7211 | 12.40% | |
| 9 | 16,700 | 14.00% | 8383 | 13.60% | 8317 | 14.30% | |
| 10 | 16,975 | 14.20% | 8684 | 14.10% | 8291 | 14.30% | |
| 11 | 16,535 | 13.80% | 8450 | 13.70% | 8085 | 13.90% | |
| 12 | 7746 | 6.50% | 3965 | 6.40% | 3781 | 6.50% | |
| 13 | 5423 | 4.50% | 2837 | 4.60% | 2586 | 4.50% | |
| 14 | 5240 | 4.40% | 2808 | 4.60% | 2432 | 4.20% | |
| 15 | 5488 | 4.60% | 2899 | 4.70% | 2589 | 4.50% | |
| 16 | 5377 | 4.50% | 2900 | 4.70% | 2477 | 4.30% | |
| 17 | 5217 | 4.40% | 2787 | 4.50% | 2430 | 4.20% | |
| Height (cm) | 142.98 | 16.46 | 144.23 | 17.66 | 141.64 | 14.96 | <0.01 ** |
| Weight (kg) | 39.31 | 19.14 | 39.96 | 23.4 | 36.54 | 12.94 | <0.01 ** |
| BMI (kg/m2) | 18.06 | 6.95 | 18.46 | 9.06 | 17.64 | 3.47 | <0.01 ** |
| Body status # | |||||||
| Underweight | 5969 | 5.00% | 2688 | 4.40% | 3281 | 5.70% | <0.01 ** |
| Normal | 90,859 | 75.90% | 44,404 | 72.00% | 46,455 | 80.10% | |
| Overweight | 17,257 | 14.40% | 10,666 | 17.30% | 6591 | 11.40% | |
| Obese | 5608 | 4.70% | 3921 | 6.40% | 1687 | 2.90% | |
| Fitness scores | |||||||
| Handgrip strength (kg) | 12.98 | 4.78 | 13.36 | 4.76 | 12.59 | 4.76 | <0.01 ** |
| Push-up (Reps a) | 17.86 | 11.9 | 20.9 | 12.44 | 12.95 | 9.02 | <0.01 ** |
| 1 min sit-up (Reps) | 26.67 | 11.17 | 27.93 | 11.83 | 25.31 | 10.24 | <0.01 ** |
| Sit-and-reach (cm) | 26.72 | 8.31 | 24.14 | 7.77 | 29.48 | 7.97 | <0.01 ** |
| 6 min run–walk (m) | 833.07 | 165.81 | 852.87 | 172.35 | 811.9 | 155.79 | <0.01 ** |
| 9 min run–walk (m) | 1302.08 | 256.11 | 1366.08 | 289.77 | 1239.72 | 199.53 | <0.01 ** |
| Boys | Total (n = 61,679) | Underweight (n = 2688) | Normal (n = 44,404) | Overweight (n = 10,666) | Obese (n = 3921) | |||||||
|---|---|---|---|---|---|---|---|---|---|---|---|---|
| n/Mean | %/Sd | n/Mean | %/Sd | n/Mean | %/Sd | n/Mean | %/Sd | n/Mean | %/Sd | F | p-Value | |
| Fitness scores | ||||||||||||
| Handgrip strength (kg) | 13.36 | 4.76 | 11.26 a | 3.80 | 12.85 b | 4.54 | 15.13 c | 4.90 | 15.61 d | 4.76 | 836.13 | <0.001 |
| Push-up (Reps) | 20.90 | 12.44 | 19.57 a | 12.19 | 22.60 b | 12.30 | 17.29 a | 11.30 | 11.82 c | 10.80 | 81.41 | <0.001 |
| 1 min sit-up (Reps) | 27.93 | 11.83 | 27.73 a | 11.62 | 28.90 b | 12.07 | 26.06 c | 10.66 | 22.30 d | 9.98 | 479.72 | <0.001 |
| Sit-and-reach (cm) | 24.14 | 7.77 | 22.87 a | 7.72 | 24.52 b | 7.74 | 23.47 c | 7.80 | 22.57 a | 7.73 | 136.23 | <0.001 |
| 6 min run–walk (m) | 852.87 | 172.35 | 861.05 a | 163.48 | 866.49 a | 171.14 | 817.65 b | 160.43 | 751.36 c | 174.20 | 67.25 | <0.001 |
| 9 min run–walk (m) | 1366.08 | 289.77 | 1403.73 a | 280.76 | 1416.83 a | 284.25 | 1248.43 b | 252.30 | 1122.56 c | 229.07 | 712.84 | <0.001 |
| Girls | Total (n = 58,014) | Underweight (n = 3281) | Normal (n = 46,455) | Overweight (n = 6591) | Obese (n = 1687) | |||||||
| n/Mean | %/Sd | n/Mean | %/Sd | n/Mean | %/Sd | n/Mean | %/Sd | n/Mean | %/Sd | F | p-Value | |
| Fitness scores | ||||||||||||
| Handgrip strength (kg) | 12.59 | 4.76 | 10.78 a | 3.78 | 12.35 b | 4.62 | 14.52 c | 5.17 | 14.71 d | 5.65 | 507.40 | <0.001 |
| Push-up (Reps a) | 12.95 | 9.02 | 13.12 a,b | 9.59 | 13.27 b | 9.00 | 11.12 a,c | 8.70 | 9.27 c | 7.90 | 6.89 | <0.001 |
| 1 min sit-up (Reps) | 25.31 | 10.24 | 24.73 a | 10.08 | 25.76 b | 10.34 | 23.57 c | 9.40 | 20.88 d | 9.25 | 195.89 | <0.001 |
| Sit-and-reach (cm) | 29.48 | 7.97 | 27.95 a | 7.53 | 29.70 b | 7.99 | 29.01 a | 7.93 | 28.22 a | 7.74 | 72.11 | <0.001 |
| 6 min run–walk (m) | 811.90 | 155.79 | 823.37 a | 149.86 | 818.29 a | 155.44 | 780.19 b | 149.01 | 727.70 c | 160.20 | 29.14 | <0.001 |
| 9 min run–walk (m) | 1239.72 | 199.53 | 1260.56 a | 194.41 | 1256.79 a | 196.09 | 1148.52 b | 183.72 | 1071.53 c | 195.85 | 344.68 | <0.001 |
| Fitness Test | Distribution | Link | λ | df(μ) | df(σ) | df(ν) | df(τ) | df | Deviance | AIC | SBC |
|---|---|---|---|---|---|---|---|---|---|---|---|
| Boys | |||||||||||
| Handgrip strength (kg) | BCT | log | 1.50 | 7.14 | 6.14 | 3.34 | 4.67 | 21.28 | 208,931.31 | 208,960.52 | 209,143.46 |
| Push-up (Reps) | NO | identity | 1.50 | 4.39 | 2.65 | - | - | 7.04 | 26,549.29 | 26,560.44 | 26,603.60 |
| 1 min sit-up (Reps) | NO | identity | 0.78 | 9.20 | 8.47 | - | - | 17.66 | 415,421.28 | 415,442.86 | 415,600.62 |
| Sit-and-reach (cm) | NO | identity | 1.30 | 8.89 | 5.65 | - | - | 14.53 | 387,289.77 | 387,308.72 | 387,438.65 |
| 6 min run–walk (m) | BCPE | log | 1.50 | 7.51 | 4.41 | 2.00 | 4.50 | 18.42 | 75,799.70 | 75,789.74 | 75,912.54 |
| 9 min run–walk (m) | BCT | log | 1.50 | 7.54 | 3.42 | 3.74 | 4.77 | 19.47 | 253,813.18 | 253,840.12 | 253,992.32 |
| Girls | |||||||||||
| Handgrip strength (kg) | BCT | log | 1.50 | 8.34 | 5.99 | 3.94 | 3.04 | 21.32 | 205,631.59 | 205,661.01 | 205,844.34 |
| Push-up (Reps a) | NO | identity | 0.60 | 4.04 | 4.25 | - | - | 8.29 | 15,811.04 | 15,823.62 | 15,870.78 |
| 1 min sit-up (Reps) | NO | identity | 1.33 | 9.83 | 6.26 | - | - | 16.09 | 393,160.19 | 393,180.17 | 393,323.30 |
| Sit-and-reach (cm) | BCPE | log | 0.35 | 10.36 | 8.50 | 6.98 | 3.44 | 29.28 | 373,870.47 | 373,910.68 | 374,171.48 |
| 6 min run–walk (m) | BCPE | log | 1.50 | 5.00 | 5.00 | 5.00 | 5.00 | 20.00 | 72,002.41 | 72,030.41 | 72,163.09 |
| 9 min run–walk (m) | BCPE | log | 5.85 | 6.39 | 4.40 | 6.57 | 2.03 | 19.38 | 260,394.30 | 260,421.55 | 260,574.30 |
| (a) | |||||||||||
| Age (year) | P5 | P10 | P20 | P30 | P40 | P50 | P60 | P70 | P80 | P90 | P95 |
| Boys | |||||||||||
| 6 | 3.71 | 4.56 | 5.59 | 6.33 | 6.96 | 7.55 | 8.15 | 8.79 | 9.54 | 10.61 | 11.5 |
| 7 | 4.87 | 5.78 | 6.87 | 7.66 | 8.33 | 8.97 | 9.61 | 10.3 | 11.13 | 12.31 | 13.32 |
| 8 | 6.22 | 7.19 | 8.36 | 9.2 | 9.92 | 10.6 | 11.28 | 12.04 | 12.95 | 14.27 | 15.44 |
| 9 | 7.52 | 8.59 | 9.86 | 10.77 | 11.56 | 12.3 | 13.05 | 13.89 | 14.91 | 16.44 | 17.85 |
| 10 | 8.64 | 9.81 | 11.22 | 12.23 | 13.1 | 13.93 | 14.78 | 15.72 | 16.89 | 18.67 | 20.32 |
| 11 | 9.91 | 11.16 | 12.7 | 13.83 | 14.82 | 15.77 | 16.75 | 17.84 | 19.17 | 21.17 | 22.98 |
| Girls | |||||||||||
| 6 | 3.17 | 3.98 | 4.93 | 5.61 | 6.19 | 6.74 | 7.28 | 7.88 | 8.6 | 9.64 | 10.56 |
| 7 | 4.29 | 5.15 | 6.17 | 6.9 | 7.51 | 8.1 | 8.68 | 9.32 | 10.1 | 11.22 | 12.22 |
| 8 | 5.53 | 6.44 | 7.51 | 8.28 | 8.93 | 9.55 | 10.17 | 10.86 | 11.68 | 12.89 | 13.96 |
| 9 | 6.77 | 7.77 | 8.96 | 9.81 | 10.54 | 11.23 | 11.94 | 12.71 | 13.65 | 15.04 | 16.28 |
| 10 | 8.02 | 9.13 | 10.47 | 11.44 | 12.28 | 13.09 | 13.91 | 14.82 | 15.94 | 17.6 | 19.09 |
| 11 | 9.52 | 10.79 | 12.36 | 13.52 | 14.53 | 15.5 | 16.5 | 17.6 | 18.97 | 21.01 | 22.85 |
| (b) | |||||||||||
| Age (year) | P5 | P10 | P20 | P30 | P40 | P50 | P60 | P70 | P80 | P90 | P95 |
| Boys | |||||||||||
| 12 | 0 | 0 | 4 | 7 | 10 | 13 | 15 | 18 | 21 | 26 | 30 |
| 13 | 0 | 1 | 6 | 10 | 13 | 16 | 19 | 22 | 25 | 30 | 34 |
| 14 | 0 | 3 | 8 | 12 | 15 | 18 | 21 | 24 | 28 | 33 | 37 |
| 15 | 0 | 5 | 10 | 14 | 17 | 20 | 24 | 27 | 31 | 36 | 41 |
| 16 | 2 | 6 | 12 | 16 | 19 | 22 | 25 | 29 | 33 | 38 | 43 |
| 17 | 2 | 7 | 12 | 16 | 19 | 23 | 26 | 29 | 33 | 39 | 43 |
| Girls | |||||||||||
| 12 | 0 | 0 | 3 | 6 | 9 | 11 | 14 | 17 | 20 | 25 | 29 |
| 13 | 0 | 0 | 4 | 7 | 9 | 12 | 14 | 17 | 20 | 24 | 27 |
| 14 | 0 | 1 | 5 | 8 | 10 | 12 | 14 | 17 | 19 | 23 | 26 |
| 15 | 0 | 1 | 5 | 8 | 10 | 12 | 15 | 17 | 20 | 24 | 27 |
| 16 | 0 | 1 | 5 | 8 | 10 | 13 | 15 | 17 | 20 | 24 | 28 |
| 17 | 0 | 1 | 5 | 8 | 11 | 13 | 15 | 18 | 21 | 25 | 28 |
| (c) | |||||||||||
| Age (year) | P5 | P10 | P20 | P30 | P40 | P50 | P60 | P70 | P80 | P90 | P95 |
| Boys | |||||||||||
| 6 | 14.23 | 16.39 | 19 | 20.88 | 22.49 | 23.99 | 25.5 | 27.11 | 28.99 | 31.6 | 33.75 |
| 7 | 14.15 | 16.41 | 19.13 | 21.1 | 22.78 | 24.35 | 25.92 | 27.6 | 29.56 | 32.29 | 34.54 |
| 8 | 13.72 | 16.08 | 18.94 | 21 | 22.76 | 24.41 | 26.06 | 27.82 | 29.88 | 32.74 | 35.1 |
| 9 | 12.79 | 15.28 | 18.29 | 20.46 | 22.32 | 24.05 | 25.79 | 27.64 | 29.81 | 32.82 | 35.31 |
| 10 | 11.77 | 14.37 | 17.53 | 19.81 | 21.75 | 23.57 | 25.39 | 27.34 | 29.61 | 32.77 | 35.38 |
| 11 | 10.77 | 13.49 | 16.79 | 19.17 | 21.2 | 23.09 | 24.99 | 27.02 | 29.4 | 32.7 | 35.42 |
| 12 | 10.1 | 12.96 | 16.42 | 18.91 | 21.04 | 23.03 | 25.02 | 27.16 | 29.65 | 33.11 | 35.96 |
| 13 | 9.97 | 12.99 | 16.64 | 19.28 | 21.53 | 23.63 | 25.74 | 27.99 | 30.63 | 34.28 | 37.3 |
| 14 | 9.73 | 12.95 | 16.85 | 19.66 | 22.06 | 24.3 | 26.55 | 28.95 | 31.76 | 35.65 | 38.87 |
| 15 | 9.75 | 13.16 | 17.29 | 20.27 | 22.82 | 25.2 | 27.58 | 30.13 | 33.11 | 37.24 | 40.65 |
| 16 | 10.05 | 13.6 | 17.9 | 21 | 23.65 | 26.12 | 28.6 | 31.25 | 34.35 | 38.65 | 42.2 |
| 17 | 10.28 | 13.92 | 18.32 | 21.5 | 24.21 | 26.75 | 29.28 | 31.99 | 35.17 | 39.57 | 43.21 |
| Girls | |||||||||||
| 6 | 15.98 | 18.76 | 21.82 | 23.86 | 25.51 | 26.98 | 28.4 | 29.87 | 31.52 | 33.71 | 35.45 |
| 7 | 16.63 | 19.29 | 22.32 | 24.38 | 26.09 | 27.64 | 29.14 | 30.69 | 32.45 | 34.79 | 36.65 |
| 8 | 16.84 | 19.49 | 22.55 | 24.68 | 26.46 | 28.09 | 29.69 | 31.34 | 33.21 | 35.7 | 37.67 |
| 9 | 16.23 | 18.98 | 22.2 | 24.47 | 26.38 | 28.15 | 29.88 | 31.67 | 33.69 | 36.36 | 38.48 |
| 10 | 15.57 | 18.48 | 21.92 | 24.37 | 26.45 | 28.39 | 30.28 | 32.24 | 34.44 | 37.34 | 39.62 |
| 11 | 15.39 | 18.47 | 22.15 | 24.81 | 27.08 | 29.21 | 31.29 | 33.43 | 35.83 | 38.97 | 41.43 |
| 12 | 15.55 | 18.81 | 22.75 | 25.6 | 28.06 | 30.35 | 32.6 | 34.91 | 37.47 | 40.79 | 43.37 |
| 13 | 16.27 | 19.69 | 23.78 | 26.74 | 29.27 | 31.63 | 33.93 | 36.27 | 38.82 | 42.1 | 44.6 |
| 14 | 17.3 | 20.87 | 25.1 | 28.13 | 30.71 | 33.1 | 35.4 | 37.71 | 40.2 | 43.34 | 45.7 |
| 15 | 18.04 | 21.77 | 26.12 | 29.21 | 31.83 | 34.24 | 36.55 | 38.83 | 41.27 | 44.29 | 46.54 |
| 16 | 18.43 | 22.26 | 26.72 | 29.86 | 32.53 | 34.96 | 37.28 | 39.56 | 41.97 | 44.92 | 47.09 |
| 17 | 18.7 | 22.55 | 27.03 | 30.19 | 32.86 | 35.3 | 37.6 | 39.86 | 42.23 | 45.1 | 47.19 |
| (d) | |||||||||||
| Age (year) | P5 | P10 | P20 | P30 | P40 | P50 | P60 | P70 | P80 | P90 | P95 |
| Boys | |||||||||||
| 6 | 3 | 6 | 10 | 13 | 15 | 17 | 19 | 22 | 25 | 29 | 32 |
| 7 | 3 | 7 | 11 | 14 | 17 | 19 | 22 | 24 | 28 | 32 | 35 |
| 8 | 6 | 9 | 14 | 17 | 19 | 22 | 24 | 27 | 30 | 34 | 38 |
| 9 | 8 | 12 | 16 | 19 | 22 | 24 | 27 | 29 | 32 | 36 | 40 |
| 10 | 9 | 13 | 17 | 20 | 23 | 26 | 28 | 31 | 34 | 38 | 42 |
| 11 | 11 | 15 | 19 | 22 | 25 | 28 | 30 | 33 | 36 | 41 | 45 |
| 12 | 13 | 17 | 22 | 25 | 28 | 30 | 33 | 36 | 39 | 44 | 48 |
| 13 | 16 | 20 | 24 | 28 | 30 | 33 | 35 | 38 | 41 | 46 | 50 |
| 14 | 19 | 22 | 27 | 30 | 33 | 35 | 38 | 41 | 44 | 48 | 52 |
| 15 | 20 | 24 | 29 | 32 | 35 | 37 | 40 | 43 | 46 | 50 | 54 |
| 16 | 21 | 25 | 30 | 33 | 36 | 39 | 41 | 44 | 48 | 52 | 56 |
| 17 | 22 | 26 | 31 | 34 | 37 | 40 | 42 | 45 | 48 | 53 | 57 |
| Girls | |||||||||||
| 6 | 1 | 4 | 8 | 11 | 14 | 16 | 18 | 21 | 24 | 28 | 31 |
| 7 | 3 | 7 | 11 | 14 | 16 | 18 | 21 | 23 | 26 | 30 | 33 |
| 8 | 6 | 9 | 13 | 16 | 18 | 20 | 23 | 25 | 28 | 32 | 35 |
| 9 | 8 | 11 | 15 | 18 | 20 | 23 | 25 | 27 | 30 | 34 | 38 |
| 10 | 10 | 13 | 17 | 20 | 22 | 25 | 27 | 30 | 33 | 37 | 40 |
| 11 | 12 | 15 | 19 | 22 | 25 | 27 | 29 | 32 | 35 | 39 | 43 |
| 12 | 13 | 17 | 21 | 24 | 26 | 29 | 31 | 34 | 36 | 41 | 44 |
| 13 | 13 | 17 | 21 | 24 | 26 | 29 | 31 | 34 | 37 | 41 | 44 |
| 14 | 14 | 17 | 22 | 25 | 27 | 29 | 32 | 34 | 37 | 42 | 45 |
| 15 | 15 | 18 | 23 | 26 | 28 | 30 | 33 | 35 | 38 | 43 | 46 |
| 16 | 16 | 19 | 23 | 26 | 29 | 31 | 34 | 36 | 39 | 44 | 47 |
| 17 | 16 | 19 | 24 | 27 | 29 | 32 | 34 | 37 | 40 | 45 | 48 |
| (e) | |||||||||||
| Age (year) | P5 | P10 | P20 | P30 | P40 | P50 | P60 | P70 | P80 | P90 | P95 |
| Boys | |||||||||||
| 6 | 560.64 | 624.84 | 694.71 | 739.43 | 773.83 | 803.03 | 832.32 | 867.09 | 912.69 | 984.87 | 1052.28 |
| 7 | 566.79 | 630.43 | 702.24 | 749.99 | 787.98 | 821.3 | 854.82 | 893.55 | 943.04 | 1019.18 | 1088.52 |
| 8 | 577.52 | 636.99 | 707.56 | 757.1 | 798.39 | 836.21 | 874.41 | 916.99 | 969.33 | 1046.42 | 1113.85 |
| Girls | |||||||||||
| 6 | 527.59 | 582.15 | 645.66 | 690.13 | 727.42 | 761.68 | 795.1 | 829.65 | 868.56 | 920.06 | 960.73 |
| 7 | 551.43 | 609.55 | 675.2 | 719.03 | 754.1 | 785.06 | 816.08 | 851.37 | 895.73 | 962.66 | 1022.44 |
| 8 | 578.56 | 636.8 | 702.76 | 747.02 | 782.59 | 814.15 | 845.72 | 881.3 | 925.6 | 991.68 | 1050.05 |
| (f) | |||||||||||
| Age (year) | P5 | P10 | P20 | P30 | P40 | P50 | P60 | P70 | P80 | P90 | P95 |
| Boys | |||||||||||
| 9 | 786.51 | 878.98 | 986.9 | 1061.64 | 1123.37 | 1179.49 | 1235.69 | 1297.65 | 1372.92 | 1482.08 | 1576.07 |
| 10 | 821.13 | 909.77 | 1014.81 | 1088.65 | 1150.36 | 1207.04 | 1263.96 | 1326.47 | 1402.02 | 1510.98 | 1604.35 |
| 11 | 866.82 | 953.16 | 1057.02 | 1131.15 | 1193.87 | 1252.08 | 1310.68 | 1374.69 | 1451.54 | 1561.51 | 1655.09 |
| 12 | 920.56 | 1006.93 | 1111.95 | 1187.79 | 1252.59 | 1313.19 | 1374.24 | 1440.5 | 1519.41 | 1631.19 | 1725.43 |
| 13 | 977.96 | 1066.86 | 1175.3 | 1253.94 | 1321.38 | 1384.64 | 1448.24 | 1516.81 | 1597.79 | 1711.33 | 1806.12 |
| 14 | 1031.27 | 1125.47 | 1239.58 | 1321.87 | 1392.19 | 1457.91 | 1523.68 | 1594.15 | 1676.75 | 1791.53 | 1886.51 |
| 15 | 1077.08 | 1179.09 | 1300.7 | 1387.18 | 1460.32 | 1528.11 | 1595.5 | 1667.34 | 1751.14 | 1866.89 | 1962.07 |
| 16 | 1104.69 | 1213.99 | 1341.9 | 1431.39 | 1506.17 | 1574.83 | 1642.67 | 1714.75 | 1798.58 | 1913.98 | 2008.53 |
| 17 | 1109.53 | 1223.35 | 1354.51 | 1445.06 | 1520.03 | 1588.35 | 1655.51 | 1726.61 | 1809.03 | 1922.01 | 2014.2 |
| Girls | |||||||||||
| 9 | 757.06 | 853.98 | 960.08 | 1030 | 1085.92 | 1135.51 | 1183.85 | 1235.5 | 1296.14 | 1380.47 | 1450.12 |
| 10 | 843.67 | 920.26 | 1009.33 | 1070.84 | 1121.56 | 1167.6 | 1213.62 | 1264.23 | 1325.51 | 1414.03 | 1489.97 |
| 11 | 897.63 | 965.63 | 1046.59 | 1103.61 | 1151.23 | 1194.95 | 1239.24 | 1288.8 | 1350.04 | 1440.81 | 1520.75 |
| 12 | 927.36 | 997.81 | 1080.57 | 1138.1 | 1185.67 | 1228.96 | 1272.61 | 1321.42 | 1381.65 | 1470.73 | 1548.95 |
| 13 | 957.5 | 1030.68 | 1115.33 | 1173.35 | 1220.8 | 1263.58 | 1306.5 | 1354.42 | 1413.48 | 1500.6 | 1576.84 |
| 14 | 975.76 | 1051.91 | 1138.38 | 1196.66 | 1243.72 | 1285.68 | 1327.55 | 1374.25 | 1431.72 | 1516.27 | 1590.01 |
| 15 | 980.04 | 1061.77 | 1152.08 | 1211.51 | 1258.68 | 1300.14 | 1341.16 | 1386.8 | 1442.8 | 1524.76 | 1595.78 |
| 16 | 979.47 | 1067.53 | 1162.2 | 1223.05 | 1270.54 | 1311.71 | 1352.16 | 1397.13 | 1452.22 | 1532.63 | 1602.02 |
| 17 | 984.86 | 1074.71 | 1170.26 | 1231.06 | 1278.13 | 1318.63 | 1358.39 | 1402.82 | 1457.53 | 1537.84 | 1607.48 |
Publisher’s Note: MDPI stays neutral with regard to jurisdictional claims in published maps and institutional affiliations. |
© 2022 by the authors. Licensee MDPI, Basel, Switzerland. This article is an open access article distributed under the terms and conditions of the Creative Commons Attribution (CC BY) license (https://creativecommons.org/licenses/by/4.0/).
Share and Cite
Yip, K.-M.; Wong, S.W.S.; Chua, G.T.; So, H.-K.; Ho, F.K.; Wong, R.S.; Tung, K.T.S.; Chan, E.Y.N.; Tso, W.W.Y.; Chow, B.-C.; et al. Age- and Sex-Specific Physical Fitness Reference and Association with Body Mass Index in Hong Kong Chinese Schoolchildren. Int. J. Environ. Res. Public Health 2022, 19, 15346. https://doi.org/10.3390/ijerph192215346
Yip K-M, Wong SWS, Chua GT, So H-K, Ho FK, Wong RS, Tung KTS, Chan EYN, Tso WWY, Chow B-C, et al. Age- and Sex-Specific Physical Fitness Reference and Association with Body Mass Index in Hong Kong Chinese Schoolchildren. International Journal of Environmental Research and Public Health. 2022; 19(22):15346. https://doi.org/10.3390/ijerph192215346
Chicago/Turabian StyleYip, Ka-Man, Sam W. S. Wong, Gilbert T. Chua, Hung-Kwan So, Frederick K. Ho, Rosa S. Wong, Keith T. S. Tung, Elaine Y. N. Chan, Winnie W. Y. Tso, Bik-Chu. Chow, and et al. 2022. "Age- and Sex-Specific Physical Fitness Reference and Association with Body Mass Index in Hong Kong Chinese Schoolchildren" International Journal of Environmental Research and Public Health 19, no. 22: 15346. https://doi.org/10.3390/ijerph192215346