
Gender Differences in Eating Habits of Polish Young Adults Aged 20–26

Abstract
:1. Introduction
2. Materials and Methods
2.1. Research Project and Sample
2.2. Measures
Nutrition Rating
2.3. Data Analysis
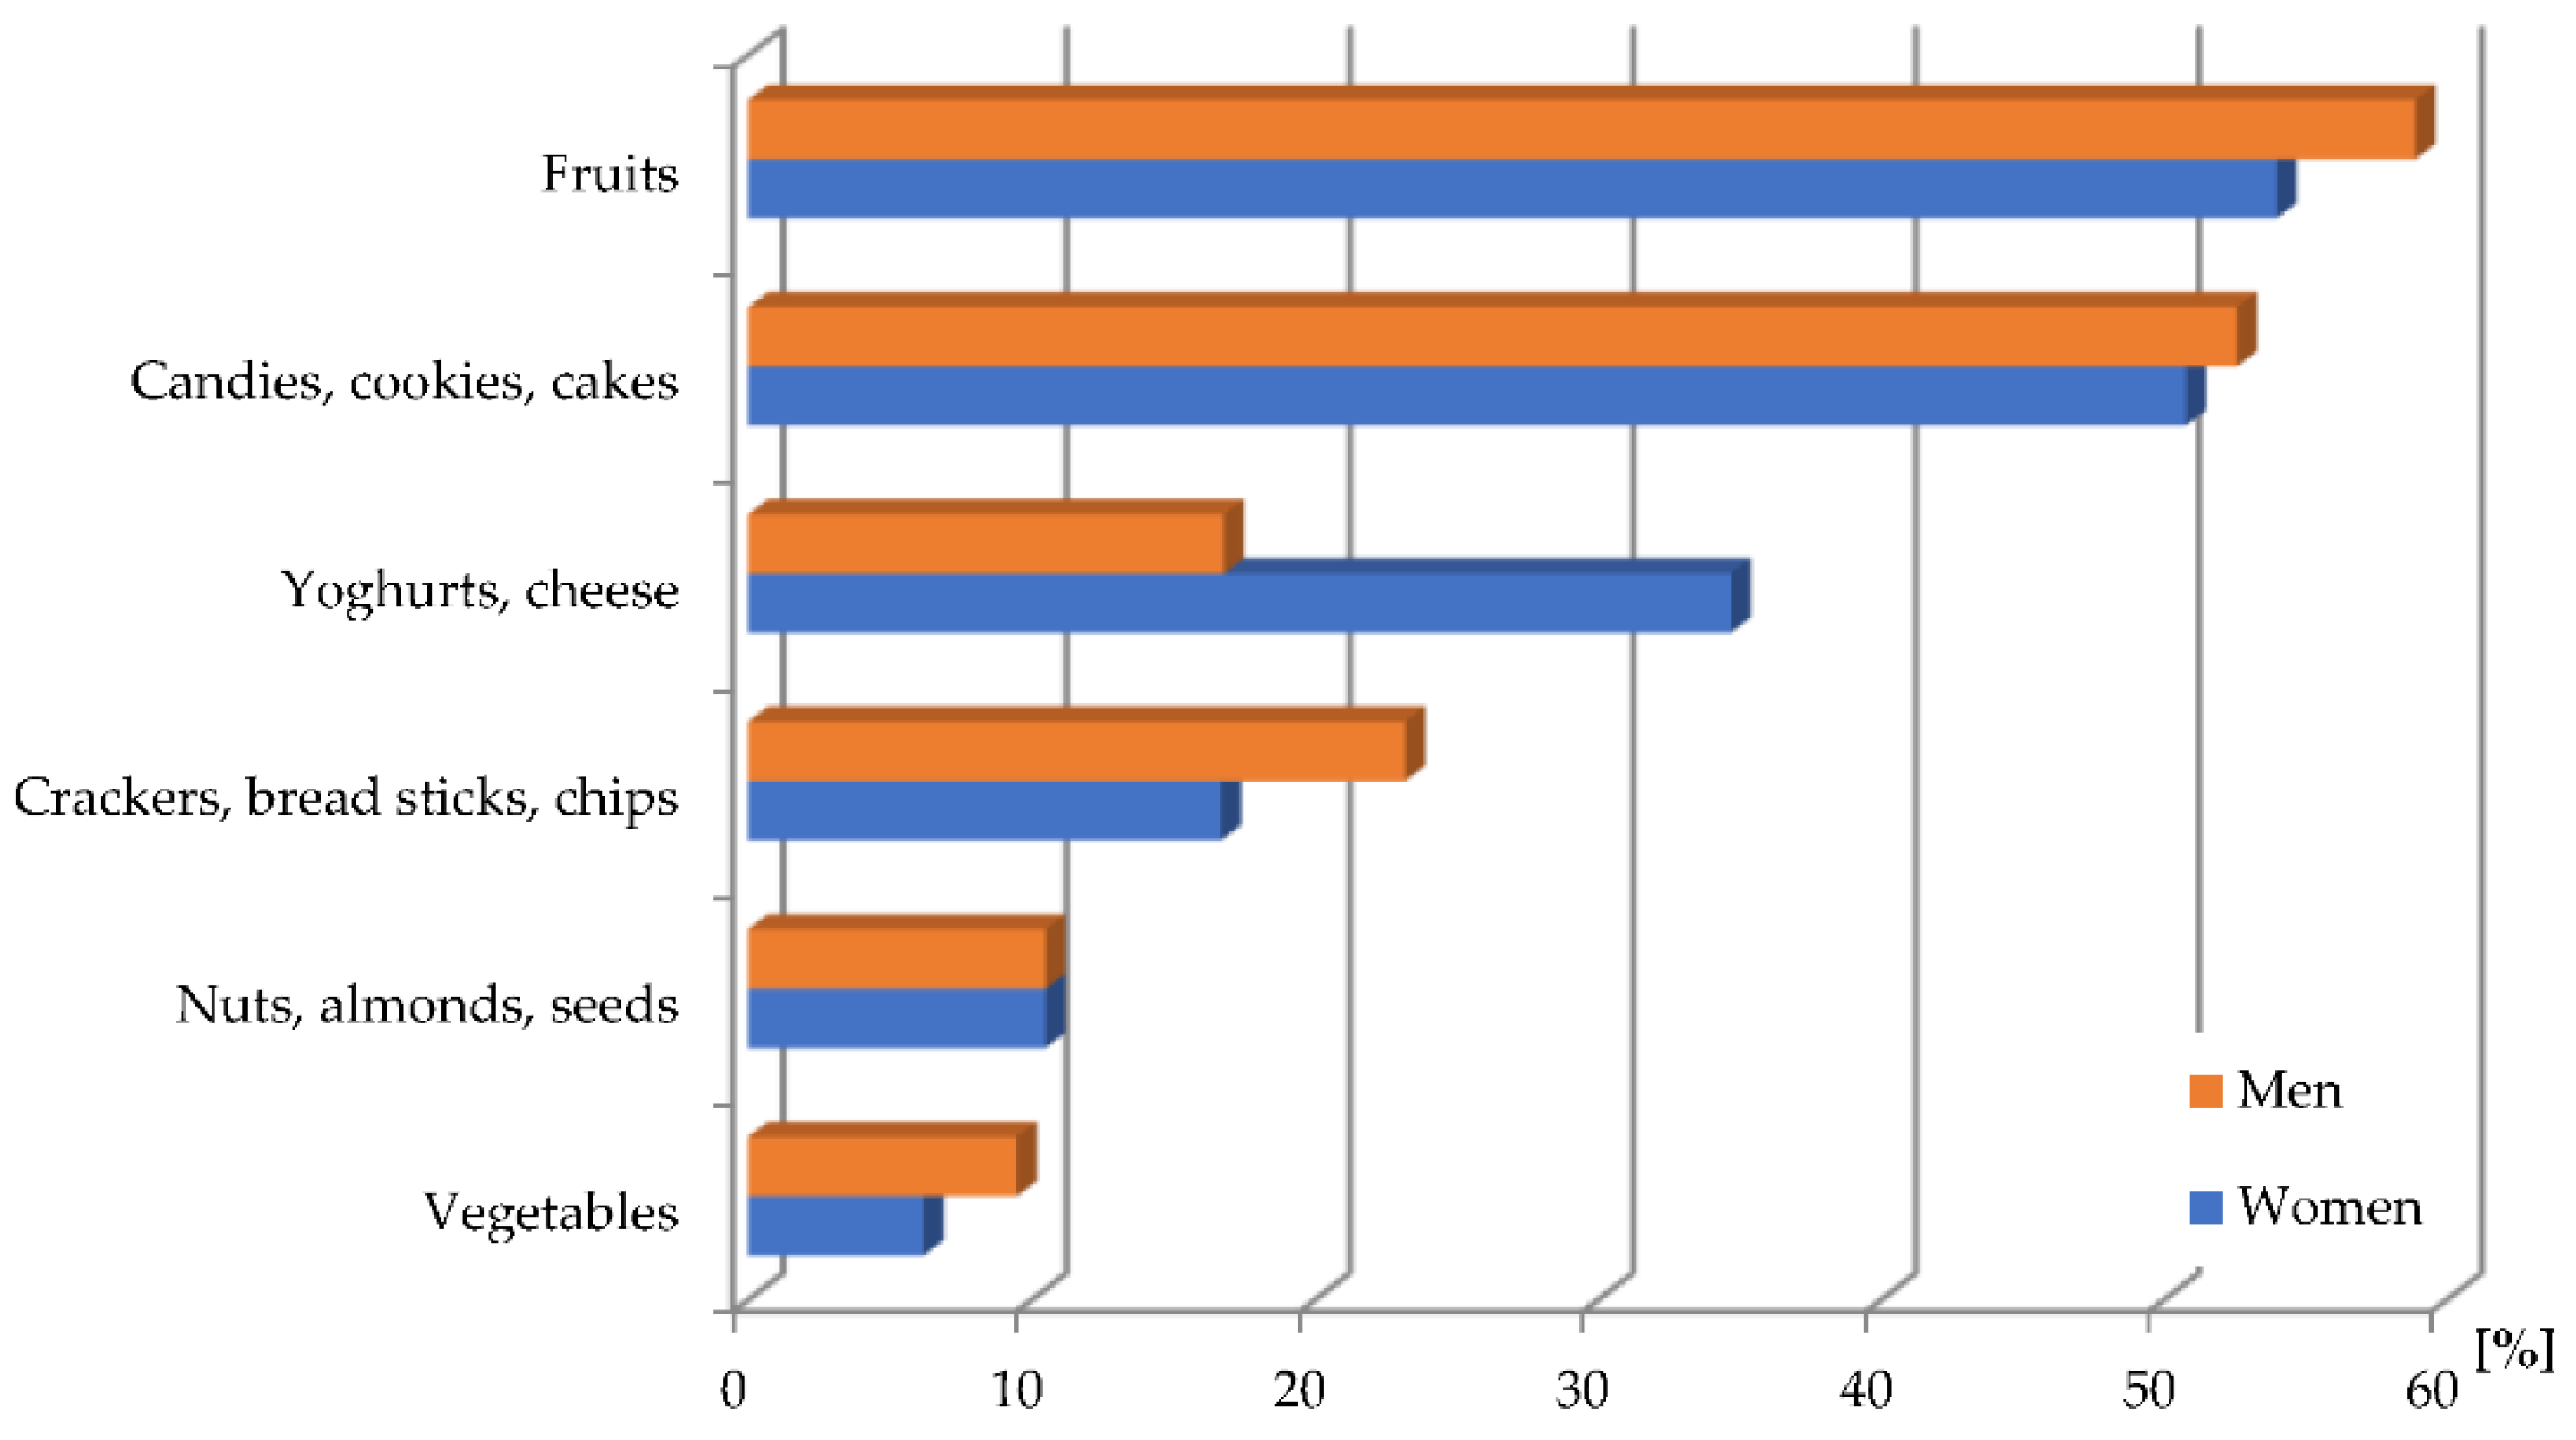
3. Results
4. Discussion
5. Conclusions
Author Contributions
Funding
Institutional Review Board Statement
Informed Consent Statement
Data Availability Statement
Conflicts of Interest
References
- Mikolajczyk, R.T.; El Ansari, W.; Maxwell, A.E. Food consumption frequency and perceived stress and depressive symptoms among students in three European countries. Nutr. J. 2009, 8, 31. [Google Scholar] [CrossRef] [PubMed] [Green Version]
- Jung, F.U.C.E.; Luck-Sikorski, C.; Krüger, M.; Wiacek, C.; Braun, P.G.; Engeli, S.; Riedel-Heller, S.G. Eat healthy? Attitudes of the German population towards industrially produced cardioprotective food. Nutr. Metab. Cardiovasc. Dis. 2018, 28, 486–493. [Google Scholar] [CrossRef] [PubMed]
- Ribas-Barba, L.; Serra-Majem, L.; Salvador, G.; Castell, C. Trends in dietary habits and food consumption in Catalonia, Spain (1992–2003). Public Health Nutr. 2007, 10, 1340–1353. [Google Scholar] [CrossRef] [PubMed] [Green Version]
- Zaborskis, A.; Lagunaite, R.; Busha, R.; Lubiene, J. Trend in eating habits among Lithuanian schoolaged children in context of social inequality: Three cross-sectional surveys 2002, 2006 and 2010. BMC Public Health 2012, 12, 52. [Google Scholar] [CrossRef] [Green Version]
- El Ansari, W.; Stock, C.; Mikolajczyk, R.T. Relationships between food consumption and living arrangements among university students in four European countries—A cross-sectional study. Nutr. J. 2012, 11, 28. [Google Scholar] [CrossRef] [Green Version]
- Szczuko, M.; Seidler, T.; Gutowska, I.; Stachowska, E. Impact of socio-economic factors and nutritional education on the composition of daily diet of university students. J. Food Nutr. Res. 2014, 53, 291–303. [Google Scholar]
- Sugiyama, S.; Okuda, M.; Sasaki, S.; Kunitsugu, I.; Hobara, T. Breakfast habits among adolescents and their association with daily energy and fish, vegetable, and fruit intake: A community-based cross-sectional study. Environ. Health Prev. Med. 2012, 17, 408–414. [Google Scholar] [CrossRef] [Green Version]
- Breitenbach, Z.; Raposa, B.; Szabó, Z.; Polyák, É.; Szács, Z.; Kubányi, J.; Figler, M. Examination of Hungarian college students’ eating habits, physical activity and body composition. Eur. J. Integr. Med. 2016, 2 (Suppl. 8), 13–17. [Google Scholar] [CrossRef]
- Jeżewska-Zychowicz, M.; Zięba, K. Student’s habits related to fruits and vegetables and their determinants. In Rural Environment Education Personality, Proceedings of the 9th International Scientific Conference, Jelgava, Latvia, 13–14 May 2016; Latvia University of Agriculture: Jelgava, Latvia, 2016; Volume 9, pp. 153–159. [Google Scholar]
- Szczęsna, T.; Wojtala, M.; Waszkowiak, K. The effect of nutritional knowledge, education and financial situation on food preferences and nutritional habits of agricultural university students living in students house. Probl. Hyg. Epidemiol. 2005, 86, 30–35. [Google Scholar]
- Banna, J.; Richards, R.; Brown, L.B. College students’ perceived differences between the terms real meal, meal, and snack. J. Nutr. Educ. Behav. 2017, 49, 228–235. [Google Scholar] [CrossRef] [Green Version]
- Krinke, U.B. Adult nutrition. In Nutrition through the Life Cycle, 4th ed.; Brown, J., Ed.; Wadsworth/Thomson Learning: Belmont, CA, USA, 2002; pp. 383–407. [Google Scholar]
- Gores, S.E. Addressing nutritional issues in the college-aged client: Strategies for the nurse practitioner. J. Am. Acad. Nurse Prac. 2008, 20, 5–10. [Google Scholar] [CrossRef] [PubMed]
- Kremmyda, L.-S.; Papadaki, A.; Hondros, G.; Kapsokefalou, M.; Scott, J.A. Differentiating between the effect of rapid dietary acculturation and the effect of living away from home for the first time, on the diets of Greek students studying in Glasgow. Appetite 2008, 50, 455–463. [Google Scholar] [CrossRef] [PubMed]
- Deliens, T.; Clarys, P.; De Bourdeaudhuij, I.; Deforche, B. Determinants of eating behaviour in university students: A qualitative study using focus group discussions. BMC Public Health 2014, 14, 53. [Google Scholar] [CrossRef] [PubMed] [Green Version]
- Yahia, N.; Brown, C.A.; Rapley, M.; Chung, M. Level of nutrition knowledge and its association with fat consumption among college students. BMC Public Health 2016, 16, 1047. [Google Scholar] [CrossRef] [Green Version]
- Deliens, T.; Van Crombruggen, R.; Verbruggen, S.; De Bourdeaudhuij, I.; Deforche, B.; Clarys, P. Dietary interventions among university students: A systematic review. Appetite 2016, 105, 14–26. [Google Scholar] [CrossRef] [PubMed]
- Lupi, S.; Bagordo, F.; Stefanati, A.; Grassi, T.; Piccinni, L.; Bergamini, M.; De Donno, A. Assessment of lifestyle and eating habits among undergraduate students in northern Italy. Ann. Ist. Super Sanita 2015, 51, 154–161. [Google Scholar] [CrossRef]
- Hilger, J.; Loerbroks, A.; Diehl, K. Eating behaviour of university students in Germany: Dietary intake, barriers to healthy eating and changes in eating behaviour since the time of matriculation. Appetite 2017, 109, 100–107. [Google Scholar] [CrossRef]
- Keski-Rahkonen, A.; Kaprio, J.; Rissanen, A.; Virkkunen, M.; Rose, R.J. Breakfast skipping and health-compromising behaviors in adolescents and adults. Eur. J. Clin. Nutr. 2003, 57, 842–853. [Google Scholar] [CrossRef] [Green Version]
- Neumark-Sztainer, D.; Hannan, P.J.; Story, M.; Croll, J.; Perry, C. Family meal patterns: Associations with sociodemographic characteristics and improved dietary intake among adolescents. J. Am. Diet. Assoc. 2003, 103, 317–322. [Google Scholar] [CrossRef]
- Lazzeri, G.; Pammolli, A.; Azzolini, E.; Simi, R.; Meoni, V.; de Wet, D.R.; Giacchi, M.V. Association between fruits and vegetables intake and frequency of breakfast and snacks consumption: A cross-sectional study. Nutr. J. 2013, 12, 123. [Google Scholar] [CrossRef] [Green Version]
- Nelson, M.C.; Story, M.; Larson, N.I.; Neumark-Sztainer, D.; Lytle, L.A. Emerging adulthood and college-aged youth: An overlooked age for weight-related behavior change. Obesity 2008, 16, 2205–2211. [Google Scholar] [CrossRef] [PubMed]
- Drygas, W.; Bielecki, W.; Kozakiewicz, K.; Pająk, A.; Piotrowski, W.; Tykarski, A.; Wyrzykowski, B.; Zdrojewski, T. Wieloośrodkowe Ogolnopolskie Badanie Stanu Zdrowia Ludności—WOBASZ. In Epidemiologia i Prewencja Chorób Układu Krążenia; Kopeć, W.G., Jankowski, P., Pająk, A.D., Eds.; Wydawnictwo Medycyna Praktyczna: Kraków, Poland, 2015; pp. 41–56. [Google Scholar]
- Rajca, A.; Wojciechowska, A.; Śmigielski, W.; Drygas, W.; Piwońska, A.; Pająk, A.; Tykarski, A.; Kozakiewicz, K.; Kwaśniewska, M.; Zdrojewski, T. Increase in the prevalence of metabolic syndrome in Poland: Comparison of the results of the WOBASZ (2003–2005) and WOBASZ II (2013–2014) studies. Pol. Arch. Intern. Med. 2021, 131, 520–526. [Google Scholar] [CrossRef] [PubMed]
- Stepaniak, U.; Micek, A.; Waśkiewicz, A.; Bielecki, W.; Drygas, W.; Janion, M.; Kozakiewicz, K.; Niklas, A.; Puch-Walczak, A.; Pająk, A. Prevalence of general and abdominal obesity and overweight among adults in Poland Results of the WOBASZ II study (2013–2014) and comparison with the WOBASZ study (2003–2005). Pol. Arch. Med. Wewnętrznej 2016, 126, 662–671. [Google Scholar] [CrossRef] [PubMed] [Green Version]
- Witkowska, A.M.; Waśkiewicz, A.; Zujko, M.E.; Cicha-Mikołajczyk, A.; Mirończuk-Chodakowska, I.; Drygas, W. Dietary plant sterols and phytosterol-enriched margarines and their relationship with cardiovascular disease among Polish men and women: The WOBASZ II cross-sectional study. Nutrients 2022, 14, 2665. [Google Scholar] [CrossRef] [PubMed]
- Stock, C.; Wille, L.; Krämer, A. Gender-specific health behaviors of German university students predict the interest in campus health promotion. Health Promot. Int. 2001, 16, 145–154. [Google Scholar] [CrossRef] [PubMed] [Green Version]
- Westenhoefer, J. Age and gender dependent profile of food choice. Forum Nutr. 2005, 57, 44–51. [Google Scholar] [CrossRef]
- Li, K.-K.; Concepcion, R.Y.; Lee, H.; Cardinal, B.J.; Ebbeck, V.; Woekel, E.; Readdy, R.T. An examination of sex differences in relation to the eating habits and nutrient intakes of university students. J. Nutr. Educ. Behav. 2012, 44, 246–250. [Google Scholar] [CrossRef]
- Kowalska, A.S.; Tarnowska, A. Eating habits of Polish university students depending on the direction of studies and gender. Brit. Food J. 2019, 121, 54–70. [Google Scholar] [CrossRef]
- Jeżewska-Zychowicz, M.; Gawęcki, J.; Wądołowska, L.; Czarnocińska, J.; Galiński, G.; Kołłajtis-Dołowy, A.; Roszkowski, W.; Wawrzyniak, A.; Przybyłowicz, K.; Krusińska, B.; et al. Dietary Habits and Nutrition Beliefs Questionnaire for people 15–65 years old, version 1.1.—interviewer administered questionnaire. Chapter 1. In Dietary Habits and Nutrition Beliefs Questionnaire and the Manual for Developing of Nutritional Data; Gawęcki, J., Ed.; The Committee of Human Nutrition, Polish Academy of Sciences: Olsztyn, Poland, 2018; pp. 3–20. Available online: https://knozc.pan.pl/images/stories/MLonnie/EN_Kwestionariusz_KomPAN_i_PROCEDURA_versja_2_znak_tow_2019_2.pdf (accessed on 4 July 2019).
- Kowalkowska, J.; Wądołowska, L.; Czarnocińska, J.; Człapka-Matyasik, M.; Galiński, G.; Jeżewska-Zychowicz, M.; Bronkowska, M.; Długosz, A.; Łoboda, D.; Wyka, J. Analiza Zgodności Wewnętrznej “Kwestionariusza do Badania Poglądów i Zwyczajów Żywieniowych” KomPAN. 2016. Available online: http://www.knozc.pan.pl/images/stories/MLonnie/Analiza-zgodnosci-wewn-KomPAN-kappa_www-KomitetPAN_2-07-2016.pdf (accessed on 4 July 2019).
- Wądołowska, L.; Krusińska, B. The manual for developing nutritional data from the KomPAN® questionnaire. Chapter 3. In Dietary Habits and Nutrition Beliefs Questionnaire and the Manual for Developing Nutritional Data; Gawęcki, J., Ed.; The Committee of Human Nutrition, Polish Academy of Sciences: Olsztyn, Poland, 2018; pp. 34–52. Available online: https://knozc.pan.pl/images/stories/MLonnie/EN_Kwestionariusz_KomPAN_i_PROCEDURA_versja_2_znak_tow_2019_2.pdf (accessed on 4 July 2019).
- Foster, S.; Beck, E.; Hughes, J.; Grafenauer, S. Whole grains and consumer understanding: Investigating consumers’ identification, knowledge and attitudes to whole grains. Nutrients 2020, 12, 2170. [Google Scholar] [CrossRef]
- Błaszczyk-Bębenek, E.; Piórecka, B.; Płonka, M.; Chmiel, I.; Jagielski, P.; Tuleja, K.; Schlegel-Zawadzka, M. Risk factors and prevalence of abdominal obesity among upper-secondary students. Int. J. Environ. Res. Public Health 2019, 16, 1750. [Google Scholar] [CrossRef] [Green Version]
- Laska, M.N.; Larson, N.I.; Neumark-Sztainer, D.; Story, M. Does involvement in food preparation track from adolescence to young adulthood and is it associated with better dietary quality? Findings from a 10-year longitudinal study. Public Health Nutr. 2012, 15, 1150–1158. [Google Scholar] [CrossRef] [PubMed] [Green Version]
- Pendergast, F.J.; Livingstone, K.M.; Worsley, A.; McNaughton, S.A. Correlates of meal skipping in young adults: A systematic review. Int. J. Behav. Nutr. Phys Act. 2016, 13, 125. [Google Scholar] [CrossRef] [PubMed]
- Smith, K.J.; Gall, S.L.; McNaughton, S.A.; Blizzard, L.; Dwyer, T.; Venn, A.J. Skipping breakfast: Longitudinal associations with cardiometabolic risk factors in the Childhood Determinants of Adult Health Study. Am. J. Clin. Nutr. 2010, 92, 1316–1325. [Google Scholar] [CrossRef] [PubMed] [Green Version]
- Pearson, N.; Biddle, S.J.; Gorely, T. Family correlates of breakfast consumption among children and adolescents. A systematic review. Appetite 2009, 52, 1e7. [Google Scholar] [CrossRef]
- Lee, S.A.; Park, E.-C.; Ju, Y.J.; Lee, T.H.; Han, E.; Kim, T.H. Breakfast consumption and depressive mood: A focus on socioeconomic status. Appetite 2017, 114, 313–319. [Google Scholar] [CrossRef] [PubMed]
- Szponar, B.; Krzyszycha, R. Assessment of food intake by Lublin University of Medicine students in 2007/2008. Bromatol. Chem. Toksykol. 2009, 42, 111–116. [Google Scholar]
- Kowalcze, K.; Turyk, Z.; Drywień, M. Selected dietary habits and behavior of students of dietetics at the University of Natural Sciences and Humanities in Siedlce. In Współczesne Kierunki Działań Prozdrowotnych; Wolska-Adamczyk, A., Ed.; WSIiZ: Warszawa, Poland, 2015; pp. 145–158. [Google Scholar]
- Kulesza, K.; Zujko, M.E.; Witkowska, A.M. Evaluation of selected dietary habits among students of Medical University of Bialystok. Nurs. Public Health 2019, 9, 33–39. [Google Scholar] [CrossRef]
- Skibniewska, K.A.; Radzymińska, M.; Jaworska, M.M.; Babicz-Zielińska, E. Studies on dietary habits of Polish and Belgian students. Food Sci. Technol. Qual. 2009, 65, 250–258. [Google Scholar]
- Orkusz, A. Ocena wybranych zwyczajów żywieniowych studentów Uniwersytetu Ekonomicznego we Wrocławiu. Część I (Assessment of selected dietary habits of students of the Wroclaw University of Economics. Part I). Eng. Sci. Technol. 2014, 14, 74–84. [Google Scholar] [CrossRef] [Green Version]
- Zerón-Rugerio, M.F.; Cambras, T.; Izquierdo-Pulido, M. Social jet lag associates negatively with the adherence to the mediterranean diet and body mass index among young adults. Nutrients 2019, 11, 1756. [Google Scholar] [CrossRef] [Green Version]
- Timlin, M.T.; Pereira, M.A. Breakfast frequency and quality in the etiology of adult obesity and chronic diseases. Nutr. Rev. 2007, 65, 268–281. [Google Scholar] [CrossRef] [PubMed]
- Mullan, B.; Wong, C.; Kothe, E.; O’Moore, K.; Pickles, K.; Sainsbury, K. An examination of the demographic predictors of adolescent breakfast consumption, content, and context. BMC Public Health 2014, 14, 264. [Google Scholar] [CrossRef] [PubMed] [Green Version]
- Huang, C.; Hu, H.; Fan, Y.; Liao, Y.; Tsai, P. Associations of breakfast skipping with obesity and health-related quality of life: Evidence from a national survey in Taiwan. Int. J. Obes. 2010, 34, 720–725. [Google Scholar] [CrossRef] [PubMed] [Green Version]
- Ilow, R. Ocena zwyczajów żywieniowych studentów Akademii Medycznej we Wrocławiu (Assessment of the dietary habits of students of Wroclaw Medical University). Adv. Clin. Exp. Med. 2005, 14, 929–938. (In Polish) [Google Scholar]
- Likus, W.; Milka, D.; Bajor, G.; Jachacz-Łopata, M.; Dorzak, B. Dietary habits and physical activity in students from the Medical University of Silesia in Poland. Ann. Natl. Inst. Hyg. 2013, 64, 317–324. [Google Scholar]
- Krešić, G.; Kendel Jovanović, G.; Pavičić Zezel, S.; Cvijanović, O.; Ivezić, G. The effect of nutrition knowledge on dietary intake among Croatian university students. Coll. Antropol. 2009, 33, 1047–1056. [Google Scholar]
- Yahia, N.; Wang, D.; Rapley, M.; Dey, R. Assessment of weight status, dietary habits and beliefs, physical activity, and nutritional knowledge among university students. Perspect. Public Health 2015, 136, 231–244. [Google Scholar] [CrossRef]
- Popławska, H.; Dmitruk, A.; Kunicka, I.; Dębowska, A.; Hołub, W. Nutritional habits and knowledge about food and nutrition among physical education students depending on their level of higher education and physical activity. Pol. J. Sport Tour. 2018, 25, 35–41. [Google Scholar] [CrossRef] [Green Version]
- Dinnella, C.; Morizet, D.; Masi, C.; Cliceri, D.; Depezay, L.; Appleton, K.M.; Giboreau, A.; Perez-Cueto, F.J.A.; Hartwell, H.; Monteleone, E. Sensory determinants of stated liking for vegetable names and actual liking for canned vegetables: A cross-country study among European adolescents. Appetite 2016, 107, 339–347. [Google Scholar] [CrossRef] [Green Version]
- Roos, G.; Johansson, L.; Kasmel, A.; Klumbiené, J.; Prättälä, R. Disparities in vegetable and fruit consumption: European cases from the north to the south. Public Health Nutr. 2001, 4, 35–43. [Google Scholar] [CrossRef] [Green Version]
- Dos Santos, Q.; Nogueira, B.M.; Alvarez, M.C.V.; Perez-Cuetoa, F.J.A. Consumption of fruits and vegetables among university students in Denmark. Int. J. Gastron. Food Sci. 2017, 10, 1–6. [Google Scholar] [CrossRef]
- Schroeter, C.; House, L.A. Fruit and vegetable consumption of college students: What is the role of food culture? J. Food Distr. Res. 2015, 46, 131–152. [Google Scholar] [CrossRef]
- Silliman, K.; Rodas-Fortier, K.; Neyman, M. A survey of dietary and exercise habits and perceived barriers to following a healthy lifestyle in a college population. Calif. J. Health Promot. 2004, 2, 10–19. [Google Scholar] [CrossRef] [Green Version]
- Butler, S.M.; Black, D.R.; Blue, C.L.; Gretebeck, R.J. Change in diet, physical activity, and body weight in female college freshman. Am. J. Health Behav. 2004, 28, 24–32. [Google Scholar] [CrossRef] [PubMed] [Green Version]
- Papadaki, A.; Hondros, G.A.; Scott, J.; Kapsokefalou, M. Eating habits of university students living at, or away from home in Greece. Appetite 2007, 49, 169–176. [Google Scholar] [CrossRef] [PubMed]
- Chourdakis, M.; Tzellos, T.; Papazisis, G.; Toulis, K.; Kouvelas, D. Eating habits, health attitudes and obesity indices among medical students in northern Greece. Appetite 2010, 55, 722–725. [Google Scholar] [CrossRef]
- Zellner, D.A.; Loaiza, S.; Gonzalez, Z.; Pita, J.; Morales, J.; Pecora, D.; Wolf, A. Food selection changes under stress. Physiol. Behav. 2006, 87, 789–793. [Google Scholar] [CrossRef]
- Oliver, G.; Wardle, J. Perceived effects of stress on food choice. Physiol. Behav. 1999, 66, 511–515. [Google Scholar] [CrossRef]
- Kandiah, J.; Yake, M.; Jones, J.; Meyer, M. Stress influences appetite and comfort food preferences in college women. Nutr. Res. 2006, 26, 118–123. [Google Scholar] [CrossRef]
- Yeonsoo, K.; Hye, Y.Y.; Ae-Jung, K.; Yunsook, L. Academic stress levels were positively associated with sweet food consumption among Korean high-school students. Nutrition 2013, 29, 213–218. [Google Scholar] [CrossRef]
- Gacek, M.; Kosiba, G.; Wojtowicz, A. Personality determinants of diet quality among Polish and Spanish physical education students. Int. J. Environ. Res. Public Health 2021, 18, 466. [Google Scholar] [CrossRef] [PubMed]


| The Intensity of Nutritional Characteristics | Scope (Times/Day) | Scope (in Points) | ||
|---|---|---|---|---|
| “Pro-Healthy Diet Index” pHDI-10 | “Non-Healthy Diet Index” nHDI-14 | “Pro-Healthy Diet Index” pHDI-10 | “Non-Healthy Diet Index” nHDI-14 | |
| Low | 0–6.66 | 0–9.33 | 0–33 | 0–33 |
| Moderate | 6.67–13.33 | 9.34–18.66 | 34–66 | 34–66 |
| High | 13.34–20.00 | 18.67–28.00 | 67–100 | 67–100 |
| Specification | Total n = 467 | Women n = 372 | Men n = 95 |
|---|---|---|---|
| Age (years) | 22.4 ± 1.32 | 22.3 ± 1.40 | 22.5 ± 0.90 |
| Height (cm) | 169.1 ± 7.69 | 166.7 ± 6.11 a | 178.4 ± 5.94 b |
| Body weight (kg) | 61.7 ± 11.82 | 58.0 ± 8.47 a | 76.2 ± 11.88 b |
| BMI (kg/m2) | 21.5 ± 3.18 | 20.9 ± 2.82 a | 23.9 ± 3.35 b |
| Questions | Levels | Total (%) | Women (%) | Men (%) | p Value |
|---|---|---|---|---|---|
| How many meals do you eat during the day? | 1 meal | 0 (0.0) | 0 (0.0) | 0 (0.0) | 0.033 |
| 2 meals | 12 (2.6) | 6 (1.6) | 6 (6.3) | ||
| 3 meals | 164 (35.1) | 126 (33.9) | 38 (40.0) | ||
| 4 meals | 221 (47.3) | 182 (48.9) | 39 (41.1) | ||
| 5 meals and more | 70 (15.0) | 58 (15.6) | 12 (12.6) | ||
| Do you eat meals at fixed times of the day? | No | 258 (55.2) | 196 (52.7) | 62 (65.3) | 0.031 |
| Yes. but only some | 169 (36.2) | 139 (37.4) | 30 (31.6) | ||
| Yes. all | 40 (8.6) | 37 (9.9) | 3 (3.2) | ||
| Do you eat between meals? | No | 56 (12.0) | 45 (12.1) | 11 (11.6) | ns |
| Yes | 411 (88.0) | 327 (87.9) | 84 (88.4) |
| Questions | Levels | Total (%) | Women (%) | Men (%) | p Value |
|---|---|---|---|---|---|
| How often do you eat food between meals? | Never | 56 (12.0) | 45 (12.1) | 11 (11.6) | ns |
| 1–3 times a month | 30 (6.4) | 27 (7.3) | 3 (3.2) | ||
| Once a week | 31 (6.6) | 23 (6.2) | 8 (8.4) | ||
| A few times a week | 136 (29.1) | 112 (30.1) | 24 (25.3) | ||
| Once a day | 123 (26.3) | 101 (27.2) | 22 (23.2) | ||
| Several times during the day | 91 (19.5) | 64 (17.2) | 27 (28.4) | ||
| How often do you eat wholemeal bread? | Never | 42 (9.0) | 29 (7.8) | 13 (13.7) | 0.0001 |
| 1–3 times a month | 155 (33.2) | 121 (32.5) | 34 (35.8) | ||
| Once a week | 59 (12.6) | 37 (9.9) | 22 (23.2) | ||
| A few times a week | 120 (25.7) | 107 (28.8) | 13 (13.7) | ||
| Once a day | 64 (13.7) | 53 (14.2) | 11 (11.6) | ||
| Several times during the day | 27 (5.8) | 25 (6.7) | 2 (2.1) | ||
| How often do you consume milk (including flavoured milk)? | Never | 52 (11.1) | 38 (10.2) | 14 (14.7) | 0.039 |
| 1–3 times a month | 90 (19.3) | 71 (19.1) | 19 (20.0) | ||
| Once a week | 93 (19.9) | 66 (17.7) | 27 (28.4) | ||
| A few times a week | 140 (30.0) | 117 (31.5) | 23 (24.2) | ||
| Once a day | 79 (16.9) | 67 (18.0) | 12 (12.6) | ||
| Several times during the day | 13 (2.8) | 13 (3.5) | 0 (0.0) | ||
| How often do you consume fermented milk drinks, e.g., yogurts, kefirs? | Never | 7 (1.5) | 3 (0.8) | 4 (4.2) | 0.0001 |
| 1–3 times a month | 76 (16.3) | 49 (13.2) | 27 (28.4) | ||
| Once a week | 122 (26.1) | 93 (25.0) | 29 (30.5) | ||
| A few times a week | 190 (40.7) | 174 (46.8) | 16 (16.8) | ||
| Once a day | 60 (12.8) | 46 (12.4) | 14 (14.7) | ||
| Several times during the day | 12 (2.6) | 7 (1.9) | 5 (5.3) | ||
| How often do you eat cottage cheese (including homogenized cheese)? | Never | 26 (5.6) | 23 (6.2) | 3 (3.2) | 0.001 |
| 1–3 times a month | 73 (15.6) | 53 (14.2) | 20 (21.1) | ||
| Once a week | 125 (26.8) | 87 (23.4) | 38 (40.0) | ||
| A few times a week | 193 (41.3) | 163 (43.8) | 30 (31.6) | ||
| Once a day | 33 (7.1) | 29 (7.8) | 4 (4.2) | ||
| Several times during the day | 17 (3.6) | 17 (4.6) | 0 (0.0) | ||
| How often do you eat cheese (including processed cheese)? | Never | 21 (4.5) | 21 (5.6) | 0 (0.0) | 0.0001 |
| 1–3 times a month | 78 (16.7) | 70 (18.8) | 8 (8.4) | ||
| Once a week | 117 (25.1) | 83 (22.3) | 34 (35.8) | ||
| A few times a week | 193 (41.3) | 145 (39.0) | 48 (50.5) | ||
| Once a day | 40 (8.6) | 35 (9.4) | 5 (5.3) | ||
| Several times during the day | 18 (3.9) | 18 (4.8) | 0 (0.0) | ||
| How often do you consume preserves and meat dishes? | Never | 4 (0.9) | 4 (1.1) | 0 (0.0) | 0.0001 |
| 1–3 times a month | 18 (3.9) | 16 (4.3) | 2 (2.1) | ||
| Once a week | 80 (17.1) | 74 (19.9) | 6 (6.3) | ||
| A few times a week | 286 (61.2) | 232 (62.4) | 54 (56.8) | ||
| Once a day | 55 (11.8) | 41 (11.0) | 14 (14.7) | ||
| Several times during the day | 24 (5.1) | 5 (1.3) | 19 (20.0) | ||
| How often do you consume preserves and fish dishes? | Never | 28 (6.0) | 16 (4.3) | 12 (12.6) | 0.004 |
| 1–3 times a month | 250 (53.5) | 211 (56.7) | 39 (41.1) | ||
| Once a week | 147 (31.5) | 114 (30.6) | 33 (34.7) | ||
| A few times a week | 42 (9.0) | 31 (8.3) | 11 (11.6) | ||
| Once a day | 0 (0.0) | 0 (0.0) | 0 (0.0) | ||
| Several times during the day | 0 (0.0) | 0 (0.0) | 0 (0.0) | ||
| How often do you eat foods from legume seeds, such as beans and peas? | Never | 64 (13.7) | 49 (13.2) | 15 (15.8) | ns |
| 1–3 times a month | 328 (70.2) | 258 (69.4) | 70 (73.7) | ||
| Once a week | 47 (10.1) | 43 (11.6) | 4 (4.2) | ||
| A few times a week | 24 (5.1) | 18 (4.8) | 6 (6.3) | ||
| Once a day | 4 (0.9) | 4 (1.1) | 0 (0.0) | ||
| Several times during the day | 0 (0.0) | 0 (0.0) | 0 (0.0) | ||
| How often do you eat potatoes (including mashed potatoes)? | Never | 30 (6.4) | 27 (7.3) | 3 (3.2) | 0.0001 |
| 1–3 times a month | 65 (13.9) | 58 (15.6) | 7 (7.4) | ||
| Once a week | 111 (23.8) | 96 (25.8) | 15 (15.8) | ||
| A few times a week | 236 (50.5) | 181 (48.7) | 55 (57.9) | ||
| Once a day | 21 (4.5) | 10 (2.7) | 11 (11.6) | ||
| Several times during the day | 4 (0.9) | 0 (0.0) | 4 (4.2) | ||
| How often do you eat fruit? | Never | 0 (0.0) | 0 (0.0) | 0 (0.0) | 0.002 |
| 1–3 times a month | 31 (6.6) | 21 (5.6) | 10 (10.5) | ||
| Once a week | 46 (9.9) | 32 (8.6) | 14 (14.7) | ||
| A few times a week | 202 (43.3) | 165 (44.4) | 37 (38.9) | ||
| Once a day | 112 (24.0) | 83 (22.3) | 29 (30.5) | ||
| Several times during the day | 76 (16.3) | 71 (19.1) | 5 (5.3) | ||
| How often do you eat vegetables? | Never | 0 (0.0) | 0 (0.0) | 0 (0.0) | 0.003 |
| 1–3 times a month | 26 (5.6) | 16 (4.3) | 10 (10.5) | ||
| Once a week | 46 (9.9) | 31 (8.3) | 15 (15.8) | ||
| A few times a week | 225 (48.2) | 177 (47.6) | 48 (50.5) | ||
| Once a day | 82 (17.6) | 69 (18.5) | 13 (13.7) | ||
| Several times during the day | 88 (18.8) | 79 (21.2) | 9 (9.5) | ||
| How often do you drink fruit, vegetable or fruit and vegetable juices? | Never | 0 (0.0) | 0 (0.0) | 0 (0.0) | ns |
| 1–3 times a month | 104 (22.3) | 78 (21) | 26 (27.4) | ||
| Once a week | 132 (28.3) | 112 (30.1) | 20 (21.1) | ||
| A few times a week | 143 (30.6) | 114 (30.6) | 29 (30.5) | ||
| Once a day | 51 (10.9) | 39 (10.5) | 12 (12.6) | ||
| Several times during the day | 37 (7.9) | 29 (7.8) | 8 (8.4) | ||
| How often do you eat sweets, confectionery? | Never | 8 (1.7) | 8 (2.2) | 0(0.0) | 0.0001 |
| 1–3 times a month | 86 (18.4) | 55 (14.8) | 31 (32.6) | ||
| Once a week | 71 (15.2) | 58 (15.6) | 13 (13.7) | ||
| A few times a week | 214 (45.8) | 188 (50.5) | 26 (27.4) | ||
| Once a day | 59 (12.6) | 42 (11.3) | 17 (17.9) | ||
| Several times during the day | 29 (6.2) | 21 (5.6) | 8 (8.4) | ||
| How often do you consume fast food, such as fries, hamburgers, pizza, hot dogs, casseroles? | Never | 45 (99.6) | 29 (7.8) | 16 (16.8) | 0.0001 |
| 1–3 times a month | 331 (70.9) | 287 (77.2) | 44 (46.3) | ||
| Once a week | 78 (16.7) | 53 (14.2) | 25 (26.3) | ||
| A few times a week | 8 (1.7) | 3 (0.8) | 5 (5.3) | ||
| Once a day | 5 (1.1) | 0 (0.0) | 5 (5.3) | ||
| Several times during the day | 0 (0.0) | 0 (0.0) | 0 (0.0) | ||
| How often do you eat fried foods (meat, flour)? | Never | 5 (1.1) | 2 (0.5) | 3 (3.2) | 0.0001 |
| 1–3 times a month | 50 (10.7) | 45 (12.1) | 5 (5.3) | ||
| Once a week | 149 (31.9) | 124 (33.3) | 25 (26.3) | ||
| A few times a week | 233 (49.9) | 190 (51.1) | 43 (45.3) | ||
| Once a day | 17 (3.6) | 8 (2.2) | 9 (9.5) | ||
| Several times during the day | 13 (2.8) | 3 (0.8) | 10 (10.5) |
| Questions | Levels | Total (%) | Women (%) | Men (%) | p Value |
|---|---|---|---|---|---|
| How many servings of fruits and vegetables do you eat during the day? | I do not eat them at all | 5 (1.1) | 0 (0.0) | 5 (5.3) | 0.0001 |
| 1 serving | 143 (30.6) | 99 (26.6) | 44 (46.3) | ||
| 2 servings | 204 (43.7) | 169 (45.4) | 35 (36.8) | ||
| 3 servings | 76 (16.3) | 67 (18.0) | 9 (9.5) | ||
| 4 servings | 24 (5.1) | 22 (5.9) | 2 (2.1) | ||
| 5 servings and more | 15 (3.2) | 15 (4.0) | 0 (0.0) | ||
| How many glasses of water do you usually drink during the day (mineral, table or other)? | I do not drink water at all | 19 (4.1) | 13 (3.5) | 6 (6.3) | ns |
| 1 glass | 35 (7.5) | 28 (7.5) | 7 (7.4) | ||
| 2 glasses | 81 (17.3) | 70 (18.8) | 11 (11.6) | ||
| 3 glasses | 65 (13.9) | 56 (15.1) | 9 (9.5) | ||
| 4 glasses | 111 (23.8) | 91 (24.5) | 20 (21.1) | ||
| 5 glasses | 61 (13.1) | 44 (11.8) | 17 (17.9) | ||
| 6 glasses and more | 95 (20.3) | 70 (18.8) | 25 (26.3) |
| Questions | Levels | Total (%) | Women (%) | Men (%) | p Value |
|---|---|---|---|---|---|
| Do you sweeten hot drinks, e.g., tea, cocoa, coffee? | No | 193 (41.3) | 174 (46.8) | 19 (20.0) | 0.0001 |
| Yes, I sweeten with one teaspoon of sugar | 121 (25.9) | 113 (30.4) | 8 (8.4) | ||
| Yes, I sweeten with two or more teaspoons of sugar | 153 (32.8) | 85 (22.8) | 68 (71.6) | ||
| Do you add salt in ready-made dishes at the table? | No | 242 (51.8) | 202 (54.3) | 40 (42.1) | 0.002 |
| Yes, but only sometimes | 186 (39.8) | 147 (39.5) | 39 (41.1) | ||
| Yes | 39 (8.4) | 23 (6.2) | 16 (16.8) | ||
| How do you usually eat prepared meat dishes? (you can select up to two answers) | Boiled | 186 (39.8) | 170 (45.7) | 16 (16.8) | 0.0001 |
| Stewed | 118 (25.3) | 86 (23.1) | 32 (33.7) | ||
| Grilled | 31 (6.6) | 22 (5.9) | 9 (9.5) | ||
| Baked | 199 (42.6) | 142 (38.2) | 57 (60.0) | ||
| Fried | 366 (78.4) | 289 (77.7) | 77 (81.1) |
Publisher’s Note: MDPI stays neutral with regard to jurisdictional claims in published maps and institutional affiliations. |
© 2022 by the authors. Licensee MDPI, Basel, Switzerland. This article is an open access article distributed under the terms and conditions of the Creative Commons Attribution (CC BY) license (https://creativecommons.org/licenses/by/4.0/).
Share and Cite
Gil, M.; Rudy, M.; Stanisławczyk, R.; Duma-Kocan, P.; Żurek, J. Gender Differences in Eating Habits of Polish Young Adults Aged 20–26. Int. J. Environ. Res. Public Health 2022, 19, 15280. https://doi.org/10.3390/ijerph192215280
Gil M, Rudy M, Stanisławczyk R, Duma-Kocan P, Żurek J. Gender Differences in Eating Habits of Polish Young Adults Aged 20–26. International Journal of Environmental Research and Public Health. 2022; 19(22):15280. https://doi.org/10.3390/ijerph192215280
Chicago/Turabian StyleGil, Marian, Mariusz Rudy, Renata Stanisławczyk, Paulina Duma-Kocan, and Jagoda Żurek. 2022. "Gender Differences in Eating Habits of Polish Young Adults Aged 20–26" International Journal of Environmental Research and Public Health 19, no. 22: 15280. https://doi.org/10.3390/ijerph192215280