
Safety Climate Evaluation in Primary Health Care: A Cross-Sectional Study
 and
and 
Abstract
:1. Introduction
2. Materials and Methods
2.1. Study Design
2.2. Setting and Subjects
2.3. Data Collection
2.4. Variables and Instruments
2.5. Data Analysis
2.6. Ethical Considerations
3. Results
3.1. Descriptive Analysis of the Sample
3.2. Descriptive Analysis of SAQ—Short Form 2006 PT
3.3. Inferential Analysis
- Team environmentThe team environment domain is only associated with the characteristic function (p < 0.001) and type of primary care unit (p < 0.001). Regarding the variable function, multiple comparisons with Bonferroni adjustments show that differences were found between the categories of nurses and physicians (p < 0.001) and between nurses and doctors in pre-career training (p = 0.004), with the nurse category showing lower values in this domain, as well as between the categories of technical assistants and physicians (p = 0.007) and between technical assistants and doctors in pre-career training (p = 0.015), with the technical assistant category also showing lower values for this domain. With respect to the variable type of primary care unit, multiple comparisons with Bonferroni adjustments revealed differences between the categories of UCSP and USF-A (p < 0.001) and between UCSP and USF-B (p < 0.001), with the UCSP category showing lower values for this domain.
- Safety climateThe safety climate domain is only associated with the type of primary care unit variable (p < 0.001). Multiple comparisons with Bonferroni adjustments revealed differences between the categories of UCSP and USF-A (p < 0.001) and between UCSP and USF-B (p < 0.001), with the UCSP category showing lower values for this domain.
- Job satisfactionThe job satisfaction domain is associated with gender (p = 0.001) and type of primary care unit (p < 0.001). With regard to gender, women show higher values in this domain than men. With respect to the type of primary care unit variable, multiple comparisons with Bonferroni adjustments revealed differences between the categories of UCSP and USF-B (p < 0.001), with the UCSP category showing lower values for this domain.
- Stress recognitionThe stress recognition domain shows associations with the characteristics of age (p < 0.001), length of service at the current workplace (p = 0.032) and function (p < 0.001). As the age of the respondent increases, the score obtained in this domain decreases. However, the linear correlation is weak (rS = −0.166). As the length of service at the respondent’s current workplace increases, so does the score obtained in this domain. However, this linear correlation is also weak (rS = −0.095). With respect to the variable function, multiple comparisons with Bonferroni adjustments revealed differences between the categories of technical assistants and nurses (p < 0.001), between technical assistant and doctors in pre-career training (p < 0.001) and between technical assistants and physicians (p < 0.001), with the technical assistant category showing lower values for this domain, as well as between the categories of nurses and physicians (p = 0.005), with the nurse category showing lower values for this domain than physicians.
- Management perceptionThe management perception domain is associated with gender (p = 0.024) and type of primary care unit (p = 0.038). With respect to gender, women show higher values in this domain than men. Regarding the type of primary care unit variable, multiple comparisons with Bonferroni adjustments revealed differences between the categories of UCSP and USF-B (p = 0.044), with the UCSP category showing lower values for this domain.
- Working conditionsThe working conditions domain is associated with the characteristics function (p = 0.016) and type of primary care unit (p < 0.001). With respect to the function variable, multiple comparisons with Bonferroni adjustments revealed differences between the categories of technical assistants and physicians (p = −0.014) and between technical assistants and doctors in pre-career training (p = 0.048), with the technical assistant category showing lower values for this domain. With respect to the type of primary care unit variable, multiple comparisons with Bonferroni adjustments revealed differences between the categories of UCSP and USF-A (p < 0.001) and between UCSP and USF-B (p < 0.001), with the UCSP category presenting lower values for this domain.
- Total SAQ-Short Form 2006 PT scoreThe total SAQ-Short Form 2006 PT score shows association with the gender (p = 0.019) and type of primary care unit (p < 0.001). With respect to gender, women show higher values than men in the total score. With respect to the type of primary care unit variable, multiple comparisons with Bonferroni adjustments revealed differences between the categories UCSP and USF-A (p < 0.001) and between UCSP and USF-B (p < 0.001), with the UCSP category presenting lower total scores.
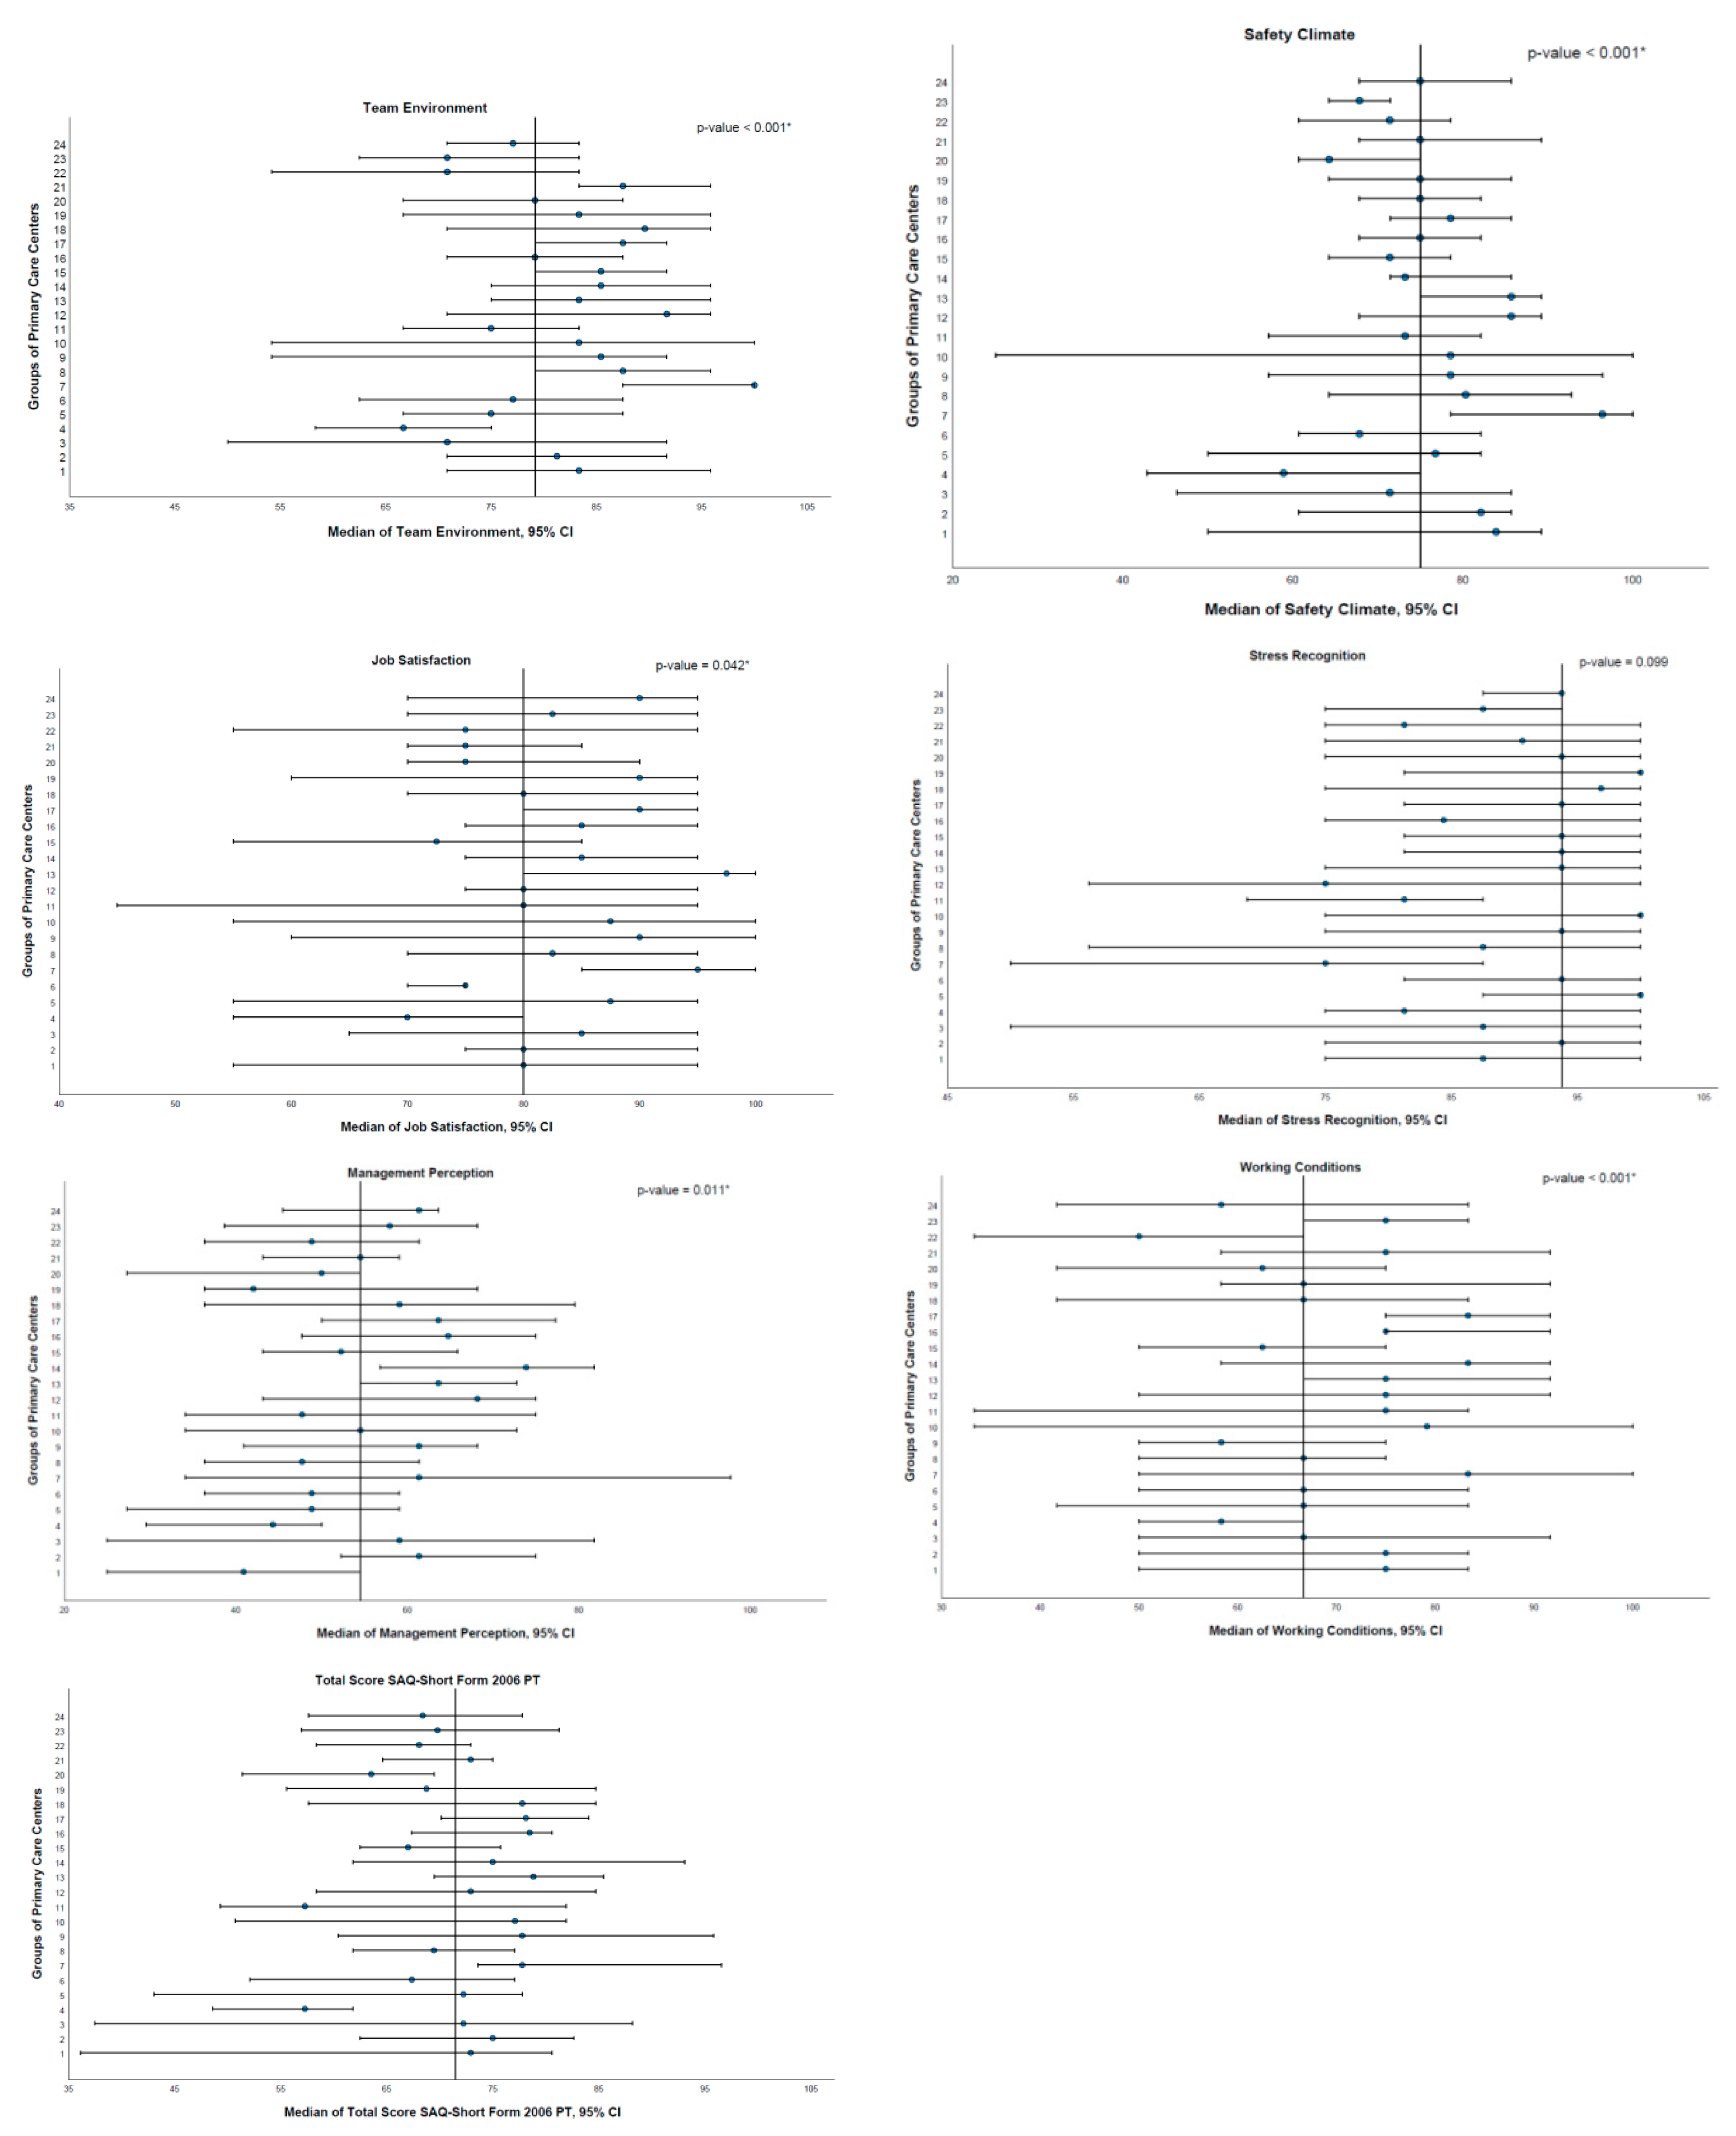
- Team environment“4. ACeS Alto Trás-os-Montes—Nordeste” and “17. ACeS Grande Porto V—Porto Ocidental” (p = 0.007); “4. ACeS Alto Trás-os-Montes—Nordeste” and “21. ACeS Matosinhos” (p = 0.010); “4. ACeS Alto Trás-os-Montes—Nordeste” and “8. ACeS Cávado III—Barcelos/Esposende” (p = 0.010); “4. ACeS Alto Trás-os-Montes—Nordeste” and “7. ACeS Cávado II—Gerês/Cabreira” (p < 0.001); “22. ACeS Tâmega I—Baixo Tâmega” and “7. ACeS Cávado II—Gerês/Cabreira” (p = 0.002) and “23. ACeS Tâmega II—Vale do Sousa Sul” and “7. ACeS Cávado II—Gerês/Cabreira” (p = 0.019).
- Safety climate“4. ACeS Alto Trás-os-Montes—Nordeste” and “13. ACeS Grande Porto I—Santo Tirso/Trofa” (p = 0.007) and “4. ACeS Alto Trás-os-Montes—Nordeste” and “7. ACeS Cávado II—Gerês/Cabreira” (p = 0.001).
- Job satisfaction“4. ACeS Alto Trás-os-Montes—Nordeste” and “13. ACeS Grande Porto I—Santo Tirso/Trofa” (p = 0.023).
- Management perceptionNo differences were found between pairs of categories.
- Working conditions“22. ACeS Tâmega I—Baixo Tâmega” and “16. ACeS Grande Porto IV—Póvoa do Varzim/Vila do Conde” (p = 0.027) and “22. ACeS Tâmega I—Baixo Tâmega” and “17. ACeS Grande Porto V—Porto Ocidental” (p = 0.010).
- Total SAQ-Short Form 2006 PT score“4. ACeS Alto Trás-os-Montes—Nordeste” and “13. ACeS Grande Porto I—Santo Tirso/Trofa” (p = 0.040).
4. Discussion
4.1. Principal Findings
- Team environmentThe lowest scores in the team environment domain were obtained for the categories of nurse, technical assistant and UCSP, indicating the need for investment in activities that promote communication skills and teamwork, especially with nurses, technical assistants and in the UCSP.
- Safety climateThe lowest median score in the safety climate domain was obtained in the UCSP, possible because that USF-A and USF-B have established, as a goal, the sharing and discussion of incidents at meetings. Information should be shared in an open, non-punitive environment and on a regular basis.
- Job satisfactionThe lowest scores in the job satisfaction domain were obtained among male respondents and in the UCSP. The USF-A and USF-B have, as previously mentioned, organizational, functional and technical autonomy, which might increase job satisfaction and contribute to professional fulfillment. Furthermore, professionals working in the USF-B have higher salaries compared to those employed by the UCSP and USF-A, likely explaining the obtained results.
- Stress recognitionIn the stress recognition domain, as the age of the respondent increases, the obtained SAQ-Short Form 2006 PT median score decreases, and as the length of service at the respondent’s current workplace increases, so does the obtained score. The lowest scores in n this domain were associated with the categories of nurse and technical assistant. Healthcare professionals should be able to recognize excessive workload and fatigue in order to improve the safety climate and promote effectiveness. Keeping this concept in mind is especially important as the age of professionals increases, with shorter length of service at the current workplace and in the categories of nurse and technical assistant. Self-care might also be relevant to this domain and should be promoted.
- Management perceptionThe score obtained in the management perception domain was below the threshold of 75, indicating the need for improvement. The lowest median scores in this domain were obtained among male respndents and in the UCSP. The UCSP has less autonomy than the USF-A and USF-B, which might influence management perception. The implementation of measures that promote the transition from the UCSP to the USF might improve this result.The median score in the management perception domain was also calculated separately for ACeS and UCSP/USF, with lower values associated with ACeS management. In the USF, management is not hierarchical and develops in a cooperative atmosphere witch might have contributed to the better result obtained in the UCSP/USF. Healthcare professionals perceive that managers of ACeS and UCSP/USF need to improve in terms of compromise of patient safety, management performance, support of professional efforts, constructive personnel problem solving and ensuring appropriate human resources. The lack of appropriate human resources is particularly evident, with a negative score for this item (29). The need for improvement with respect to support of professional efforts and constructive personnel problem solving is particulary evident for ACeS management, with negative mean scores for these items (24b,e and 27b). This domain is in need of attention from managers and intervention.
- Working conditionsThe SAQ-Short Form 2006 PT median score obtained in the working conditions domain was also below the threshold of 75, indicating the need for improvement. In this domain, low scores in the categories of technical assistant and UCSP indicate the need for improvement in personnel training and appropriate clinical decision support tools.
4.2. Comparison with Prior Work
4.3. Strengths and Limitations
5. Conclusions
Author Contributions
Funding
Institutional Review Board Statement
Informed Consent Statement
Data Availability Statement
Acknowledgments
Conflicts of Interest
Appendix A

| Workplace | Function | |||||
|---|---|---|---|---|---|---|
| Physicians n | Doctors in Pre-Career Training n | Nurse n | Technical Assistant n | Total | ||
| n | % | |||||
| 1. ACeS Alto Ave—Guimarães, Vizela e Terras de Basto | 142 | 52 | 157 | 114 | 465 | 6.3 |
| 2. ACeS Alto Minho | 173 | 62 | 173 | 136 | 544 | 7.3 |
| 3. ACeS Alto Trás-os-Montes—Alto Tâmega e Barroso | 68 | 31 | 82 | 75 | 256 | 3.4 |
| 4. ACES Alto Trás-os-Montes—Nordeste | 145 | 30 | 155 | 112 | 442 | 6.0 |
| 5. ACeS Ave/Famalicão | 75 | 25 | 71 | 50 | 221 | 3.0 |
| 6. ACeS Cávado I—Braga | 119 | 77 | 117 | 85 | 398 | 5.4 |
| 7. ACeS Cávado II—Gerês/Cabreira | 68 | 25 | 69 | 56 | 218 | 2.9 |
| 8. ACeS Cávado III—Barcelos/Esposende | 94 | 27 | 95 | 70 | 286 | 3.9 |
| 9. ACeS Douro I—Marão e Douro Norte | 68 | 27 | 80 | 67 | 242 | 3.3 |
| 10. ACeS Douro II—Douro Sul | 50 | 17 | 59 | 43 | 169 | 2.3 |
| 11. ACeS Entre Douro e Vouga I—Feira e Arouca | 93 | 40 | 96 | 72 | 301 | 4.1 |
| 12. ACeS Entre Douro e Vouga II—Aveiro Norte | 68 | 28 | 70 | 53 | 219 | 2.9 |
| 13. ACeS Grande Porto I—Santo Tirso/Trofa | 70 | 18 | 69 | 49 | 206 | 2.8 |
| 14. ACeS Grande Porto II—Gondomar | 96 | 63 | 92 | 76 | 327 | 4.4 |
| 15. ACeS Grande Porto III—Maia/Valongo | 127 | 43 | 125 | 85 | 380 | 5.1 |
| 16. ACeS Grande Porto IV—Póvoa do Varzim/Vila do Conde | 85 | 56 | 87 | 63 | 291 | 3.9 |
| 17. ACeS Grande Porto V—Porto Ocidental | 106 | 59 | 99 | 72 | 336 | 4.5 |
| 18. ACeS Grande Porto VI—Porto Oriental | 68 | 40 | 72 | 52 | 232 | 3.1 |
| 19. ACeS Grande Porto VII—Gaia | 104 | 35 | 91 | 62 | 292 | 3.9 |
| 20. ACeS Grande Porto VIII—Espinho/Gaia | 100 | 33 | 112 | 79 | 324 | 4.4 |
| 21. ACeS Matosinhos | 104 | 47 | 108 | 84 | 343 | 4.6 |
| 22. ACeS Tâmega I—Baixo Tâmega | 105 | 23 | 110 | 97 | 335 | 4.5 |
| 23. ACeS Tâmega II—Vale do Sousa Sul | 100 | 41 | 104 | 75 | 320 | 4.3 |
| 24. ACeS Tâmega III—Vale do Sousa Norte | 90 | 30 | 93 | 67 | 280 | 3.8 |
| Total | 2318 | 929 | 2386 | 1794 | 7427 | 100 |
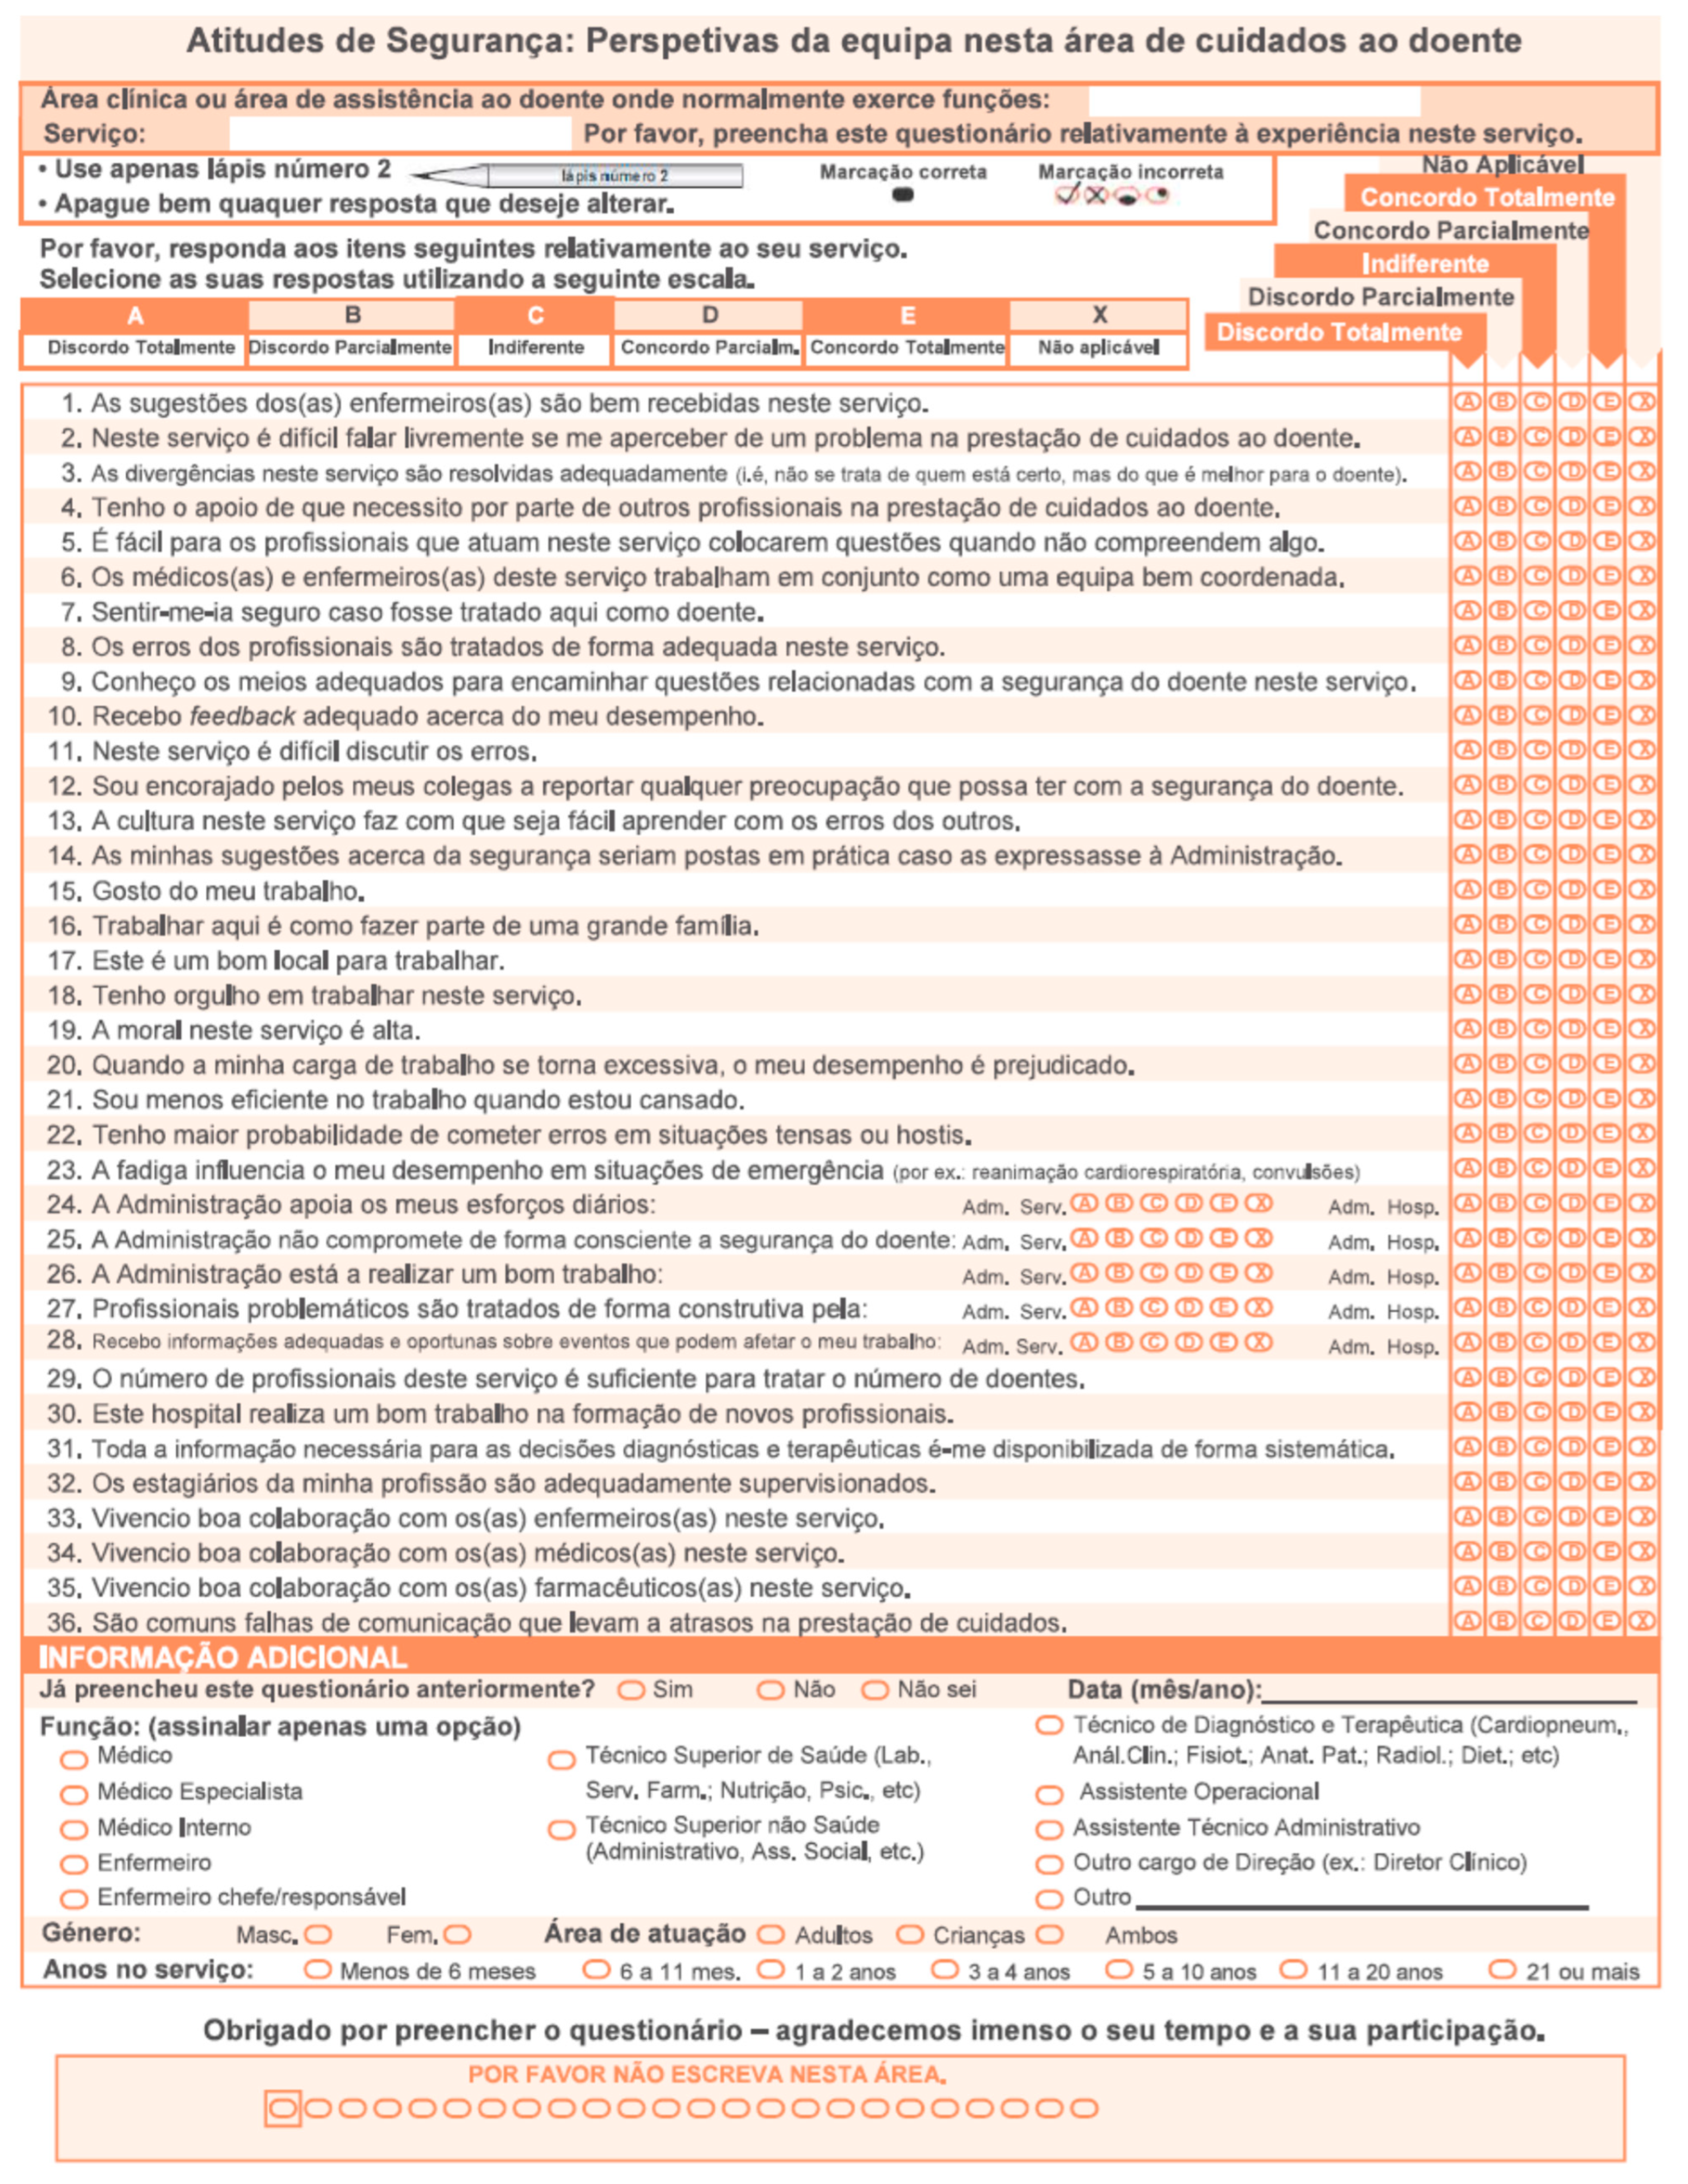
Appendix B. SAQ-Short Form 2006 PT [7]

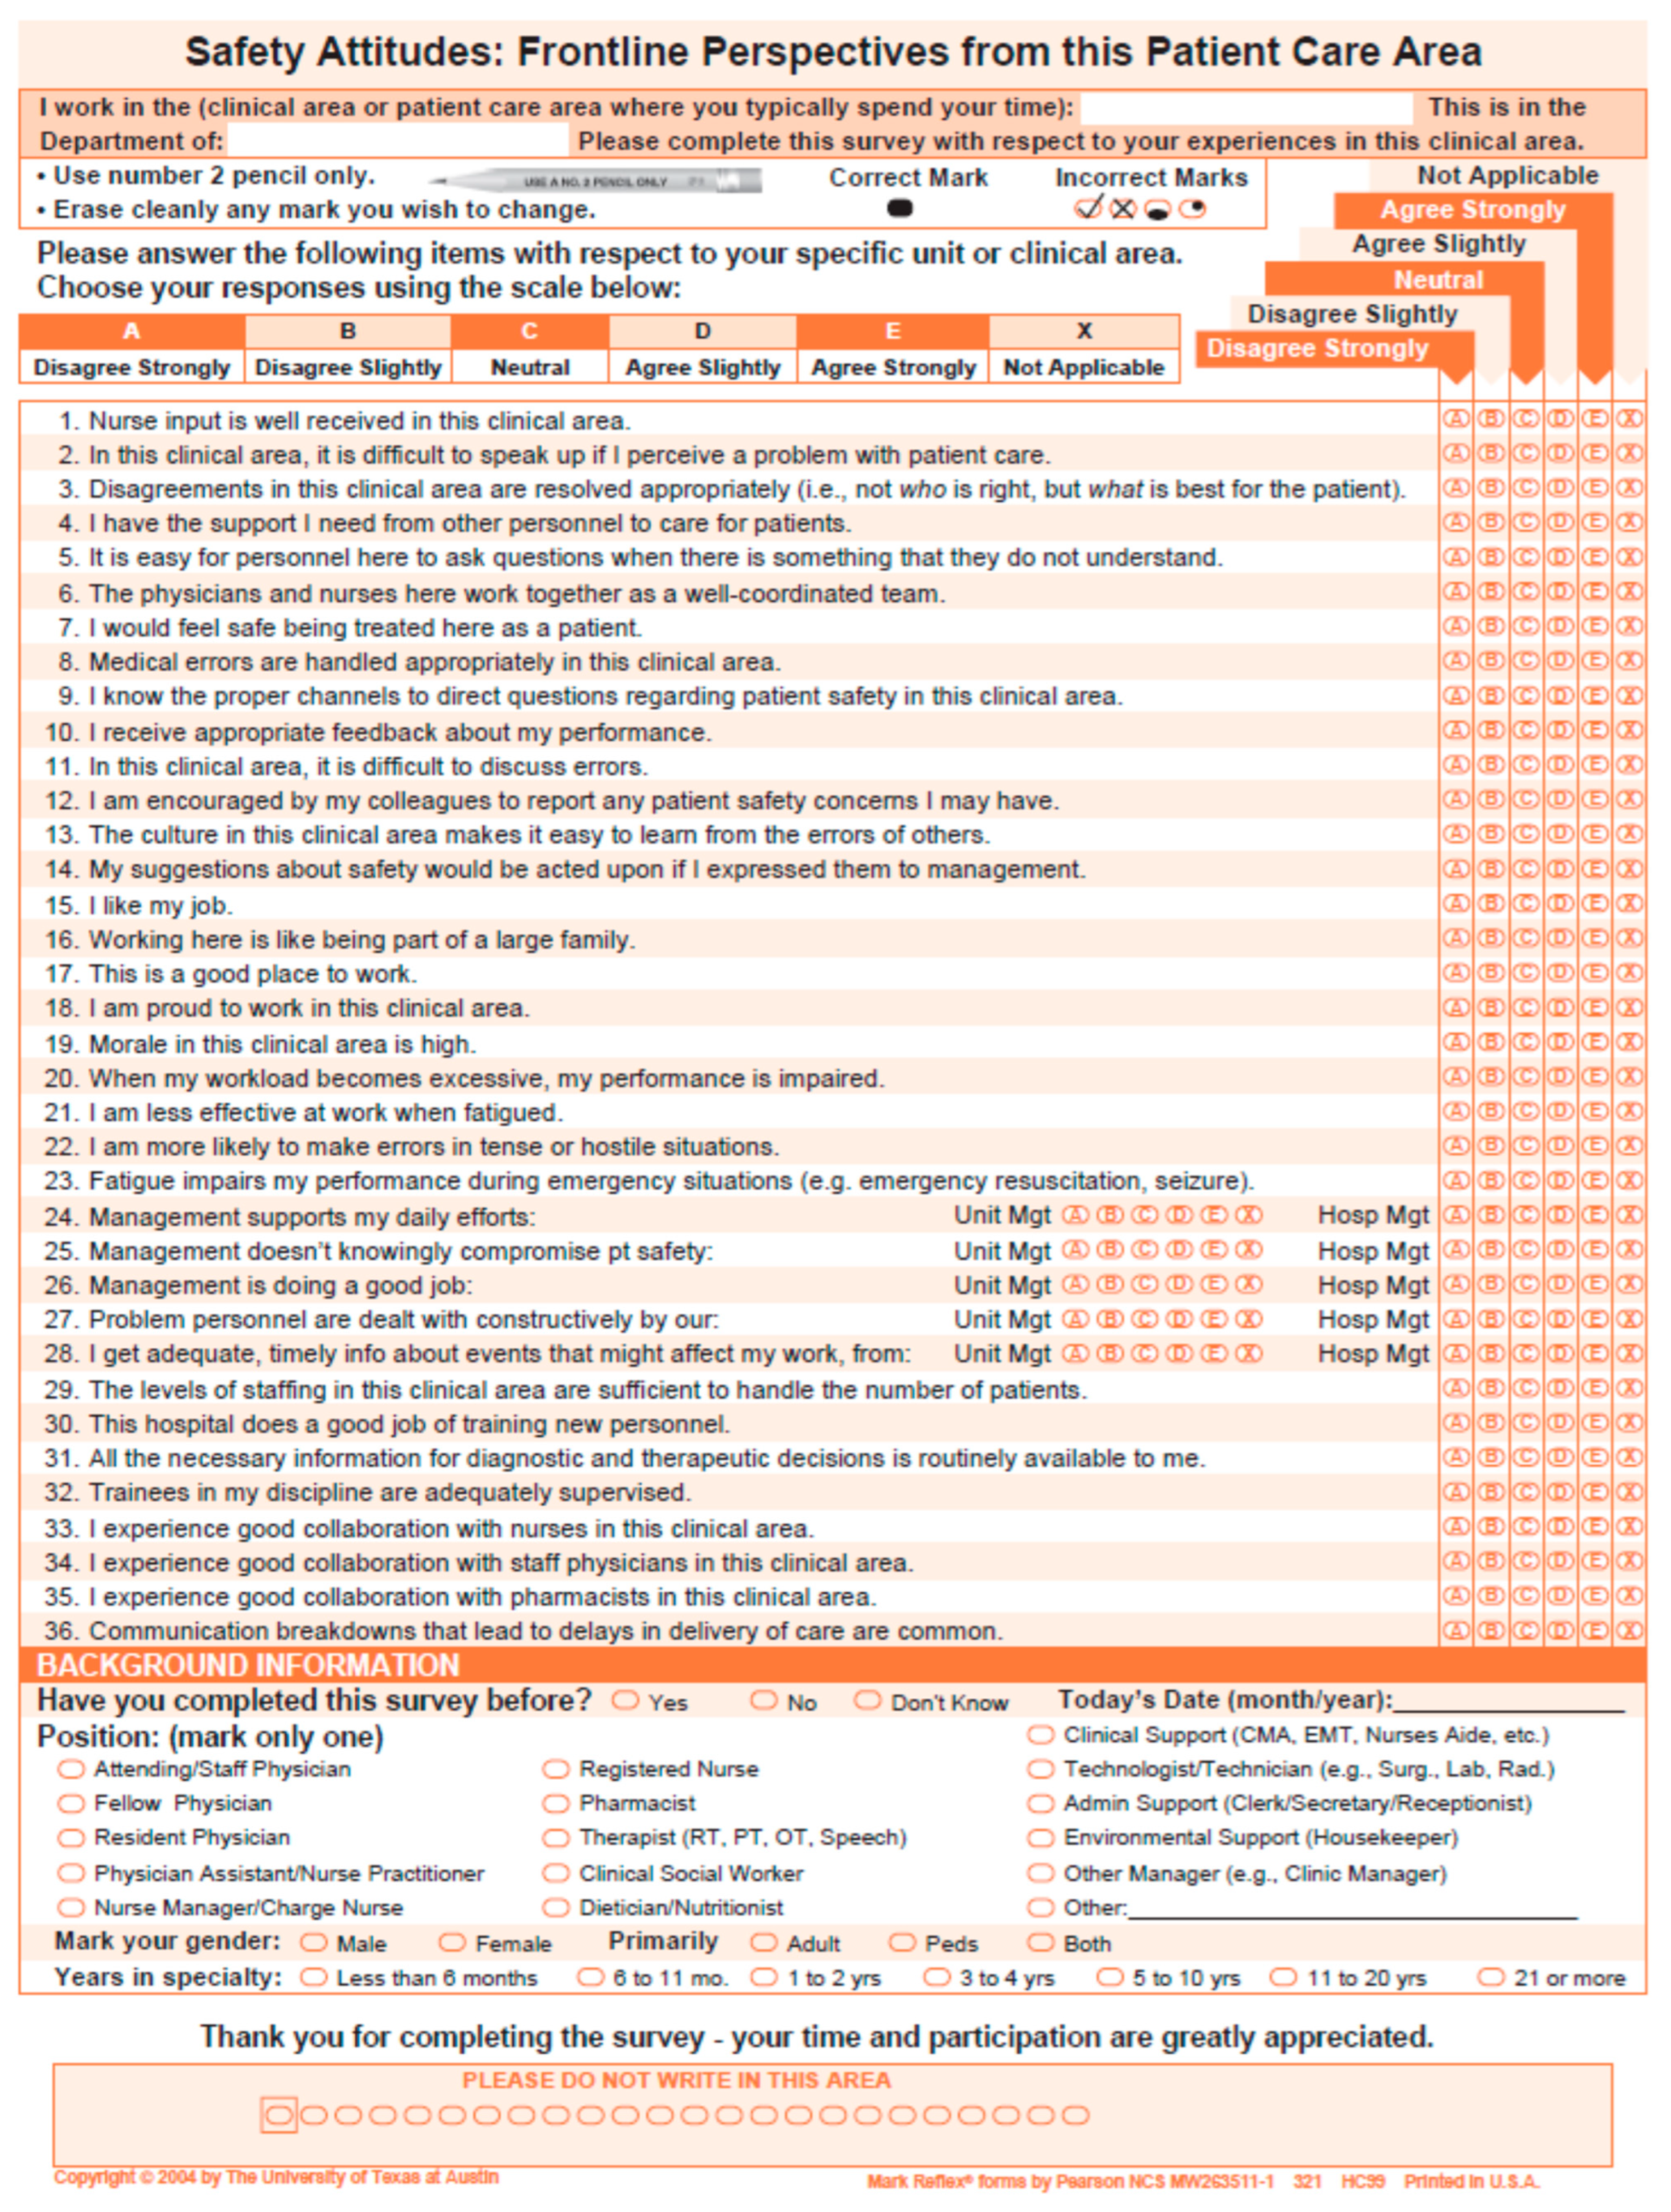
Appendix C. SAQ-Short Form 2006 [9]

Appendix D
| Workplace | Type of Primary Care Unit | |||||
|---|---|---|---|---|---|---|
| USF n | USF % | UCSP n | UCSP % | Total | ||
| n | % | |||||
| 1. ACeS Alto Ave—Guimarães, Vizela e Terras de Basto | 22 | 95.7 | 1 | 4.3 | 23 | 100.0 |
| 2. ACeS Alto Minho | 17 | 68.0 | 8 | 32.0 | 25 | 100.0 |
| 3. ACeS Alto Trás-os-Montes—Alto Tâmega e Barroso | 3 | 30.0 | 7 | 70.0 | 10 | 100.0 |
| 4. ACES Alto Trás-os-Montes—Nordeste | 0 | 0.0 | 15 | 100.0 | 15 | 100.0 |
| 5. ACeS Ave/Famalicão | 10 | 71.4 | 4 | 28.6 | 14 | 100.0 |
| 6. ACeS Cávado I—Braga | 18 | 90.0 | 2 | 10.0 | 20 | 100.0 |
| 7. ACeS Cávado II—Gerês/Cabreira | 8 | 66.7 | 4 | 33.3 | 12 | 100.0 |
| 8. ACeS Cávado III—Barcelos/Esposende | 12 | 66.7 | 6 | 33.3 | 18 | 100.0 |
| 9. ACeS Douro I—Marão e Douro Norte | 9 | 75.0 | 3 | 25.0 | 12 | 100.0 |
| 10. ACeS Douro II—Douro Sul | 3 | 27.3 | 8 | 72.7 | 11 | 100.0 |
| 11. ACeS Entre Douro e Vouga I—Feira e Arouca | 12 | 70.6 | 5 | 29.4 | 17 | 100.0 |
| 12. ACeS Entre Douro e Vouga II—Aveiro Norte | 9 | 75.0 | 3 | 25.0 | 12 | 100.0 |
| 13. ACeS Grande Porto I—Santo Tirso/Trofa | 9 | 81.8 | 2 | 18.2 | 11 | 100.0 |
| 14. ACeS Grande Porto II—Gondomar | 14 | 93.3 | 1 | 6.7 | 15 | 100.0 |
| 15. ACeS Grande Porto III—Maia/Valongo | 16 | 84.2 | 3 | 15.8 | 19 | 100.0 |
| 16. ACeS Grande Porto IV—Póvoa do Varzim/Vila do Conde | 14 | 100.0 | 0 | 0.0 | 14 | 100.0 |
| 17. ACeS Grande Porto V—Porto Ocidental | 15 | 100.0 | 0 | 0.0 | 15 | 100.0 |
| 18. ACeS Grande Porto VI—Porto Oriental | 9 | 90.0 | 1 | 10.0 | 10 | 100.0 |
| 19. ACeS Grande Porto VII—Gaia | 11 | 84.6 | 2 | 15.4 | 13 | 100.0 |
| 20. ACeS Grande Porto VIII—Espinho/Gaia | 14 | 77.8 | 4 | 22.2 | 18 | 100.0 |
| 21. ACeS Matosinhos | 11 | 78.6 | 3 | 21.4 | 14 | 100.0 |
| 22. ACeS Tâmega I—Baixo Tâmega | 8 | 40.0 | 12 | 60.0 | 20 | 100.0 |
| 23. ACeS Tâmega II—Vale do Sousa Sul | 14 | 82.4 | 3 | 17.6 | 17 | 100.0 |
| 24. ACeS Tâmega III—Vale do Sousa Norte | 12 | 75.0 | 4 | 25.0 | 16 | 100.0 |
| Total | 270 | 101 | 371 | |||
References
- Brennan, T.A.; Leape, L.L.; Laird, N.M.; Hebert, L.; Localio, A.R.; Lawthers, A.G.; Newhouse, J.P.; Weiler, P.C.; Hiatt, H.W. Incidence of adverse events and negligence in hospitalized patients. Results of the Harvard Medical Practice Study I. N. Engl. J. Med. 1991, 324, 370–376. [Google Scholar] [CrossRef] [PubMed] [Green Version]
- Leape, L.L.; Brennan, T.A.; Laird, N.; Lawthers, A.G.; Localio, A.R.; Barnes, B.A.; Hebert, L.; Newhouse, J.P.; Weiler, P.C.; Hiatt, H. The nature of adverse events in hospitalized patients. Results of the Harvard Medical Practice Study II. N. Engl. J. Med. 1991, 324, 377–384. [Google Scholar] [CrossRef] [PubMed] [Green Version]
- Donaldson, M.S.; Corrigan, J.M.; Kohn, L.T.; Institute of Medicine (US) Committee on Quality of Health Care in America (Eds.) To Err Is Human: Building a Safer Health System; National Academies Press (US): Washington, DC, USA, 2000. [Google Scholar]
- Donaldson, L. An organisation with a memory. Clin. Med. 2002, 2, 452–457. [Google Scholar] [CrossRef] [PubMed]
- World Health Organization. World Alliance for Patient Safety Forward Programme; World Health Organization: Geneva, Switzerland, 2004. [Google Scholar]
- Pittet, D.; Donaldson, L. Clean care is safer care: The first global challenge of the WHO World Alliance for Patient Safety. Am. J. Infect Control Hosp. Epidemiol. 2005, 33, 476–479. [Google Scholar] [CrossRef] [PubMed]
- Saraiva, D.M.R.F.; Almeida, A.D. Validation of the Safety Attitudes Questionnaire—Short Form 2006 to Portugal. Int. J. Nurs. 2015, 2, 103–112. [Google Scholar] [CrossRef] [Green Version]
- World Health Organization. Global Patient Safety Action Plan 2021–2030: Towards Eliminating Avoidable Harm in Health Care; World Health Organization: Geneva, Switzerland, 2021. [Google Scholar]
- Sexton, J.B.; Helmreich, R.L.; Neilands, T.B.; Rowan, K.; Vella, K.; Boyden, J.; Roberts, P.R.; Thomas, E.J. The Safety Attitudes Questionnaire: Psychometric properties, benchmarking data, and emerging research. BMC Health Serv. Res. 2006, 6, 44. [Google Scholar] [CrossRef] [PubMed] [Green Version]
- Panesar, S.S.; deSilva, D.; Carson-Stevens, A.; Cresswell, K.M.; Salvilla, S.A.; Slight, S.P.; Javad, S.; Netuveli, G.; Larizgoitia, I.; Donaldson, L.J.; et al. How safe is primary care? A systematic review. BMJ Qual. Saf. 2016, 25, 544–553. [Google Scholar] [CrossRef] [Green Version]
- Panagioti, M.; Khan, K.; Keers, R.N.; Abuzour, A.; Phipps, D.; Kontopantelis, E.; Bower, P.; Campbell, S.; Haneef, R.; Avery, A.J.; et al. Prevalence, severity, and nature of preventable patient harm across medical care settings: Systematic review and meta-analysis. BMJ 2019, 366, l4185. [Google Scholar] [CrossRef] [PubMed] [Green Version]
- Gens-Barberà, M.H.-V.N.; Vidal-Esteve, E.; Mengíbar-García, Y.; Hospital-Guardiola, I.; Oya-Girona, E.M.; Bejarano-Romero, F.; Castro-Muniain, C.; Satué-Gracia, E.M.; Rey-Reñones, C.; Martín-Luján, F.M. Analysis of Patient Safety Incidents in Primary Care Reported in an Electronic Registry Application. Int. J. Environ. Res. Public Health 2021, 18, 8941. [Google Scholar] [CrossRef] [PubMed]
- Saraiva, D.M.R.F.; de Almeida, A.A. Patient Safety Environment: Perception of Health Care Professionals. Int. J. Nurs. 2016, 3, 73–80. [Google Scholar] [CrossRef]
- Biscaia, A.R.; Heleno, L.C.V. Primary Health Care Reform in Portugal: Portuguese, modern and innovative. Ciência Saúde Coletiva 2017, 22, 701–711. [Google Scholar] [CrossRef] [PubMed]
- McGuire, M.J.; Noronha, G.; Samal, L.; Yeh, H.-C.; Crocetti, S.; Kravet, S. Patient Safety Perceptions of Primary Care Providers after Implementation of an Electronic Medical Record System. J. Gen. Intern. Med. 2012, 28, 184–192. [Google Scholar] [CrossRef] [PubMed] [Green Version]
- Lousada, L.M.; da Silva Dutra, F.C.; da Silva, B.V.; de Oliveira NL, L.; Bastos, I.B.; de Vasconcelos, P.F.; de Carvalho RE, F.L. Patient safety culture in primary and home care services. BMC Fam. Pract. 2020, 21, 188. [Google Scholar] [CrossRef] [PubMed]


| Workplace | Function | |||||
|---|---|---|---|---|---|---|
| Physicians n | Doctors in Pre-Career Training n | Nurse n | Technical Assistant n | Total | ||
| n | % | |||||
| 1. ACeS Alto Ave—Guimarães, Vizela e Terras de Basto | 12 | 4 | 10 | 6 | 32 | 4.9 |
| 2. ACeS Alto Minho | 12 | 3 | 12 | 8 | 35 | 5.4 |
| 3. ACeS Alto Trás-os-Montes—Alto Tâmega e Barroso | 5 | 3 | 6 | 5 | 19 | 2.9 |
| 4. ACES Alto Trás-os-Montes—Nordeste | 9 | 3 | 9 | 16 | 37 | 5.7 |
| 5. ACeS Ave/Famalicão | 9 | 4 | 4 | 4 | 21 | 3.2 |
| 6. ACeS Cávado I—Braga | 15 | 6 | 12 | 7 | 40 | 6.2 |
| 7. ACeS Cávado II—Gerês/Cabreira | 4 | 1 | 7 | 4 | 16 | 2.5 |
| 8. ACeS Cávado III—Barcelos/Esposende | 7 | 4 | 10 | 6 | 27 | 4.2 |
| 9. ACeS Douro I—Marão e Douro Norte | 7 | 1 | 6 | 3 | 17 | 2.6 |
| 10. ACeS Douro II—Douro Sul | 2 | 1 | 4 | 3 | 10 | 1.5 |
| 11. ACeS Entre Douro e Vouga I—Feira e Arouca | 5 | 3 | 7 | 8 | 23 | 3.5 |
| 12. ACeS Entre Douro e Vouga II—Aveiro Norte | 5 | 3 | 4 | 7 | 19 | 2.9 |
| 13. ACeS Grande Porto I—Santo Tirso/Trofa | 14 | 2 | 8 | 4 | 28 | 4.3 |
| 14. ACeS Grande Porto II—Gondomar | 8 | 4 | 5 | 4 | 21 | 3.2 |
| 15. ACeS Grande Porto III—Maia/Valongo | 24 | 4 | 7 | 11 | 46 | 7.1 |
| 16. ACeS Grande Porto IV—Póvoa do Varzim/Vila do Conde | 7 | 4 | 15 | 4 | 30 | 4.6 |
| 17. ACeS Grande Porto V—Porto Ocidental | 20 | 4 | 9 | 4 | 37 | 5.7 |
| 18. ACeS Grande Porto VI—Porto Oriental | 7 | 3 | 5 | 4 | 19 | 2.9 |
| 19. ACeS Grande Porto VII—Gaia | 10 | 4 | 6 | 3 | 23 | 3.5 |
| 20. ACeS Grande Porto VIII—Espinho/Gaia | 10 | 2 | 8 | 5 | 25 | 3.9 |
| 21. ACeS Matosinhos | 15 | 2 | 8 | 4 | 29 | 4.5 |
| 22. ACeS Tâmega I—Baixo Tâmega | 8 | 1 | 15 | 9 | 33 | 5.1 |
| 23. ACeS Tâmega II—Vale do Sousa Sul | 6 | 4 | 8 | 8 | 26 | 4.0 |
| 24. ACeS Tâmega III—Vale do Sousa Norte | 9 | 1 | 21 | 5 | 36 | 5.5 |
| TOTAL | 230 | 71 | 206 | 142 | 649 | 100.0 |
| SAQ—Short Form 2006 PT | n | Mean (SD) | Median [Q1; Q3] |
|---|---|---|---|
| Total score | 350 | 69.23 (15.73) | 71.53 [59.03; 79.86] |
| Team environment (items 1–6) | 608 | 77.41 (19.38) | 79.17 [66.67; 91.67] |
| Safety climate (items 7–13) | 587 | 71.91 (20.00) | 75.00 [60.71; 85.71] |
| Job satisfaction (items 15–19) | 597 | 75.61 (24.13) | 80.00 [60.00; 95.00] |
| Stress recognition (items 20–23) | 503 | 83.42 (21.34) | 93.75 [75.00; 100.00] |
| Management perception (items 24–29) | 486 | 54.66 (22.20) | 54.55 [38.64; 70.45] |
| Working conditions (items 30–32) | 492 | 66.55 (23.97) | 66.67 [50.00; 83.33] |
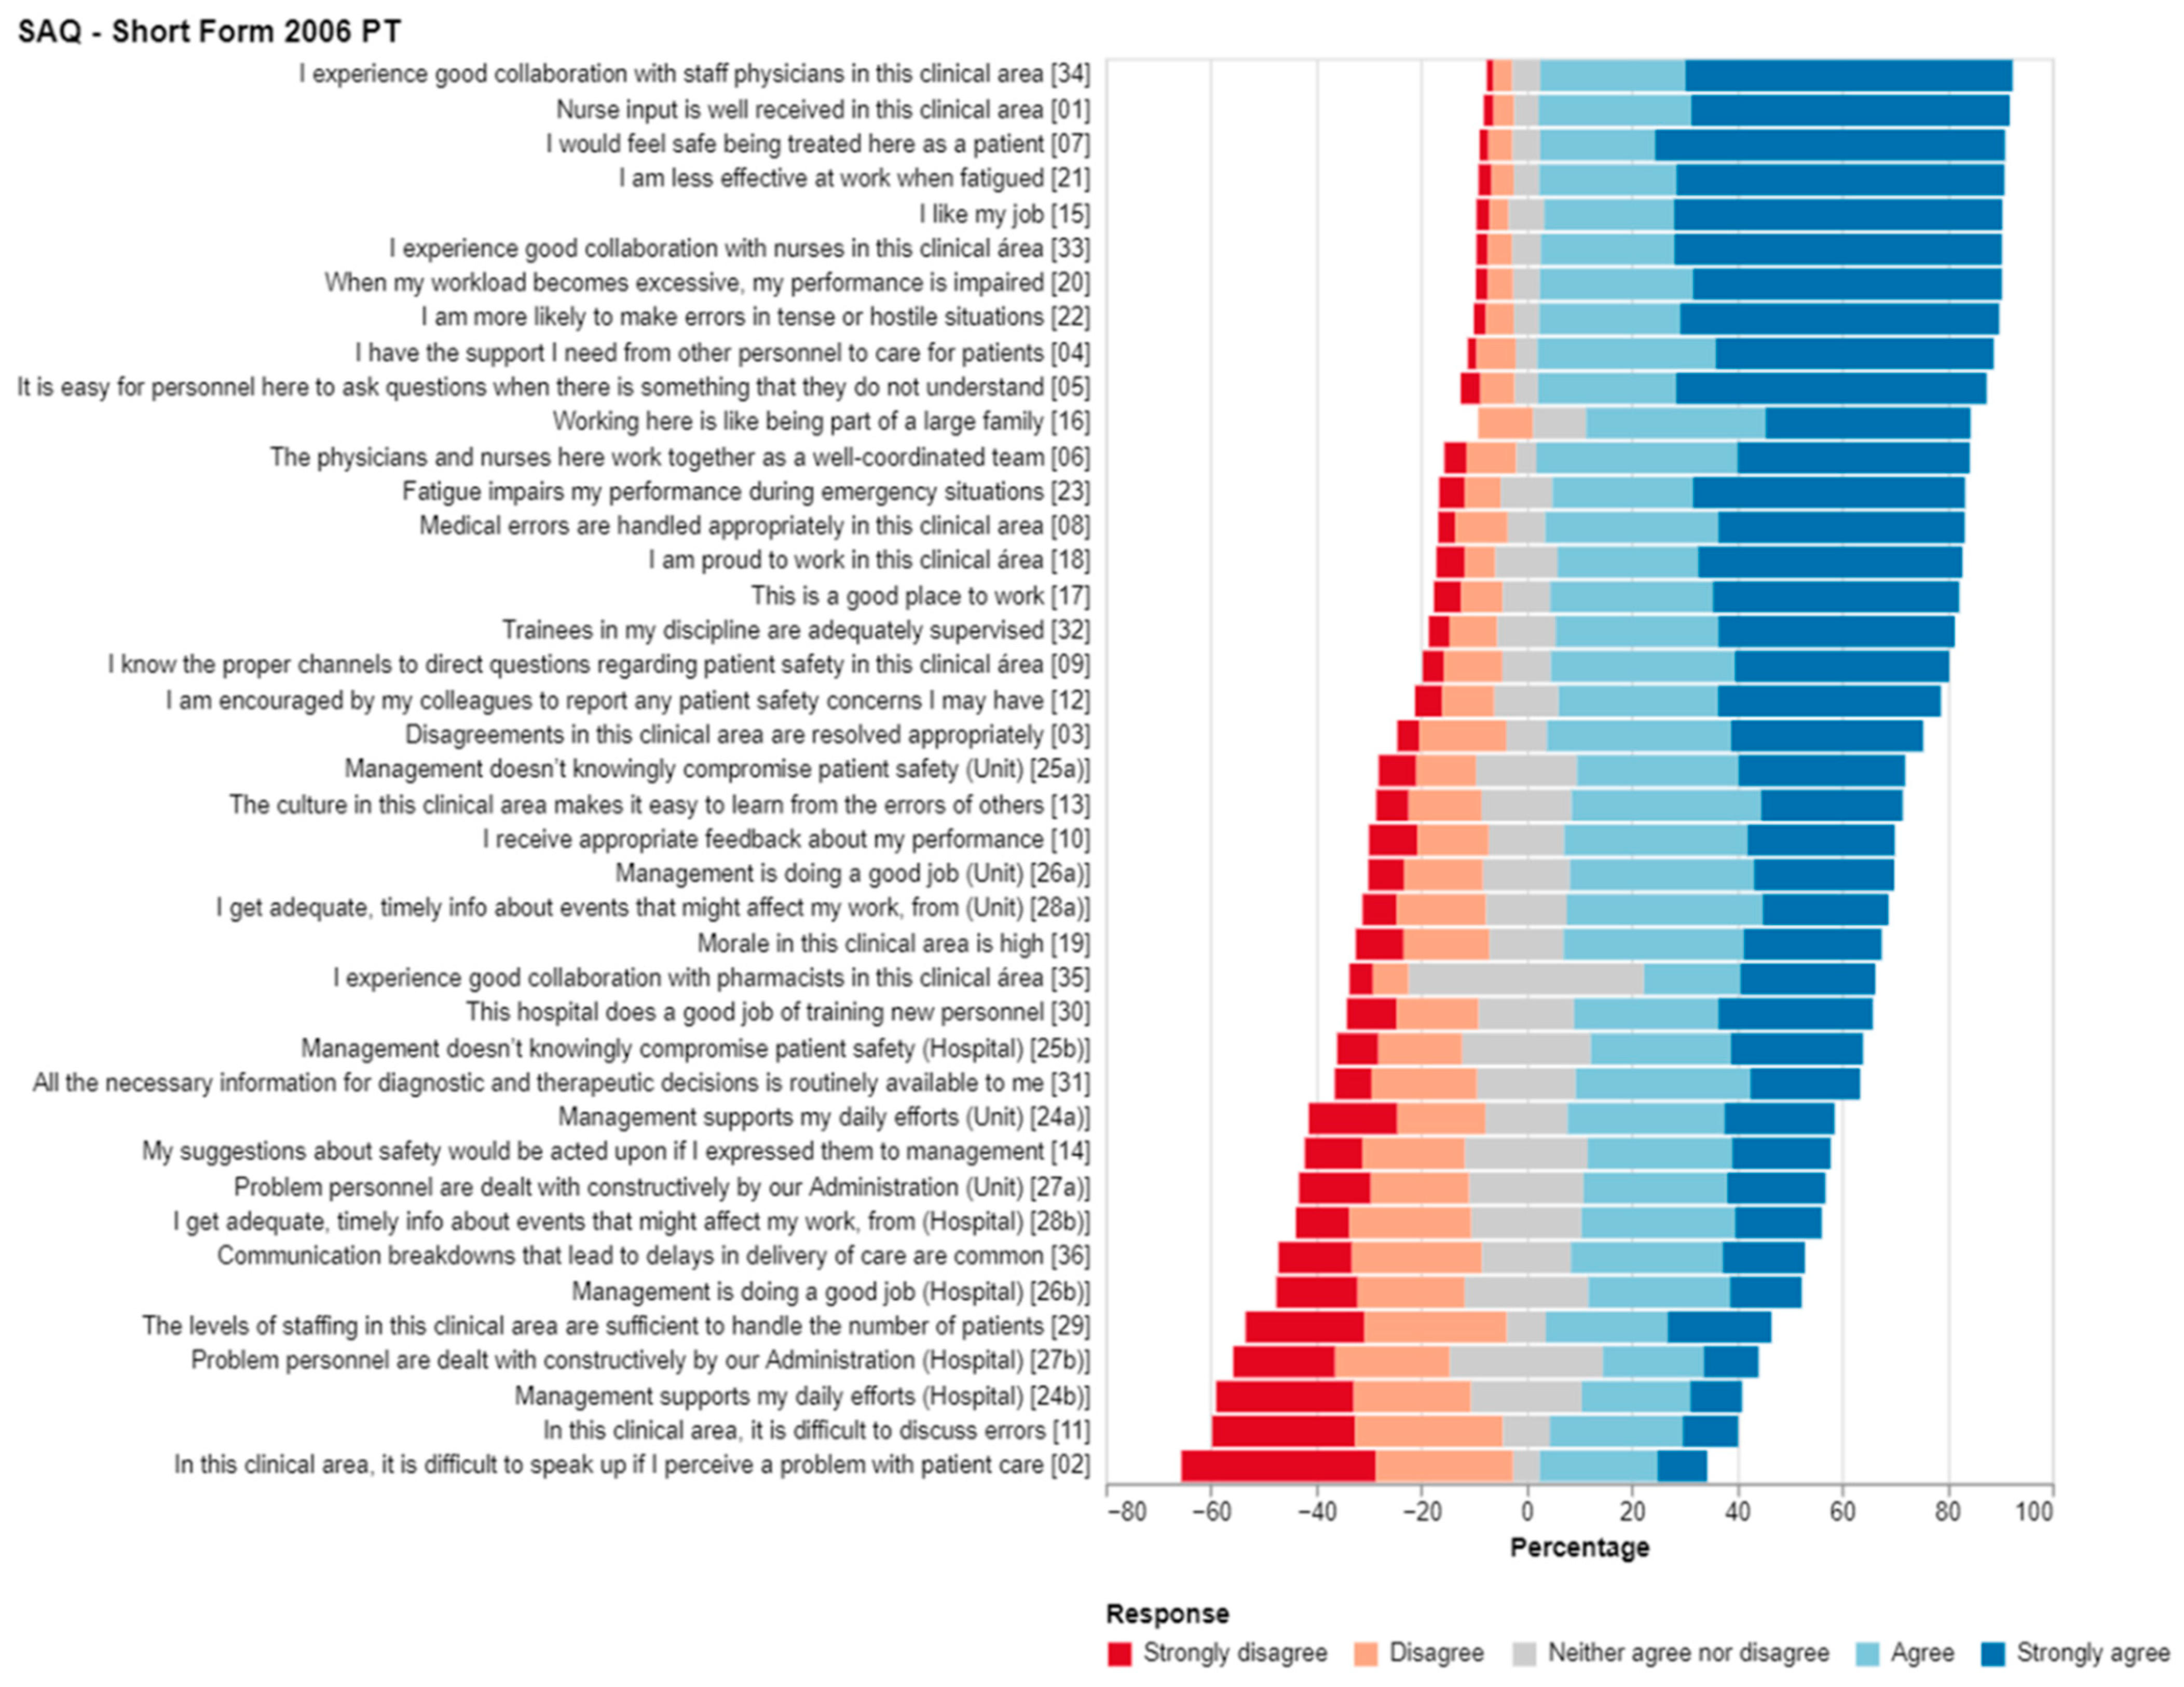
| SAQ-Short Form 2006 PT, per Item | Mean (SD) | Median [Q1; Q3] |
|---|---|---|
| Team environment (items 1–6) | ||
| 1. Nurse input is well received in this clinical area. (a clinical area = UCSP/USF), n = 636 | 4.42 (0.89) | 5 [4; 5] |
| 2. In this clinical area, it is difficult to speak up if I perceive a problem with patient careb. (a clinical area = UCSP/USF), n = 640 | 3.59 (1.41) | 4 [2; 5] |
| 3. Disagreements in this clinical area are resolved appropriately (i.e., not who is right, but what is best for the patient). (a clinical area = UCSP/USF), n = 638 | 3.83 (1.21) | 4 [3; 5] |
| 4. I have the support I need from other personnel to care for patients, n = 636 | 4.29 (0.97) | 5 [4; 5] |
| 5. It is easy for personnel here to ask questions when there is something that they do not understand. (a Unit = UCSP/USF), n = 634 | 4.30 (1.07) | 5 [4; 5] |
| 6. The physicians and nurses here work together as a well-coordinated team. (a Unit = UCSP/USF), n = 639 | 4.09 (1.11) | 4 [4; 5] |
| Safety climate (items 7–13) | ||
| 7. I would feel safe being treated here as a patient, n = 629 | 4.47 (0.92) | 5 [4; 5] |
| 8. Medical errors are handled appropriately in this clinical area. (a clinical area = UCSP/USF), n = 631 | 4.10 (1.10) | 4 [4; 5] |
| 9. I know the proper channels to direct questions regarding patient safety in this clinical area. (a clinical area = UCSP/USF), n = 632 | 3.97 (1.14) | 4 [4; 5] |
| 10. I receive appropriate feedback about my performance, n = 642 | 3.59 (1.28) | 4 [3; 5] |
| 11. In this clinical area, it is difficult to discuss errors b. (a clinical area = UCSP/USF), n = 640 | 3.36 (1.38) | 4 [2; 5] |
| 12. I am encouraged by my colleagues to report any patient safety concerns I may have, n = 638 | 3.95 (1.19) | 4 [3; 5] |
| 13. The culture in this clinical area makes it easy to learn from the errors of others. (a clinical area = UCSP/USF), n = 632 | 3.64 (1.19) | 4 [3; 5] |
| Single item (item 14) | ||
| 14. My suggestions about safety would be acted upon if I expressed them to management, n = 626 | 3.23 (1.27) | 3 [2; 4] |
| Job satisfaction (items 15–19) | ||
| 15. I like my job, n = 607 | 4.41 (0.95) | 5 [4; 5] |
| 16. Working here is like being part of a large family, n = 632 | 3.89 (1.21) | 4 [3; 5] |
| 17. This is a good place to work, n = 632 | 4.06 (1.16) | 4 [4; 5] |
| 18. I am proud to work in this clinical area. (a clinical area = UCSP/USF), n = 626 | 4.11 (1.15) | 5 [4; 5] |
| 19. Morale in this clinical area is high, n = 638 | 3.52 (1.28) | 4 [2; 5] |
| Stress recognition (items 20–23) | ||
| 20. When my workload becomes excessive, my performance is impaired, n = 603 | 4.37 (0.95) | 5 [4; 5] |
| 21. I am less effective at work when fatigued, n = 602 | 4.42 (0.94) | 5 [4; 5] |
| 22. I am more likely to make errors in tense or hostile situations, n = 602 | 4.38 (0.97) | 5 [4; 5] |
| 23. Fatigue impairs my performance during emergency situations (e.g., emergency resuscitation, seizure), n = 530 | 4.14 (1.15) | 5 [4; 5] |
| Management perception (items 24–29) | ||
| 24. (a) Management supports my daily efforts (Unit Management) (a Unit = UCSP/USF), n = 635 | 3.21 (1.39) | 4 [2; 4] |
| 24. (b) Management supports my daily efforts (Hospital Administration). (a hospital = ACeS), n = 561 | 2.66 (1.33) | 3 [1; 4] |
| 25. (a) Management doesn’t knowingly compromise patient safety (Unit Management) (a Unit = UCSP/USF), n = 621 | 3.68 (1.23) | 4 [3; 5] |
| 25. (b) Management doesn’t knowingly compromise patient safety (Hospital Administration). (a hospital = ACeS), n = 554 | 3.45 (1.24) | 4 [3; 5] |
| 26. (a) Management is doing a good job (Unit Management) (a Unit = UCSP/USF), n = 635 | 3.60 (1.22) | 4 [3; 5] |
| 26. (b) Management is doing a good job (Hospital Administration). (a hospital = ACeS), n = 566 | 3.03 (1.28) | 3 [2; 4] |
| 27. (a) Problem personnel are dealt with constructively by our Administration (Unit Management) (a Unit = UCSP/USF), n = 614 | 3.18 (1.31) | 3 [2; 4] |
| 27. (b) Problem personnel are dealt with constructively by our Administration (Hospital Administration). (a hospital = ACeS), n = 546 | 2.79 (1.25) | 3 [2; 4] |
| 28. (a) I get adequate, timely info about events that might affect my work, from (Unit Management) (a Unit = UCSP/USF), n = 628 | 3.55 (1.21) | 4 [3; 4] |
| 28. (b) I get adequate, timely info about events that might affect my work, from (Hospital Administration). (a hospital = ACeS), n = 560 | 3.19 (1.25) | 3 [2; 4] |
| 29. The levels of staffing in this clinical area are sufficient to handle the number of patients, n = 638 | 2.90 (1.48) | 3 [2; 4] |
| Working conditions (items 30–32) | ||
| 30. This hospital does a good job of training new personnel. (a hospital = ACeS), n = 559 | 3.52 (1.31) | 4 [2; 5] |
| 31. All the necessary information for diagnostic and therapeutic decisions is routinely available to me. n = 582 | 3.41 (1.22) | 4 [2; 4] |
| 32. Trainees in my discipline are adequately supervised, n = 561 | 4.04 (1.13) | 4 [4; 5] |
| Single items (items 33–36) | ||
| 33. I experience good collaboration with nurses in this clinical area. (a Unit = UCSP/USF), n = 624 | 4.41 (0.95) | 5 [4; 5] |
| 34. I experience good collaboration with staff physicians in this clinical area. (a Unit = UCSP/USF), n = 619 | 4.46 (0.85) | 5 [4; 5] |
| 35. I experience good collaboration with pharmacists in this clinical area, n = 266 | 3.54 (1.08) | 3 [3; 5] |
| 36. Communication breakdowns that lead to delays in delivery of care are common b, n = 623 | 2.93 (1.31) | 3 [2; 4] |
| Demographic and Professional Characteristics/SAQ-Short Form 2006 PT Domains | Total SAQ-Short Form 2006 PT Score | SAQ-Short Form 2006 PT Scores per Domain | |||||||||||||||||||
|---|---|---|---|---|---|---|---|---|---|---|---|---|---|---|---|---|---|---|---|---|---|
| Team Environment | Safety Climate | Job Satisfaction | Stress Recognition | Management Perception | Working Conditions | ||||||||||||||||
| n | S | p | n | S | p | n | S | p | n | S | p | n | S | p | n | S | p | n | S | p | |
| Gender, Med [Q1; Q3]/M (SD) | 0.019 a | 0.119 a | 0.182 a | 0.001 a | 0.597 a | 0.024 c | 0.126 a | ||||||||||||||
| Male | 79 | 67.4 [54.9; 77.1] | 138 | 79.2 [66.7; 91.7] | 135 | 75 [60.7; 85.7] | 133 | 75 [55; 90] | 116 | 93.8 [75; 100] | 106 | 50.4 (21.8) | 115 | 66.7 [50; 75] | |||||||
| Female | 271 | 72.9 [60.4; 80.6] | 470 | 83.3 [66.7; 95.8] | 452 | 75 [60.7; 89.3] | 464 | 85 [65; 95] | 387 | 87.5 [75; 100] | 380 | 55.9 (22.2) | 377 | 75 [50; 83.3] | |||||||
| Age, rS/rP | 348 | −0.014 | 0.794 b | 604 | −0.041 | 0.315 b | 583 | −0.029 | 0.487 b | 593 | 0.023 | 0.578 b | 500 | −0.166 | <0.001 b | 484 | 0.013 | 0.775 d | 490 | −0.003 | 0.942 b |
| Function, Med [Q1; Q3] | 0.109 e | <0.001 e | 0.165 e | 0.360 e | <0.001 e | 0.559 e | 0.016 e | ||||||||||||||
| Technical Assistant | 38 | 62.8 [53.1; 76.2] | 125 | 79.2 [58.3; 91.7] | 120 | 73.2 [60.7; 85.7] | 123 | 80 [60; 95] | 79 | 75 [37.5; 87.5] | 79 | 61.4 [38.6; 75] | 66 | 58.3 [47.9; 75] | |||||||
| Nurse | 128 | 71.9 [59; 79.9] | 198 | 77.1 [62.5; 91.7] | 189 | 75 [57.1; 85.7] | 189 | 80 [60; 95] | 172 | 87.5 [75; 100] | 166 | 56.8 [38.1; 72.7] | 170 | 66.7 [50; 83.3] | |||||||
| Doctor in pre-career training | 49 | 75.7 [66.7; 79.9] | 67 | 87.5 [75; 91.7] | 66 | 78.6 [64.3; 86.6] | 67 | 90 [75; 95] | 65 | 93.8 [81.3; 100] | 57 | 59.1 [40.9; 70.5] | 64 | 75 [58.3; 89.6] | |||||||
| Physicians | 135 | 70.1 [59.0; 80.6] | 218 | 87.5 [70.8; 95.] | 212 | 75 [57.1; 89.3] | 218 | 80 [60; 95] | 187 | 100 [81.3; 100] | 184 | 52.3 [38.6; 67.6] | 192 | 75 [50; 83.3] | |||||||
| Length of service at the current workplace, rS | 350 | 0.041 | 0.450 b | 608 | −0.027 | 0.500 b | 587 | −0.020 | 0.624 b | 597 | −0.001 | 0.971 b | 503 | −0.095 | 0.032 b | 486 | −0.017 | 0.707 b | 492 | 0.059 | 0.191 b |
| Type of primary care unit, Med [Q1; Q3] /M (SD) | <0.001 e | <0.001 e | <0.001 e | <0.001 e | 0.601 e | 0.038 f | <0.001 e | ||||||||||||||
| UCSP | 58 | 60.4 [47.7; 72.2] | 118 | 66.7 [50; 83.3] | 111 | 60.7 [46.4; 78.6] | 114 | 72.5 [55; 95] | 95 | 93.8 [75; 100] | 80 | 48.9 (21.3) | 84 | 58.3 [41.7; 75] | |||||||
| USF-A | 82 | 73.6 [60.9; 80.6] | 141 | 87.5 [70.8; 95.8] | 135 | 78.6 [64.3; 89.3] | 138 | 80 [60; 95] | 116 | 87.5 [75; 100] | 117 | 56.4 (21.9) | 115 | 75 [50; 83.3] | |||||||
| USF-B | 210 | 72.9 [62.5; 81.3] | 349 | 83.3 [70.8; 91.7] | 341 | 75 [64.3; 89.3] | 345 | 85 [70; 95] | 292 | 93.8 [75; 100] | 289 | 55.6 (22.4) | 293 | 75 [50; 91.7] | |||||||
Publisher’s Note: MDPI stays neutral with regard to jurisdictional claims in published maps and institutional affiliations. |
© 2022 by the authors. Licensee MDPI, Basel, Switzerland. This article is an open access article distributed under the terms and conditions of the Creative Commons Attribution (CC BY) license (https://creativecommons.org/licenses/by/4.0/).
Share and Cite
Ferreira, M.M.M.; Teixeira, A.S.C.; Taveira-Gomes, T.S.d.M. Safety Climate Evaluation in Primary Health Care: A Cross-Sectional Study. Int. J. Environ. Res. Public Health 2022, 19, 14344. https://doi.org/10.3390/ijerph192114344
Ferreira MMM, Teixeira ASC, Taveira-Gomes TSdM. Safety Climate Evaluation in Primary Health Care: A Cross-Sectional Study. International Journal of Environmental Research and Public Health. 2022; 19(21):14344. https://doi.org/10.3390/ijerph192114344
Chicago/Turabian StyleFerreira, Marlene Manuela Moreira, Andreia Sofia Costa Teixeira, and Tiago Salgado de Magalhães Taveira-Gomes. 2022. "Safety Climate Evaluation in Primary Health Care: A Cross-Sectional Study" International Journal of Environmental Research and Public Health 19, no. 21: 14344. https://doi.org/10.3390/ijerph192114344