
Bacterial Communities in Effluents Rich in Phenol and Their Potential in Bioremediation: Kinetic Modeling
 , , and
Abstract
:1. Introduction
2. Materials and Methods
2.1. Sampling
2.2. Isolation and Identification of Microorganisms
2.3. Evaluation of Bioremedation Potential by Isolated Microorganisms
2.3.1. First Assay
2.3.2. Second Assay
2.4. Kinetic Modeling
3. Results and Discussions
3.1. Characterization of Samples and Molecular Identification of Microorganisms
3.2. Bioremedation Potential by Isolated Microorganisms
3.2.1. First Assay
3.2.2. Second Essay
3.3. Biodegradation Kinetics
3.4. Perspectives and Outlook
4. Conclusions
Author Contributions
Funding
Informed Consent Statement
Data Availability Statement
Acknowledgments
Conflicts of Interest
References
- Priyadharshini, S.D.; Bakthavatsalam, A.K. A Comparative Study on Growth and Degradation Behavior of C. Pyrenoidosa on Synthetic Phenol and Phenolic Wastewater of a Coal Gasification Plant. J. Environ. Chem. Eng. 2019, 7, 103079. [Google Scholar] [CrossRef]
- Comisión Nacional del Agua. Ley Federal de Derechos Disposiciones Aplicables En Materia de Aguas Nacionales 2016, 2019th ed.; Comisión Nacional del Agua: Ciudad de México, Mexico, 2016. [Google Scholar]
- Busca, G.; Berardinelli, S.; Resini, C.; Arrighi, L. Technologies for the Removal of Phenol from Fluid Streams: A Short Review of Recent Developments. J. Hazard. Mater. 2008, 160, 265–288. [Google Scholar] [CrossRef] [PubMed]
- Mukherjee, S.; Basak, B.; Bhunia, B.; Dey, A.; Mondal, B. Potential Use of Polyphenol Oxidases (PPO) in the Bioremediation of Phenolic Contaminants Containing Industrial Wastewater. Rev. Environ. Sci. Bio. Technol. 2013, 12, 61–73. [Google Scholar] [CrossRef]
- Ma, X.; Li, N.; Jiang, J.; Xu, Q.; Li, H.; Wang, L.; Lu, J. Adsorption–Synergic Biodegradation of High-Concentrated Phenolic Water by Pseudomonas Putida Immobilized on Activated Carbon Fiber. J. Environ. Chem. Eng. 2013, 1, 466–472. [Google Scholar] [CrossRef]
- Méndez, J.A.O.; Melián, J.A.H.; Araña, J.; Rodríguez, J.M.D.; Díaz, O.G.; Peña, J.P. Detoxification of Waters Contaminated with Phenol, Formaldehyde and Phenol–Formaldehyde Mixtures Using a Combination of Biological Treatments and Advanced Oxidation Techniques. Appl. Catal. B Environ. 2015, 163, 63–73. [Google Scholar] [CrossRef]
- Singh, U.; Arora, N.K.; Sachan, P. Simultaneous Biodegradation of Phenol and Cyanide Present in Coke-Oven Effluent Using Immobilized Pseudomonas Putida and Pseudomonas Stutzeri. Braz. J. Microbiol. 2018, 49, 38–44. [Google Scholar] [CrossRef]
- Kujawski, W.; Warszawski, A.; Ratajczak, W.; Porębski, T.; Capała, W.; Ostrowska, I. Application of Pervaporation and Adsorption to the Phenol Removal from Wastewater. Sep. Purif. Technol. 2004, 40, 123–132. [Google Scholar] [CrossRef]
- Panigrahy, N.; Priyadarshini, A.; Sahoo, M.M.; Verma, A.K.; Daverey, A.; Sahoo, N.K. A Comprehensive Review on Eco-Toxicity and Biodegradation of Phenolics: Recent Progress and Future Outlook. Environ. Technol. Innov. 2022, 27, 102423. [Google Scholar] [CrossRef]
- Ren, Y.; Peng, L.; Zhao, G.; Wei, C. Degradation of M-Cresol via the Ortho Cleavage Pathway by Citrobacter Farmeri SC01. Biochem. Eng. J. 2014, 88, 108–114. [Google Scholar] [CrossRef]
- Jiang, Y.; Deng, T.; Shang, Y.; Yang, K.; Wang, H. Biodegradation of Phenol by Entrapped Cell of Debaryomyces sp. with Nano-Fe3O4 under Hypersaline Conditions. Int. Biodeterior. Biodegrad. 2017, 123, 37–45. [Google Scholar] [CrossRef]
- Mishra, V.K.; Kumar, N. Microbial Degradation of Phenol: A Review. J. Water Pollut. Purif. Res. 2017, 4, 17–22. [Google Scholar]
- Li, H.; Meng, F.; Duan, W.; Lin, Y.; Zheng, Y. Biodegradation of Phenol in Saline or Hypersaline Environments by Bacteria: A Review. Ecotoxicol. Environ. Saf. 2019, 184, 109658. [Google Scholar] [CrossRef] [PubMed]
- Kamali, M.; Gameiro, T.; Costa, M.E.; Capela, I.; Aminabhavi, T.M. Enhanced Biodegradation of Phenolic Wastewaters with Acclimatized Activated Sludge—A Kinetic Study. Chem. Eng. J. 2019, 378, 122186. [Google Scholar] [CrossRef]
- Larsson, S.; Reimann, A.; Nilvebrant, N.-O.; Jönsson, L.J. Comparison of Different Methods for the Detoxification of Lignocellulose Hydrolyzates of Spruce. Appl. Biochem. Biotechnol. 1999, 77, 91–104. [Google Scholar] [CrossRef]
- Cordero, O. Tratamiento de Los Residuos Del Café. Método: Precipitación Química y Sedimentación Acelerada. In Proceedings of the IV Congreso de Ingenieros de los Comités de Cafeteros, Neiva, Colombia, May 1977. [Google Scholar]
- Lardé, G. Efecto Coagulante Del Hidróxido Cálcico En Aguas Residuales Del Café. In Proceedings of the Fundación Salvadoreña para Investigaciones del Café Procafé & Instituto Interamericano de Cooperación para la Agricultura IICA, XVII Simposio de Caficultura Latinoamericana, Sal Salvador, El Salvador, 23–27 October 1995. [Google Scholar]
- Sevillano Galindos, R.L. Eficiencia Del Hidróxido de Calcio En El Tratamiento de Las Aguas Ácidas de Una Relavera de Pasco, a Nivel Laboratorio; Universidad César Vallejo: Trujillo, Peru, 2017. [Google Scholar]
- Vanerkar, A.P.; Singh, S.; Shanta, S. Treatment of Food Processing Industry Wastewater by a Coagulation/Flocculation Process. Int. J. Chem. Phys. Sci. 2013, 2, 63–72. [Google Scholar]
- Hannig, C.; Follo, M.; Hellwig, E.; Al-Ahmad, A. Visualization of Adherent Micro-Organisms Using Different Techniques. J. Med. Microbiol. 2010, 59, 1–7. [Google Scholar] [CrossRef]
- Rodicio, M.D.R.; Mendoza, M.D.C. Identificación Bacteriana Mediante Secuenciación Del ARNr 16S: Fundamento, Metodología y Aplicaciones En Microbiología Clínica. Enferm. Infecc. Microbiol. Clin. 2004, 22, 238–245. [Google Scholar] [CrossRef]
- Janda, J.M.; Abbott, S.L. 16S RRNA Gene Sequencing for Bacterial Identification in the Diagnostic Laboratory: Pluses, Perils, and Pitfalls. J. Clin. Microbiol. 2007, 45, 2761–2764. [Google Scholar] [CrossRef] [Green Version]
- Petrosino, J.F.; Highlander, S.; Luna, R.A.; Gibbs, R.A.; Versalovic, J. Metagenomic Pyrosequencing and Microbial Identification. Clin. Chem. 2009, 55, 856–866. [Google Scholar] [CrossRef] [Green Version]
- Economía, S.D. Análisis de Agua—Determinación de Fenoles Totales en Aguas Naturales, Potables, Residuales y Residuales Tratadas—Método de Prueba. 2001. Available online: https://www.gob.mx/cms/uploads/attachment/file/166783/NMX-AA-050-SCFI-2001.pdf (accessed on 5 October 2022).
- Bailey, J.E.; Ollis, D.F. Biochemical Engineering Fundamentals; McGraw Hill: New York, NY, USA, 1980; ISBN 978-0070032125. [Google Scholar]
- Gaden, E.L. Fermentation Process Kinetics. J. Biochem. Microbiol. Technol. Eng. 1959, 1, 413–429. [Google Scholar] [CrossRef] [Green Version]
- Manzano Quiñones, M.A.; Perales Vargas-Machuca, J.A.; Sales Márquez, D.; Quiroga Alonso, J.M. Cinética de Biodegradación de Un Nonilfenol Polietoxilato En Agua de Río. Ing. Del Agua 1998, 5, 3. [Google Scholar] [CrossRef] [Green Version]
- Gupta, R.S. Origin of Diderm (Gram-Negative) Bacteria: Antibiotic Selection Pressure Rather than Endosymbiosis Likely Led to the Evolution of Bacterial Cells with Two Membranes. Antonie Van Leeuwenhoek 2011, 100, 171–182. [Google Scholar] [CrossRef] [PubMed]
- Ajao, A.; Awe, S. Bioremediation of Wastewaters from Local Textile Industries. Nat. Appl. Sci. J. 2018, 1, 16–25. [Google Scholar] [CrossRef] [Green Version]
- Ariza, Y.; Sánchez, L. Determinación de Metabolitos Secundarios a Partir de Bacillus Subtilis Con Efecto Biocontrolador Sobre Fusarium sp. Nova 2012, 10, 149–155. [Google Scholar] [CrossRef]
- Gardener, B.B.M. Ecology of Bacillus and Paenibacillus spp. in Agricultural Systems. Phytopathology 2004, 94, 1252–1258. [Google Scholar] [CrossRef] [Green Version]
- Sáez-Nieto, J.A.; Medina-Pascual, M.J.; Carrasco, G.; Garrido, N.; Fernandez-Torres, M.A.; Villalón, P.; Valdezate, S. Paenibacillus spp. Isolated from Human and Environmental Samples in Spain: Detection of 11 New Species. New Microbes New Infect. 2017, 19, 19–27. [Google Scholar] [CrossRef]
- Vrdoljak, G.; Feil, W.S.; Feil, H.; Detter, J.C.; Fields, P. Characterization of a Diesel Sludge Microbial Consortia for Bioremediation. Scanning 2006, 27, 8–14. [Google Scholar] [CrossRef]
- Schwartz, A.; Ortiz, I.; Maymon, M.; Herbold, C.; Fujishige, N.; Vijanderan, J.; Villella, W.; Hanamoto, K.; Diener, A.; Sanders, E.; et al. Bacillus Simplex—A Little Known PGPB with Anti-Fungal Activity—Alters Pea Legume Root Architecture and Nodule Morphology When Coinoculated with Rhizobium Leguminosarum Bv. Viciae. Agronomy 2013, 3, 595–620. [Google Scholar] [CrossRef] [Green Version]
- Djokic, L.; Narancic, T.; Nikodinovic-Runic, J.; Bajkic, S.; Vasiljevic, B. Four Bacillus sp. Soil Isolates Capable of Degrading Phenol, Toluene, Biphenyl, Naphthalene and Other Aromatic Compounds Exhibit Different Aromatic Catabolic Potentials. Arch. Biol. Sci. 2011, 63, 1057–1067. [Google Scholar] [CrossRef]
- Dash, H.R.; Mangwani, N.; Chakraborty, J.; Kumari, S.; Das, S. Marine Bacteria: Potential Candidates for Enhanced Bioremediation. Appl. Microbiol. Biotechnol. 2013, 97, 561–571. [Google Scholar] [CrossRef]
- Dixon, B. Cheese, Toes, and Mosquitoes. BMJ 1996, 312, 1105. [Google Scholar] [CrossRef]
- Jariyal, M.; Gupta, V.K.; Mandal, K.; Jindal, V. Brevibacterium Frigoritolerans as a Novel Organism for the Bioremediation of Phorate. Bull. Environ. Contam. Toxicol. 2015, 95, 680–686. [Google Scholar] [CrossRef] [PubMed]
- Greenblatt, C.L.; Baum, J.; Klein, B.Y.; Nachshon, S.; Koltunov, V.; Cano, R.J. Micrococcus Luteus—Survival in Amber. Microb. Ecol. 2004, 48, 120–127. [Google Scholar] [CrossRef] [PubMed]
- Doddamani, H.P.; Ninnekar, H.Z. Biodegradation of Carbaryl by a Micrococcus Species. Curr. Microbiol. 2001, 43, 69–73. [Google Scholar] [CrossRef] [PubMed]
- Mohite, B.V.; Pawar, S.P.; Morankar, A. Isolation, Selection and Biodegradation Profile of Phenol Degrading Bacteria from Oil Contaminated Soil. Bull. Environ. Contam. Toxicol. 2011, 87, 143–146. [Google Scholar] [CrossRef] [PubMed]
- Wasi, S.; Tabrez, S.; Ahmad, M. Use of Pseudomonas spp. for the Bioremediation of Environmental Pollutants: A Review. Environ. Monit. Assess. 2013, 185, 8147–8155. [Google Scholar] [CrossRef] [PubMed]
- Reyes-Ramírez, A.; López-Arcos, M.; Ruiz-Sánchez, E.; Latournerie-Moreno, L.; Pérez-Gutiérrez, A.; Lozano-Contreras, M.G.; Zavala-León, M.J. Effectiveness of microbial inoculants on growth and productivity of habanero pepper (Capsicum chinense Jacq.). Agociencia 2014, 48, 285–294. [Google Scholar]
- Kämpfer, P.; Rosselló-Mora, R.; Scholz, H.C.; Welinder-Olsson, C.; Falsen, E.; Busse, H.-J. Description of Pseudochrobactrum Gen. Nov., with the Two Species Pseudochrobactrum Asaccharolyticum Sp. Nov. and Pseudochrobactrum Saccharolyticum sp. Nov. Int. J. Syst. Evol. Microbiol. 2006, 56, 1823–1829. [Google Scholar] [CrossRef] [Green Version]
- Long, D. Cr(VI) Resistance and Removal by Indigenous Bacteria Isolated from Chromium-Contaminated Soil. J. Microbiol. Biotechnol. 2013, 23, 1123–1132. [Google Scholar] [CrossRef] [Green Version]
- del Castillo, I.; Hernández, P.; Lafuente, A.; Rodríguez-Llorente, I.D.; Caviedes, M.A.; Pajuelo, E. Self-Bioremediation of Cork-Processing Wastewaters by (Chloro)Phenol-Degrading Bacteria Immobilised onto Residual Cork Particles. Water Res. 2012, 46, 1723–1734. [Google Scholar] [CrossRef]
- Bar-Niv, N.; Azaizeh, H.; Kuc, M.E.; Azerrad, S.; Haj-Zaroubi, M.; Menashe, O.; Kurzbaum, E. Advanced Oxidation Process UV-H2O2 Combined with Biological Treatment for the Removal and Detoxification of Phenol. J. Water Process. Eng. 2022, 48, 102923. [Google Scholar] [CrossRef]
- Ke, Q.; Zhang, Y.; Wu, X.; Su, X.; Wang, Y.; Lin, H.; Mei, R.; Zhang, Y.; Hashmi, M.Z.; Chen, C.; et al. Sustainable Biodegradation of Phenol by Immobilized Bacillus sp. SAS19 with Porous Carbonaceous Gels as Carriers. J. Environ. Manag. 2018, 222, 185–189. [Google Scholar] [CrossRef] [PubMed]
- Collins, G.; Foy, C.; McHugh, S.; Mahony, T.; O’Flaherty, V. Anaerobic Biological Treatment of Phenolic Wastewater at 15–18 °C. Water Res. 2005, 39, 1614–1620. [Google Scholar] [CrossRef] [PubMed]
- Sivasubramanian, S.; Namasivayam, S.K.R. Phenol Degradation Studies Using Microbial Consortium Isolated from Environmental Sources. J. Environ. Chem. Eng. 2015, 3, 243–252. [Google Scholar] [CrossRef]
- Eiroa, M.; Vilar, A.; Kennes, C.; Veiga, M.C. Effect of Phenol on the Biological Treatment of Wastewaters from a Resin Producing Industry. Bioresour. Technol. 2008, 99, 3507–3512. [Google Scholar] [CrossRef] [Green Version]
- Morones Esquivel, M.M.; Pantoja Espinoza, J.C.; Proal Nájera, J.B.; Cháirez Hernández, I.; Gurrola Reyes, J.N.; Ávila Santos, M. Uso de un reactor de placa plana (tio2/vidrio) para la degradación de 2,5-diclorofenol por fotocatálisis solar. Rev. Int. Contam. Ambient. 2017, 33, 605–616. [Google Scholar] [CrossRef]
- Bai, N.; Wang, S.; Sun, P.; Abuduaini, R.; Zhu, X.; Zhao, Y. Degradation of Nonylphenol Polyethoxylates by Functionalized Fe3O4 Nanoparticle-Immobilized Sphingomonas sp. Y2. Sci. Total Environ. 2018, 615, 462–468. [Google Scholar] [CrossRef]
- Lin, C.; Gan, L.; Chen, Z.; Megharaj, M.; Naidu, R. Biodegradation of Naphthalene Using a Functional Biomaterial Based on Immobilized Bacillus Fusiformis (BFN). Biochem. Eng. J. 2014, 90, 1–7. [Google Scholar] [CrossRef]
- Yoong, E.T.; Lant, P.A. Biodegradation of High Strength Phenolic Wastewater Using SBR. Water Sci. Technol. 2001, 43, 299–306. [Google Scholar] [CrossRef]
- Tziotzios, G.; Michailakis, S.; Vayenas, D.V. Aerobic Biological Treatment of Olive Mill Wastewater by Olive Pulp Bacteria. Int. Biodeterior. Biodegrad. 2007, 60, 209–214. [Google Scholar] [CrossRef]
- Garrido, J.M.; Méndez, R.; Lema, J.M. Treatment of Wastewaters from a Formaldehyde-Urea Adhesives Factory. Water Sci. Technol. 2000, 42, 293–300. [Google Scholar] [CrossRef]
- Hussain, A.; Dubey, S.K.; Kumar, V. Kinetic Study for Aerobic Treatment of Phenolic Wastewater. Water Resour. Ind. 2015, 11, 81–90. [Google Scholar] [CrossRef] [Green Version]
- Perales, J.A.; Manzano, M.A.; Garrido, M.C.; Sales, D.; Quiroga, J.M. Biodegradation Kinetics of Linear Alkylbenzene Sulphonates in Sea Water. Biodegradation 2006, 18, 63–70. [Google Scholar] [CrossRef] [PubMed]
- Ren, L.-F.; Chen, R.; Zhang, X.; Shao, J.; He, Y. Phenol Biodegradation and Microbial Community Dynamics in Extractive Membrane Bioreactor (EMBR) for Phenol-Laden Saline Wastewater. Bioresour. Technol. 2017, 244, 1121–1128. [Google Scholar] [CrossRef]
- Martinez Nieto, L.; Garrido Hoyos, S.E.; Camacho Rubio, F.; Garcia Pareja, M.P.; Ramos Cormenzana, A. The Biological Purification of Waste Products from Olive Oil Extraction. Bioresour. Technol. 1993, 43, 215–219. [Google Scholar] [CrossRef]
- Cajigas, A.; Pérez, A.; Torres, P. Importancia del ph y la alcalinidad en el tratamiento anaerobio de las aguas residuales del proceso de extracción de almidón de yuca. Sci. Techol. 2005, 11, 243–248. [Google Scholar]
- Awodiji, C.T.G.; Nwachukwu, A.N.; Onyechere, C.I.; Iyidiobi, R.G.; Nwabueze, B.J. The Effectiveness of Hydrated Lime as a Flocculing Agent in Water Treatment. Saudi J. Civ. Eng. 2020, 4, 30–37. [Google Scholar] [CrossRef]
- Romero, L.I. Development of a General Mathematical Model for Fermentation Processes: Kinetics of Anaerobic Biodegradation; Universidad de Cádiz: Andalusia, Spain, 1991. [Google Scholar]
- Lin, J.; Gan, L.; Chen, Z.; Naidu, R. Biodegradation of Tetradecane Using Acinetobacter Venetianus Immobilized on Bagasse. Biochem. Eng. J. 2015, 100, 76–82. [Google Scholar] [CrossRef]
- Lin, Q.; Donghui, W.; Jianlong, W. Biodegradation of Pyridine by Paracoccus sp. KT-5 Immobilized on Bamboo-Based Activated Carbon. Bioresour. Technol. 2010, 101, 5229–5234. [Google Scholar] [CrossRef]


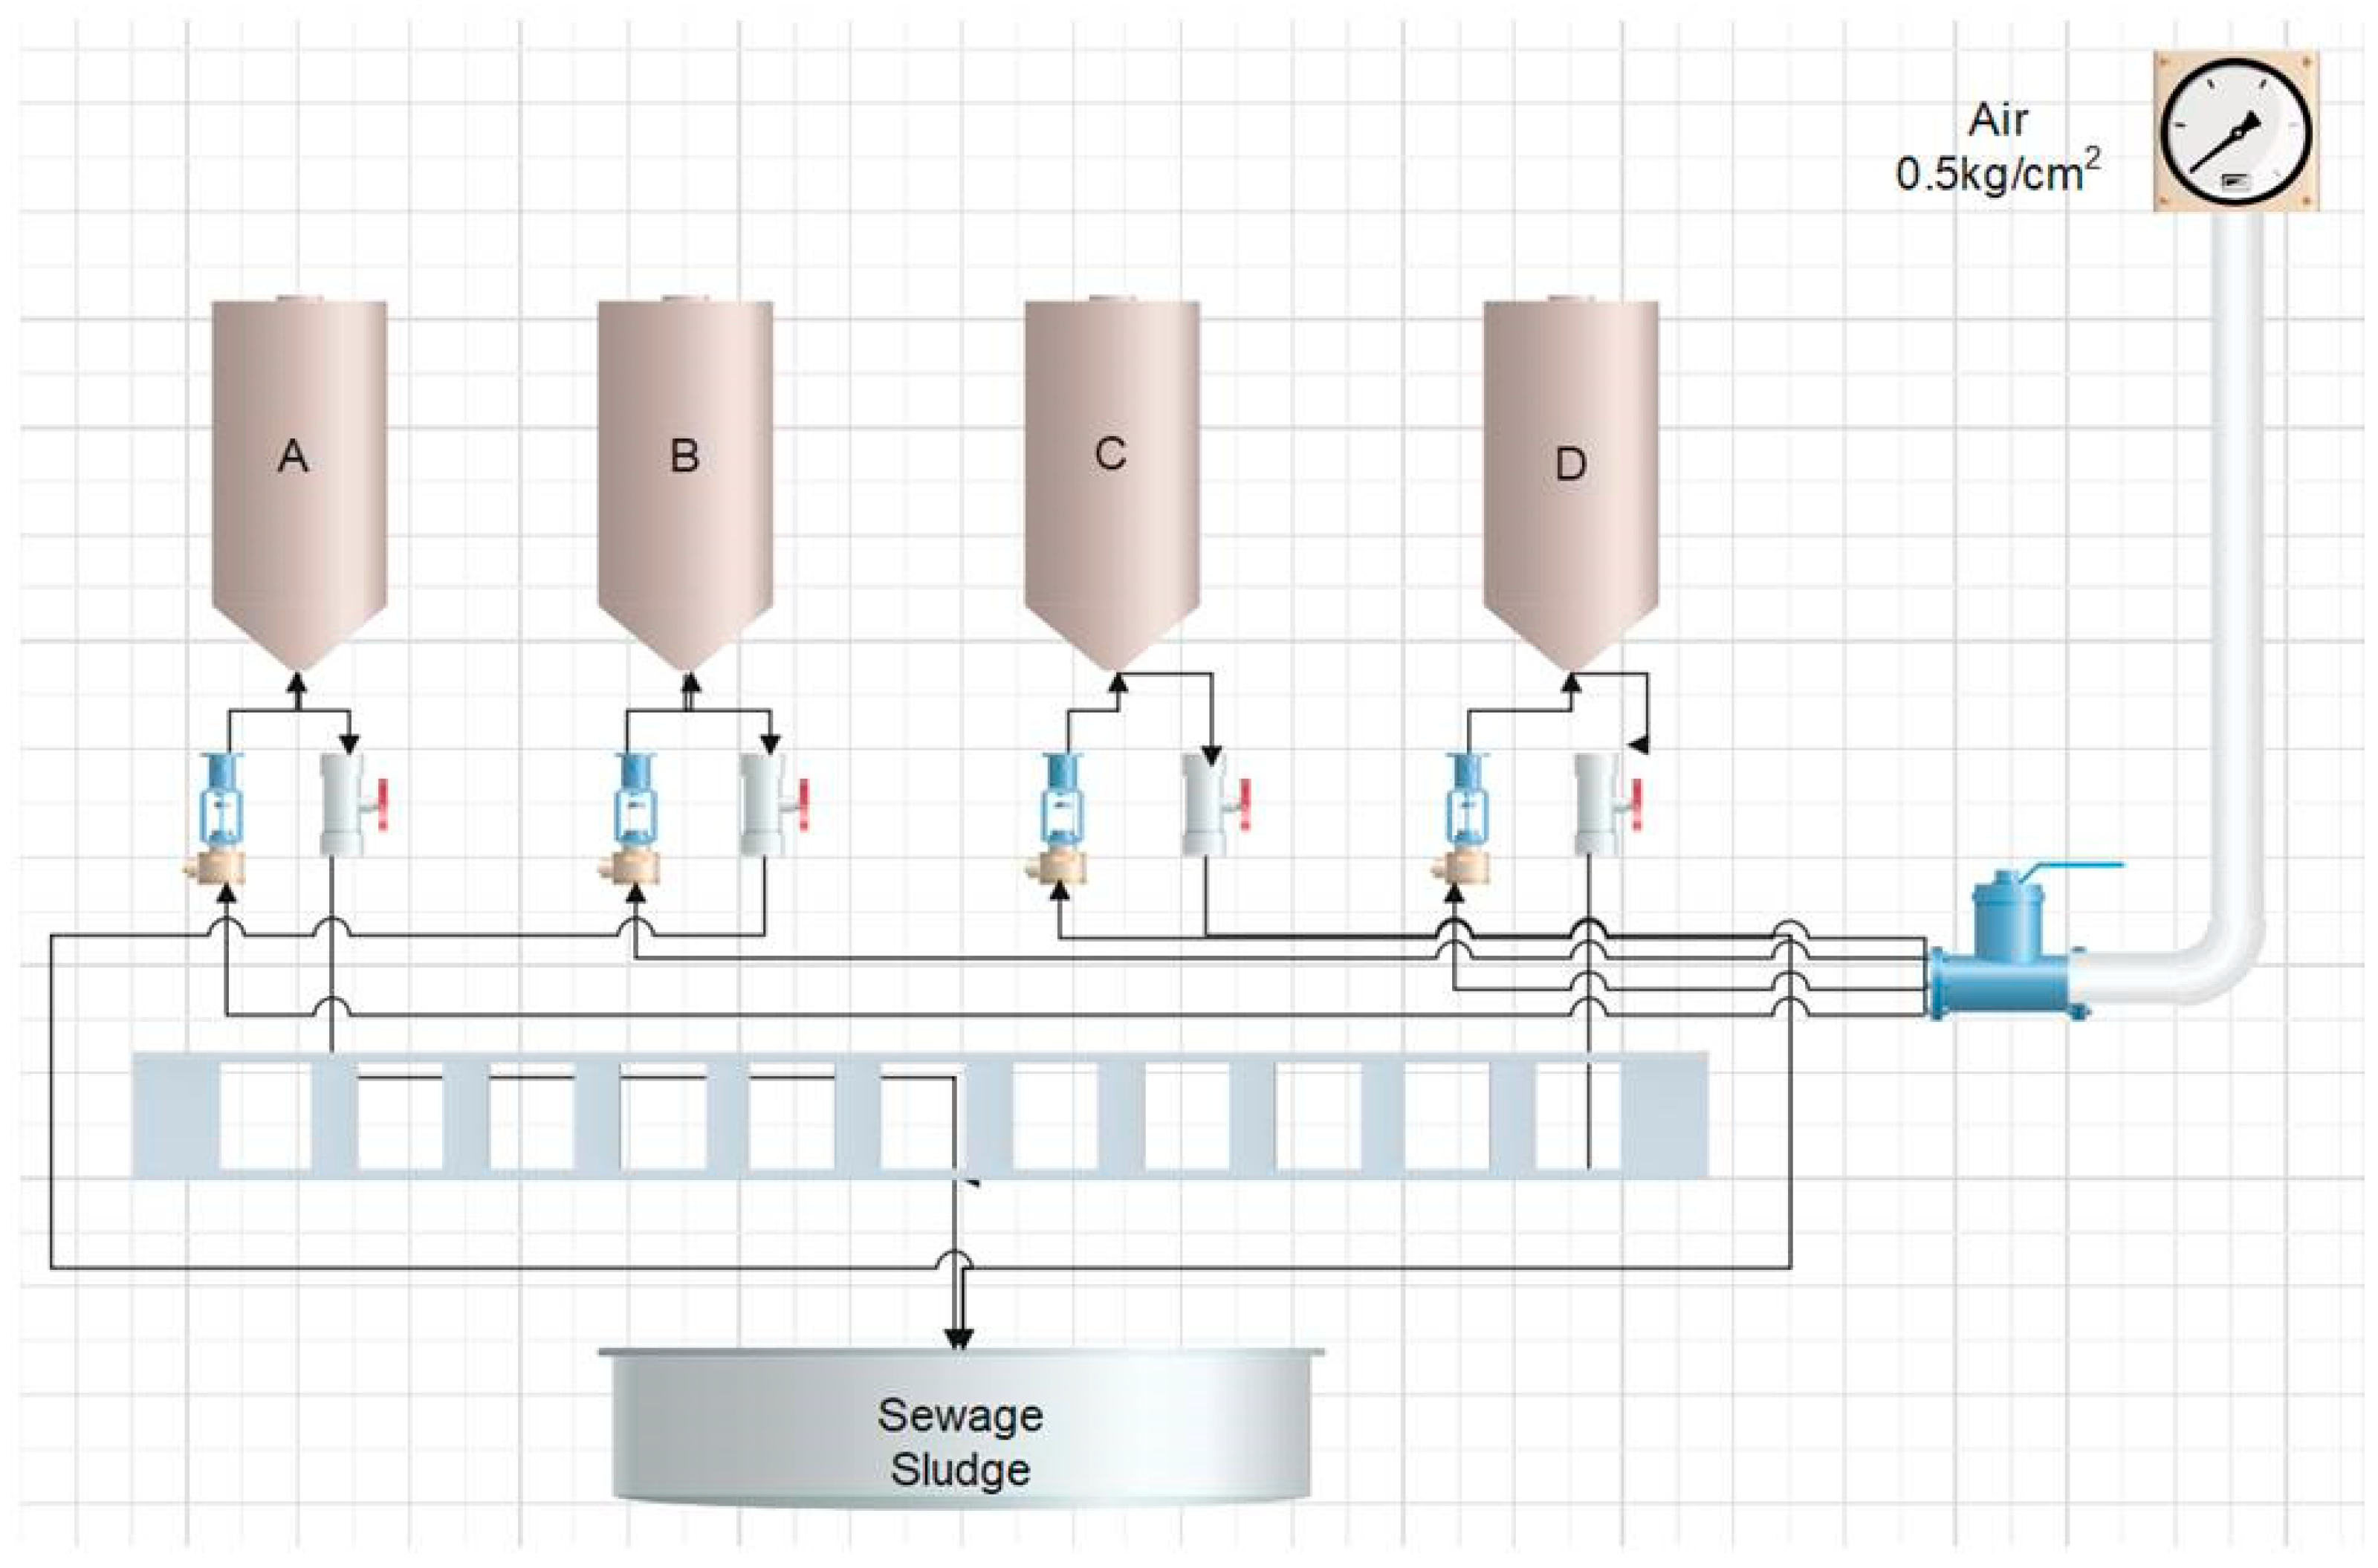
| Treatments | Reactor A | Reactor B | Reactor C | Reactor D |
|---|---|---|---|---|
| Mixture | 50% agarose and 50% industrial wastewater | |||
| Volume (L) | 15 | 15 | 15 | 15 |
| Lime (0.8% w/v) | Inoculum | Lime (0.8% w/v) | ||
| Air | Air (0.5 kg/cm2) | Air (0.5 kg/cm2) | Air (0.5 kg/cm2) | No air |
| 8 days | 13 days | 1 day | ||
| Filtration | Filtration | Filtration | ||
| Inoculum | Lime (0.8% w/v) | Inoculum | ||
| Air | 1 day | Air | ||
| 6 days | Filtration | 13 days | ||
| Time | 14 days | 14 days | 14 days | 14 days (360 h) |
| Site | COD (mg/L) | Phenol (mg/L) | Conductivity (mS/cm) | pH | Identification | Phyla |
|---|---|---|---|---|---|---|
| Surface retention Pit | 31,940 ± 342 | 922 ± 6.1 | 2.76 ± 0.4 | 9.2 ± 0.1 | B. subtillis | Firmicutes |
| Pseudomonas sp. | Gammaproteobacteria | |||||
| Micrococcus sp. | Actinobacteria | |||||
| Brevibacterium frigoritolerans | Actinobacteria | |||||
| Bacillus simplex | Firmicutes | |||||
| Citrobacter freundii | Gammaproteobacteria | |||||
| Paenibacillus lautus | Firmicutes | |||||
| Filter input | 5730 ± 142 | 142.3 ± 1.4 | 2.25 ± 0.1 | 4.7 ± 0.1 | Bacillus safensis | Firmicutes |
| Filter output | 1680 ± 15.3 | 66.3 ± 16.8 | 2.62 ± 0.05 | 7.7 ± 0.1 | Bacillus simplex | Firmicutes |
| Pseudochrobactrum asaccharolyticum | Alphaproteobacteria | |||||
| Bacillus pumilus | Firmicutes | |||||
| Acinetobacter junii | Betaproteobacteria | |||||
| B. thuringiensis | Firmicutes | |||||
| Industrial Trench | 1613 ± 57.8 | 15 ± 2.9 | 0.90 ± 0.01 | 7.7 ± 0.1 | B. pumilus | Firmicutes |
| Bacillus sp. | Firmicutes |
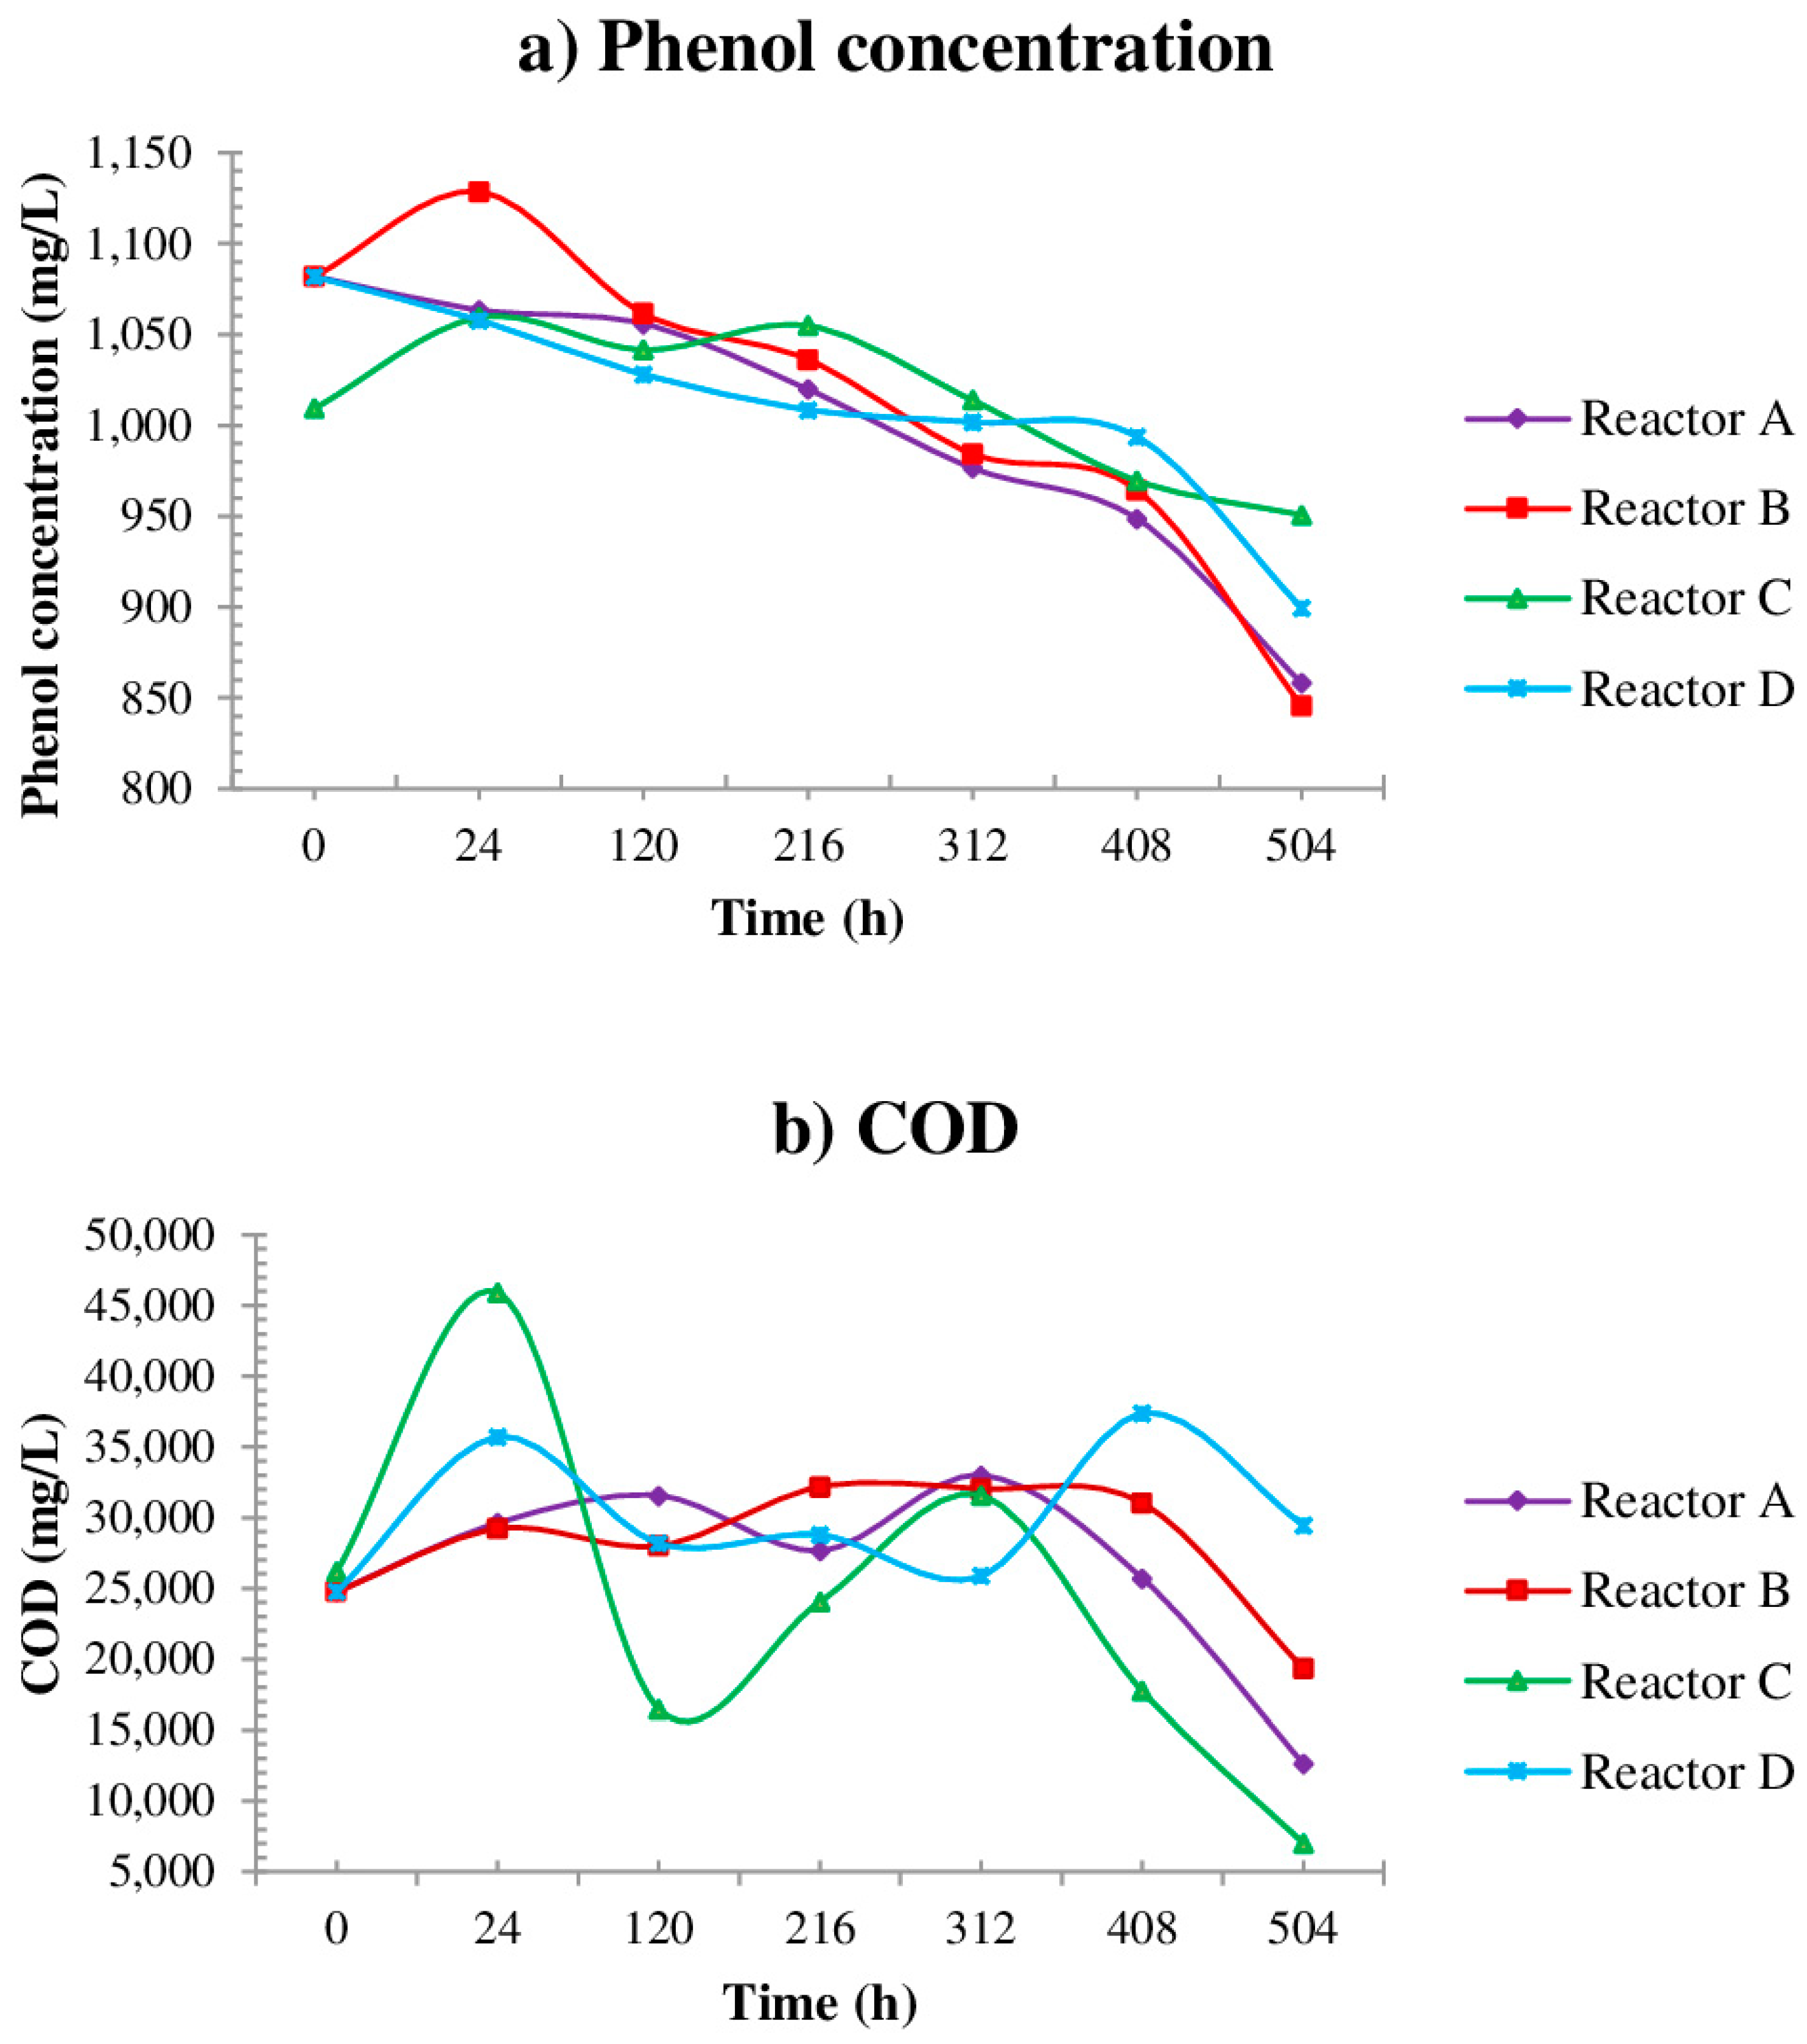
| [Phenol]i mg/L | [Phenol]f mg/L | % Ph | CODi mg/L | CODf mg/L | % COD | pH | EC mS/cm | T °C | |
|---|---|---|---|---|---|---|---|---|---|
| Reactor A | 1081.7 | 858.3 | 20.6 a | 24,750 | 12,611.1 | 49.0 a | 8.1 | 3.4 | 22.5 |
| Reactor B | 1081.7 | 845.5 | 21.8 a | 24,750 | 19,322.2 | 21.9 b | 8.3 | 3.1 | 20.0 |
| Reactor C | 1009.3 | 950.7 | 5.8 a | 26,167 | 6988.8 | 73.3 c | 10.5 | 6.3 | 20.5 |
| Reactor D | 1081.7 | 899.3 | 16.8 a | 24,750 | 29,455.5 | −19.0 d,* | 8.0 | 2.4 | 21.7 |
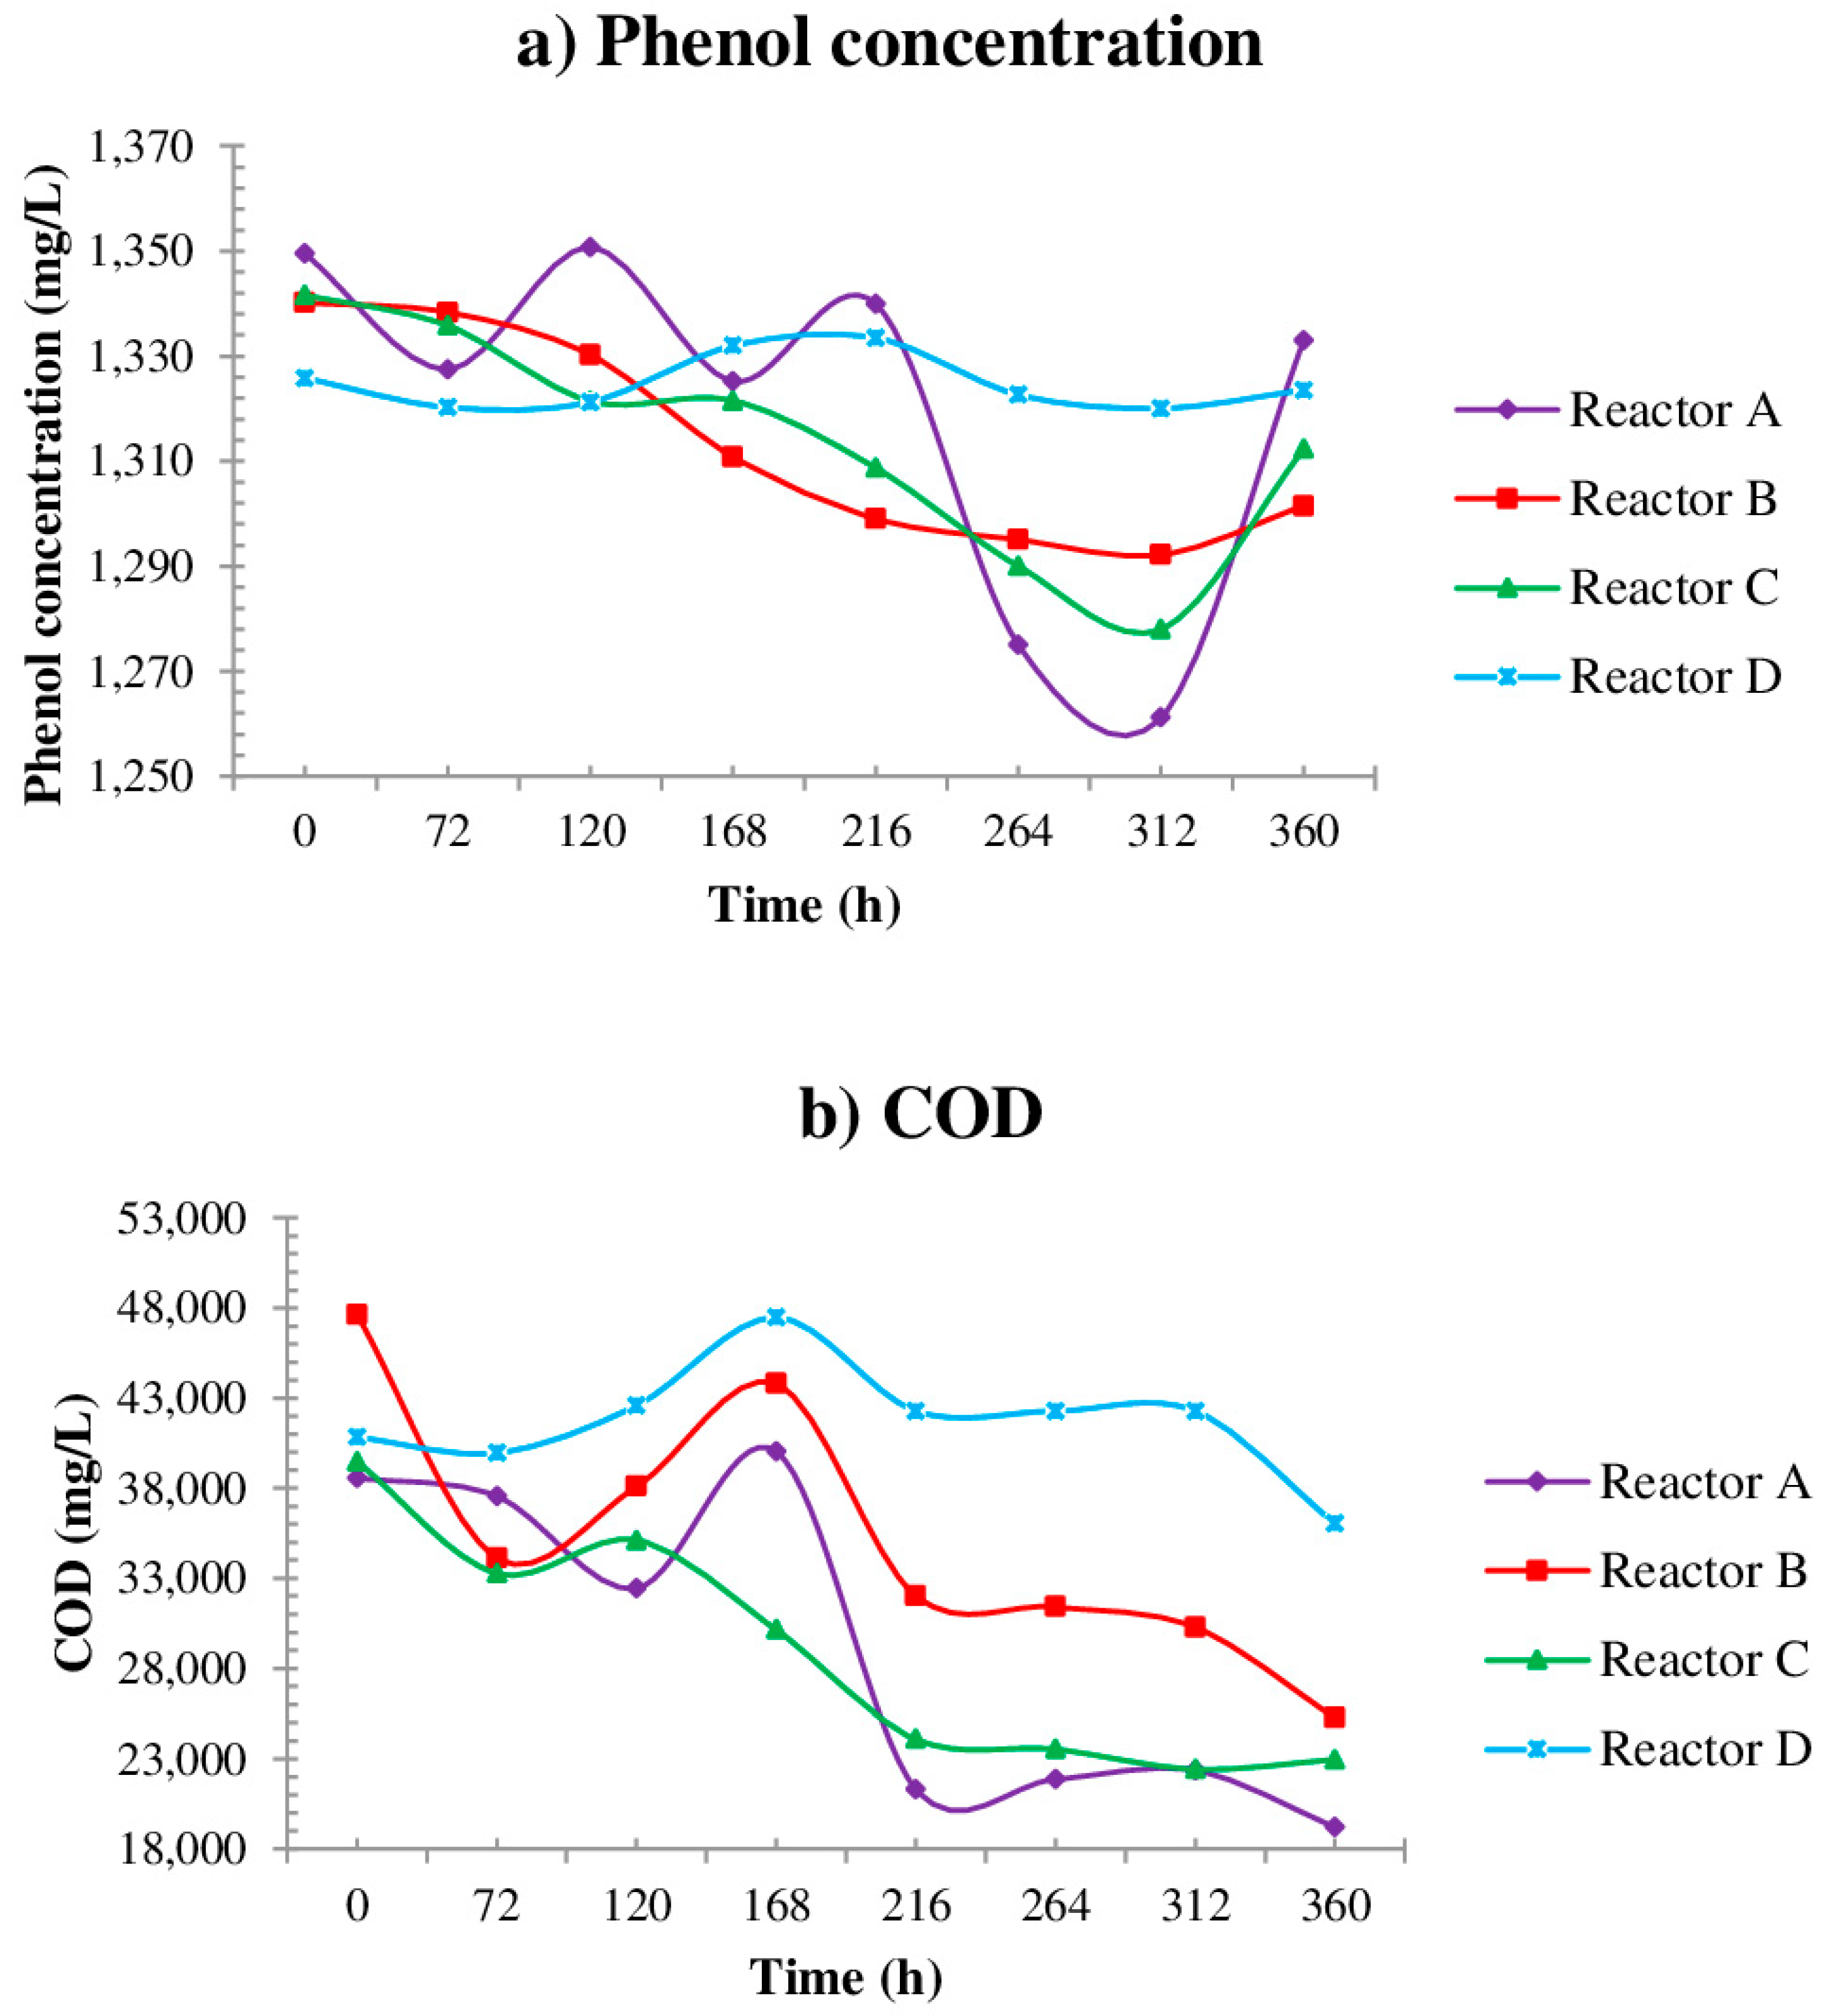
| [Phenol]i mg/L | [Phenol]f mg/L | % Ph | CODi mg/L | CODf mg/L | % COD | pH | EC mS/cm | T °C | |
|---|---|---|---|---|---|---|---|---|---|
| Reactor A | 1349.5 | 1333.0 | 1.2 a | 38,567 | 19,211.1 | 50.2 a | 10.07 | 6.60 | 25.0 |
| Reactor B | 1340.0 | 1301.0 | 2.9 b | 47,633.3 | 25,266.6 | 47.0 b | 9.06 | 2.84 | 24.7 |
| Reactor C | 1341.6 | 1312.3 | 2.2 c | 39,466.6 | 22,966.6 | 41.8 c | 9.07 | 4.68 | 24.5 |
| Reactor D | 1325.8 | 1323.5 | 0.2 d | 40,816.6 | 36,033.3 | 11.7 d | 8.66 | 2.18 | 24.5 |
| Parameters | p h−1 | h mg/L | q mg/L | S0-q mg/L | K0 | K1 | K2 | R |
|---|---|---|---|---|---|---|---|---|
| Reactor A | 0.004 | 1129.36 | 223.4 | 858 | −1.113 | 0.006 | −4.42 × 10⁻⁶ | 0.94 |
| Reactor B | 0.006 | 1098.09 | 236.2 | 846 | −1.805 | 0.009 | −6.96 × 10⁻⁶ | 0.90 |
| Reactor C | 0.002 | 1151.00 | 58.6 | 951 | −0.123 | 0.002 | −1.83 × 10⁻⁶ | 0.97 |
| Reactor D | 0.002 | 1249.51 | 182.4 | 899 | −0.427 | 0.003 | −1.87 × 10⁻⁶ | 0.97 |
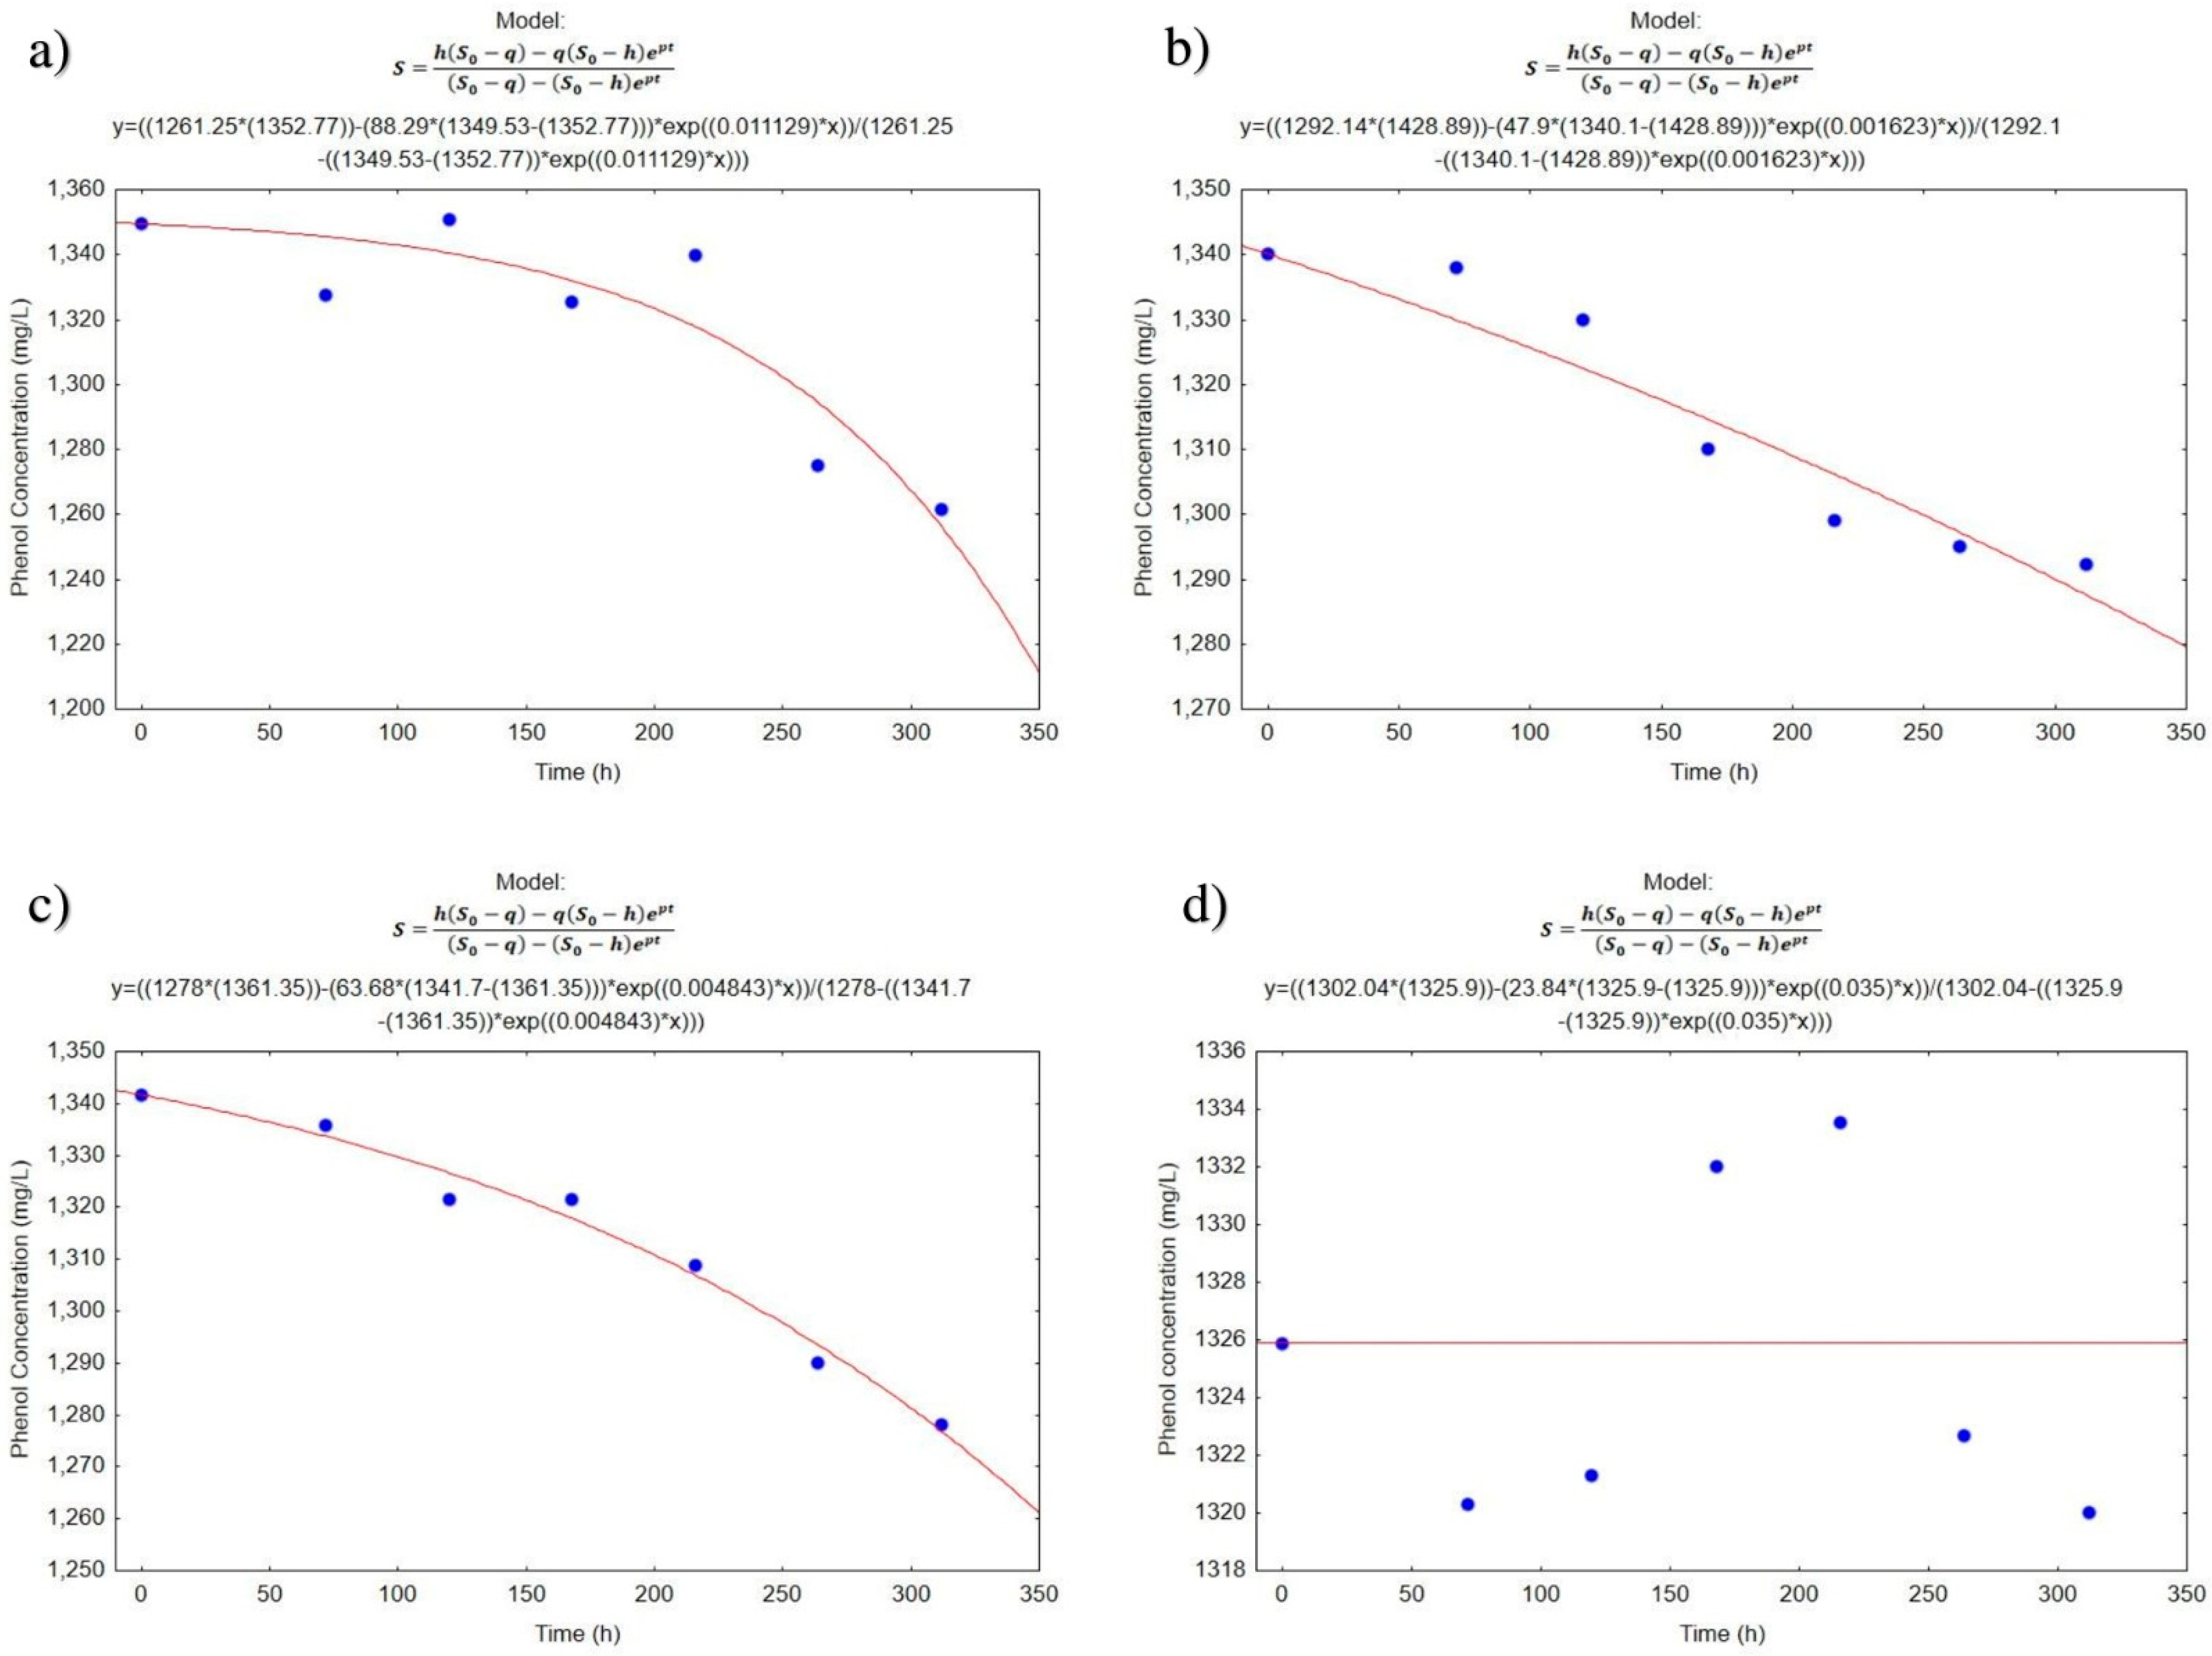
| Parameters | p h−1 | h mg/L | q mg/L | S0-q mg/L | K0 | K1 | K2 | R |
|---|---|---|---|---|---|---|---|---|
| Reactor A | 0.011 | 1352.76 | 88.29 | 1261 | −1.0512 | 0.013 | −8.80 × 10⁻⁶ | 0.90 |
| Reactor B | 0.002 | 1428.80 | 47.98 | 1292 | −0.0805 | 0.002 | −1.18 × 10⁻⁶ | 0.95 |
| Reactor C | 0.005 | 1361.34 | 63.68 | 1278 | −0.3230 | 0.005 | −3.73 × 10⁻⁶ | 0.99 |
| Reactor D | 0.035 | 1325.90 | 23.84 | 1302 | −0.8400 | 0.036 | −2.66 × 10⁻⁵ | 0.40 |
Publisher’s Note: MDPI stays neutral with regard to jurisdictional claims in published maps and institutional affiliations. |
© 2022 by the authors. Licensee MDPI, Basel, Switzerland. This article is an open access article distributed under the terms and conditions of the Creative Commons Attribution (CC BY) license (https://creativecommons.org/licenses/by/4.0/).
Share and Cite
Morones-Esquivel, M.M.; Núñez-Núñez, C.M.; Hernández-Mendoza, J.L.; Proal-Nájera, J.B. Bacterial Communities in Effluents Rich in Phenol and Their Potential in Bioremediation: Kinetic Modeling. Int. J. Environ. Res. Public Health 2022, 19, 14222. https://doi.org/10.3390/ijerph192114222
Morones-Esquivel MM, Núñez-Núñez CM, Hernández-Mendoza JL, Proal-Nájera JB. Bacterial Communities in Effluents Rich in Phenol and Their Potential in Bioremediation: Kinetic Modeling. International Journal of Environmental Research and Public Health. 2022; 19(21):14222. https://doi.org/10.3390/ijerph192114222
Chicago/Turabian StyleMorones-Esquivel, Miriam M., Cynthia M. Núñez-Núñez, José L. Hernández-Mendoza, and José B. Proal-Nájera. 2022. "Bacterial Communities in Effluents Rich in Phenol and Their Potential in Bioremediation: Kinetic Modeling" International Journal of Environmental Research and Public Health 19, no. 21: 14222. https://doi.org/10.3390/ijerph192114222