
Comparative Analysis of Electric Field Strength, Magnetic Field Strength and Power Density around the Cell Phone Towers of Varying Characteristics with a Proposed Classification Facilitating Research on Human Population
 , ,
, ,  ,
,  and
and 
Abstract
:
1. Introduction
2. Materials and Methods
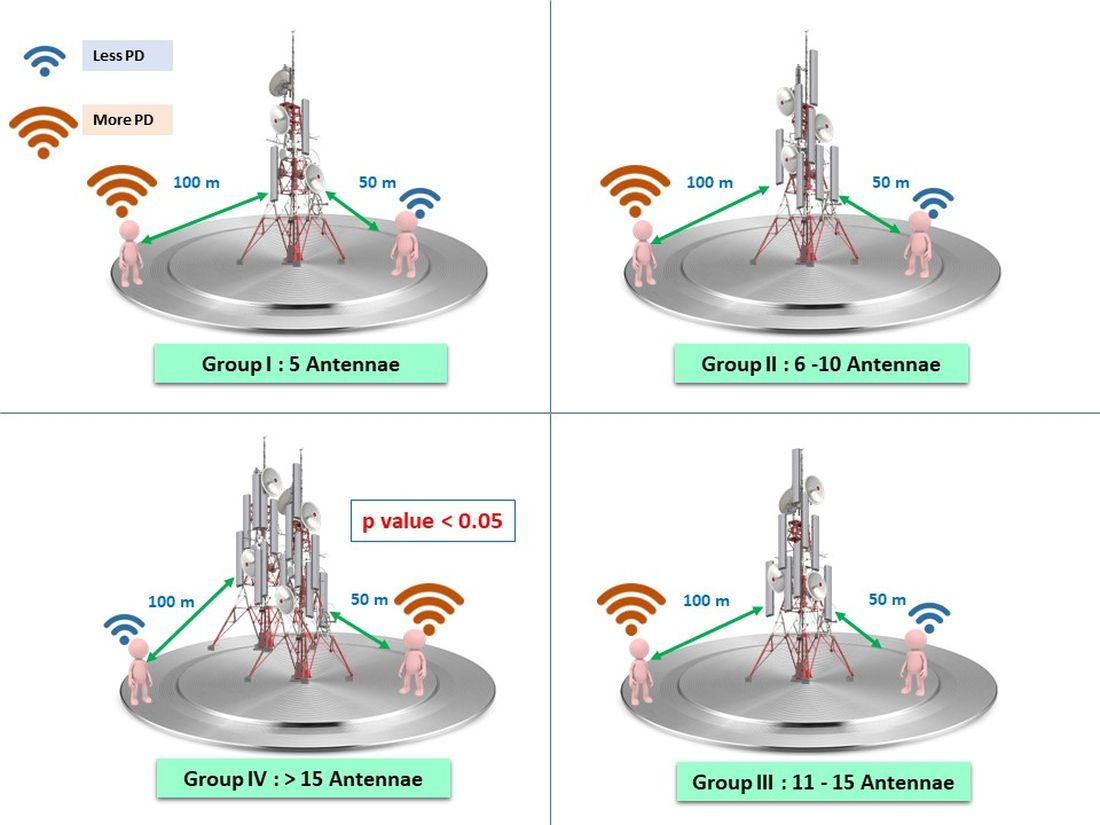
2.1. Study Characteristics
2.2. Sample Characteristics
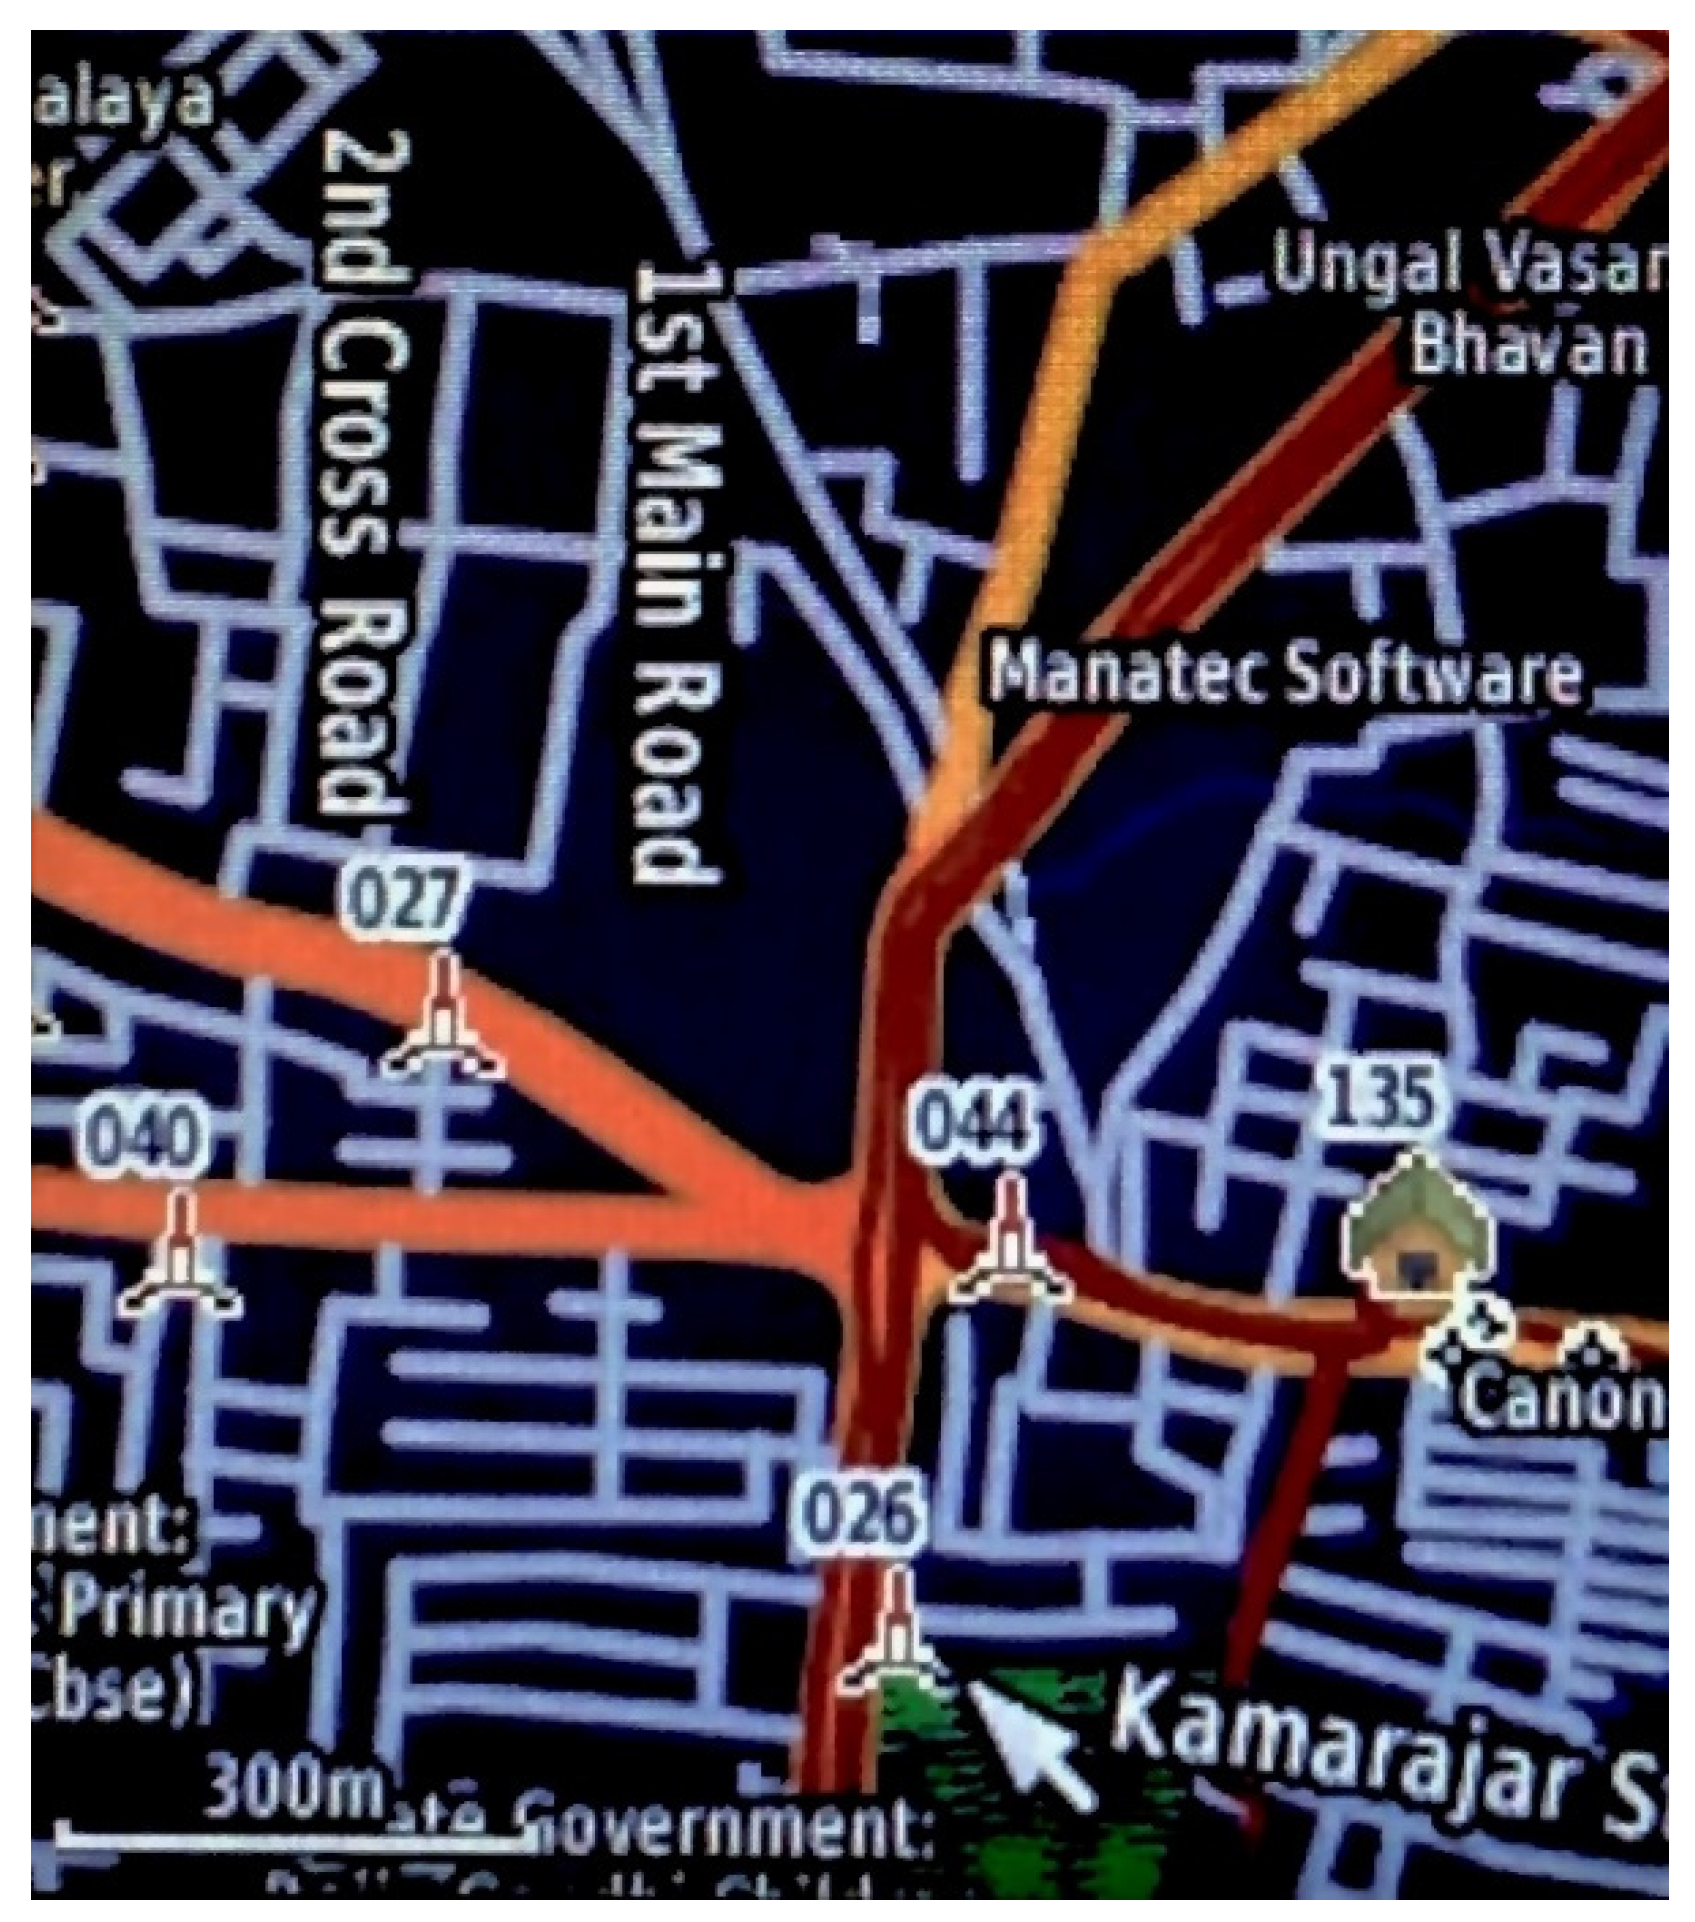
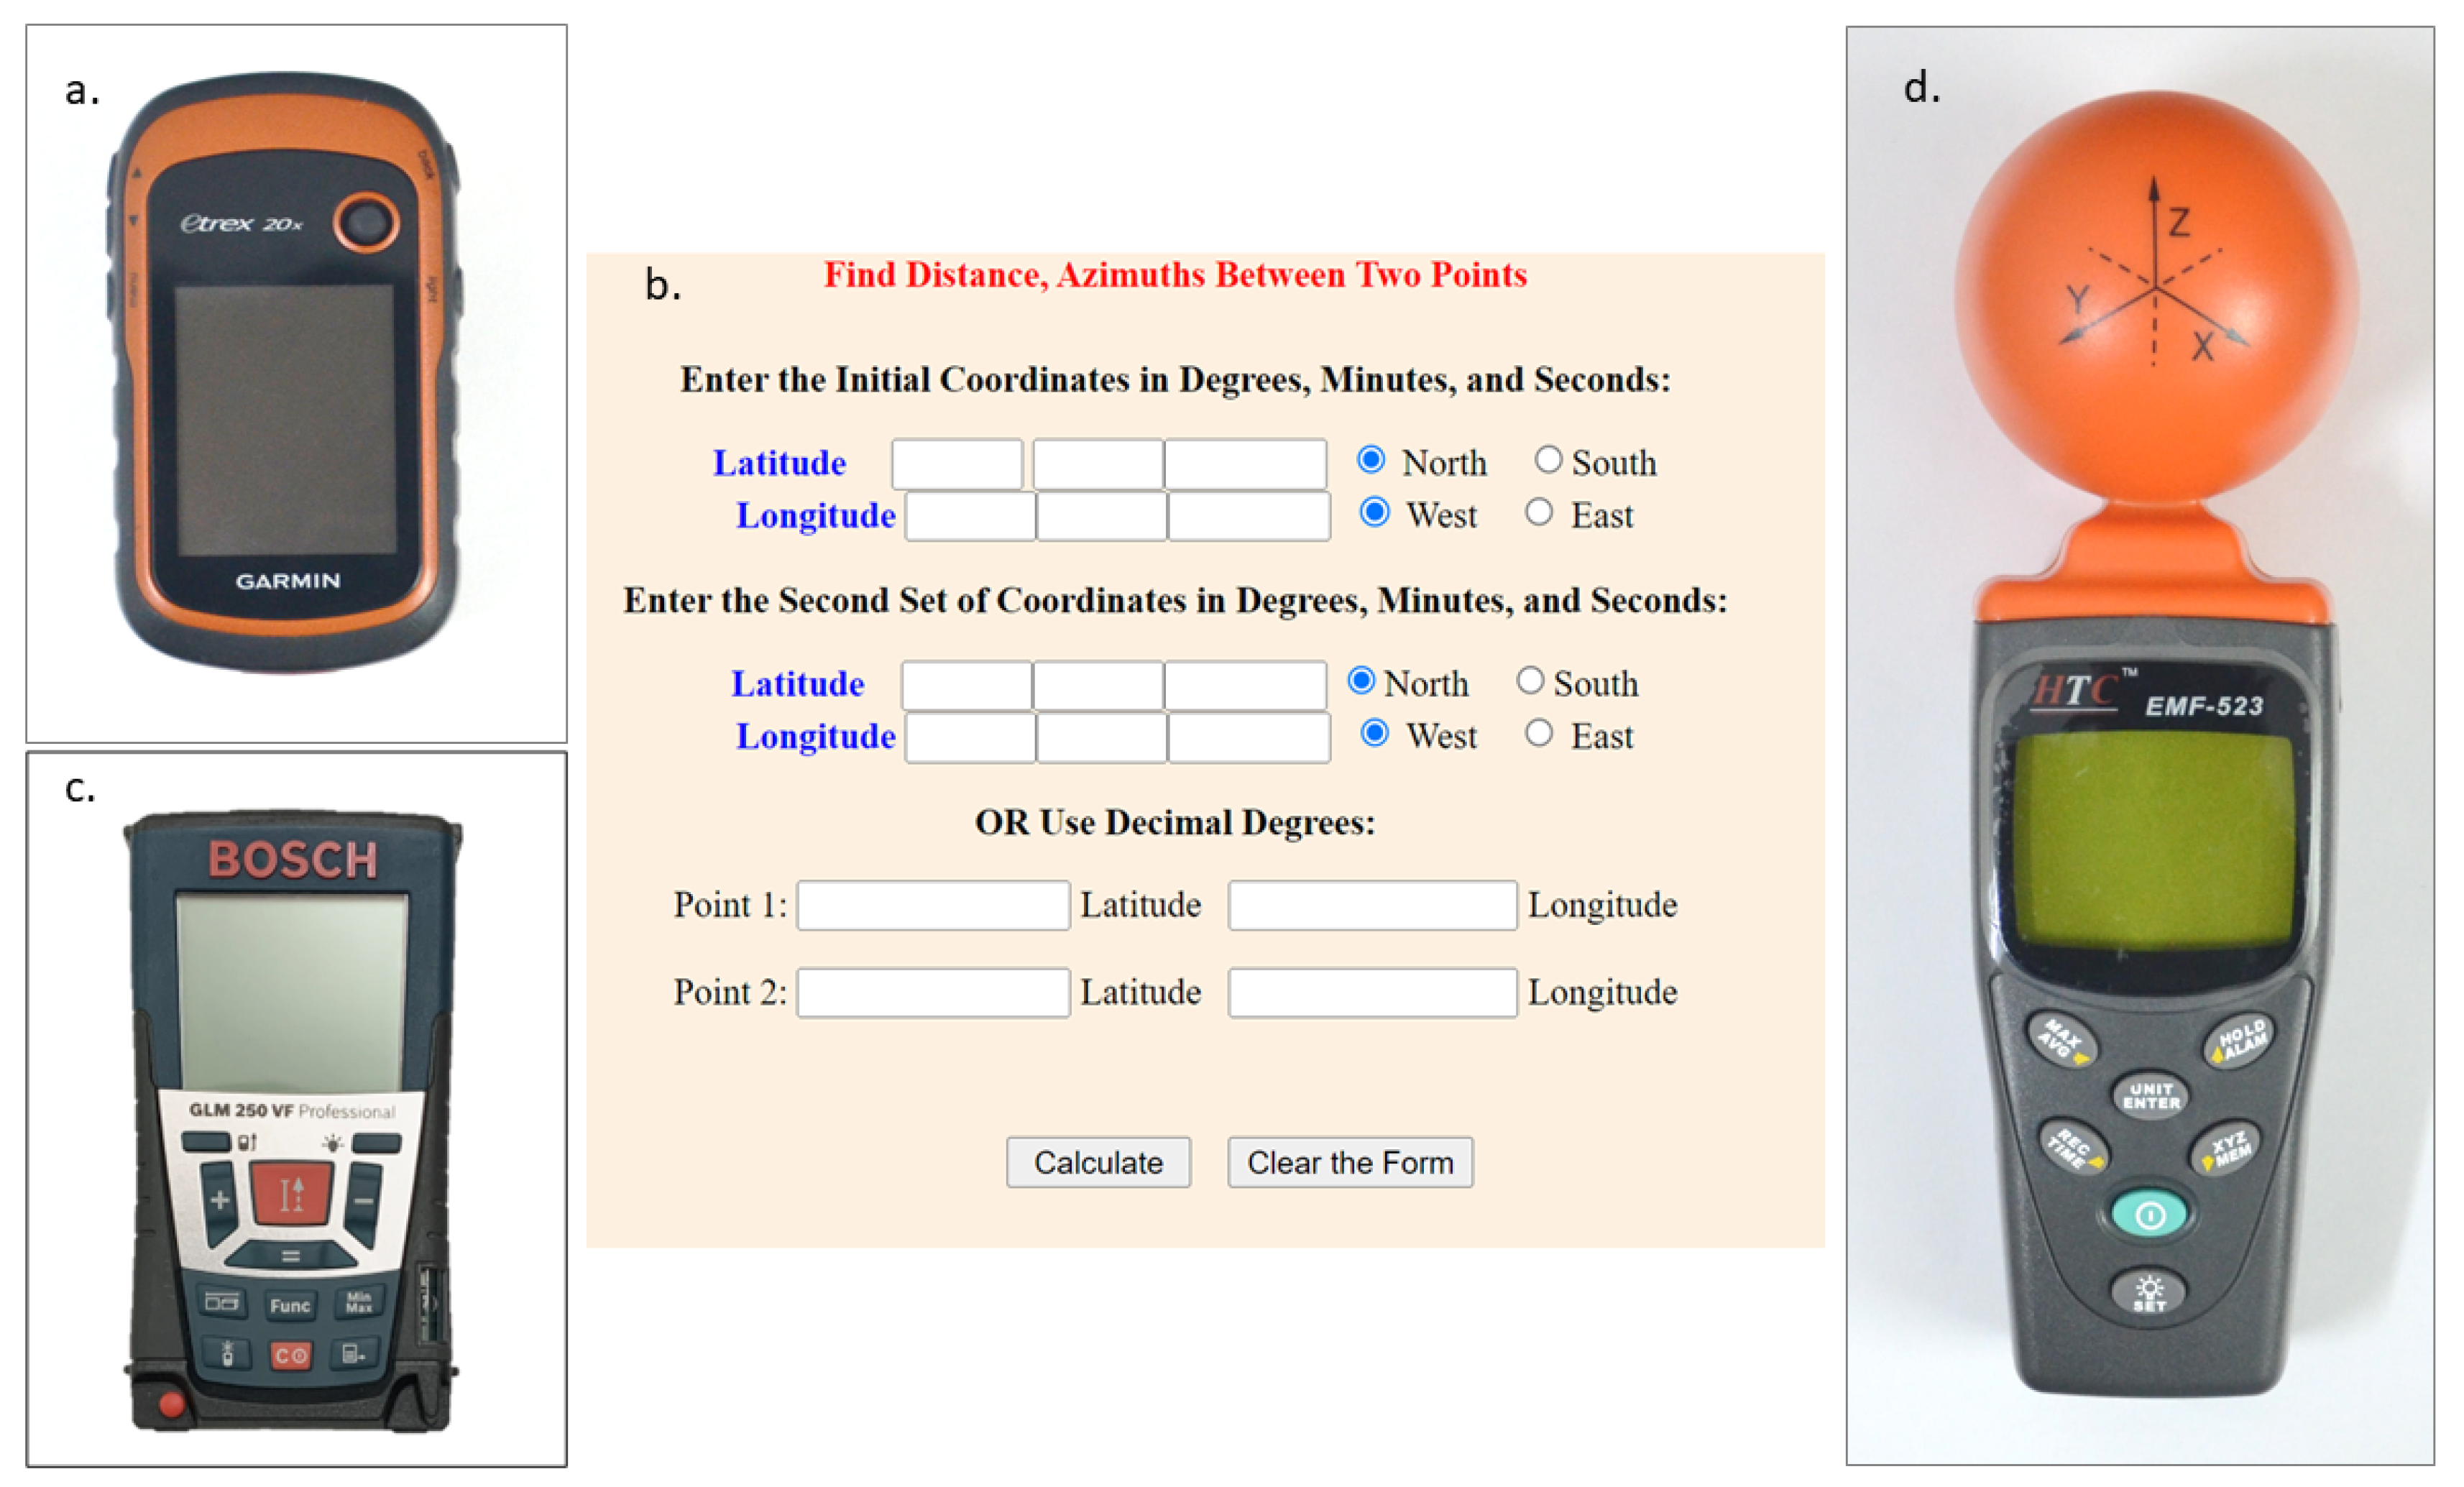
2.3. Study Protocol
2.4. Statistical Analysis
3. Result
4. Discussion
4.1. Strength and Limitations of the Study
4.2. Future Direction
5. Conclusions
Author Contributions
Funding
Institutional Review Board Statement
Informed Consent Statement
Data Availability Statement
Acknowledgments
Conflicts of Interest
References
- Anders, A.; Maria, F. Electromagnetic radiation. Br. Med. Bull. 2003, 68, 157–165. [Google Scholar]
- United Nations Scientific Committee on the Effects of Atomic Radiations (UNSCEAR). Sources and Effects of Ionising Radiation Annex B Exposures from Natural Radiation Sources; United Nations: New York, NY, USA, 2000. [Google Scholar]
- World Health Organization (WHO). Effects of Radiation on Human Heredity: Investigations of Areas of High Natural Radiation. WHO Technical Report Series No. 166; WHO: Geneva, Switzerland, 1959. [Google Scholar]
- Bernhardt, J.H. Nonionizing radiation and electromagnetic fields. OffentlGesundheitswes 1991, 53, 409–414. [Google Scholar]
- Wood, A.W. How dangerous are mobile phones, transmission masts, and electricity pylons? Arch. Dis. Child. 2006, 91, 361–366. [Google Scholar] [CrossRef] [PubMed] [Green Version]
- Megha, K.; Deshmukh, P.S.; Banerjee, B.D.; Tripathi, A.K.; Abegaonkar, M.P. Microwave radiation-induced oxidative stress, cognitive impairment and inflammation in the brain of Fischer rats. Indian J. Exp. Biol. 2012, 50, 889–896. [Google Scholar] [PubMed]
- Challis, L.J. Mechanisms for interaction between RF fields and biological tissue. Bioelectromagnetics 2005, 26, S98–S106. [Google Scholar] [CrossRef] [PubMed]
- Antonopoulos, A.; Eisenbrandt, H.; Obe, G. Effects of high-frequency electromagnetic fields on human lymphocytes in vitro. Mutat. Res. 1997, 395, 209–214. [Google Scholar] [CrossRef]
- Vijayalaxmi; Prihoda, T.J. Genetic damage in mammalian somatic cells exposed to radiofrequency radiation: A meta-analysis of data from 63 publications (1990-2005). Radiat. Res. 2008, 169, 561–574. [Google Scholar] [CrossRef]
- Augner, C.; Hacker, G.W.; Oberfeld, G.; Florian, M.; Hitzl, W.; Hutter, J.; Pauser, G. Effects of exposure to GSM mobile phone base station signals on salivary cortisol, alpha-amylase, and immunoglobulin A. Biomed. Environ. Sci. 2010, 23, 199–207. [Google Scholar] [CrossRef]
- Singh, K.; Nagaraj, A.; Yousuf, A.; Ganta, S.; Pareek, S.; Vishnani, P. Effect of electromagnetic radiations from mobile phone base stations on general health and salivary function. J. Int. Soc. Prev. Community Dent. 2016, 6, 54–59. [Google Scholar]
- Thamilselvan, S.; Behera, A.; Nair, S.K.; Chandru, C.S.; Krishnakumar, M.; Ramani, P. Micronuclei analysis in people residing within 25 m of radiation-exposed areas around mobile towers in Chennai, India: An observational study. J. Int. Oral Health 2021, 13, 350–355. [Google Scholar]
- Distance and Azimuths between Two Sets of Coordinates. Available online: https://www.fcc.gov/media/radio/distance-and-azimuths (accessed on 17 June 2021).
- Hutter, H.P.; Moshammer, H.; Wallner, P.; Kundi, M. Subjective symptoms, sleeping problems, and cognitive performance in subjects living near mobile phone base stations. Occup. Environ. Med. 2006, 63, 307–313. [Google Scholar] [CrossRef] [PubMed]
- Zothansiama; Zosangzuali, M.; Lalramdinpuii, M.; Jagetia, G.C. Impact of radiofrequency radiation on DNA damage and antioxidants in peripheral blood lymphocytes of humans residing in the vicinity of mobile phone base stations. Electromagn. Biol. Med. 2017, 36, 295–305. [Google Scholar] [CrossRef] [PubMed]
- Base Stations Radiofrequency—RF EMF. Available online: https://www.icnirp.org/en/applications/base-stations/index.html. (accessed on 18 October 2022).
- Human Exposure to Radio Frequency Fields: Guidelines for Cellular Antenna Sites. Available online: https://www.fcc.gov/consumers/guides/human-exposure-radio-frequency-fields-guidelines-cellular-and-pcs-sites (accessed on 18 October 2022).
- Occupational Safety and Health Administration. Available online: https://www.osha.gov/radiofrequency-and-microwave-radiation/electromagnetic-field-memo (accessed on 18 October 2022).
- Paul, S. RFID+ The Physics of RFID. In RFID+ Study Guide and Practice Exams; Paul, S., Ed.; Syngress Publishing: Rockland, MA, USA, 2007; pp. 21–53. [Google Scholar]
- Nirod, K.D. Antennas and Radiation. In The Electrical Engineering Handbook; Chen, W.-K., Ed.; Academic Press Publishing: Cambridge, MA, USA, 2005; pp. 553–569. [Google Scholar]
- Alan, B.; Alan, W.; Andy, N. The Radar Systems—Technical Principles. In Radar and ARPA Manual, 3rd ed.; Alan, B., Alan, W., Andy, N., Eds.; Butterworth-Heinemann Publishing: Oxford, UK, 2014; pp. 29–137. [Google Scholar]
- Ahmad, A.; Danladi, A.T.; Engr YHAbubakar Zakariyya, H.A. Measurement of electromagnetic waves radiated from base transceiver stations (BTS) for assessing exposure limits in Kaduna State. Int. J. Eng. Sci. 2014, 3, 28–34. [Google Scholar]
- Kim, B.C.; Choi, H.D.; Park, S.O. Methods of evaluating human exposure to electromagnetic fields radiated from operating base stations in Korea. Bioelectromagnetics 2008, 29, 579–582. [Google Scholar] [CrossRef] [PubMed]
- Cooper, T.G.; Mann, S.M.; Khalid, M.; Blackwell, R.P. Public exposure to radio waves near GSM microcell and picocell base stations. J. Radiol. Prot. 2006, 26, 199–211. [Google Scholar] [CrossRef]
- Wu, T.; Shao, Q.; Yang, L.; Qi, D.; Lin, J.; Lin, X.; Yu, Z. A large-scale measurement of electromagnetic fields near GSM base stations in Guangxi, China for risk communication. Radiat. Prot. Dosim. 2013, 155, 25–31. [Google Scholar] [CrossRef]
- Bartosova, K.; Neruda, M.; Vojtech, L. Methodology of studying effects of mobile phone radiation on organisms: Technical aspects. Int. J. Environ. Res. Public Health 2021, 18, 12642. [Google Scholar] [CrossRef]
- Akkam, Y.; Al-Taani, A.A.; Ayasreh, S.; Almutairi, A.; Alakkam, N. Correlation of blood oxidative stress parameters to indoor radiofrequency radiation: A cross sectional study in Jordan. Int. J. Environ. Res. Public Health 2020, 17, 4673. [Google Scholar] [CrossRef]
- Koppel, T.; Ahonen, M.; Carlberg, M.; Hedendahl, L.K.; Hardell, L. Radiofrequency radiation from nearby mobile phone base stations-a case comparison of one low and one high exposure apartment. Oncol. Lett. 2019, 18, 5383–5391. [Google Scholar] [CrossRef] [Green Version]
- Meo, S.A.; AlMahmoud, M.; Alsultan, Q.; Alotaibi, N.; Alnajashi, I.; Hajjar, W.M. Mobile phone base station tower settings adjacent to school buildings: Impact on students’ cognitive health. Am. J. Men’s Health 2018, 13, 1–6. [Google Scholar] [CrossRef]
- Mohril, S.; Sankhla, M.S.; Sonone, S.S.; Parihar, K.; Kumar, R. Adverse impacts of mobile phone tower radiation on human health. Int. J. Radiol. Radiat. Ther. 2020, 7, 163–166. [Google Scholar] [CrossRef]


| Groups | Cell Phone Tower | Number of Disk Antenna | Number of Sector Antenna | Range of PD at 50 m (μW/cm2) | Range of PD at 100 m (μW/cm2) |
|---|---|---|---|---|---|
| Group I | 1 | 2 | 3 | 0.01–0.236 | 0.002–0.013 |
| 2 | 0 | 5 | 0.01–0.28 | 0.06–0.157 | |
| 3 | 1 | 3 | 0.001–0.025 | 0.001–0.307 | |
| 4 | 0 | 4 | 0.026–0.176 | 0.008–0.317 | |
| Group II | 1 | 0 | 6 | 0.052–0.239 | 0.005–0.328 |
| 2 | 1 | 5 | 0.03–0.327 | 0.015–0.307 | |
| 3 | 4 | 5 | 0.004–0.10 | 0.02–0.072 | |
| 4 | 3 | 7 | 0.002–0.1 | 0.001–0.71 | |
| Group III | 1 | 7 | 7 | 0.014–0.032 | 0.012–0.355 |
| 2 | 1 | 10 | 0.037–0.264 | 0.05–0.183 | |
| 3 | 4 | 7 | 0.019–0.09 | 0.032–0.084 | |
| 4 | 6 | 7 | 0.006–0.18 | 0.005–0.167 | |
| Group IV | 1 | 8 | 16 | 0.095–0.322 | 0.01–0.322 |
| 2 | 9 | 11 | 0.018–0.118 | 0.021–0.096 | |
| 3 | 9 | 13 | 0.116–0.336 | 0.011–0.078 | |
| 4 | 9 | 7 | 0.04–0.155 | 0.021–0.156 |
| SG | EF | p Value ‡ | MF | p Value ‡ | PD | p Value ‡ | |||
|---|---|---|---|---|---|---|---|---|---|
| 50 m | 100 m | 50 m | 100 m | 50 m | 100 m | ||||
| I | 588.88 ± 426.87 | 525.79 ± 458.00 | 0.690 | 1590.90 ± 1116.30 | 1345.17 ± 1166.39 | 0.547 | 0.07 ± 0.09 | 0.10 ± 0.11 | 0.519 |
| II | 962.65 ± 1528.52 | 657.68 ± 515.25 | 0.455 | 1545.02 ± 1083.03 | 1784.84 ± 1406.43 | 0.593 | 0.09 ± 0.08 | 0.15 ± 0.21 | 0.283 |
| III | 555.19 ± 292.34 | 661.48 ± 358.62 | 0.365 | 1440.84 ± 832.57 | 2085.10 ± 1157.29 | 0.081 | 0.06 ± 0.06 | 0.10 ± 0.08 | 0.168 |
| IV | 1448.51 ± 2566.34 | 574.34 ± 316.66 | 0.186 | 2221.28 ± 884.85 | 1616.91 ± 745.03 | 0.045 * | 0.12 ± 0.09 | 0.07 ± 0.06 | 0.049 * |
| p value † | 0.315 | 0.754 | 0.116 | 0.327 | 0.190 | 0.362 | |||
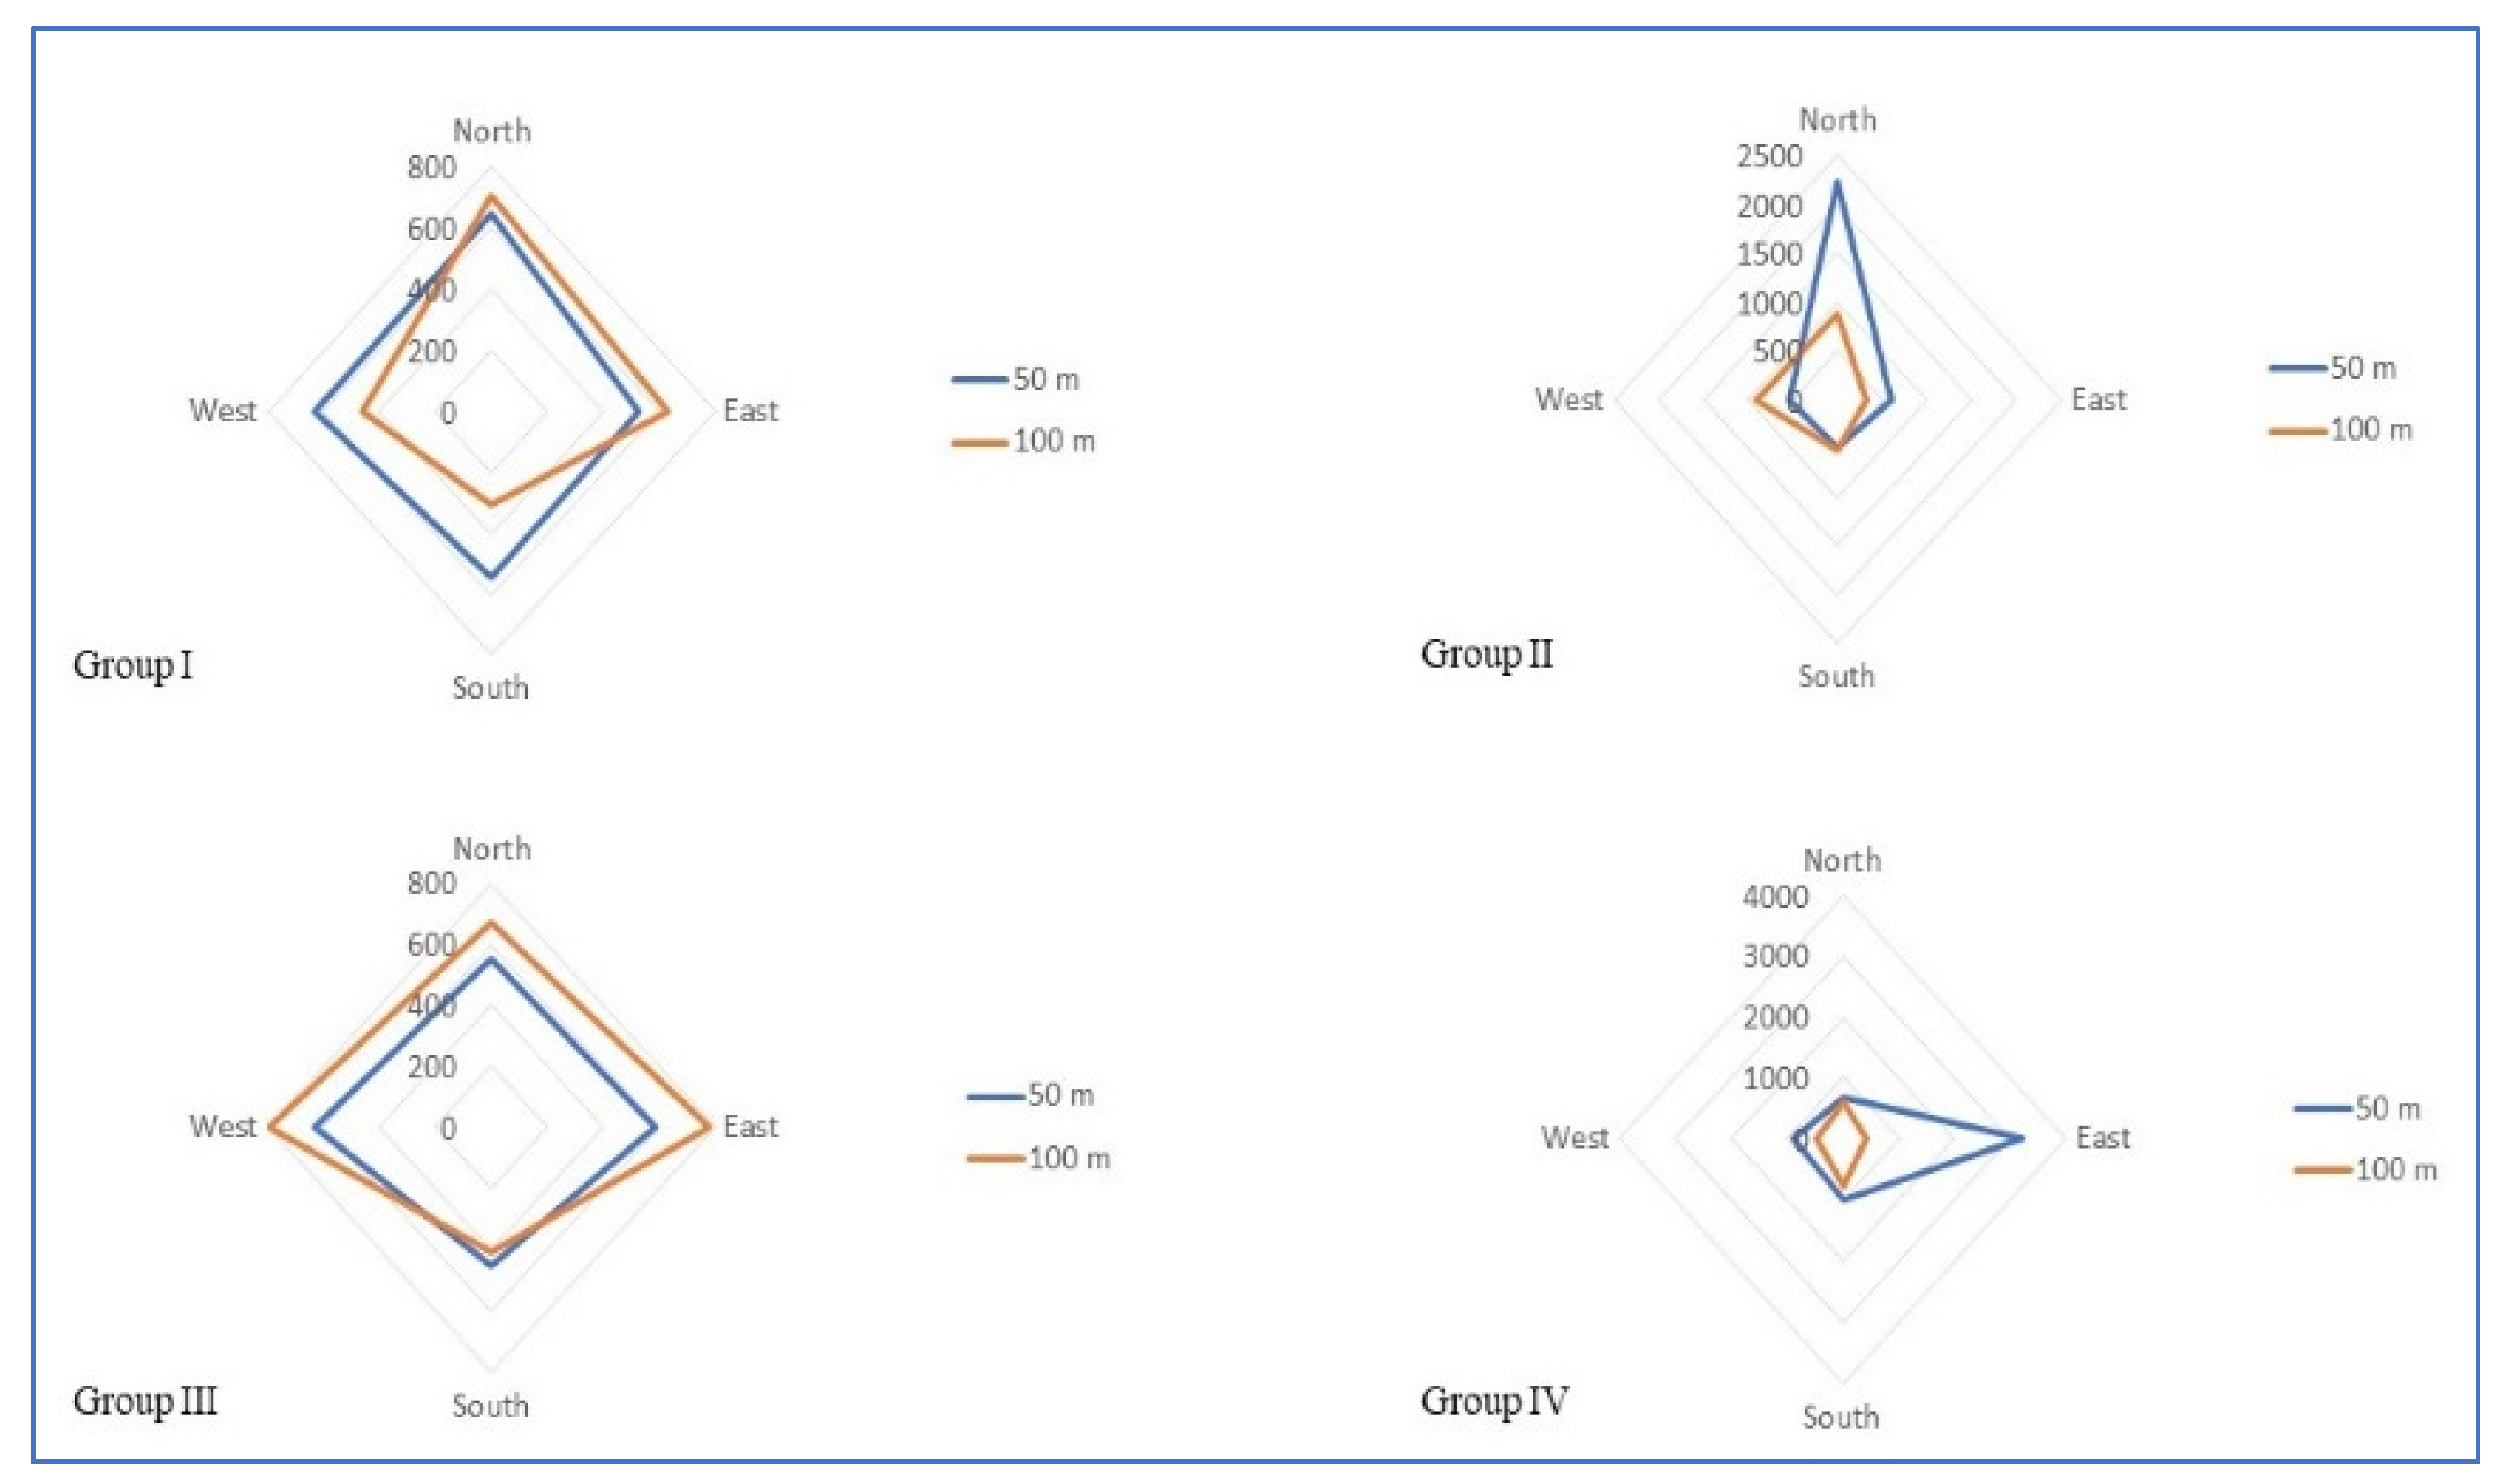
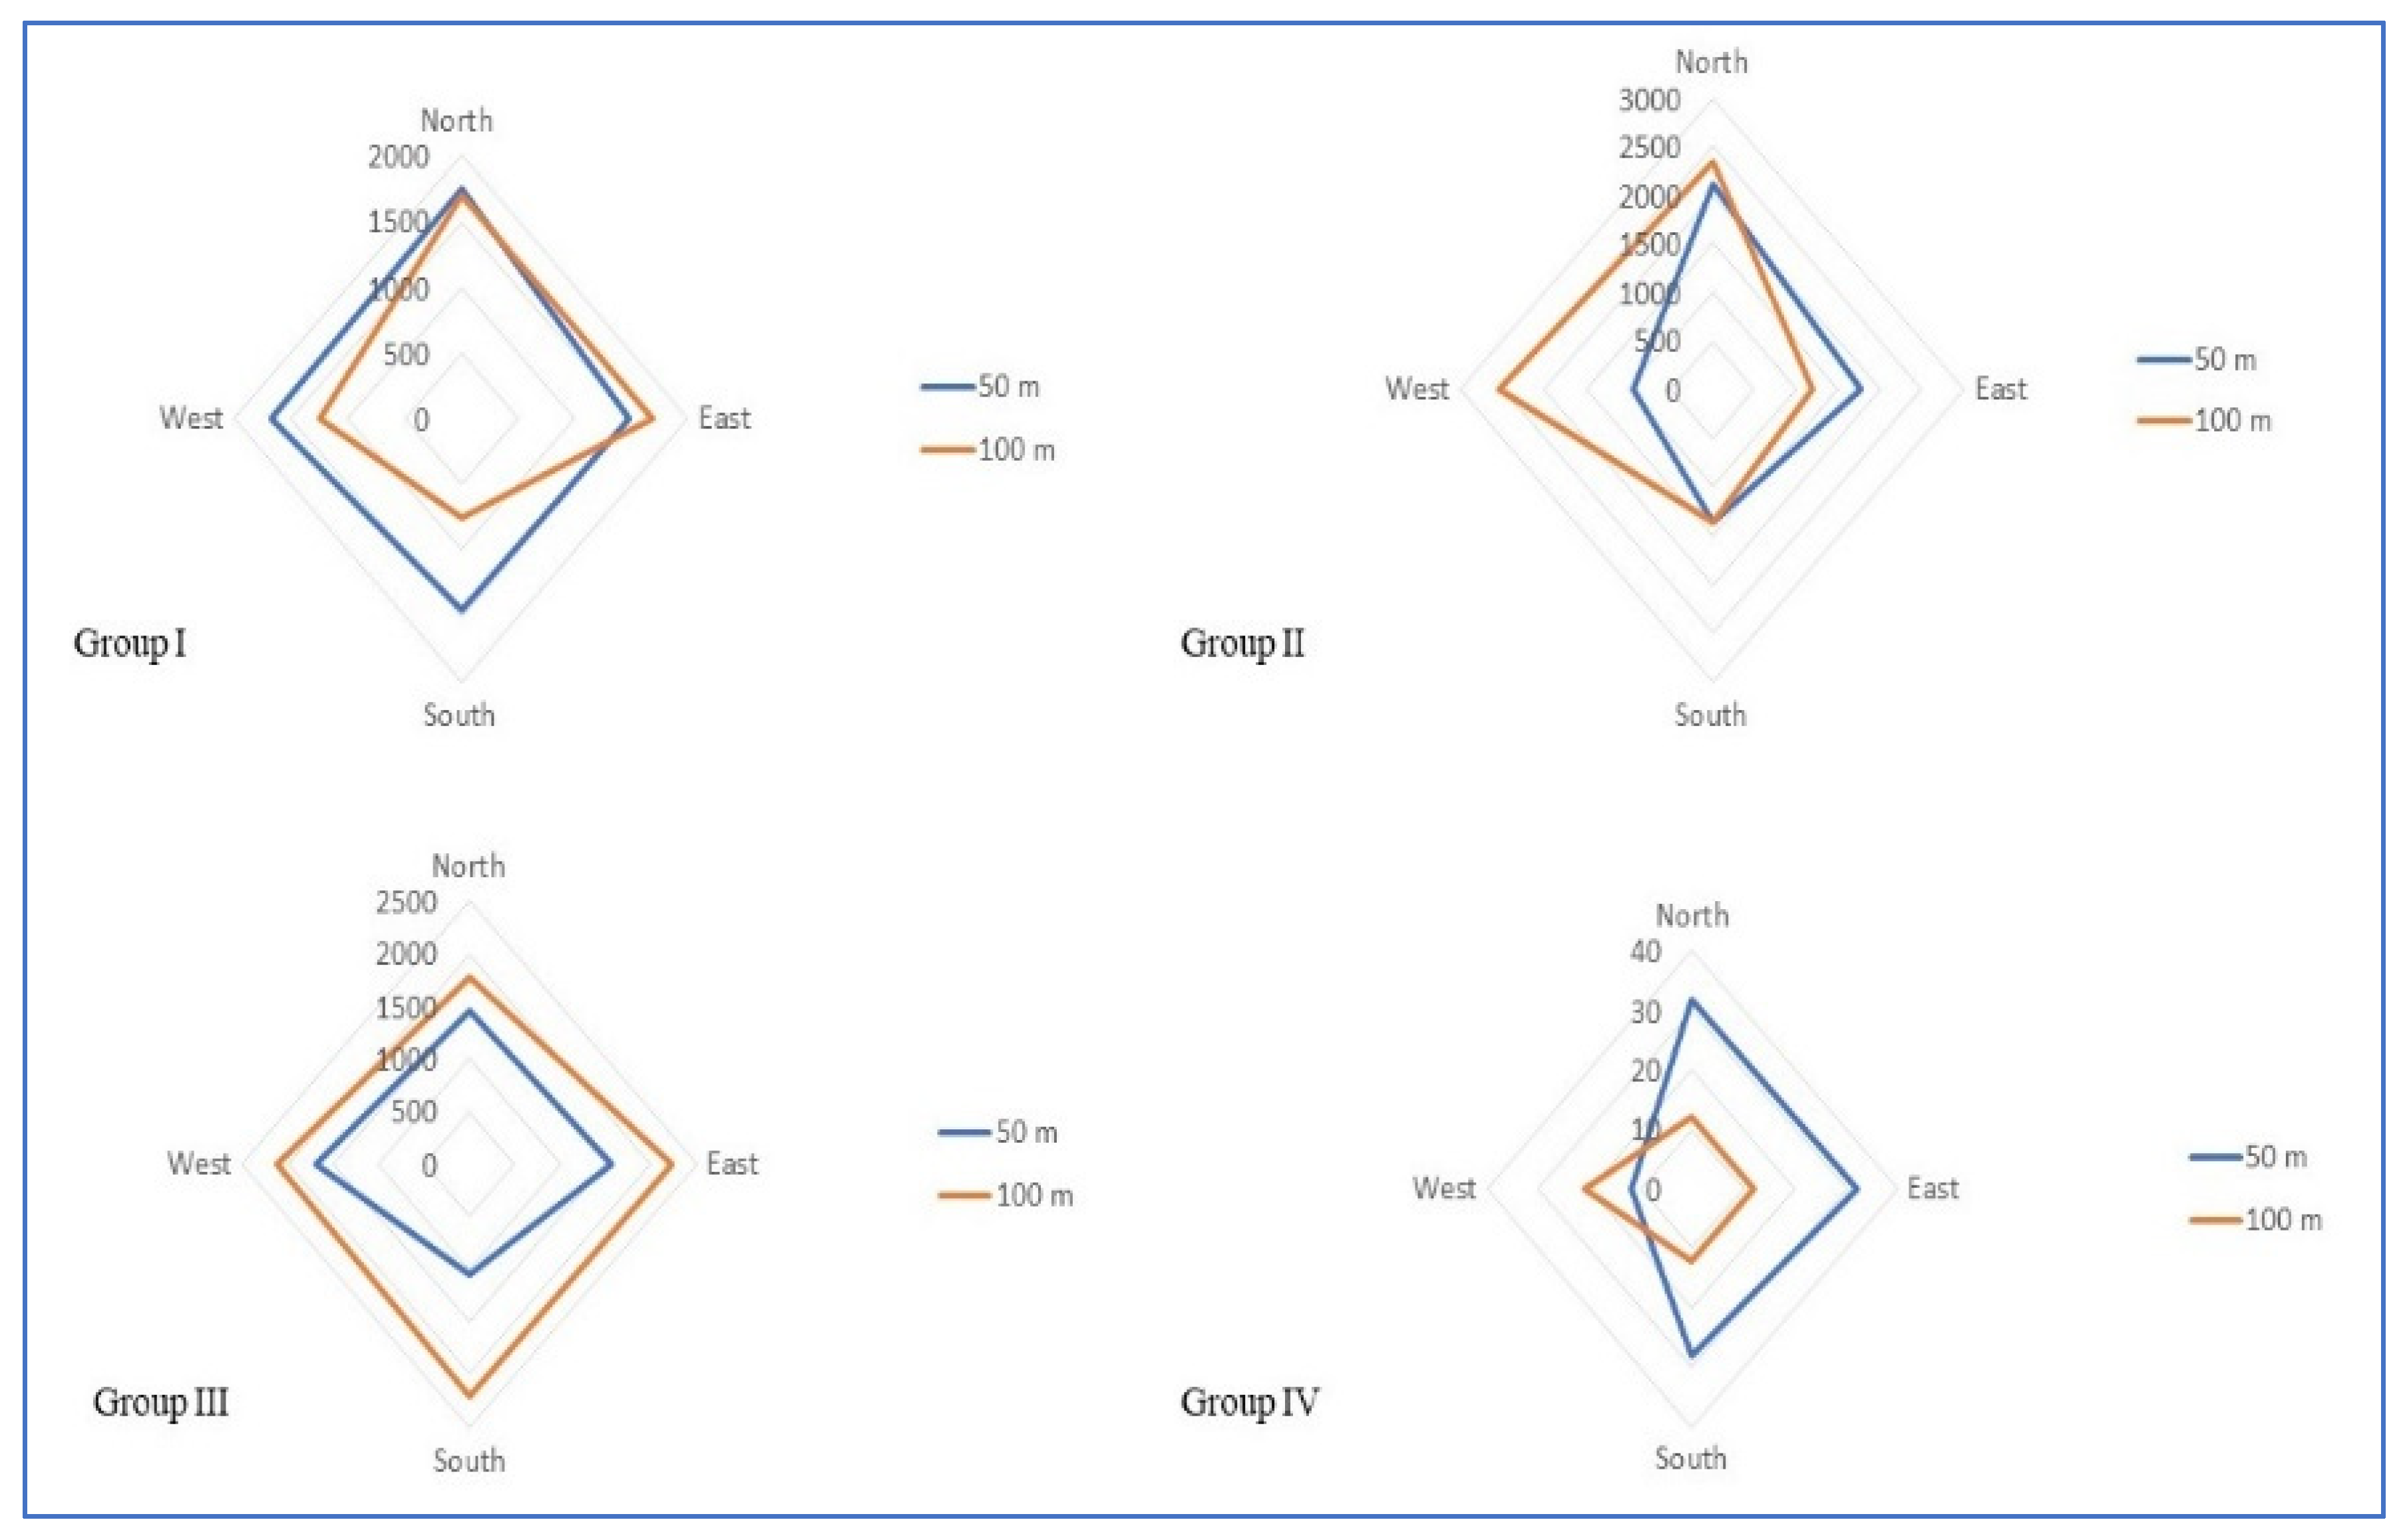
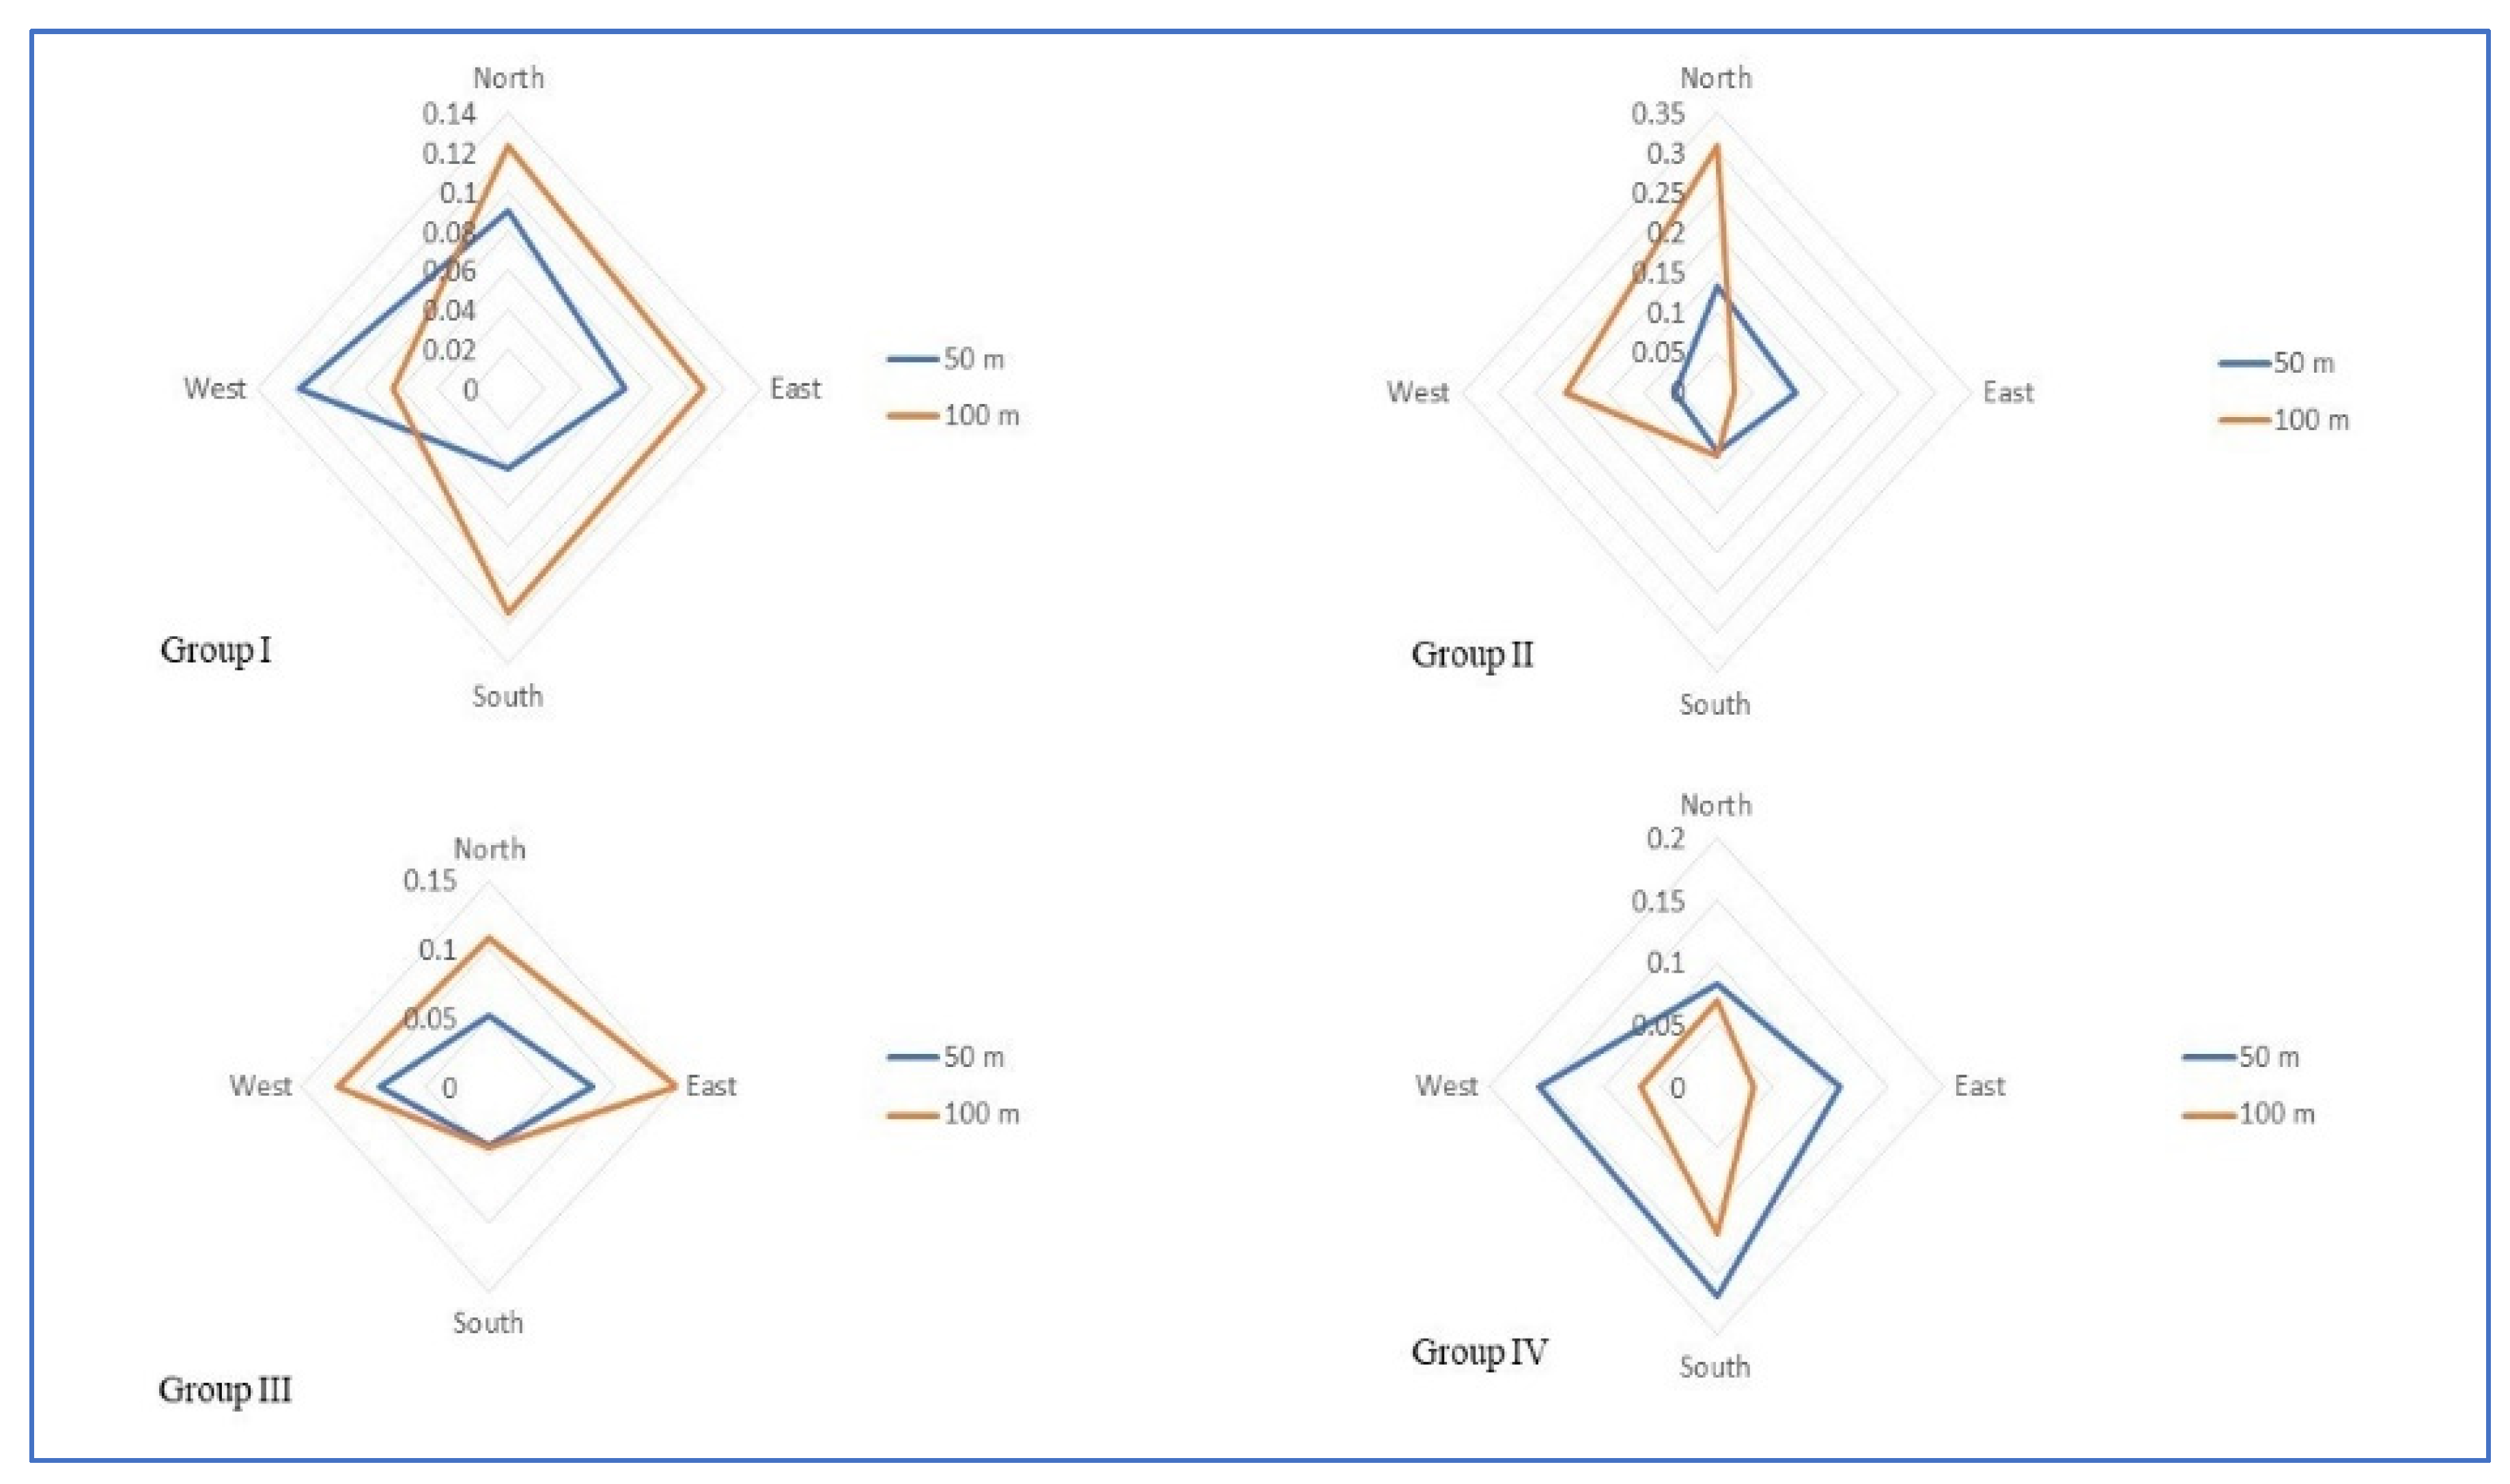
| Study Groups | Electric Field Strength (EF) | p Value | Magnetic Field Strength (MF) | p Value | Power Density (PD) | p Value | |||||||||
|---|---|---|---|---|---|---|---|---|---|---|---|---|---|---|---|
| North | South | East | West | North | South | East | West | North | South | East | West | ||||
| I | 676.95 ± 470.22 | 581.06 ± 359.06 | 424.52 ± 426.37 | 546.82 ± 524.80 | 0.732 | 1722.53 ± 1190.4 | 1577.47 ± 925.56 | 1108.45 ± 1083.08 | 1463.69 ± 1404.32 | 0.750 | 0.106 ± 0.11 | 0.086 ± 0.09 | 0.077 ± 0.11 | 0.090 ± 0.11 | 0.958 |
| II | 1551.08 ± 2048.39 | 463.96 ± 299.98 | 502.26 ± 476.36 | 723.36 ± 536.29 | 0.187 | 2239.77 ± 955.32 | 1331.31 ± 978.84 | 1356.85 ± 1277.38 | 1731.79 ± 1642.25 | 0.439 | 0.220 ± 0.22 | 0.066 ± 0.07 | 0.076 ± 0.10 | 0.132 ± 0.18 | 0.215 |
| III | 609.61 ± 170.58 | 681.52 ± 510.99 | 428.91 ± 230.82 | 713.30 ± 269.52 | 0.312 | 1622.88 ± 471.32 | 1898.16 ± 1333.27 | 1626.15 ± 1496.50 | 1904.70 ± 709.08 | 0.914 | 0.079 ± 0.049 | 0.115 ± 0.130 | 0.043 ± 0.035 | 0.103 ± 0.069 | 0.311 |
| IV | 651.06 ± 199.95 | 1816.22 ± 3718.41 | 893.03 ± 355.12 | 685.39 ± 427.14 | 0.574 | 1736.51 ± 522.08 | 1555.037 ± 924.40 | 2386.18 ± 917.10 | 1998.66 ± 932.94 | 0.245 | 0.076 ± 0.042 | 0.070 ± 0.075 | 0.143 ± 0.092 | 0.112 ± 0.102 | 0.260 |
| p Value | 0.245 | 0.464 | 0.064 | 0.852 | 0.467 | 0.760 | 0.197 | 0.831 | 0.118 | 0.734 | 0.185 | 0.920 | |||
| Category | Power Density (µW/cm2) |
|---|---|
| Low | 0.001–0.029 |
| Medium | 0.03–0.099 |
| High | 0.1–0.355 |
Publisher’s Note: MDPI stays neutral with regard to jurisdictional claims in published maps and institutional affiliations. |
© 2022 by the authors. Licensee MDPI, Basel, Switzerland. This article is an open access article distributed under the terms and conditions of the Creative Commons Attribution (CC BY) license (https://creativecommons.org/licenses/by/4.0/).
Share and Cite
Baliah, J.; Subramanian, B.; Livingstone, D.; Kanwal, B.; Zaman, M.U.; Srivastava, K.C.; Abutayyem, H.; Al-Johani, K.; David, A.P.; Shrivastava, D.; et al. Comparative Analysis of Electric Field Strength, Magnetic Field Strength and Power Density around the Cell Phone Towers of Varying Characteristics with a Proposed Classification Facilitating Research on Human Population. Int. J. Environ. Res. Public Health 2022, 19, 14157. https://doi.org/10.3390/ijerph192114157
Baliah J, Subramanian B, Livingstone D, Kanwal B, Zaman MU, Srivastava KC, Abutayyem H, Al-Johani K, David AP, Shrivastava D, et al. Comparative Analysis of Electric Field Strength, Magnetic Field Strength and Power Density around the Cell Phone Towers of Varying Characteristics with a Proposed Classification Facilitating Research on Human Population. International Journal of Environmental Research and Public Health. 2022; 19(21):14157. https://doi.org/10.3390/ijerph192114157
Chicago/Turabian StyleBaliah, John, Balanehru Subramanian, David Livingstone, Bushra Kanwal, Mahmud Uz Zaman, Kumar Chandan Srivastava, Huda Abutayyem, Khalid Al-Johani, Anju P. David, Deepti Shrivastava, and et al. 2022. "Comparative Analysis of Electric Field Strength, Magnetic Field Strength and Power Density around the Cell Phone Towers of Varying Characteristics with a Proposed Classification Facilitating Research on Human Population" International Journal of Environmental Research and Public Health 19, no. 21: 14157. https://doi.org/10.3390/ijerph192114157