
Association of Dietary Patterns with MRI Markers of Hepatic Inflammation and Fibrosis in the MAST4HEALTH Study

 , , ,
, , ,  , , , , , , add
Show full author list
, , , , , , add
Show full author list
Abstract
:1. Introduction
2. Materials and Methods
2.1. Study Design and Patients
2.2. Measures
2.3. Statistical Analysis
3. Results
4. Discussion
5. Conclusions
Supplementary Materials
Author Contributions
Funding
 Athina I. Amanatidou was supported by the Hellenic Foundation for Research and Innovation (HFRI) under the HFRI PhD Fellowship grant (Fellowship Number: 1529).
Institutional Review Board Statement
Informed Consent Statement
Data Availability Statement
Acknowledgments
Conflicts of Interest
References
- Goh, G.B.; Pagadala, M.R.; Dasarathy, J.; Unalp-Arida, A.; Sargent, R.; Hawkins, C.; Sourianarayanane, A.; Khiyami, A.; Yerian, L.; Pai, R.K.; et al. Clinical spectrum of non-alcoholic fatty liver disease in diabetic and non-diabetic patients. BBA Clin. 2014, 3, 141–145. [Google Scholar] [CrossRef] [Green Version]
- Byrne, C.D.; Targher, G. NAFLD: A multisystem disease. J. Hepatol. 2015, 62, S47–S64. [Google Scholar] [CrossRef] [Green Version]
- Younossi, Z.M.; Koenig, A.B.; Abdelatif, D.; Fazel, Y.; Henry, L.; Wymer, M. Global epidemiology of nonalcoholic fatty liver disease-Meta-analytic assessment of prevalence, incidence, and outcomes. Hepatology 2016, 64, 73–84. [Google Scholar] [CrossRef] [PubMed] [Green Version]
- Wong, R.J.; Aguilar, M.; Cheung, R.; Perumpail, R.B.; Harrison, S.A.; Younossi, Z.M.; Ahmed, A. Nonalcoholic Steatohepatitis is the second leading etiology of liver disease among adults awaiting liver transplantation in the United States. Gastroenterology 2015, 148, 547–555. [Google Scholar] [CrossRef]
- Adam, R.; Karam, V.; Cailliez, V.; Grady, J.G.O.; Mirza, D.; Cherqui, D.; Klempnauer, J.; Salizzoni, M.; Pratschke, J.; Jamieson, N.; et al. 2018 Annual Report of the European Liver Transplant Registry (ELTR)−50-year evolution of liver transplantation. Transpl. Int. 2018, 31, 1293–1317. [Google Scholar] [CrossRef] [PubMed] [Green Version]
- Pang, Q.; Zhang, J.Y.; Song, S.D.; Qu, K.; Xu, X.S.; Liu, S.S.; Liu, C. Central obesity and nonalcoholic fatty liver disease risk after adjusting for body mass index. World J. Gastroenterol. 2015, 21, 1650–1662. [Google Scholar] [CrossRef] [PubMed]
- Lallukka, S.; Sädevirta, S.; Kallio, M.T.; Luukkonen, P.K.; Zhou, Y.; Hakkarainen, A.; Lundbom, N.; Orho-Melander, M.; Yki-Järvinen, H. Predictors of liver fat and stiffness in non-alcoholic fatty liver disease (NAFLD)—An 11-year prospective study. Sci. Rep. 2017, 7, 14561. [Google Scholar] [CrossRef] [Green Version]
- Kasper, P.; Martin, A.; Lang, S.; Kütting, F.; Goeser, T.; Demir, M.; Steffen, H.M. NAFLD and cardiovascular diseases: A clinical review. Clin. Res. Cardiol. 2020, 110, 921–937. [Google Scholar] [CrossRef]
- Chalasani, N.; Younossi, Z.; LaVine, J.E.; Diehl, A.M.; Brunt, E.M.; Cusi, K.; Charlton, M.; Sanyal, A.J. The diagnosis and management of non-alcoholic fatty liver disease: Practice Guideline by the American Association for the Study of Liver Diseases, American College of Gastroenterology, and the American Gastroenterological Association. Hepatology 2012, 55, 2005–2023. [Google Scholar] [CrossRef]
- Fan, J.G.; Jia, J.D.; Li, Y.M.; Wang, B.Y.; Lu, L.G.; Shi, J.P.; Chan, L.Y.; Chinese Association for the Study of Liver. Guidelines for the diagnosis and management of nonalcoholic fatty liver disease: Update 2010: (published in Chinese on Chinese Journal of Hepatology 2010, 18, 163–166). J. Dig. Dis. 2010, 12, 38–44. [Google Scholar] [CrossRef]
- Carvalhana, S.; Machado, M.V.; Cortez-Pinto, H. Improving dietary patterns in patients with nonalcoholic fatty liver disease. Curr. Opin. Clin. Nutr. Metab. Care 2012, 15, 468–473. [Google Scholar] [CrossRef]
- Mouzaki, M.; Allard, J.P. The role of nutrients in the development, progression, and treatment of nonalcoholic fatty liver disease. J. Clin. Gastroenterol. 2012, 46, 457–467. [Google Scholar] [CrossRef]
- McCarthy, E.M.; Rinella, M.E. The role of diet and nutrient composition in nonalcoholic fatty liver disease. J. Acad. Nutr. Diet. 2012, 112, 401–409. [Google Scholar] [CrossRef]
- de Wit, N.J.; Afman, L.A.; Mensink, M.; Muller, M. Phenotyping the effect of diet on non-alcoholic fatty liver disease. J. Hepatol. 2012, 57, 1370–1373. [Google Scholar] [CrossRef]
- Strychar, I. Diet in the management of weight loss. Can. Med. Assoc. J. 2006, 174, 56–63. [Google Scholar] [CrossRef] [Green Version]
- Lujan Vancells, P.; Esmel Vinas, E.; Meseguer Sacanella, E. Overview of non-alcoholic fatty liver disease (NAFLD) and the role of sugary food consumption and other dietary components in its development. Nutrients 2021, 13, 1442. [Google Scholar] [CrossRef]
- Bueno, N.B.; Silva Dos Santos, M.M.; de Melo, I.S.V. Low-carbohydrate diets and intrahepatic lipid content in individuals with non-alcoholic fatty liver disease: Evidence from a meta-analysis of randomized trials. Clin. Nutr. 2019, 39, 310–311. [Google Scholar] [CrossRef]
- Ahn, J.; Jun, D.W.; Lee, H.Y.; Moon, J.H. Critical appraisal for low-carbohydrate diet in nonalcoholic fatty liver disease: Review and meta-analyses. Clin. Nutr. 2019, 38, 2023–2030. [Google Scholar] [CrossRef] [PubMed]
- Perdomo, C.M.; Frühbeck, G.; Escalada, J. Impact of nutritional changes on nonalcoholic fatty liver disease. Nutrients 2019, 11, 677. [Google Scholar] [CrossRef] [PubMed] [Green Version]
- Younossi, Z.M.; Marchesini, G.; Pinto-Cortez, H.; Petta, S. Epidemiology of nonalcoholic fatty liver disease and nonalcoholic steatohepatitis: Implications for liver transplantation. Transplantation 2019, 103, 22–27. [Google Scholar] [CrossRef]
- Softic, S.; Kahn, C.R. Fatty liver disease: Is it nonalcoholic fatty liver disease or obesity-associated fatty liver disease? Eur. J. Gastroenterol. Hepatol. 2019, 31, 143. [Google Scholar] [CrossRef] [PubMed]
- Russo, E.; Leoncini, G.; Esposito, P.; Garibotto, G.; Pontremoli, R.; Viazzi, F. Fructose and uric acid: Major mediators of cardiovascular disease risk starting at pediatric age. Int. J. Mol. Sci. 2020, 21, 4479. [Google Scholar] [CrossRef] [PubMed]
- Zelber-Sagi, S.; Salomone, F.; Mlynarsky, L. The Mediterranean dietary pattern as the diet of choice for non-alcoholic fatty liver disease: Evidence and plausible mechanisms. Liver Int. 2017, 37, 936–949. [Google Scholar] [CrossRef] [PubMed] [Green Version]
- Chhimwal, J.; Patial, V.; Padwad, Y. Beverages and non-alcoholic fatty liver disease (NAFLD): Think before you drink. Clin. Nutr. 2021, 40, 2508–2519. [Google Scholar] [CrossRef] [PubMed]
- Ribeiro, M.; Alvarenga, L.; Cardozo, L.F.M.F.; Chermut, T.R.; Sequeira, J.; de Souza Gouveia Moreira, L.; Teixeira, K.T.R.; Shiels, P.G.; Stenvinkel, P.; Mafra, D. From the distinctive smell to therapeutic effects: Garlic for cardiovascular, hepatic, gut, diabetes and chronic kidney disease. Clin. Nutr. 2021, 40, 4807–4819. [Google Scholar] [CrossRef]
- Azevedo, V.Z.; Dall’Alba, V. Fructose intake is not associated to the risk of hepatic fibrosis in patients with non-alcoholic fatty liver disease (NAFLD). Clin. Nutr. 2021, 40, 4275–4283. [Google Scholar] [CrossRef]
- Mazidi, M.; Kengne, A.P. Higher adherence to plant-based diets are associated with lower likelihood of fatty liver. Clin. Nutr. 2018, 38, 1672–1677. [Google Scholar] [CrossRef]
- Selmi, C.; Bowlus, C.L.; Keen, C.L.; Gershwin, M.E. Non-alcoholic fatty liver disease: The new epidemic and the need for novel nutritional approaches. J. Med. Food 2007, 10, 563–565. [Google Scholar] [CrossRef]
- Zadeh Hassani, S.; Mansoori, A.; Hosseinzadeh, M. Relationship between dietary patterns and non-alcoholic fatty liver disease: A systematic review and meta-analysis. J. Gastroenterol. Hepatol. 2020, 36, 1470–1478. [Google Scholar] [CrossRef]
- Amerikanou, C.; Kanoni, S.; Kaliora, A.C.; Barone, A.; Bjelan, M.; D’Auria, G.; Gioxari, A.; Gosalbes, M.J.; Mouchti, S.; Stathopoulou, M.G.; et al. Effect of mastiha supplementation on NAFLD: The mast4health randomised, controlled trial. Mol. Nutr. Food Res. 2021, 65, 2001178. [Google Scholar] [CrossRef]
- Bountziouka, V.; Bathrellou, E.; Giotopoulou, A.; Katsagoni, C.N.; Bonou, M.; Vallianou, N.; Barbetseas, J.; Avgerinos, P.; Panagiotakos, D. Development, repeatability and validity regarding energy and macronutrient intake of a semi-quantitative food frequency questionnaire: Methodological considerations. Nutr. Metab. Cardiovasc. Dis. 2012, 22, 659–667. [Google Scholar] [CrossRef]
- Idalsoaga, F.; Kulkarni, A.V.; Mousa, O.Y.; Arrese, M.; Arab, J.P. Non-alcoholic fatty liver disease and alcohol-related liver disease: Two intertwined entities. Front. Med. 2020, 7, 448. [Google Scholar] [CrossRef]
- Shen, Z.; Li, Y.M.; Yu, C.H.; Shen, Y.; Xu, L.; Xu, C.F.; Chen, J.J.; Ye, H.; Xu, G.Y. Risk factors for alcohol-related liver injury in the island population of China: A population-based case-control study. World J. Gastroenterol. 2008, 14, 2255–2261. [Google Scholar] [CrossRef]
- Lindström, J.; Tuomilehto, J. The Diabetes Risk Score: A practical tool to predict type 2 diabetes risk. Diabetes Care 2003, 26, 725–731. [Google Scholar] [CrossRef] [Green Version]
- Craig, C.L.; Marshall, A.L.; Sjöström, M.; Bauman, A.E.; Booth, M.L.; Ainsworth, B.E.; Pratt, M.; Ekelund, U.; Yngve, A.; Sallis, J.F.; et al. International Physical activity questionnaire: 12-country reliability and validity. Med. Sci. Sports Exerc. 2003, 35, 1381–1395. [Google Scholar] [CrossRef] [Green Version]
- Eddowes, P.J.; McDonald, N.; Davies, N.; Semple, S.I.K.; Kendall, T.; Hodson, J.; Newsome, P.N.; Flintham, R.; Wesolowski, R.; Blake, L.; et al. Utility and cost evaluation of multiparametric magnetic resonance imaging for the assessment of non-alcoholic fatty liver disease. Aliment. Pharmacol. Ther. 2017, 47, 631–644. [Google Scholar] [CrossRef] [Green Version]
- Pavlides, M.; Banerjee, R.; Sellwood, J.; Kelly, M.; Robson, M.D.; Booth, J.C.; Collier, J.; Neubauer, S.; Barnes, E. Multiparametric magnetic resonance imaging predicts clinical outcomes in patients with chronic liver disease. J. Hepatol. 2015, 64, 308–315. [Google Scholar] [CrossRef] [Green Version]
- Liu, S.; Willett, W.C.; Stampfer, M.J.; Hu, F.B.; Franz, M.; Sampson, L.; Hennekens, C.H.; Manson, J.E. A prospective study of dietary glycemic load, carbohydrate intake, and risk of coronary heart disease in US women. Am. J. Clin. Nutr. 2000, 71, 1455–1461. [Google Scholar] [CrossRef] [Green Version]
- Schwarz, J.M.; Linfoot, P.; Dare, D.; Aghajanian, K. Hepatic de novo lipogenesis in normoinsulinemic and hyperinsulinemic subjects consuming high-fat, low-carbohydrate and low-fat, high-carbohydrate isoenergetic diets. Am. J. Clin. Nutr. 2003, 77, 43–50. [Google Scholar] [CrossRef]
- Valtuena, S.; Pellegrini, N.; Ardigo, D.; Del Rio, D.; Numeroso, F.; Scazzina, F.; Monti, L.; Zavaroni, I.; Brighenti, F. Dietary glycemic index and liver steatosis. Am. J. Clin. Nutr. 2006, 84, 136–142. [Google Scholar] [CrossRef]
- Zelber-Sagi, S.; Ivancovsky-Wajcman, D.; Isakov, N.F.; Webb, M.; Orenstein, D.; Shibolet, O.; Kariv, R. High red and processed meat consumption is associated with non-alcoholic fatty liver disease and insulin resistance. J. Hepatol. 2018, 68, 1239–1246. [Google Scholar] [CrossRef]
- Mohammadi Doost, F.; Vazirinejad, R.; Rezaeian, M.; Vazirinejad, E.; Bastam, D.; Ahmadinia, H.; Najafipour, R. Fast food consumption and the risk of non-alcoholic fatty liver in adults: A community-based case-control study. J. Occup. Heal. Epidemiology 2019, 8, 176–184. [Google Scholar] [CrossRef]
- He, K.; Li, Y.; Guo, X.; Zhong, L.; Tang, S. Food groups and the likelihood of non-alcoholic fatty liver disease: A systematic review and meta-analysis. Br. J. Nutr. 2020, 124, 1–13. [Google Scholar] [CrossRef] [PubMed]
- Salehi-Sahlabadi, A.; Sadat, S.; Beigrezaei, S.; Pourmasomi, M.; Feizi, A.; Ghiasvand, R.; Hadi, A.; Clark, C.C.T.; Miraghajani, M. Dietary patterns and risk of non-alcoholic fatty liver disease. BMC Gastroenterol. 2021, 21, 1–12. [Google Scholar] [CrossRef]
- Honda, T.; Ishigami, M.; Luo, F.; Lingyun, M.; Ishizu, Y.; Kuzuya, T.; Hayashi, K.; Nakano, I.; Ishikawa, T.; Feng, G.G.; et al. Branched-chain amino acids alleviate hepatic steatosis and liver injury in choline-deficient high-fat diet induced NASH mice. Metabolism 2017, 69, 177–187. [Google Scholar] [CrossRef] [PubMed]
- Bortolotti, M.; Maiolo, E.; Corazza, M.; Van Dijke, E.; Schneiter, P.; Boss, A.; Carrel, G.; Giusti, V.; Lê, K.-A.; Chong Quo, D.G.; et al. Effects of a whey protein supplementation on intrahepatocellular lipids in obese female patients. Clin. Nutr. 2011, 30, 494–498. [Google Scholar] [CrossRef]
- Markova, M.; Pivovarova, O.; Hornemann, S.; Sucher, S.; Frahnow, T.; Wegner, K.; Machann, J.; Petzke, K.J.; Hierholzer, J.; Lichtinghagen, R.; et al. Isocaloric diets high in animal or plant protein reduce liver fat and inflammation in individuals with type 2 diabetes. Gastroenterology 2017, 152, 571–585.e8. [Google Scholar] [CrossRef] [Green Version]
- Dorosti, M.; Heidarloo Jafary, A.; Bakhshimoghaddam, F.; Alizadeh, M. Whole-grain consumption and its effects on hepatic steatosis and liver enzymes in patients with non-alcoholic fatty liver disease: A randomised controlled clinical trial. Br. J. Nutr. 2019, 123, 328–336. [Google Scholar] [CrossRef]
- Bahrami, A.; Teymoori, F.; Eslamparast, T.; Sohrab, G.; Hejazi, E.; Poustchi, H.; Hekmatdoost, A. Legume intake and risk of nonalcoholic fatty liver disease. Indian J. Gastroenterol. 2019, 38, 55–60. [Google Scholar] [CrossRef]
- Jiang, R.; Jacobs, D.R., Jr.; Mayer-Davis, E.; Szklo, M.; Herrington, D.; Jenny, N.S.; Kronmal, R.; Barr, R.G. Nut and Seed consumption and inflammatory markers in the multi-ethnic study of atherosclerosis. Am. J. Epidemiol. 2006, 163, 222–231. [Google Scholar] [CrossRef] [Green Version]
- Yu, Z.; Malik, V.S.; Keum, N.; Hu, F.B.; Giovannucci, E.L.; Stampfer, M.J.; Willett, W.C.; Fuchs, C.S.; Bao, Y. Associations between nut consumption and inflammatory biomarkers. Am. J. Clin. Nutr. 2016, 104, 722–728. [Google Scholar] [CrossRef] [PubMed] [Green Version]
- Kim, Y.; Keogh, J.B.; Clifton, P.M. Benefits of nut consumption on insulin resistance and cardiovascular risk factors: Multiple potential mechanisms of actions. Nutrients 2017, 9, 1271. [Google Scholar] [CrossRef] [Green Version]
- Gulati, S.; Misra, A.; Pandey, R.M.; Bhatt, S.P.; Saluja, S. Effects of pistachio nuts on body composition, metabolic, inflammatory and oxidative stress parameters in Asian Indians with metabolic syndrome: A 24-wk, randomized control trial. Nutrition 2014, 30, 192–197. [Google Scholar] [CrossRef] [PubMed]
- Gao, B.; Tsukamoto, H. Inflammation in alcoholic and nonalcoholic fatty liver disease: Friend or foe? Gastroenterology 2016, 150, 1704–1709. [Google Scholar] [CrossRef] [PubMed] [Green Version]
- Polimeni, L.; Del Ben, M.; Baratta, F.; Perri, L.; Albanese, F.; Pastori, D.; Violi, F.; Angelico, F. Oxidative stress: New insights on the association of non-alcoholic fatty liver disease and atherosclerosis. World J. Hepatol. 2015, 7, 1325–1336. [Google Scholar] [CrossRef] [PubMed]
- Sattar, N.; Forrest, E.; Preiss, D. Non-alcoholic fatty liver disease. BMJ 2014, 349, g4596. [Google Scholar] [CrossRef]
- Tzima, N.; Pitsavos, C.; Panagiotakos, D.B.; Chrysohoou, C.; Polychronopoulos, E.; Skoumas, J.; Stefanadis, C. Adherence to the Mediterranean diet moderates the association of aminotransferases with the prevalence of the metabolic syndrome; the ATTICA study. Nutr. Metab. 2009, 6, 30. [Google Scholar] [CrossRef] [PubMed] [Green Version]
- Jia, Q.; Xia, Y.; Zhang, Q.; Wu, H.; Du, H.; Liu, L.; Wang, C.; Shi, H.; Guo, X.; Liu, X.; et al. Dietary patterns are associated with prevalence of fatty liver disease in adults. Eur. J. Clin. Nutr. 2015, 69, 914–921. [Google Scholar] [CrossRef] [PubMed]


| Center of the Study | ||||
|---|---|---|---|---|
| Variables | GR (N: 38) | IT (N: 30) | SR (N: 29) | p-value |
| Age *** | 51.5 (14.5) | 47.5 (12.75) | 47 (20) | 0.352 |
| Sex (F|M) | 11|27 | 9|21 | 9|20 | 0.983 |
| Smoking (Yes|No) | 12|25 | 5|25 | 4|25 | 0.136 |
| BMI *** | 36.25 (7.12) † ꭅ | 32.22 (3.74) † | 32.19 (4.31) ꭅ | 0.003 |
| PAL (total) *** | 1463.25 (1479.22) ꭅ | 1188 (1179) ‡ | 3366.75 (6295.5) ꭅ‡ | 0.007 |
| FindRisk Score *** | 12.5 (4) | 13 (4) | 14 (6) | 0.641 |
| cT1 (ms) *** | 875.82 (107.11) | 843.83 (106.13) | 867.18 (67.56) | 0.542 |
| PDFF (%) *** | 12.52 (11.09) | 15.84 (18.73) | 15.73 (11.96) | 0.562 |
| LIF * | 2.49 (± 1.04) † | 2.01 (± 0.97) † | 2.26 (±0.54) | 0.019 |
| AST (IU/L) *** | 20 (7.75) † | 27 (11) † | 22 (13.5) | 0.012 |
| ALT (IU/L) *** | 26 (16) † | 45 (45) † | 35 (18) | 0.004 |
| AST/ALT ratio *** | 0.71 (0.26) | 0.66 (0.29) | 0.66 (0.27) | 0.204 |
| γ-gt (U/L) *** | 30 (13) | 41.5 (42.75) | 33 (32) | 0.175 |
| Total cholesterol (mg/dL) *** | 187.5 (42.25) | 198.5 (32.5) | 203 (71.1) | 0.176 |
| HDL (mg/dL) *** | 45 (12.75) | 45 (11.5) | 37.9 (12.4) | 0.096 |
| LDL (mg/dL) *** | 114 (24) | 121 (37.3) | 130.7 (58.7) | 0.072 |
| Triglycerides (mg/dl) *** | 133 (65.5) | 132.5 (103) | 147 (113.4) | 0.534 |
| Glucose (mg/dL) *** | 104 (13) | 102 (11.25) | 99 (14.4) | 0.284 |
| 120 min-OGTT Glucose (mg/dL) *** | 106 (39)ꭅ | 116 (41.5) ‡ | 144 (54) ‡ꭅ | 0.007 |
| HOMA-IR *** | 4.64 (3.28) | 5.51 (4.29) ‡ | 3.58 (2.5) ‡ | 0.018 |
| Insulin (μU/mL) *** | 16.9 (10.07) | 19.95 (19.05) ‡ | 14.7 (9) ‡ | 0.049 |
| Food Groups | High-Sugar Pattern | Prudent Pattern | Western Pattern | High-Fat and Salt Pattern | Plant-Based Pattern | Low-Fat Dairy and Poultry Pattern |
|---|---|---|---|---|---|---|
| Pies | 0.77 | |||||
| Dried fruits | 0.74 | |||||
| Processed meat | 0.71 | |||||
| Fruit juice | 0.63 | |||||
| Sweets | 0.59 | |||||
| Fruits | 0.45 | 0.43 | ||||
| Sea-food | 0.88 | |||||
| Fish | 0.69 | |||||
| Eggs | 0.59 | |||||
| Vegetable fat | 0.58 | |||||
| Vegetables | 0.48 | 0.53 | ||||
| Coffee and tea | 0.47 | |||||
| Sauces | 0.7 | |||||
| Dairy (high-fat) | 0.57 | 0.39 | ||||
| Soft drinks | 0.36 | 0.57 | ||||
| Animal and hydrogenated fats | 0.54 | |||||
| Salty snacks | 0.35 | |||||
| Refined grains | 0.39 | 0.61 | ||||
| Red meat | 0.44 | 0.59 | ||||
| Fast food | 0.37 | 0.53 | ||||
| Whole grains | 0.7 | |||||
| Pulses | 0.68 | |||||
| Nuts | 0.56 | 0.41 | ||||
| Dairy (low-fat) | 0.67 | |||||
| Poultry | 0.64 | |||||
| Percent (%) variance explained by each pattern | 14% | 13% | 8% | 8% | 7% | 6% |
| Western Pattern | Western Pattern | ||||||
|---|---|---|---|---|---|---|---|
| Low | Medium | High | |||||
| Variables | Beta (SE) | p-value | Beta (SE) | p-value | Beta (SE) | p-value | |
| Log- cT1 (ms) | |||||||
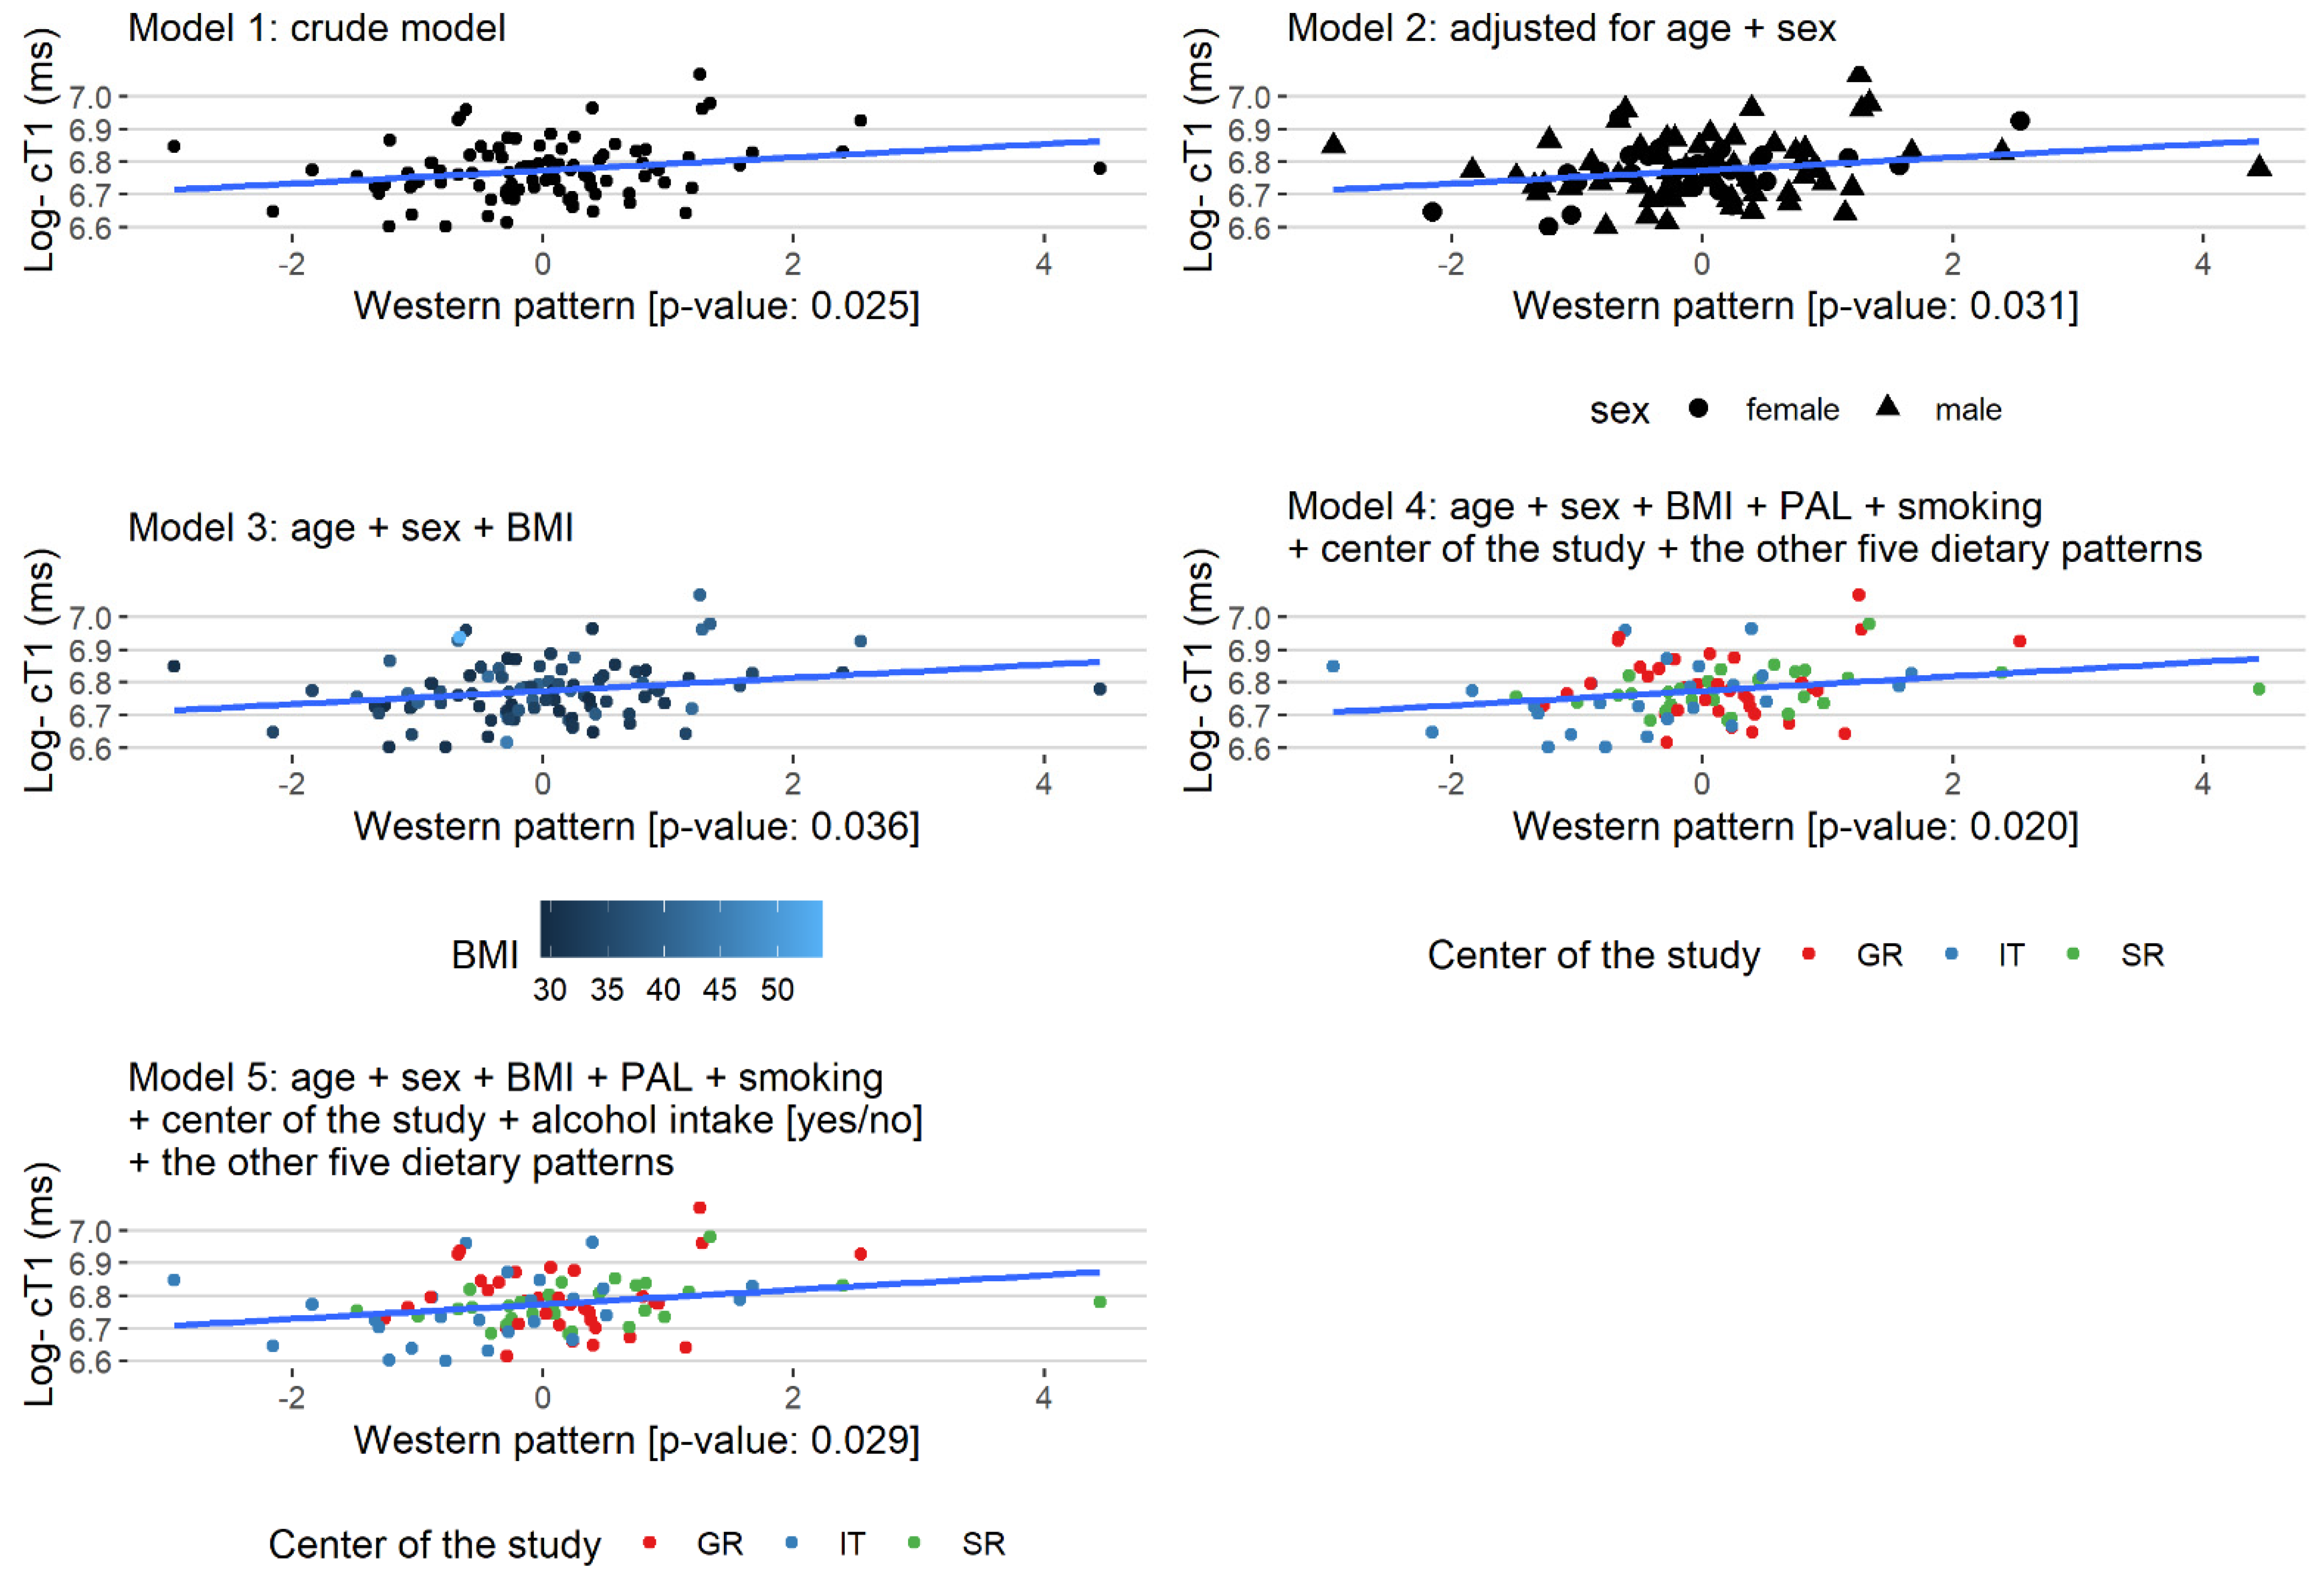
| Model 1 | Ref. | −0.003 (0.022) | 0.874 | 0.037 (0.022) | 0.104 | 0.020 (0.009) | 0.025 |
| Model 2 | Ref. | −0.004 (0.022) | 0.842 | 0.035 (0.023) | 0.134 | 0.020 (0.009) | 0.031 |
| Model 3 | Ref. | −0.007 (0.021) | 0.762 | 0.036 (0.022) | 0.108 | 0.019 (0.009) | 0.036 |
| Model 4 | Ref. | −0.003 (0.025) | 0.905 | 0.038 (0.027) | 0.173 | 0.024 (0.010) | 0.020 |
| Model 5 | Ref. | −0.003 (0.025) | 0.896 | 0.035 (0.028) | 0.211 | 0.024 (0.011) | 0.029 |
| Log-PDFF (%) | |||||||
| Model 1 | Ref. | −0.236 (0.180) | 0.192 | −0.059 (0.181) | 0.743 | 0.041 (0.074) | 0.581 |
| Model 2 | Ref. | −0.260 (0.176) | 0.143 | −0.087 (0.179) | 0.629 | 0.033 (0.072) | 0.649 |
| Model 3 | Ref. | −0.268 (0.176) | 0.132 | −0.088 (0.180) | 0.625 | 0.030 (0.073) | 0.679 |
| Model 4 | Ref. | −0.299 (0.200) | 0.141 | −0.090 (0.215) | 0.678 | 0.072 (0.085) | 0.401 |
| Model 5 | Ref | −0.296 (0.202) | 0.147 | −0.08 (0.22) | 0.719 | 0.081 (0.088) | 0.359 |
| LIF | |||||||
| Model 1 | Ref. | 0.023 (0.156) | 0.882 | 0.249 (0.160) | 0.123 | 0.121 (0.063) | 0.059 |
| Model 2 | Ref. | 0.020 (0.158) | 0.897 | 0.243 (0.164) | 0.142 | 0.119 (0.064) | 0.067 |
| Model 3 | Ref. | 0.005 (0.153) | 0.974 | 0.254 (0.158) | 0.113 | 0.111 (0.062) | 0.078 |
| Model 4 | Ref. | −0.049 (0.174) | 0.777 | 0.138 (0.192) | 0.473 | 0.105 (0.073) | 0.154 |
| Model 5 | Ref | −0.05 (0.175) | 0.775 | 0.13 (0.196) | 0.508 | 0.103 (0.075) | 0.175 |
| Low-Fat Dairy and Poultry Pattern | Low-Fat Dairy and Poultry Pattern | ||||||
| Low | Medium | High | |||||
| Variables | Beta (SE) | p-value | Beta (SE) | p-value | Beta (SE) | p-value | |
| Log- cT1 (ms) | |||||||
| Model 1 | Ref. | −0.047 (0.022) | 0.038 | −0.021 (0.022) | 0.343 | −0.008 (0.009) | 0.378 |
| Model 2 | Ref. | −0.045 (0.023) | 0.051 | −0.020 (0.023) | 0.380 | −0.008 (0.009) | 0.406 |
| Model 3 | Ref. | −0.043 (0.022) | 0.059 | −0.018 (0.022) | 0.416 | −0.011 (0.009) | 0.221 |
| Model 4 | Ref. | −0.052 (0.025) | 0.046 | −0.016 (0.023) | 0.499 | −0.012 (0.010) | 0.228 |
| Model 5 | Ref | −0.051 (0.026) | 0.051 | −0.016 (0.023) | 0.503 | −0.011 (0.010) | 0.239 |
| Log-PDFF (%) | |||||||
| Model 1 | Ref. | −0.459 (0.177) | 0.011 | −0.209 (0.178) | 0.243 | −0.042 (0.074) | 0.574 |
| Model 2 | Ref. | −0.392 (0.177) | 0.029 | −0.115 (0.181) | 0.525 | −0.017 (0.073) | 0.820 |
| Model 3 | Ref. | −0.387 (0.178) | 0.032 | −0.110 (0.181) | 0.547 | −0.023 (0.074) | 0.757 |
| Model 4 | Ref. | −0.448 (0.202) | 0.030 | −0.078 (0.191) | 0.686 | −0.023 (0.079) | 0.768 |
| Model 5 | Ref | −0.46 (0.204) | 0.027 | −0.076 (0.192) | 0.695 | −0.025 (0.08) | 0.756 |
| LIF | |||||||
| Model 1 | Ref. | −0.294 (0.158) | 0.066 | −0.125 (0.157) | 0.426 | −0.038 (0.064) | 0.554 |
| Model 2 | Ref. | −0.290 (0.163) | 0.079 | −0.123 (0.163) | 0.451 | −0.036 (0.066) | 0.583 |
| Model 3 | Ref. | −0.270 (0.159) | 0.092 | −0.109 (0.158) | 0.494 | −0.061 (0.064) | 0.342 |
| Model 4 | Ref. | −0.408 (0.178) | 0.025 | −0.125 (0.163) | 0.444 | −0.071 (0.067) | 0.297 |
| Model 5 | Ref | −0.412 (0.18) | 0.025 | −0.126 (0.164) | 0.446 | −0.07 (0.068) | 0.304 |
Publisher’s Note: MDPI stays neutral with regard to jurisdictional claims in published maps and institutional affiliations. |
© 2022 by the authors. Licensee MDPI, Basel, Switzerland. This article is an open access article distributed under the terms and conditions of the Creative Commons Attribution (CC BY) license (https://creativecommons.org/licenses/by/4.0/).
Share and Cite
Amanatidou, A.I.; Kaliora, A.C.; Amerikanou, C.; Stojanoski, S.; Milosevic, N.; Vezou, C.; Beribaka, M.; Banerjee, R.; Kalafati, I.-P.; Smyrnioudis, I.; et al. Association of Dietary Patterns with MRI Markers of Hepatic Inflammation and Fibrosis in the MAST4HEALTH Study. Int. J. Environ. Res. Public Health 2022, 19, 971. https://doi.org/10.3390/ijerph19020971
Amanatidou AI, Kaliora AC, Amerikanou C, Stojanoski S, Milosevic N, Vezou C, Beribaka M, Banerjee R, Kalafati I-P, Smyrnioudis I, et al. Association of Dietary Patterns with MRI Markers of Hepatic Inflammation and Fibrosis in the MAST4HEALTH Study. International Journal of Environmental Research and Public Health. 2022; 19(2):971. https://doi.org/10.3390/ijerph19020971
Chicago/Turabian StyleAmanatidou, Athina I., Andriana C. Kaliora, Charalampia Amerikanou, Stefan Stojanoski, Natasa Milosevic, Chara Vezou, Mirjana Beribaka, Rajarshi Banerjee, Ioanna-Panagiota Kalafati, Ilias Smyrnioudis, and et al. 2022. "Association of Dietary Patterns with MRI Markers of Hepatic Inflammation and Fibrosis in the MAST4HEALTH Study" International Journal of Environmental Research and Public Health 19, no. 2: 971. https://doi.org/10.3390/ijerph19020971