

Spatiotemporal Variations of Carbon Emissions and Their Driving Factors in the Yellow River Basin
Abstract
:1. Introduction
2. Materials and Methods
2.1. Study Area
2.2. Data Sources and Processing
2.3. Methods
2.3.1. Carbon-Emission Measurement
2.3.2. Spatial Autocorrelation Analysis
2.3.3. Explanatory Variables
2.3.4. Construction of Influencing Factor Model
- (1)
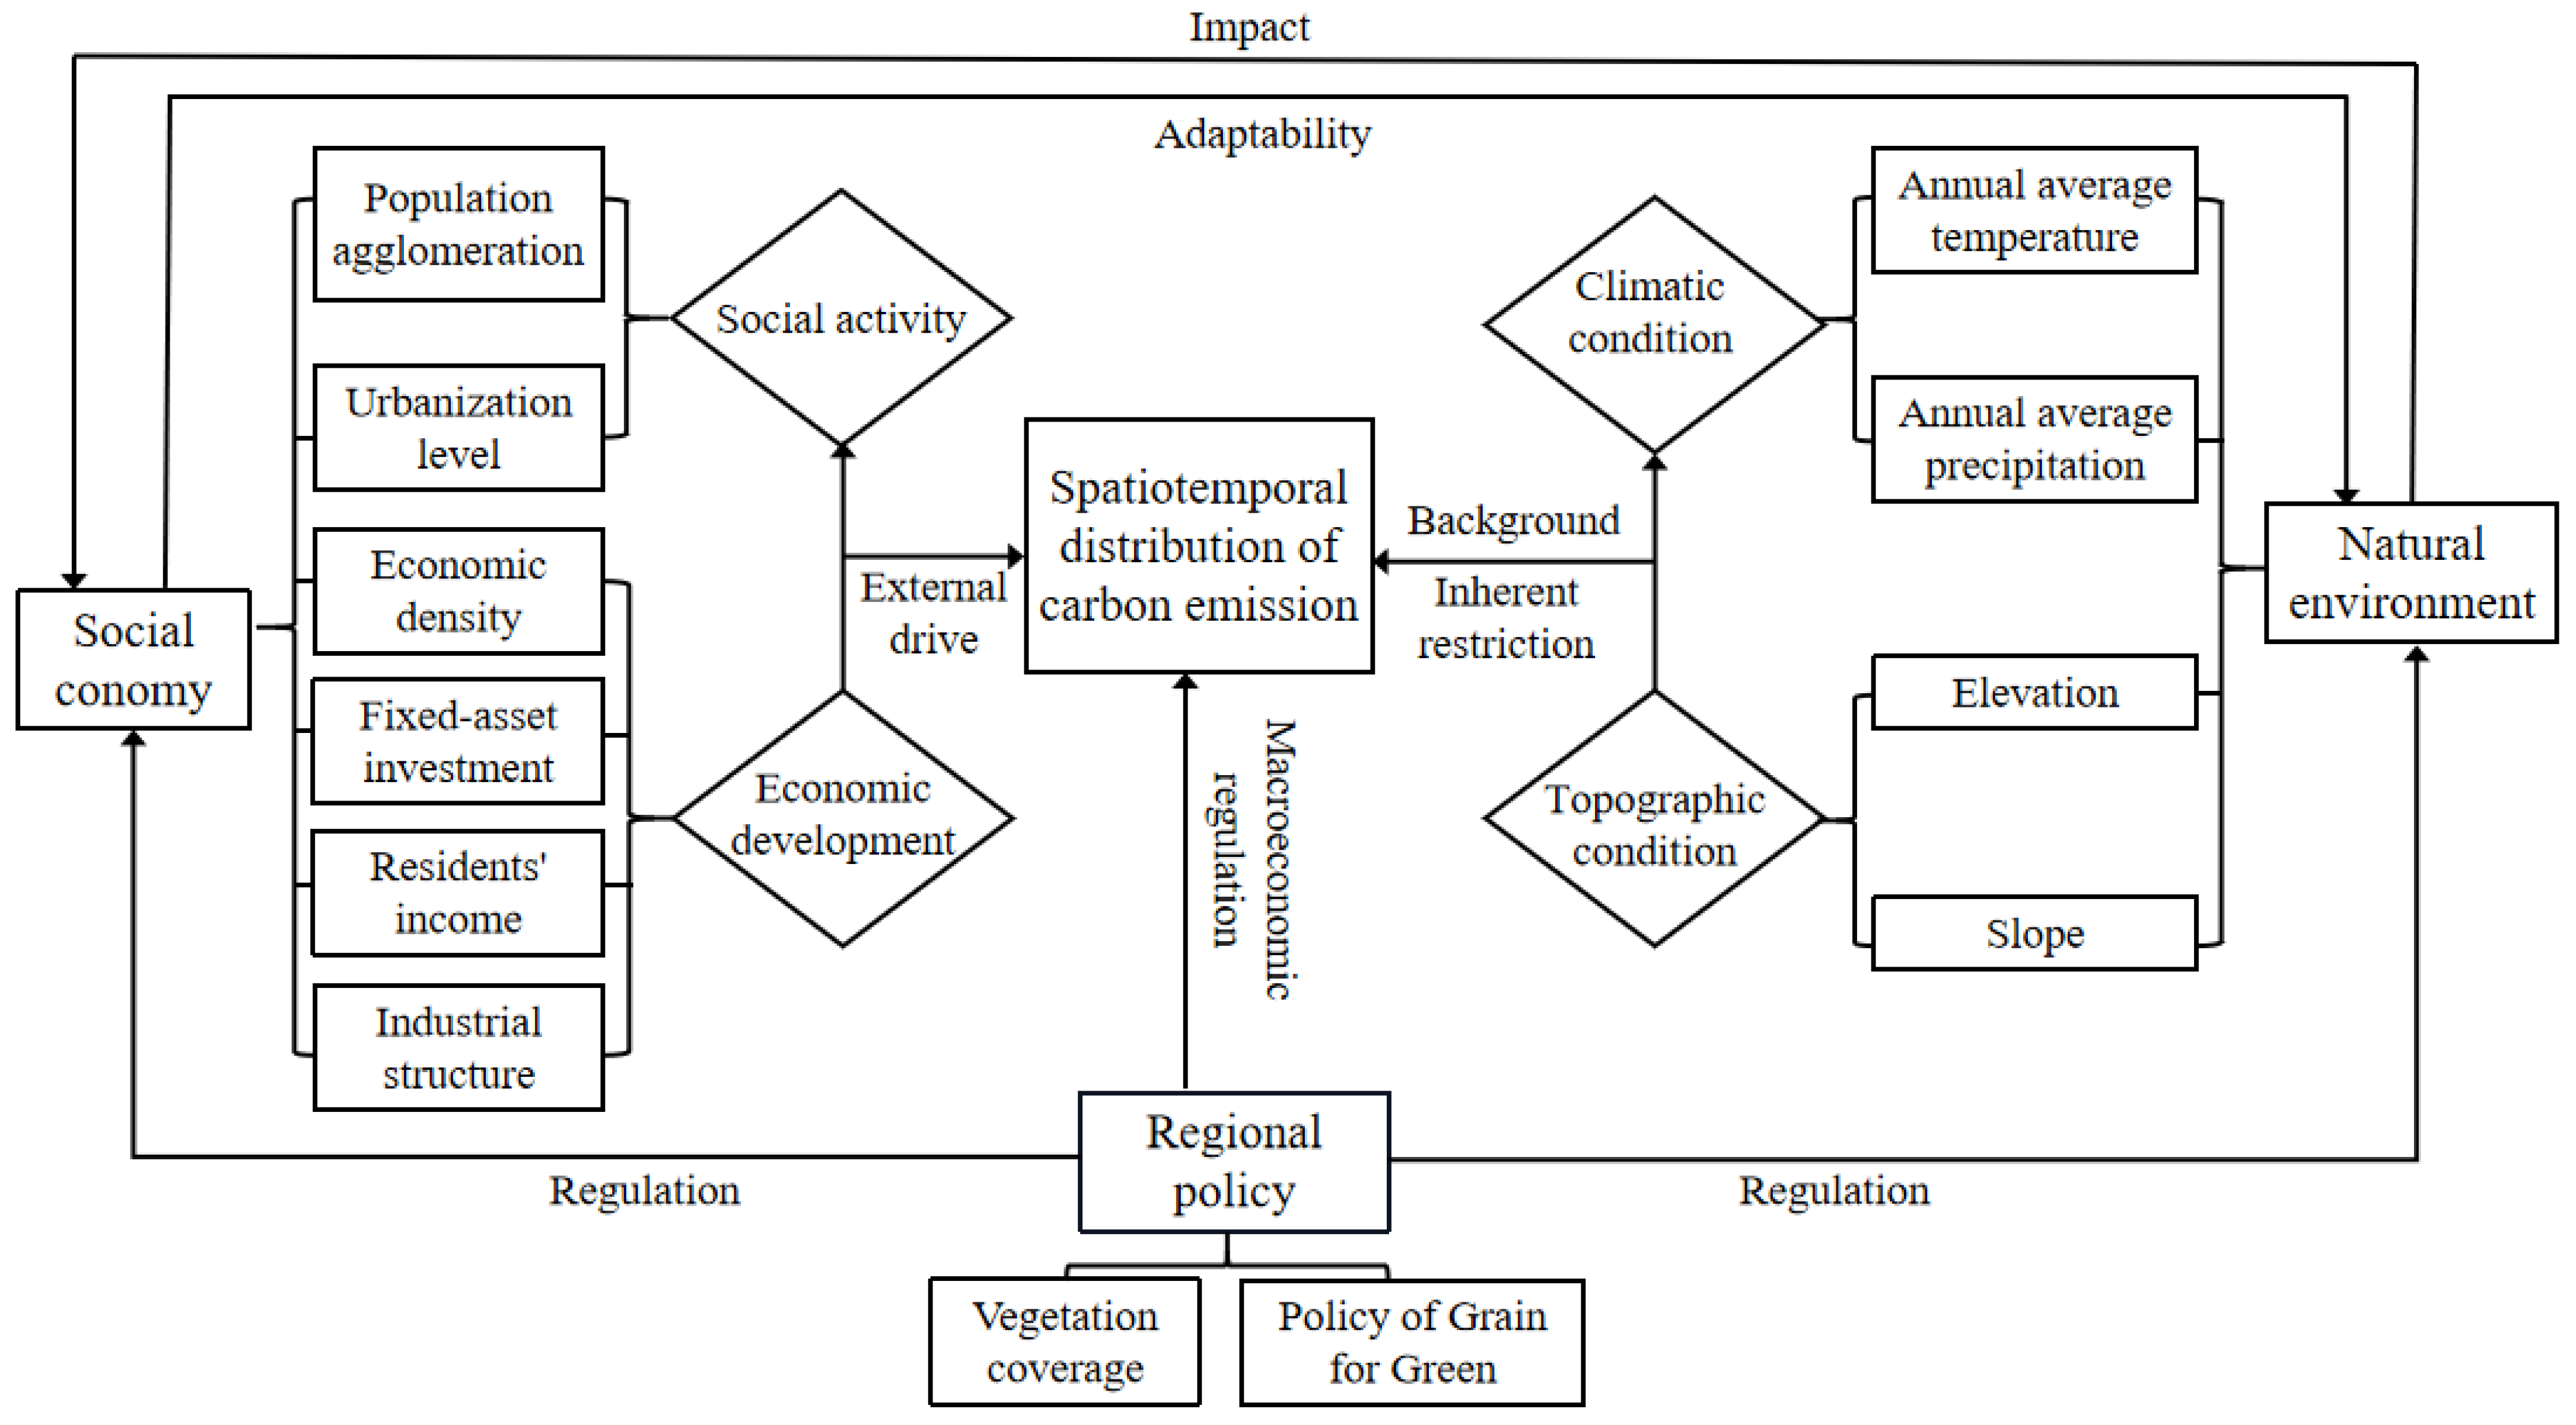
- Analysis framework of influencing mechanism
- (2)
- Selection of explanatory variables
- (3)
- Geographical detector
3. Results
3.1. Temporal Variations of Carbon Emissions in the YRB
3.1.1. Temporal Variations of Carbon Emissions in the Whole Basin
3.1.2. Temporal Variations of Carbon Emission in Different Reaches
3.2. Spatial Pattern Evolution of Carbon Emissions in the YRB
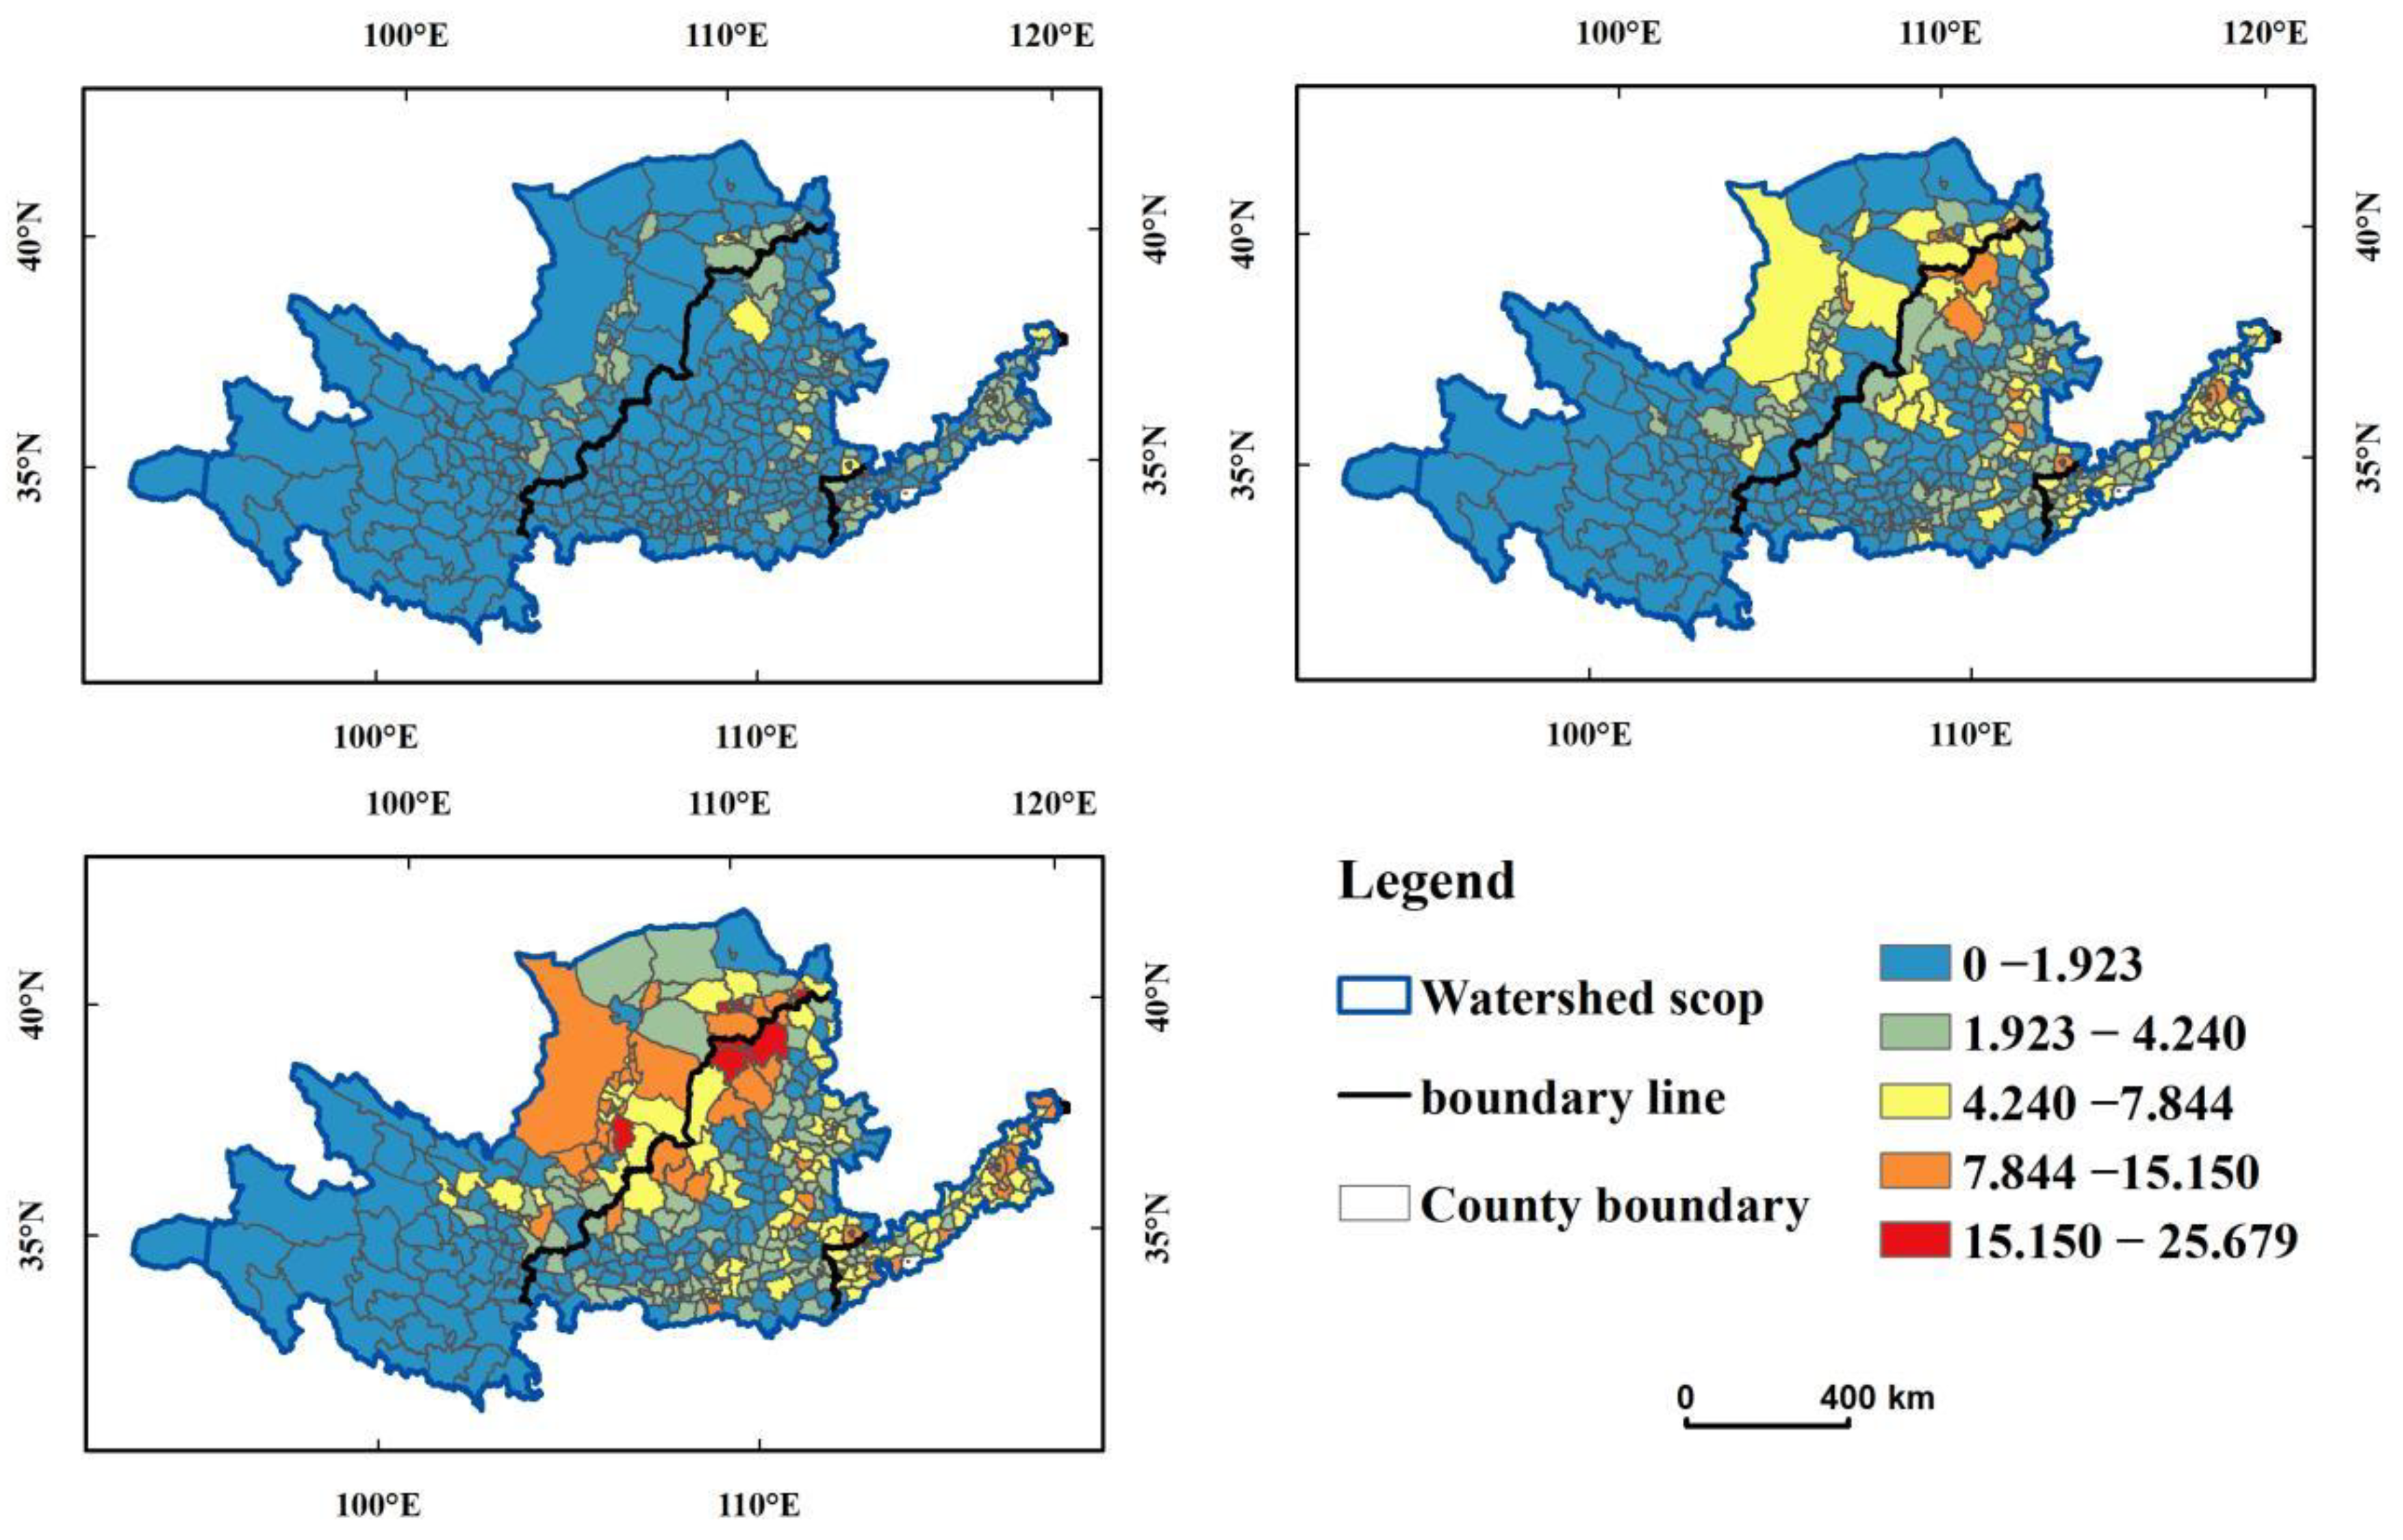
3.2.1. Overall Characteristics of Carbon Emissions
3.2.2. Spatial Agglomeration Characteristics of Carbon Emissions
3.3. Driving Factors of Spatiotemporal Variations in Carbon Emissions in the YRB
3.3.1. Driving Factor Detection
- (1)
- Natural environmental factors
- (2)
- Socioeconomic factors
- (3)
- Policy factors
3.3.2. Results of Interaction Detection
4. Discussion
4.1. Spatiotemporal Variation of Carbon Emissions in the YRB
4.2. Driving Factors of Carbon Emissions in the YRB
4.3. Limitations and Prospects
5. Conclusions
Author Contributions
Funding
Institutional Review Board Statement
Informed Consent Statement
Data Availability Statement
Conflicts of Interest
References
- Wang, P.; Feng, X.Z.; Wang, M.; An, Q.; Yang, R.P. The characteristic of carbon emission and its classification at provincial level in China. Environ. Sustain. Dev. 2021, 46, 31–36. (In Chinese) [Google Scholar]
- Sohail, A.; Du, J.F.; Abbasi, B.N.; Ahmed, Z. The nonlinearity and nonlinear convergence of CO2 emissions: Evidence from top 20 highest emitting countries. Environ. Sci. Pollut. Res. Int. 2022, 29, 59466–59482. [Google Scholar] [CrossRef] [PubMed]
- Zhang, H.M.; Yuan, P.F.; Zhu, Z.S. Decoupling effects of carbon emissions and reduction path in the Yellow River Basin. Resour. Sci. 2022, 44, 59–69. [Google Scholar] [CrossRef]
- Liu, Z.H.; Liu, J. Energy status and analysis on carbon emission factors in Baotou City during the 12th five-year: Based on grey correlation degree analysis. Environ. Monit. Forewarning 2017, 9, 14–18. (In Chinese) [Google Scholar]
- Jiang, M.H.; An, H.Z.; Gao, X.Y.; Jia, N.F.; Liu, S.Y. Structural decomposition analysis of global carbon emissions: The contributions of domestic and international input changes. J. Environ. Manag. 2021, 294, 112942. [Google Scholar] [CrossRef] [PubMed]
- Rajabi, K.N.; Shavvalpour, S. The driving forces of energy consumption and carbon dioxide emissions in Iran’s electricity sector: A decomposition analysis based on types of ownership. Clean. Environ. Syst. 2021, 2, 100012. [Google Scholar] [CrossRef]
- Ullah, S.; Ahmad, W.; Majeed, M.T.; Sohail, S. Asymmetric effects of premature deagriculturalization on economic growth and CO2 emissions: Fresh evidence from Pakistan. Environ. Sci. Pollut. Res. Int. 2021, 28, 66772–66786. [Google Scholar] [CrossRef] [PubMed]
- Thio, E.; Tan, M.X.; Li, L.; Salman, M.; Long, X.L.; Sun, H.P.; Zhu, B.Z. Correction to: The estimation of influencing factors for carbon emissions based on EKC hypothesis and STIRPAT model: Evidence from top 10 countries. Environ. Dev. Sustain. 2022, 24, 11226–11259. [Google Scholar] [CrossRef]
- Ma, C.H.; Zou, S.Y.; Zhao, J.; Wen, Q.; Mi, W.B. Temporal–spatial difference analysis of carbon emission from energy consumption and its regional type division in northeast China. Econ. Geogr. 2016, 36, 162–168. (In Chinese) [Google Scholar]
- Du, H.B.; Wei, W.; Zhang, X.Y.; Ji, X.P. Spatio-temporal evolution and influencing factors of energy-related carbon emissions in the Yellow River Basin: Based on the DMSP/OLS and NPP/VIIRS nighttime light data. Geogr. Res. 2021, 40, 2051–2065. (In Chinese) [Google Scholar]
- Heidari, E.; Bikdeli, S.; Daneshvar, M.R.M. A dynamic model for CO2 emissions induced by urban transportation during 2005–2030, a case study of Mashhad, Iran. Environ. Dev. Sustain. 2022. [CrossRef]
- Feng, Y.; Zhu, J.H.; Liu, H.Y.; Xiao, W.F. Prediction of spatial pattern of county-scale carbon budget based on land use change. Acta Agric. Univ. Jiangxiensis 2020, 42, 852–862. (In Chinese) [Google Scholar]
- Karmellos, M.; Kosmadakis, V.; Dimas, P.; Tsakanikas, A.; Fylaktos, N.; Taliotis, C.; Zachariadis, T. A decomposition and decoupling analysis of carbon dioxide emissions from electricity generation: Evidence from the EU-27 and the UK. Energy 2021, 231, 120861. [Google Scholar] [CrossRef]
- Hu, H.M.; Zuo, W.; Xu, S.Y. Decoupling effect and driving factors of transportation energy carbon emission in Yangtze River Economic Belt. Resour. Environ. Yangtze Basin 2022, 31, 862–877. (In Chinese) [Google Scholar]
- Qin, J.C.; Tao, H.; Zhan, M.J.; Mu, G.J. On influencing factors of carbon emissions in Xinjiang sectors and countermeasures for emission reduction. J. Saf. Environ. 2019, 19, 1375–1382. (In Chinese) [Google Scholar]
- Wang, D.; Li, J.Y. Regional differences and spatial convergence characteristics of carbon emissions intensity in China. Stat. Decis. 2022, 38, 77–80. (In Chinese) [Google Scholar]
- Khan, Y.; Oubaih, H.; Elgourrami, F.Z. The effect of renewable energy sources on carbon dioxide emissions: Evaluating the role of governance, and ICT in Morocco. Renew. Energy 2022, 190, 752–763. [Google Scholar] [CrossRef]
- Lan, Y.W.; Guo, L.J.; Li, S. Situation analysis of carbon emissions driving factors decomposition and its peak reaching: Based on Henan Province. Energy Environ. 2021, 6, 7–11. (In Chinese) [Google Scholar]
- Kirago, L.; Gatari, M.J.; Gustafsson, Ö.; Andersson, A. Black carbon emissions from traffic contribute substantially to air pollution in Nairobi, Kenya. Commun. Earth Environ. 2022, 3, 74. [Google Scholar] [CrossRef]
- Wang, S.J.; Xie, Z.H.; Wang, Z.H. The spatiotemporal pattern evolution and influencing factors of CO2 emissions at the county level of China. Acta Geogr. Sin. 2021, 76, 3103–3118. (In Chinese) [Google Scholar]
- Li, J.B.; Huang, X.; Chuai, X.; Yang, H. The impact of land urbanization on carbon dioxide emissions in the Yangtze River Delta, China: A multiscale perspective. Cities 2021, 116, 103275. [Google Scholar] [CrossRef]
- Zhong, W.W.; Gao, H.; Xu, W.J.; Yu, X.J. Exploring carbon peaking pathways and trends from a multiclustering perspective: Analysis based on panel data of 21 cities in Guangdong Province. S. China J. Econ. 2021, 12, 58–79. (In Chinese) [Google Scholar]
- Xia, S.Y.; Yang, Y. Spatio-temporal differentiation of carbon budget and carbon compensation zoning in Beijing-Tianjin-Hebei Urban Agglomeration based on Major Function-oriented Zones. Acta Geogr. Sin. 2021, 77, 679–696. (In Chinese) [Google Scholar]
- Gao, C.X.; Tao, S.M.; He, Y.Y.; Su, B.; Sun, M.; Mensah, L.A. Effect of population migration on spatial carbon emission transfers in China. Energy Policy 2021, 156, 112450. [Google Scholar] [CrossRef]
- Halder, S.; Tiwari, Y.K.; Valsala, V.; Sreeush, M.G.; Sijikumar, S.; Janardanan, R.; Maksyutov, S. Quantification of Enhancement in Atmospheric CO2 Background Due to Indian Biospheric Fluxes and Fossil Fuel Emissions. J. Geophys. Res. D Atmos. 2021, 126, e2021JD034545. [Google Scholar] [CrossRef]
- Sufyanullah, K.; Ahmad, K.A.; Sufyan, A.M.A. Does emission of carbon dioxide is impacted by urbanization? An empirical study of urbanization, energy consumption, economic growth and carbon emissions-Using ARDL bound testing approach. Energy Policy 2022, 164, 112908. [Google Scholar] [CrossRef]
- Van Marle, M.J.E.; van Wees, D.; Houghton, R.A.; Field, R.D.; Verbesselt, J.; van der Werf, G.R. New land-use-change emissions indicate a declining CO2 airborne fraction. Nature 2022, 603, 450–454. [Google Scholar] [CrossRef] [PubMed]
- Murshed, M.; Saboori, B.; Madaleno, M.; Wang, H.; Doğan, B. Exploring the nexuses between nuclear energy, renewable energy, and carbon dioxide emissions: The role of economic complexity in the G7 countries. Renew. Energy 2022, 190, 664–674. [Google Scholar] [CrossRef]
- Lv, Q.; Liu, H.B. Multiscale spatio-temporal characteristics of carbon emission of energy consuption in Yellow River Basin based on the nighttime light datasets. Econ. Geogr. 2020, 40, 12–21. (In Chinese) [Google Scholar]
- Ma, Y.; Liu, Z.Z. Study on the sptoal-temporal evolution and influencing factors of land use carbon emissions in the Yellow River Basin. Ecol. Econ. 2021, 37, 35–43. (In Chinese) [Google Scholar]
- Huang, G.Q.; Wang, Z.L.; Shi, P.F.; Zhou, Y. Measurement and spatial heterogeneity of tourism carbon emission and its decoupling effects: A case study of the Yellow River Basin. China Soft Sci. 2021, 4, 82–93. (In Chinese) [Google Scholar]
- Gao, X.C.; Han, X. Study on the spatial differentiation and influencing factors of carbon emissions in the Yellow River Basin. Econ. Surv. 2022, 39, 13–23. (In Chinese) [Google Scholar]
- Mo, H.B.; Wang, S.J. Spatiao-temporal evolution and spatial effect mechanism of carbon emission at county level in the Yellow River Basin. Sci. Geogr. Sin. 2021, 41, 1324–1335. (In Chinese) [Google Scholar]
- Ma, M.J.; Li, Q.; Zhou, W.R. Study of carbon ecological compensation in Yellow River Basin Based on carbon neutrality. Yellow River 2021, 43, 5–11. (In Chinese) [Google Scholar]
- Wang, L.D.; Wu, L.Y.; Chen, Y.L.; Ma, X.Z.; Du, M.N. Carbon peak time and level of relevent provinces in the Yellow River Basin under stable economic growth. Resour. Sci. 2021, 43, 2331–2341. (In Chinese) [Google Scholar]
- Li, Q.Q.; Cao, Y.P.; Miao, S.L. Spatio-temporal variation in vegetation coverage and its response to climate factors in the Yellow River Basin, China. Acta Ecol. Sin. 2022, 10, 54–64. (In Chinese) [Google Scholar]
- Mou, X.J.; Zhang, X.; Wang, X.H.; Wang, J.N.; Rao, S.; Huang, J.; Chai, H.X. Ecological change assessment and protection strategy in the Yellow River Basin. Strat. Study Chin. Acad. Eng. 2022, 24, 113–121. (In Chinese) [Google Scholar]
- Chen, J.; Gao, M.; Cheng, S.; Hou, W.X.; Song, M.L. County-level CO2 emissions and sequestration in China during 1997–2017. Sci. Data. 2020, 7, 391. [Google Scholar] [CrossRef]
- Xue, X.D.; Gao, J.L. Analysis of spatial correlation between ecological footprint of cultivated land and food security in main grain production areas. Ecol. Econ. 2021, 37, 93–99. (In Chinese) [Google Scholar]
- Ren, P.; Wu, T.; Zhou, J.M. Analysis of spatial distribution pattern and evolutionary characteristics of cultivated lands based on spatial autocorrelation model and GIS platform—A case study of Longquanyi District, Chengdu, China. Chin. J. Eco-Agric. 2016, 24, 325–334. (In Chinese) [Google Scholar]
- Zhang, Y.N.; Long, H.L.; Tu, S.S.; Ge, D.Z.; Wang, D.Y. Study on the hot spots and dynamic mechanism of land use transition in Poyang Lake Eco-economic Zone. Ecol. Environ. Sci. 2016, 25, 1828–1835. (In Chinese) [Google Scholar]
- Liu, Y.K.; Jin, S.T. Temperal and spatial evolution charactristic and influencing factors of energy consumption carbon emissions in six provinces of central China. Econ. Geogr. 2019, 39, 182–191. (In Chinese) [Google Scholar]
- Chen, Y.L.; Zou, W.M. Temporal-spatial characteristics of PM2.5 and impact factors analysis in Yangtze River Delta from 2015 to 2019. J. Saf. Environ. 2022, 22, 476–485. (In Chinese) [Google Scholar]
- Wang, J.F.; Xu, C.D. Geodetector: Principle and prospective. Acta Geogr. Sin. 2017, 72, 116–134. (In Chinese) [Google Scholar]
- Wang, R.; Zhang, H.; Qiang, W.L.; Li, F.; Peng, J.Y. Spatial characteristics and influencing factors of carbon emissions in country-level cities of China based on urbanization. Prog. Geogr. 2021, 40, 1999–2010. (In Chinese) [Google Scholar] [CrossRef]
- Liu, H.J.; Shao, M.J.; Ji, Y.M. The spatial pattern and distribution dynamic evolution of carbon emissions in China: Empirical study based on county carbon emission data. Sci. Geogr. Sin. 2021, 41, 1917–1924. (In Chinese) [Google Scholar]
- Yu, W.M.; Zhang, T.T.; Shen, D.J. County-level spatial pattern and influencing factors evolution of carbon emision intensity in China: A random forest model analysis. China Environ. Sci. 2022, 42, 2788–2798. (In Chinese) [Google Scholar]
- Li, Y.L.; Wang, J.L.; Yang, L. Study on temporal and spatial characteristics of agricultural carbon emissions in Hunan province at county scale. Chin. J. Agric. Resour. Reg. Plann. 2022, 43, 75–78. (In Chinese) [Google Scholar]
- Wu, R.; Wang, J.Y.; Wang, S.J.; Feng, K.S. The drivers of declining CO2 emissions trends in developed nations using an extended STIRPAT model: A historical and prospective analysis. Renew. Sustain. Energy Rev. (In Chinese). 2021, 149, 111328. [Google Scholar] [CrossRef]
- Zhou, Y.F.; Li, B.; Zhang, R.Q. Spatiotemporal evolution and influencing factors of agricultural carbon emissions in Hebei Province at the county scale. Chin. J. Eco-Agric. (In Chinese). 2022, 30, 570–581. [Google Scholar] [CrossRef]
- Liu, Y.; Liu, H.B. Characteristics, influence factors, and prediction of agricultural carbon emissions in Shandong Province. Chin. J. Eco-Agric. (In Chinese). 2022, 30, 558–569. [Google Scholar] [CrossRef]
- Zhang, C.L.; Zhang, F. The impact of ecological protection and industrial structure upgrading on carbon emissions—based on the data of the Yangtze River Economic Belt. Stat. Decis. 2022, 38, 77–80. (In Chinese) [Google Scholar]
- Wang, Y.; Zeng, X. Governance mechanisms of industrial carbon emissions in heavy industrial zones under environmental justice based on evolutionary game perspective. Chin. J. Appl. Ecol. (In Chinese). 2022. [CrossRef]
- Deng, X.Z.; Jiang, S.J.; Li, X.; Zhao, H.P.; Han, Z.; Dong, J.W.; Sun, Z.G.; Chen, M.X. Dynamics of regional land uses affecting spatial heterogeneity of surface CO2 concentration. Acta Geogr. Sin. 2022, 77, 936–946. (In Chinese) [Google Scholar]


| Data Type | Data Sources |
|---|---|
| Carbon emissions data | China Carbon Accounting Database (https://www.ceads.net/), (accessed on 1 May 2022) |
| Defense Meteorological Program/Operational Line-Scan System (DMSP/OLS; 2000–2013) | Resource and Environmental Science and Data Center (https://www.resdc.cn/), (accessed on 1 May 2022) |
| Suomi National Polar-Orbiting Partnership/Visible Infrared Imaging Radiometer Suite (Suomi NPP/VIRRS; 2013–2020) nighttime lighting data | National Geophysical Data Center (http://www.geodata.cn/), (accessed on 1 May 2022) |
| Meteorological data | China Meteorological Science Data Sharing Service Network (http://cdc.cma.gov.cn/), (accessed on 1 May 2022) |
| Socioeconomic statistics | Statistical Yearbooks, Statistical Communiques, and China County Statistical Yearbooks of the provinces and regions in the YRB |
| Driving Factor | Explanatory Variable | Impact Factor | Interpretation |
|---|---|---|---|
| Natural environmental factors | Climate condition | X1 Annual average temperature (°C) | Value of each unit obtained by the method of Kring with ArcGIS software |
| X2 Annual average precipitation (mm) | Value of each unit obtained by the method of Kring with ArcGIS software | ||
| Topographic condition | X3 Elevation (m) | Digital elevation map (DEM) data of all counties (cities, districts and flags) in the Yellow River Basin (YRB) obtained by analysis tool with ArcGIS software | |
| X4 Slope (°) | Average slope of each regional unit extracted based on DEM data | ||
| Socioeconomic factors | Population size | X5 Population density (people/km2) | Total population divided by the total regional area |
| X6 Population urbanization rate (%) | Proportion of nonagricultural population in all regions | ||
| Economic level | X7 Economic density (×109 RMB/km2) | Gross domestic product divided by the total regional area | |
| X8 Average fixed-asset investment (×108 RMB/km2) | Fixed-asset investment divided by the total regional area | ||
| X9 Second industry ratio (%) | Proportion of secondary industries | ||
| X10 Tertiary industry ratio (%) | Proportion of tertiary industries | ||
| X11 Disposable income of urban residents (RMB) | Disposable income of urban residents in each regional unit | ||
| X12 Disposable income of rural residents (RMB) | Disposable income of rural residents in each regional unit | ||
| Regional policy factors | Vegetation coverage | X13 Normalized Differentiation Vegetation Index (NDVI) | Normalized vegetation index obtained by spatial interpolation method with ArcGIS |
| Policy of Grain for Green | X14 Area of returning cultivated land (km2) | Conversion area extracted from cultivated land to ecological land (forest land, grassland, water area) with ArcGIS |
| Interaction Types | Condition |
|---|---|
| nonlinear weakening | q(X1∩X2) < Min(q(X1),q(X2)) |
| single-factor nonlinear weakening | Min(q(X1),q(X2)) < q(X1∩X2) < Max(q(X1),q(X2)) |
| double-factor enhancement | q(X1∩X2) > Max(q(X1),q(X2)) |
| independent | q(X1∩X2) = q(X1)+q(X2) |
| nonlinear enhancement | q(X1∩X2) > q(X1)+q(X2) |
| Region | Carbon Emissions in 2000/Million Tons | Carbon Emissions in 2010/Million Tons | Carbon Emissions in 2020/Million Tons | 2000–2020 | |
|---|---|---|---|---|---|
| Variation/Million Tons | Change Rate/% | ||||
| Whole basin | 495.65 | 1023.03 | 1628.87 | 1133.22 | 228.64 |
| Upper reaches | 147.89 | 324.93 | 645.08 | 497.19 | 336.18 |
| Middle reaches | 190.45 | 395.24 | 582.30 | 391.58 | 205.60 |
| Lower reaches | 157.30 | 302.87 | 401.76 | 244.46 | 155.41 |
| Year | Global Moran’s I | E(Gi*) | Z(Gi*) | p |
|---|---|---|---|---|
| 2000 | 0.249 | –0.004 | 8.952 | 0.000 |
| 2010 | 0.239 | –0.004 | 9.090 | 0.000 |
| 2020 | 0.210 | –0.004 | 8.818 | 0.000 |
| Impact Factor | 2000 | 2010 | 2020 | |||||||||
|---|---|---|---|---|---|---|---|---|---|---|---|---|
| Whole Basin | Upper Reaches | Middle Reaches | Lower Reaches | Whole Basin | Upper Reaches | Middle Reaches | Lower Reaches | Whole Basin | Upper Reaches | Middle Reaches | Lower Reaches | |
| X1 | 0.140 *** | 0.189 *** | 0.017 | 0.222 *** | 0.111 *** | 0.162 *** | 0.022 | 0.179 ** | 0.123 *** | 0.132 *** | 0.056 * | 0.147 ** |
| X2 | 0.067 *** | 0.192 *** | 0.031 | 0.212 *** | 0.109 *** | 0.432 *** | 0.091 | 0.077 ** | 0.087 *** | 0.180 *** | 0.103 *** | 0.036 |
| X3 | 0.188 *** | 0.344 *** | 0.039 | 0.005 | 0.173 *** | 0.381 *** | 0.014 | 0.001 | 0.130 *** | 0.111 *** | 0.017 | 0.002 |
| X4 | 0.171 *** | 0.233 *** | 0.092 * | 0.063 | 0.181 *** | 0.326 *** | 0.074 | 0.063 | 0.180 *** | 0.120 *** | 0.060 | 0.044 |
| X5 | 0.212 *** | 0.133 *** | 0.246 *** | 0.222 * | 0.197 *** | 0.098 | 0.221 *** | 0.336 *** | 0.133 *** | 0.159 ** | 0.185 *** | 0.268 *** |
| X6 | 0.009 | 0.212 *** | 0.017 | 0.131 | 0.068 *** | 0.244 *** | 0.133 *** | 0.041 | 0.121 *** | 0.087 *** | 0.137 *** | 0.177 ** |
| X7 | 0.099 | 0.007 | 0.001 | 0.305 | 0.430 *** | 0.539 *** | 0.296 *** | 0.396 *** | 0.297 *** | 0.591 *** | 0.292 *** | 0.368 ** |
| X8 | 0.010 | 0.001 | 0.052 | 0.026 | 0.387 *** | 0.550 *** | 0.219 *** | 0.497 *** | 0.113 *** | 0.334 *** | 0.084 | 0.252 * |
| X9 | 0.055 | 0.004 | 0.007 | 0.161 | 0.365 *** | 0.532 *** | 0.271 *** | 0.118 | 0.193 *** | 0.428 *** | 0.189 ** | 0.228 |
| X10 | 0.063 * | 0.001 | 0.013 | 0.164 * | 0.348 *** | 0.424 *** | 0.171 * | 0.266 * | 0.214 *** | 0.452 *** | 0.100 * | 0.290 * |
| X11 | 0.001 | 0.049 | 0.001 | 0.019 | 0.025 ** | 0.068 ** | 0.031 | 0.005 | 0.160 *** | 0.448 *** | 0.088 ** | 0.092 |
| X12 | 0.001 | 0.001 | 0.005 | 0.019 | 0.181 *** | 0.205 *** | 0.235 *** | 0.139 ** | 0.163 *** | 0.370 *** | 0.139 *** | 0.180 ** |
| X13 | 0.013 | 0.211 *** | 0.087 * | 0.147 | 0.060 ** | 0.255 *** | 0.104* | 0.047 | 0.104 *** | 0.053 *** | 0.077 | 0.125 |
| X14 | 0.050 *** | 0.057 | 0.004 | 0.035 | 0.016 | 0.090 ** | 0.011 | 0.222 ** | 0.015 | 0.049 | 0.001 | 0.110 ** |
| Year | * Whole Basin | Upper Reaches | Middle Reaches | Lower Reaches | ||||
|---|---|---|---|---|---|---|---|---|
| Interactive Factors | Interactive Value | Interactive Factors | Interactive Value | Interactive Factors | Interactive Value | Interactive Factors | Interactive Value | |
| 2000a | X1∩X5 | 0.359 * | X3∩X14 | 0.484 * | X4∩X5 | 0.456 * | X4∩X5 | 0.622 * |
| X4∩X5 | 0.351 ** | X4∩X6 | 0.471 ** | X13∩X5 | 0.422 * | X1∩X5 | 0.562 * | |
| X4∩X3 | 0.347 ** | X2∩X3 | 0.463 ** | X1∩X5 | 0.406 * | X13∩X5 | 0.557 * | |
| X1∩X3 | 0.340 * | X13∩X3 | 0.441 ** | X2∩X5 | 0.369 * | X13∩X4 | 0.538 * | |
| X13∩X5 | 0.336 * | X1∩X3 | 0.440 ** | X6∩X5 | 0.362 * | X7∩X5 | 0.536 ** | |
| X2∩X5 | 0.324 * | X13∩X6 | 0.423 ** | X3∩X5 | 0.329 * | X6∩X5 | 0.531 * | |
| X3∩X5 | 0.312 ** | X3∩X5 | 0.403 ** | X8∩X5 | 0.265 ** | X9∩X13 | 0.510 * | |
| X2∩X3 | 0.300 * | X1∩X6 | 0.398 ** | X12∩X5 | 0.265 * | X9∩X5 | 0.502 * | |
| X1∩X2 | 0.295 * | X6∩X14 | 0.392 * | X2∩X6 | 0.253 * | X13∩X7 | 0.496 * | |
| X1∩X4 | 0.291 ** | X13∩X4 | 0.386 ** | X11∩X5 | 0.252 ** | X10∩X5 | 0.490 * | |
| 2010a | X1∩X7 | 0.550 * | X9∩X6 | 0.725 ** | X6∩X5 | 0.555 * | X13∩X8 | 0.695 * |
| X2∩X7 | 0.548 * | X2∩X7 | 0.724 ** | X6∩X7 | 0.532 * | X13∩X7 | 0.653 * | |
| X6∩X7 | 0.541 ** | X13∩X7 | 0.721 ** | X6∩X8 | 0.507 * | X8∩X5 | 0.652 ** | |
| X4∩X7 | 0.536 ** | X6∩X7 | 0.718 ** | X9∩X5 | 0.503 ** | X10∩X7 | 0.639 ** | |
| X10∩X7 | 0.532 ** | X14∩X7 | 0.707 * | X12∩X7 | 0.485 ** | X8∩X7 | 0.604 ** | |
| X13∩X7 | 0.528 * | X4∩X7 | 0.705 ** | X12∩X5 | 0.468 ** | X9∩X8 | 0.584 ** | |
| X9∩X8 | 0.522 ** | X14∩X9 | 0.703 * | X9∩X8 | 0.455 ** | X10∩X8 | 0.582 ** | |
| X7∩X5 | 0.521 ** | X4∩X8 | 0.702 ** | X7∩X5 | 0.453 ** | X6∩X7 | 0.577 * | |
| X10∩X8 | 0.521 ** | X9∩X4 | 0.701 ** | X9∩X13 | 0.451 * | X6∩X5 | 0.569 * | |
| X3∩X7 | 0.518 ** | X9∩X3 | 0.692 ** | X9∩X6 | 0.445 * | X2∩X8 | 0.567 ** | |
| 2020a | X2∩X7 | 0.592 * | X4∩X7 | 0.777 ** | X2∩X7 | 0.531* | X8∩X5 | 0.726 * |
| X1∩X7 | 0.519 * | X11∩X4 | 0.734 ** | X9∩X8 | 0.529 * | X10∩X5 | 0.657 * | |
| X7∩X5 | 0.492 * | X7∩X5 | 0.732 * | X9∩X5 | 0.519 * | X13∩X7 | 0.640 * | |
| X3∩X7 | 0.476 * | X10∩X13 | 0.712 * | X9∩X2 | 0.519 * | X6∩X5 | 0.634 * | |
| X10∩X7 | 0.473 ** | X11∩X9 | 0.712 ** | X9∩X7 | 0.484 ** | X8∩X7 | 0.633 ** | |
| X8∩X7 | 0.462 * | X10∩X7 | 0.711 ** | X9∩X6 | 0.477 * | X10∩X6 | 0.633 * | |
| X13∩X7 | 0.460 * | X11∩X7 | 0.711* * | X2∩X5 | 0.462 * | X10∩X8 | 0.628 * | |
| X9∩X2 | 0.449 * | X13∩X7 | 0.710 ** | X1∩X7 | 0.454 * | X6∩X7 | 0.619 * | |
| X11∩X7 | 0.448 ** | X9∩X7 | 0.707 ** | X9∩X13 | 0.453 * | X10∩X13 | 0.609 * | |
| X4∩X7 | 0.446 ** | X8∩X7 | 0.706 ** | X4∩X7 | 0.443 * | X9∩X8 | 0.592 * | |
Publisher’s Note: MDPI stays neutral with regard to jurisdictional claims in published maps and institutional affiliations. |
© 2022 by the authors. Licensee MDPI, Basel, Switzerland. This article is an open access article distributed under the terms and conditions of the Creative Commons Attribution (CC BY) license (https://creativecommons.org/licenses/by/4.0/).
Share and Cite
Wang, S.; Sun, P.; Sun, H.; Liu, Q.; Liu, S.; Lu, D. Spatiotemporal Variations of Carbon Emissions and Their Driving Factors in the Yellow River Basin. Int. J. Environ. Res. Public Health 2022, 19, 12884. https://doi.org/10.3390/ijerph191912884
Wang S, Sun P, Sun H, Liu Q, Liu S, Lu D. Spatiotemporal Variations of Carbon Emissions and Their Driving Factors in the Yellow River Basin. International Journal of Environmental Research and Public Health. 2022; 19(19):12884. https://doi.org/10.3390/ijerph191912884
Chicago/Turabian StyleWang, Shiqing, Piling Sun, Huiying Sun, Qingguo Liu, Shuo Liu, and Da Lu. 2022. "Spatiotemporal Variations of Carbon Emissions and Their Driving Factors in the Yellow River Basin" International Journal of Environmental Research and Public Health 19, no. 19: 12884. https://doi.org/10.3390/ijerph191912884