

An Advanced Tape-Stripping Approach for High-Efficiency Sampling on Non-Absorbent Surfaces

Abstract
:1. Introduction

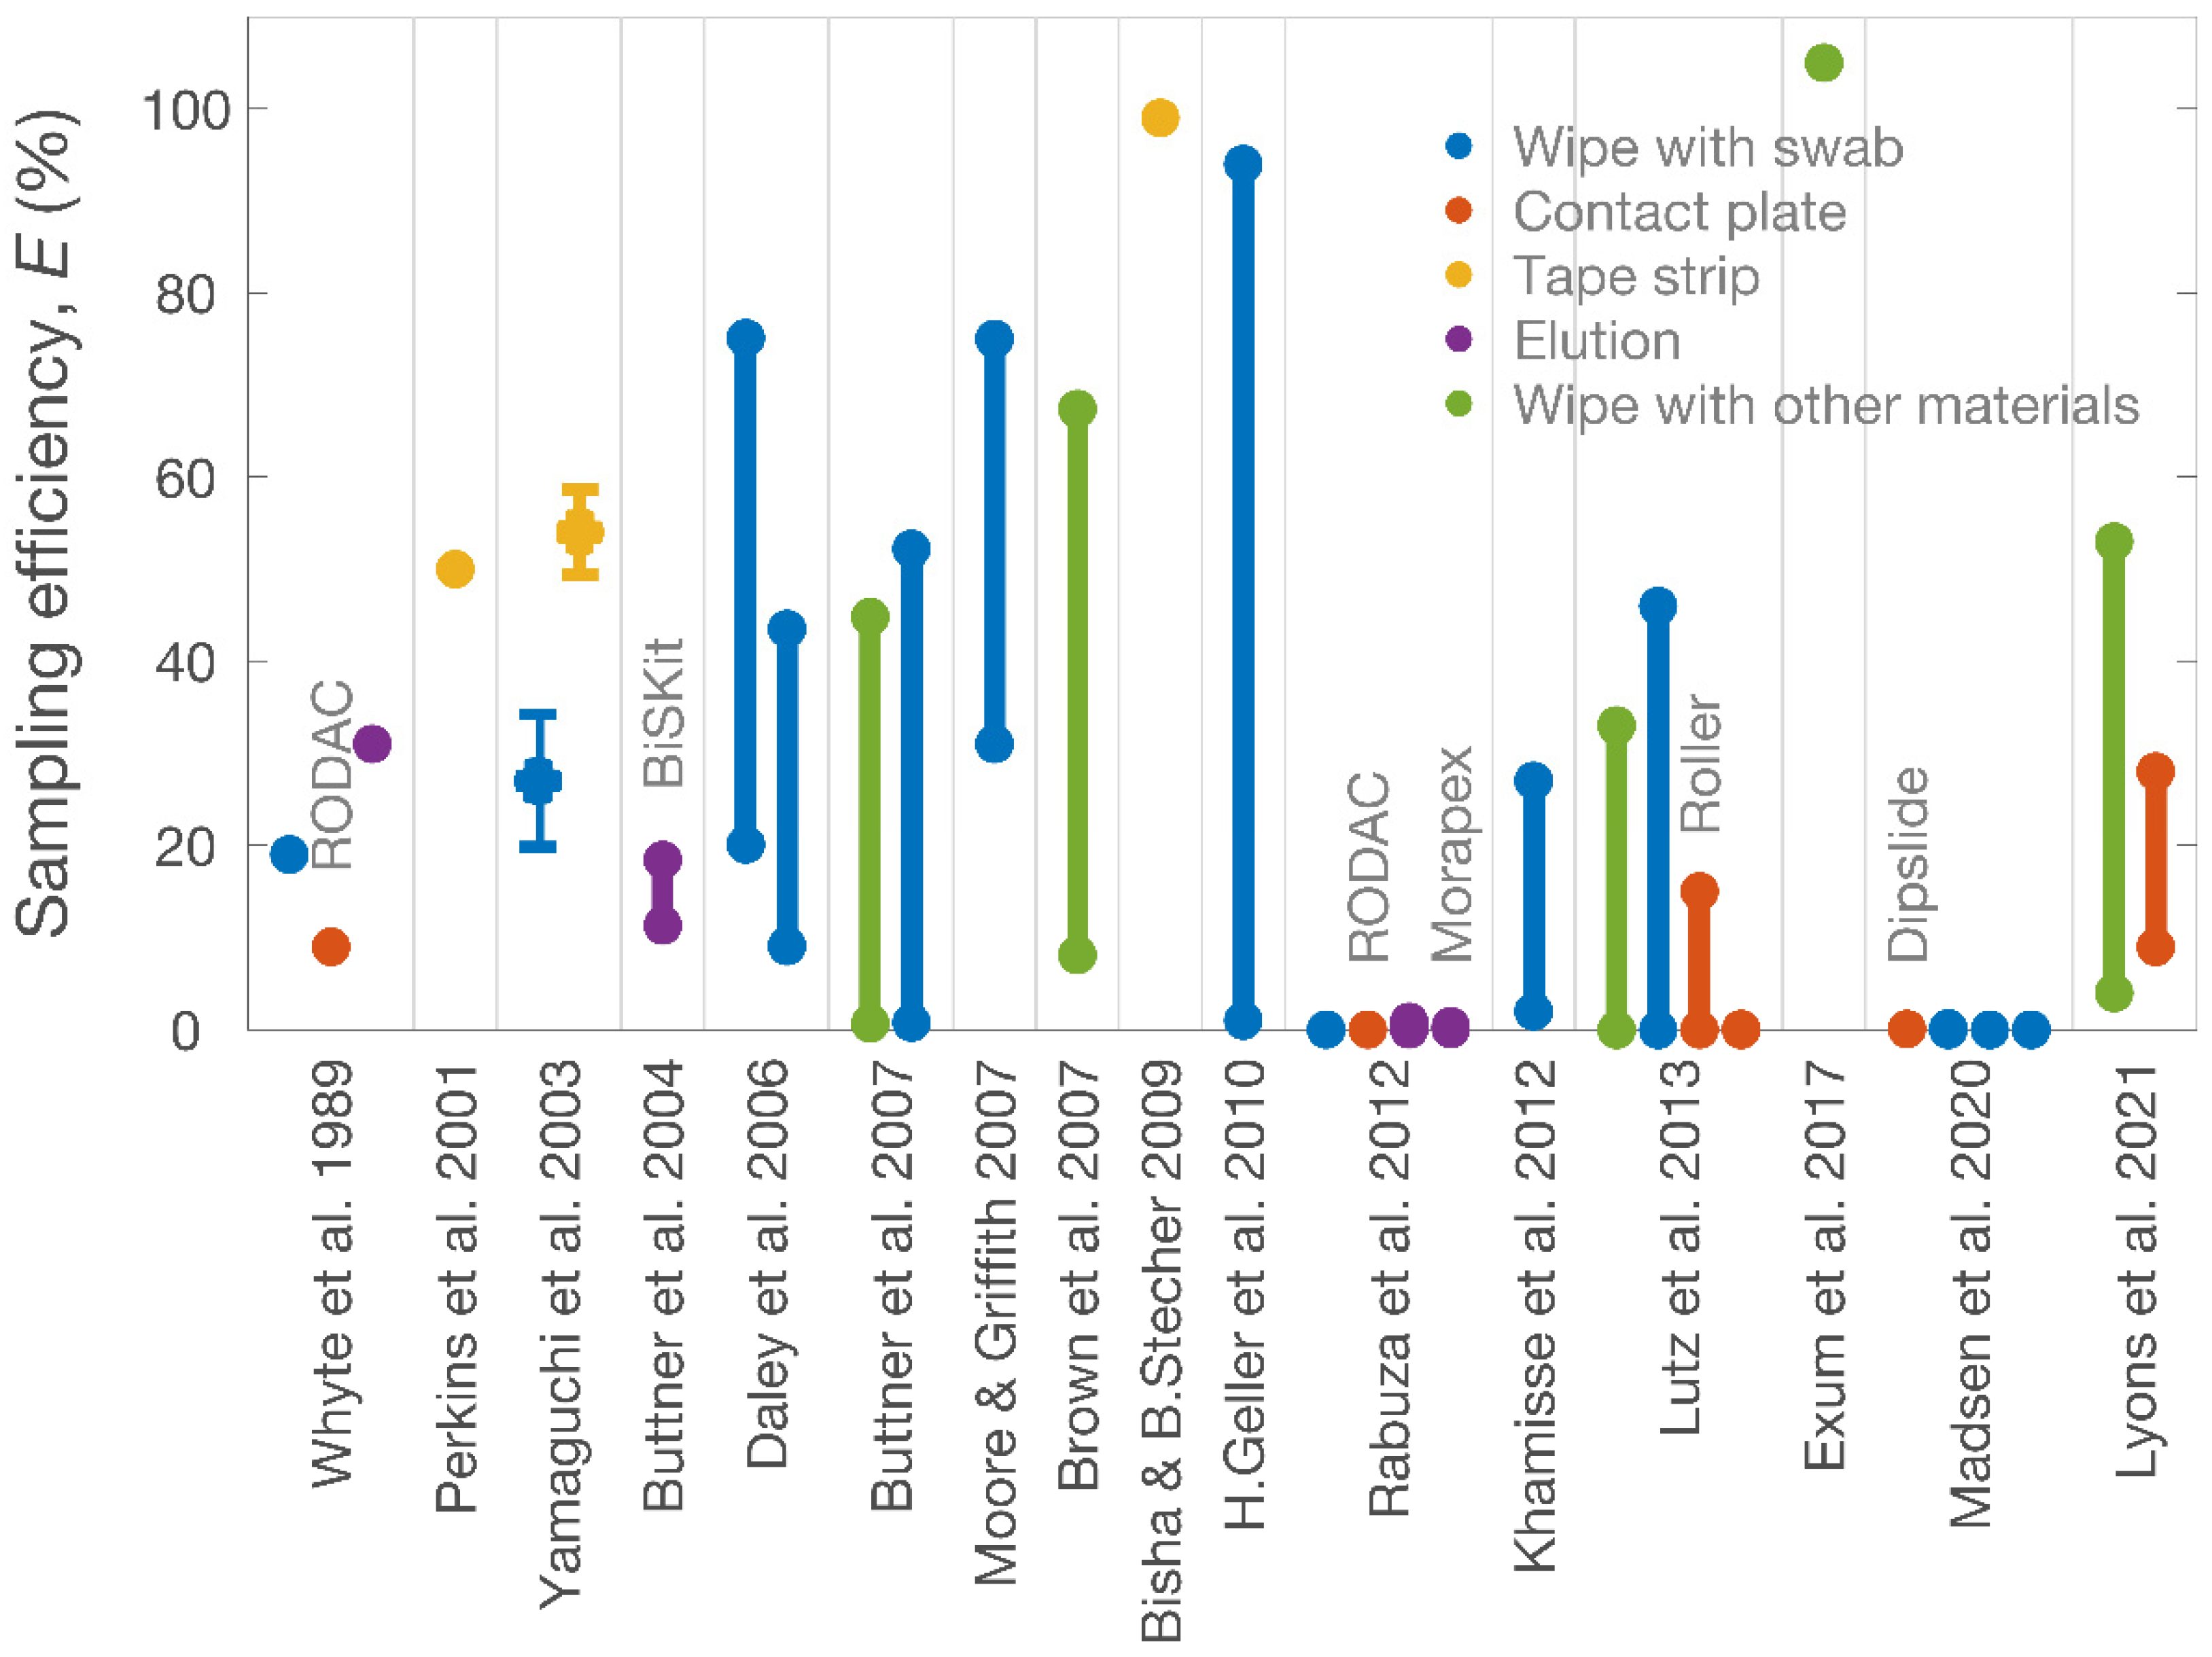
| Studies | Sampling Targets | Surfaces | Sampling Methods | Sampling Efficiencies (%) |
|---|---|---|---|---|
| Whyte et al. [23] | Skin bacteria | Skin | Swab | 19 |
| RODAC (contact-plate) | 9 | |||
| Cylinder (eluting) | 31 | |||
| Perkins et al. [24] | Cytokines | Skin | Sebutape (tape-stripping) | ≈50 |
| Yamaguchi et al. [25] | S. epidermidis | Plastic | Swab | 27 ± 7.2 a |
| Adhesive sheet | 54 ± 4.6 a | |||
| Buttner et al. [12] | B. atrophaeus spores | Metal | BiSKit (a foam material) | 11.3–18.4 b |
| Daley et al. [26] | Respiratory epithelial cells | Nasal cavity; nasopharyngeal cavity | Flocked swab | 20.1–75.1 b |
| Rayon swab | 9.1–43.5 b | |||
| Buttner et al. [27] | Erwinia herbicola | Metal; glass; wood; vinyl; plastic; concrete; nylon | Sponge (+qPCR) | 0.7–44.8 b |
| Swab (+qPCR) | 0.8–52.2 b | |||
| Moore and Griffith [28] | Escherichia coli; S. aureus | SS | Swab | 31–75 b |
| Brown et al. [29] | B. atrophaeus spores | SS; painted wallboard | Wipe (by polyester-rayon blend gauze) | 8.1–67.4 b |
| Bisha and Brehm-Stecher [30] | Salmonella | Tomato | Adhesive tape | >99 |
| Hong-Geller et al. [22] | B. anthracis; Yersinia pestis | Plastic; SS; glass; vinyl | Swab/wipe | <1–94 b |
| Rabuza et al. [11] | S. aureus; Klebsiella pneumoniae | Fabric pieces | Swab | <0.01 |
| RODAC (contact-plate) | <0.01 | |||
| Destructive elution | 0.07–0.85 b | |||
| Morapex device | 0.10–0.36 b | |||
| Khamisse et al. [31] | Bacterial DNA | Polyvinyl chloride; SS | Swab | 2–27 b |
| Lutz et al. [32] | S. aureus | SS | Electrostatic wipe | 0–33 b |
| Swab | 0–46 b | |||
| Roller sampler | 0.01–15 b | |||
| Contact-plate | 0–0.09 b | |||
| Exum et al. [15] | Escherichia coli | Surfaces in households | Dry cloth | 105 |
| Madsen et al. [9] | S. aureus | SS | Dipslide | 0.08–0.10 b |
| eSwab | 0–0.16 b | |||
| Viscose swab | 0–0.02 b | |||
| Cotton swab | 0–0.02 b | |||
| Lyons et al. [10] | Clostridioides difficile spores; Klebsiella pneumoniae; S. aureus; Acinetobacter baumannii | Nitrile glove | Wipe (by cellulose sponge) | 4–53 b |
| Contact-plate | 9–28 b |
2. Materials and Methods
2.1. Literature Review of Surface Sampling Methods
2.2. Materials
2.3. Surface Preparation
2.3.1. Inoculum Preparation
2.3.2. Surface Seeding
2.4. Surface Sampling
2.4.1. Preparation of PVA Solutions
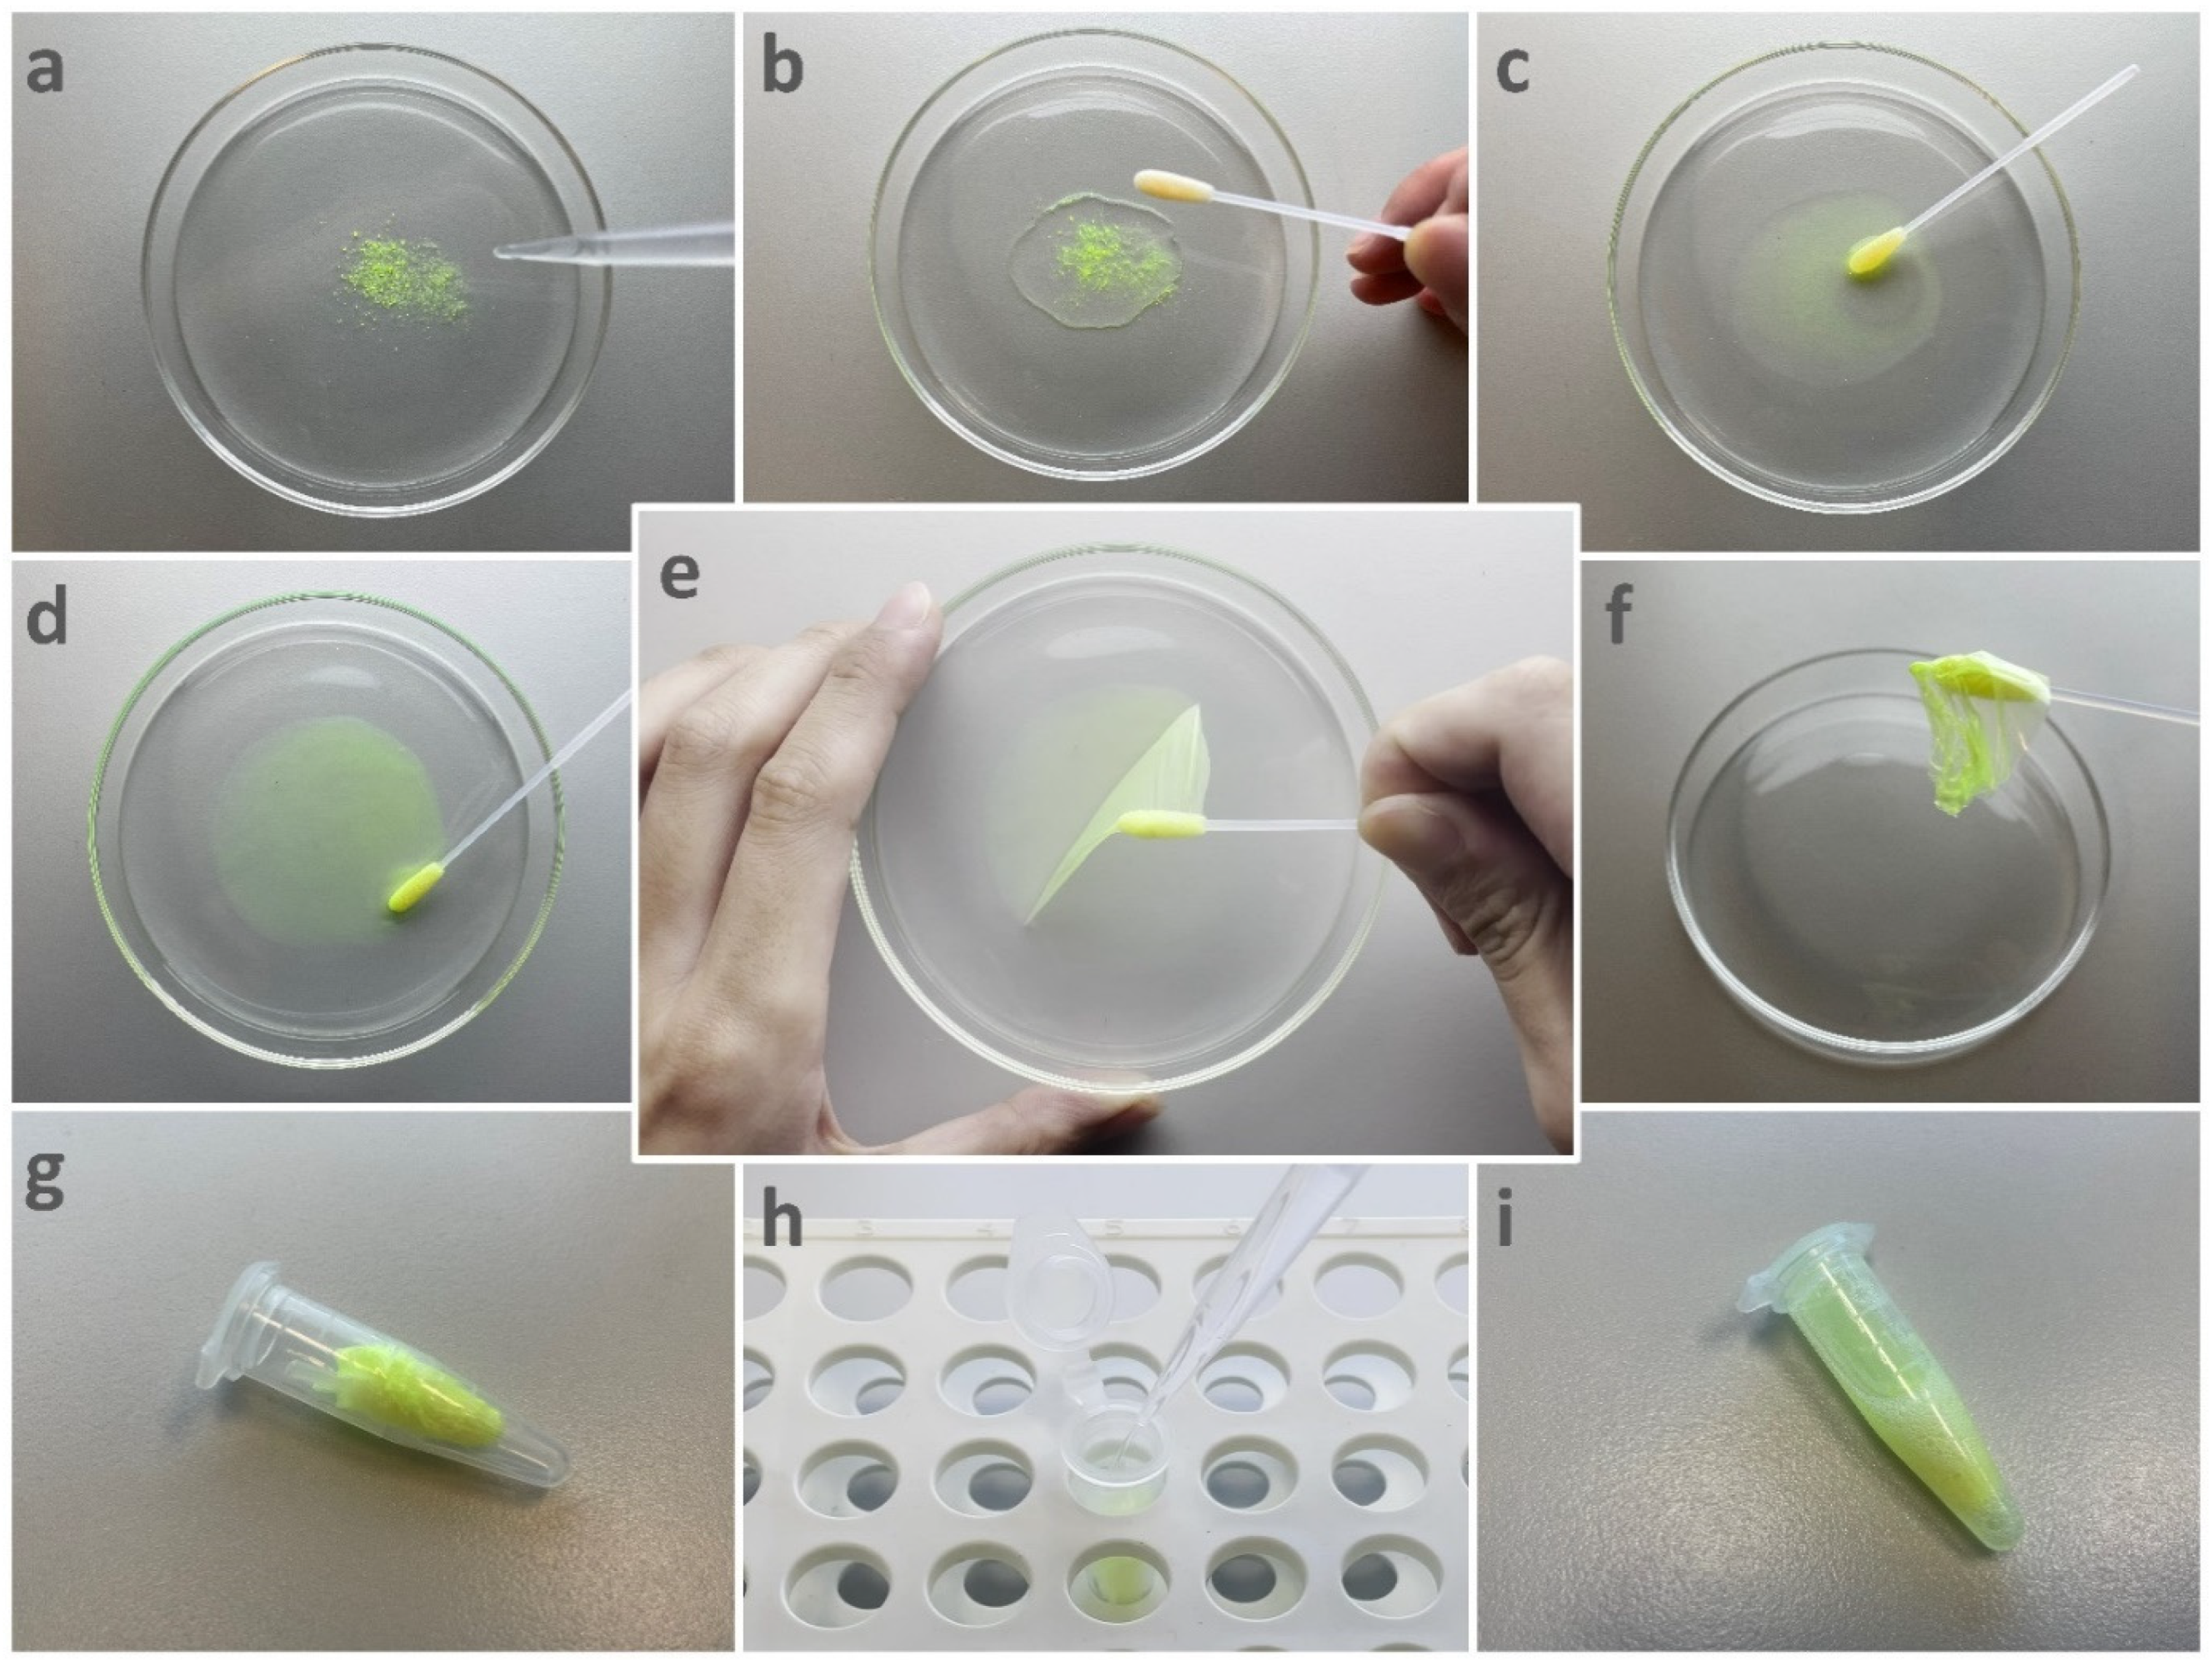
2.4.2. Surface Sampling Using PVA Solution
2.4.3. Surface Sampling Using Swab
2.5. Measurement of Sampling Efficiency
2.6. Experimental Design
2.6.1. Sampling Efficiencies under Different Conditions (Sets 1–8)
| S. aureus and E. coli [38] | |
| DNA fragment | 16s ribosomal DNA (rDNA) |
| Number of base pairs | 178 bp |
| Primers (5′–3′) | (341-F) CCT ACG GGA GGC AGC AG (518-R) GTA TTA CCG CGG CTG CTG |
| Cycling conditions | 95 °C × 1 min + [95 °C × 10 s + 60 °C × 30 s] × 40 cycles |
| Amplification efficiency | 95.3% |
| S. cerevisiae [39,40] | |
| DNA fragment | Internal Transcribed Spacer-2 (between 5.8S rDNA and 28S rDNA) |
| Number of base pairs | ≈350 bp |
| Primers (5′–3′) | (ITS3-F) GCA TCG ATG AAG AAC GCA GC (ITS4-R) TCC TCC GCT TAT TGA TAT GC |
| Cycling conditions | 95 °C × 1 min + [95 °C × 30 s + 60 °C × 30 s + 72 °C × 1 min] × 40 cycles |
| Amplification efficiency | 82.6% |
| P22 [41] | |
| DNA fragment | A segment from the 14,567th to the 14,617th base pair in the complete genome sequence |
| Number of base pairs | 51 bp |
| Primers (5′–3′) | (14567-F) CTT AAC AAG CTC TGA CTG CTC ATC A (14617-R) CCA TCG CCT GTG ACT GGA T |
| Cycling conditions | 95 °C × 1 min + [95 °C × 10 s + 60 °C × 30 s] × 40 cycles |
| Amplification efficiency | 97.7% |
2.6.2. S. aureus Viability in the PVA Solutions (Sets 9–15)
3. Results
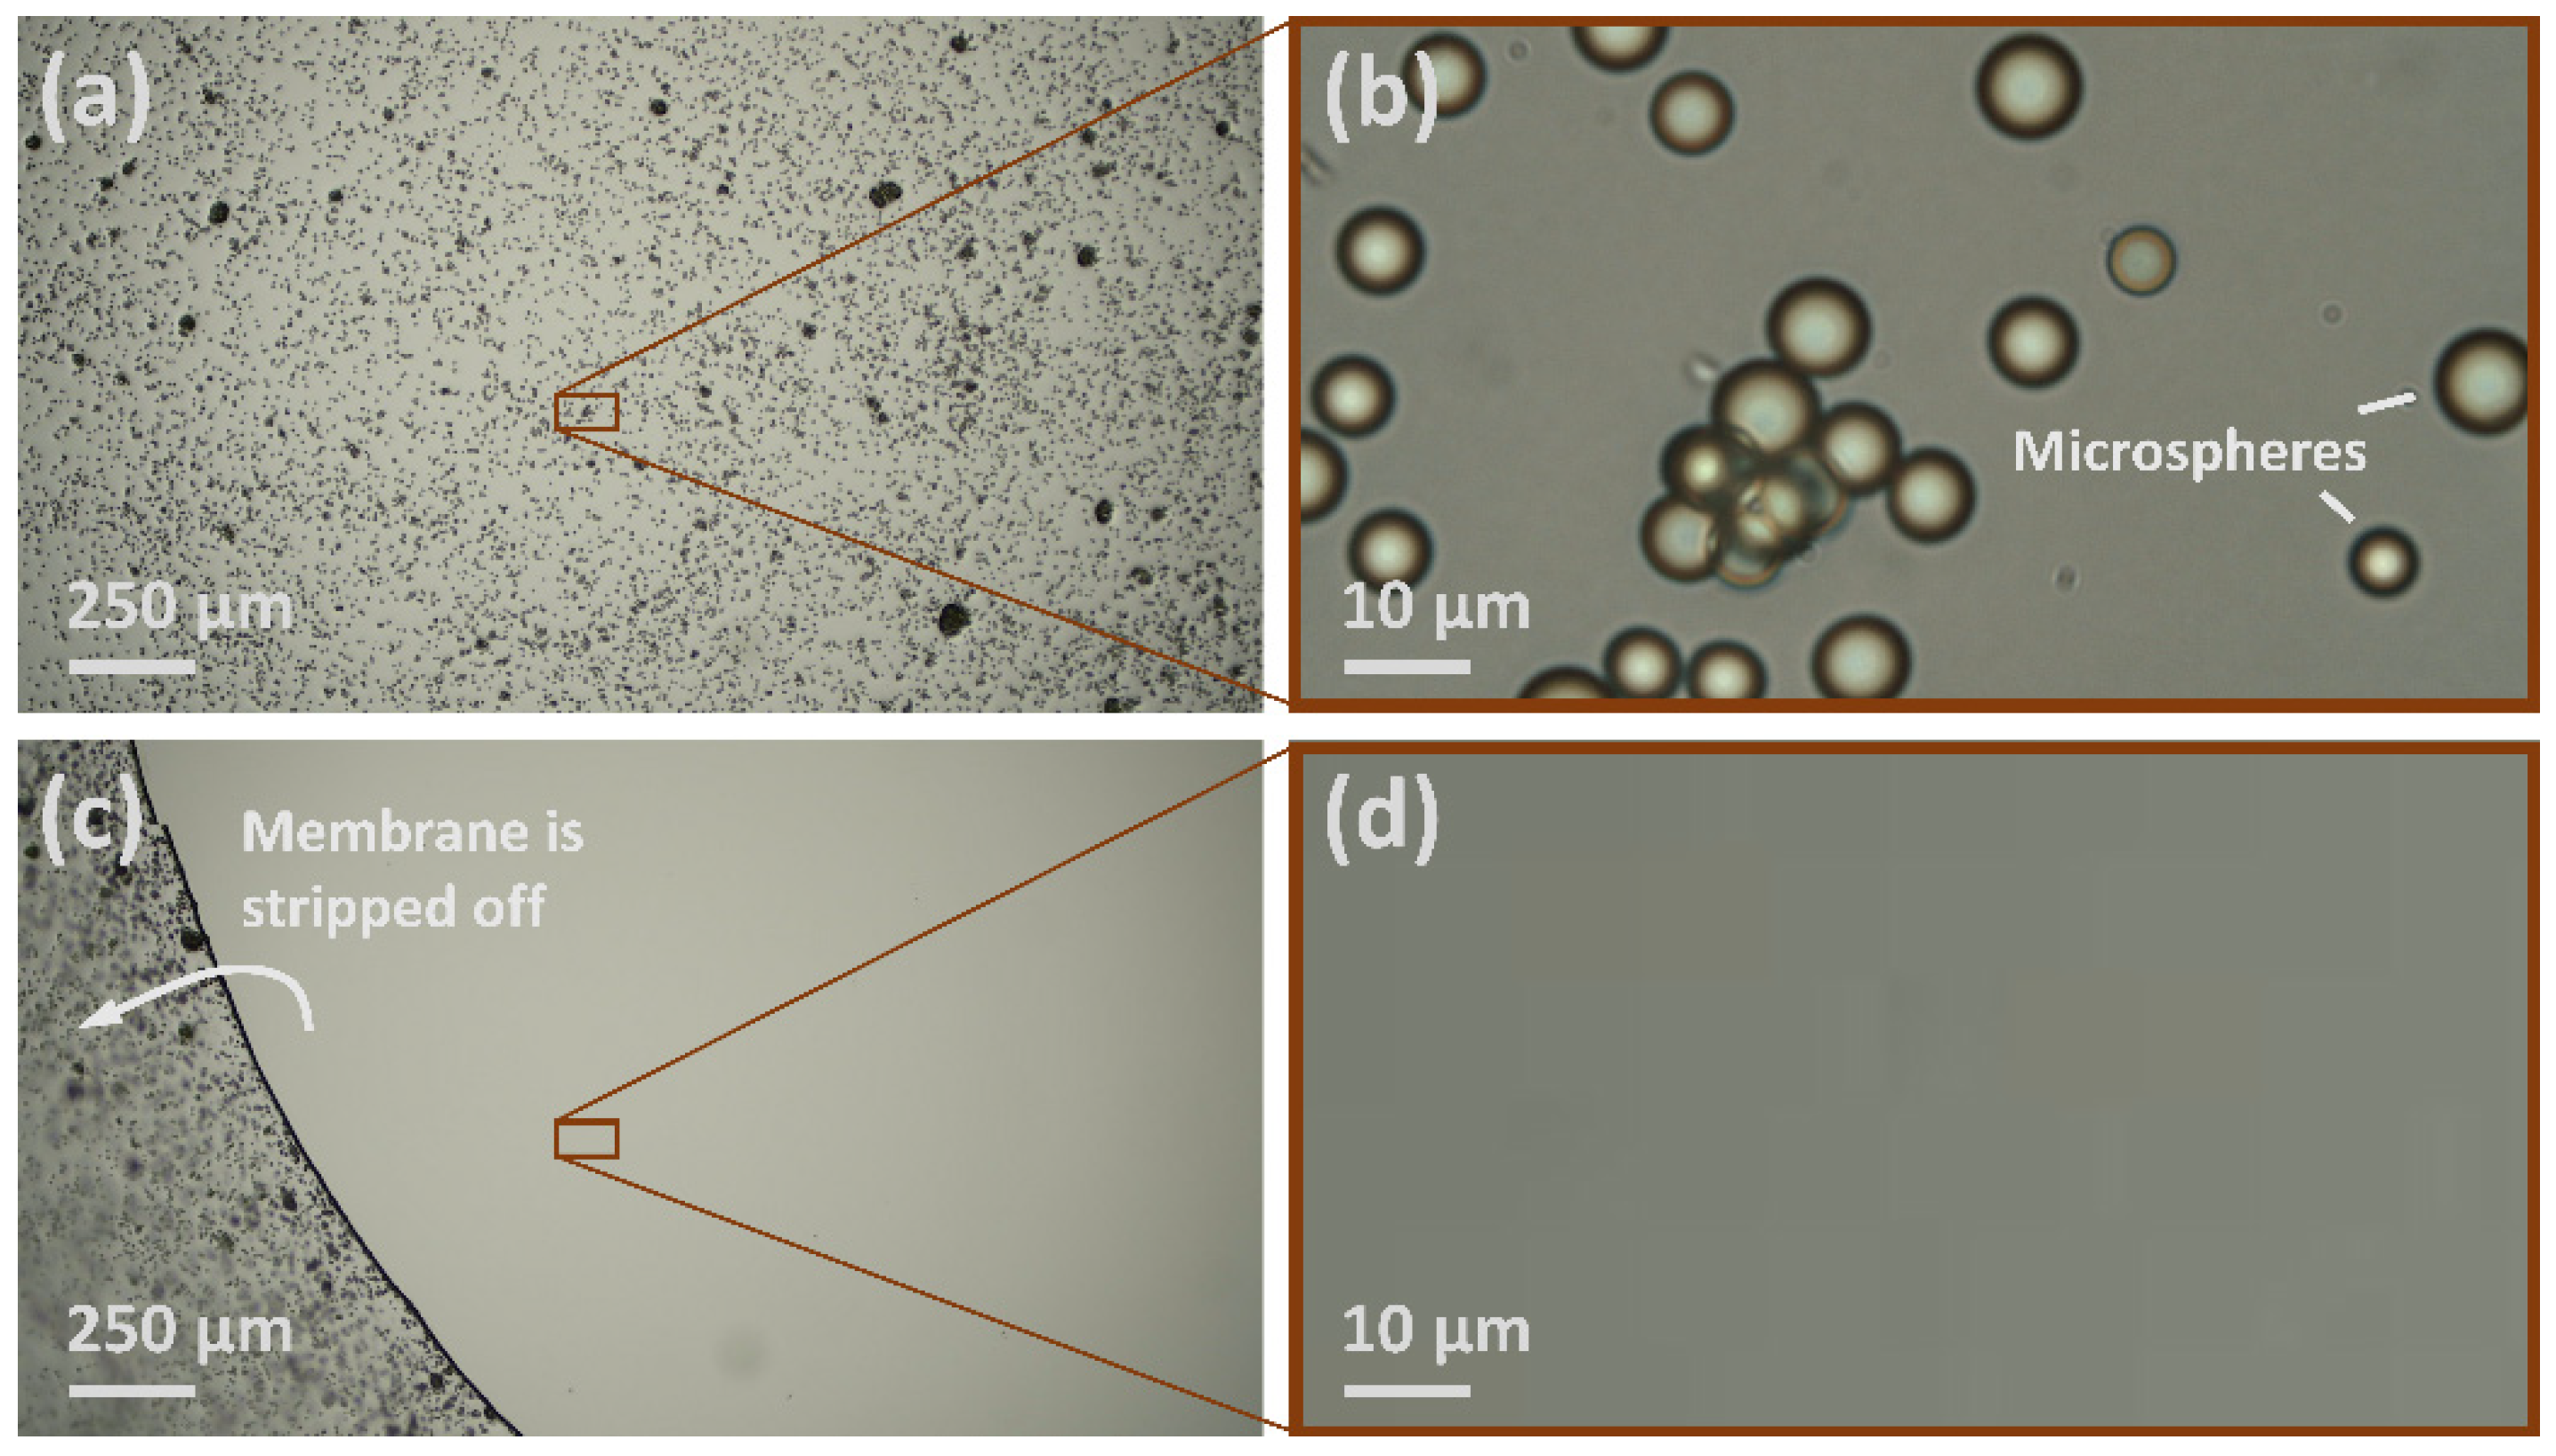
3.1. Sampling Efficiency of the New Approach
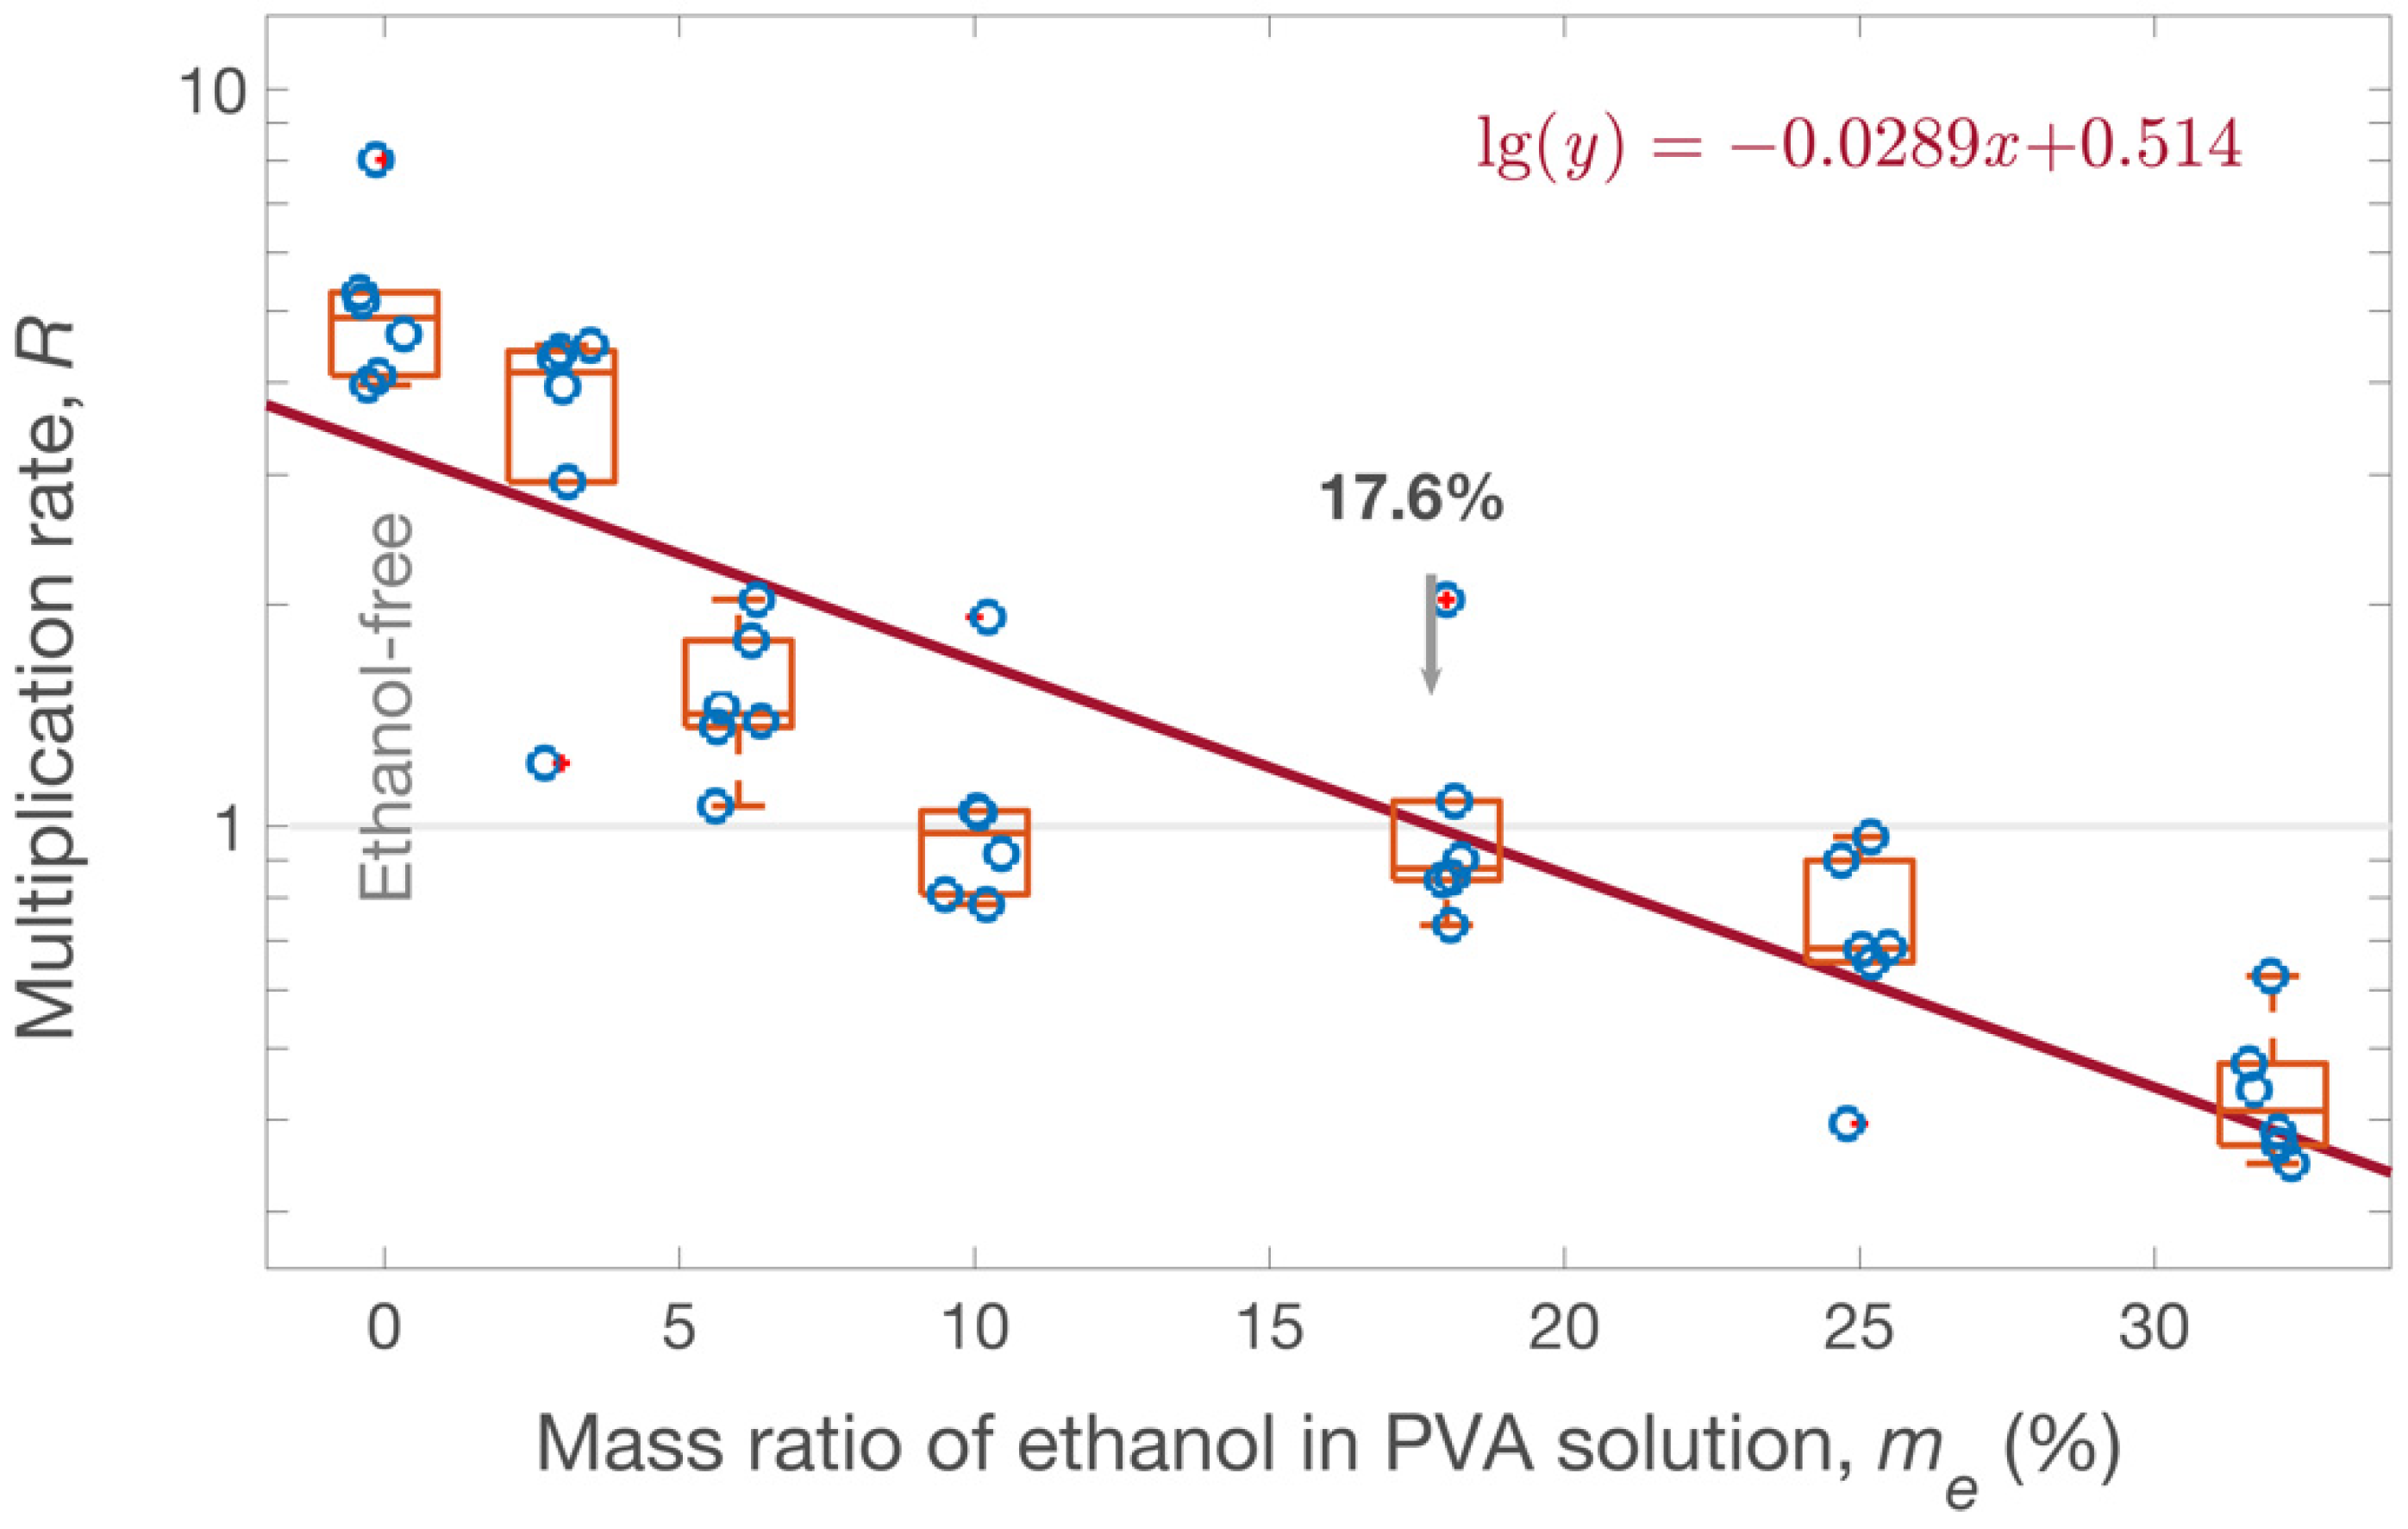
3.2. S. aureus Viability in the PVA Solutions
4. Discussion
4.1. Significance of This Study
4.2. Sampling Mechanism
4.3. Effect of the PVA Solutions on Microbial Viability
4.4. Limitations and Improvements
5. Conclusions
Supplementary Materials
Author Contributions
Funding
Institutional Review Board Statement
Informed Consent Statement
Data Availability Statement
Conflicts of Interest
References
- Ismail, R.; Aviat, F.; Michel, V.; Le Bayon, I.; Gay-Perret, P.; Kutnik, M.; Federighi, M. Methods for recovering microorganisms from solid surfaces used in the food industry: A review of the literature. Int. J. Env. Res. Public Health 2013, 10, 6169–6183. [Google Scholar] [CrossRef]
- Wood, J.P.; Adrion, A.C. Review of decontamination techniques for the inactivation of Bacillus anthracis and other spore-forming bacteria associated with building or outdoor materials. Environ. Sci. Technol. 2019, 53, 4045–4062. [Google Scholar] [CrossRef]
- Weir, M.H.; Shibata, T.; Masago, Y.; Cologgi, D.L.; Rose, J.B. Effect of surface sampling and recovery of viruses and non-spore-forming bacteria on a quantitative microbial risk assessment model for fomites. Environ. Sci. Technol. 2016, 50, 5945–5952. [Google Scholar] [CrossRef]
- Silvestri, E.E.; Yund, C.; Taft, S.; Bowling, C.Y.; Chappie, D.; Garrahan, K.; Brady-Roberts, E.; Stone, H.; Nichols, T.L. Considerations for estimating microbial environmental data concentrations collected from a field setting. J. Expo. Sci. Environ. Epidemiol. 2017, 27, 141–151. [Google Scholar] [CrossRef]
- Marques, M.; Domingo, J.L. Contamination of inert surfaces by SARS-CoV-2: Persistence, stability and infectivity. A review. Environ. Res. 2021, 193, 110559. [Google Scholar] [CrossRef] [PubMed]
- Turnage, N.L.; Gibson, K.E. Sampling methods for recovery of human enteric viruses from environmental surfaces. J. Virol. Methods 2017, 248, 31–38. [Google Scholar] [CrossRef] [PubMed]
- van Loosdrecht, M.C.; Lyklema, J.; Norde, W.; Zehnder, A.J. Bacterial adhesion: A physicochemical approach. Microb. Ecol. 1989, 17, 1–15. [Google Scholar] [CrossRef] [PubMed]
- Griffith, C. Surface sampling and the detection of contamination. In Handbook of Hygiene Control in the Food Industry; Elsevier: Amsterdam, The Netherlands, 2016; pp. 673–696. [Google Scholar]
- Madsen, A.M.; Phan, H.U.T.; Laursen, M.; White, J.K.; Uhrbrand, K. Evaluation of methods for sampling of Staphylococcus aureus and other Staphylococcus species from Indoor surfaces. Ann. Work. Expo. Health 2020, 64, 1020–1034. [Google Scholar] [CrossRef] [PubMed]
- Lyons, A.K.; Rose, L.J.; Noble-Wang, J. Recovery efficiency of two glove-sampling methods. Infect. Control Hosp. Epidemiol. 2021, 43, 390–392. [Google Scholar] [CrossRef]
- Rabuza, U.; Šostar-Turk, S.; Fijan, S. Efficiency of four sampling methods used to detect two common nosocomial pathogens on textiles. Text. Res. J. 2012, 82, 2099–2105. [Google Scholar] [CrossRef]
- Buttner, M.P.; Cruz, P.; Stetzenbach, L.D.; Klima-Comba, A.K.; Stevens, V.L.; Emanuel, P.A. Evaluation of the Biological Sampling Kit (BiSKit) for large-area surface sampling. Appl. Environ. Microbiol. 2004, 70, 7040–7045. [Google Scholar] [CrossRef] [PubMed] [Green Version]
- Conover, D.M.; Gibson, K.E. Comparison of two plain soap types for removal of bacteria and viruses from hands with specific focus on food service environments. Food Control 2016, 69, 141–146. [Google Scholar] [CrossRef] [Green Version]
- Chowdhury, D.; Tahir, S.; Legge, M.; Hu, H.; Prvan, T.; Johani, K.; Whiteley, G.S.; Glasbey, T.O.; Deva, A.K.; Vickery, K. Transfer of dry surface biofilm in the healthcare environment: The role of healthcare workers’ hands as vehicles. J. Hosp. Infect. 2018, 100, e85–e90. [Google Scholar] [CrossRef] [PubMed]
- Exum, N.G.; Kosek, M.N.; Davis, M.F.; Schwab, K.J. Surface sampling collection and culture methods for Escherichia coli in household environments with high fecal contamination. Int. J. Env. Res. Public Health 2017, 14, 947. [Google Scholar] [CrossRef] [Green Version]
- Zhao, P.; Chan, P.-T.; Gao, Y.; Lai, H.-W.; Zhang, T.; Li, Y. Physical factors that affect microbial transfer during surface touch. Build. Environ. 2019, 158, 28–38. [Google Scholar] [CrossRef]
- Rose, L.; Jensen, B.; Peterson, A.; Banerjee, S.N.; Arduino, M.J. Swab materials and Bacillus anthracis spore recovery from nonporous surfaces. Emerg. Infect. Dis. 2004, 10, 1023–1029. [Google Scholar] [CrossRef] [PubMed]
- Cutler, N.A.; Oliver, A.E.; Viles, H.A.; Whiteley, A.S. Non-destructive sampling of rock-dwelling microbial communities using sterile adhesive tape. J. Microbiol. Methods 2012, 91, 391–398. [Google Scholar] [CrossRef] [PubMed] [Green Version]
- Ogai, K.; Nagase, S.; Mukai, K.; Iuchi, T.; Mori, Y.; Matsue, M.; Sugitani, K.; Sugama, J.; Okamoto, S. A comparison of techniques for collecting skin microbiome samples: Swabbing versus tape-stripping. Front. Microbiol. 2018, 9, 2362. [Google Scholar] [CrossRef] [Green Version]
- Hedman, J.; Knutsson, R.; Ansell, R.; Radstrom, P.; Rasmusson, B. Pre-PCR processing in bioterrorism preparedness: Improved diagnostic capabilities for laboratory response networks. Biosecur. Bioterror. Biodef. Strategy Pract. Sci. 2013, 11 (Suppl. 1), S87–S101. [Google Scholar] [CrossRef] [Green Version]
- Van Horn, K.G.; Audette, C.D.; Tucker, K.A.; Sebeck, D. Comparison of 3 swab transport systems for direct release and recovery of aerobic and anaerobic bacteria. Diagn. Microbiol. Infect. Dis. 2008, 62, 471–473. [Google Scholar] [CrossRef]
- Hong-Geller, E.; Valdez, Y.E.; Shou, Y.; Yoshida, T.M.; Marrone, B.L.; Dunbar, J.M. Evaluation of Bacillus anthracis and Yersinia pestis sample collection from nonporous surfaces by quantitative real-time PCR. Lett. Appl. Microbiol. 2010, 50, 431–437. [Google Scholar] [CrossRef] [PubMed]
- Whyte, W.; Carson, W.; Hambraeus, A. Methods for calculating the efficiency of bacterial surface sampling techniques. J. Hosp. Infect. 1989, 13, 33–41. [Google Scholar] [CrossRef]
- Perkins, M.A.; Osterhues, M.A.; Farage, M.A.; Robinson, M.K. A noninvasive method to assess skin irritation and compromised skin conditions using simple tape adsorption of molecular markers of inflammation. Ski. Res. Technol. 2001, 7, 227–237. [Google Scholar] [CrossRef] [PubMed]
- Yamaguchi, N.; Ishidoshiro, A.; Yoshida, Y.; Saika, T.; Senda, S.; Nasu, M. Development of an adhesive sheet for direct counting of bacteria on solid surfaces. J. Microbiol. Methods 2003, 53, 405–410. [Google Scholar] [CrossRef]
- Daley, P.; Castriciano, S.; Chernesky, M.; Smieja, M. Comparison of flocked and rayon swabs for collection of respiratory epithelial cells from uninfected volunteers and symptomatic patients. J. Clin. Microbiol. 2006, 44, 2265–2267. [Google Scholar] [CrossRef] [PubMed] [Green Version]
- Buttner, M.P.; Cruz, P.; Stetzenbach, L.D.; Cronin, T. Evaluation of two surface sampling methods for detection of Erwinia herbicola on a variety of materials by culture and quantitative PCR. Appl. Environ. Microbiol. 2007, 73, 3505–3510. [Google Scholar] [CrossRef] [Green Version]
- Moore, G.; Griffith, C. Problems associated with traditional hygiene swabbing: The need for in-house standardization. J. Appl. Microbiol. 2007, 103, 1090–1103. [Google Scholar] [CrossRef]
- Brown, G.S.; Betty, R.G.; Brockmann, J.E.; Lucero, D.A.; Souza, C.A.; Walsh, K.S.; Boucher, R.M.; Tezak, M.; Wilson, M.C.; Rudolph, T. Evaluation of a wipe surface sample method for collection of Bacillus spores from nonporous surfaces. Appl. Environ. Microbiol. 2007, 73, 706–710. [Google Scholar] [CrossRef] [Green Version]
- Bisha, B.; Brehm-Stecher, B.F. Simple adhesive-tape-based sampling of tomato surfaces combined with rapid fluorescence in situ hybridization for Salmonella detection. Appl. Environ. Microbiol. 2009, 75, 1450–1455. [Google Scholar] [CrossRef] [Green Version]
- Khamisse, E.; Firmesse, O.; Christieans, S.; Chassaing, D.; Carpentier, B. Impact of cleaning and disinfection on the non-culturable and culturable bacterial loads of food-contact surfaces at a beef processing plant. Int. J. Food Microbiol. 2012, 158, 163–168. [Google Scholar] [CrossRef]
- Lutz, J.K.; Crawford, J.; Hoet, A.E.; Wilkins, J.R., 3rd; Lee, J. Comparative performance of contact plates, electrostatic wipes, swabs and a novel sampling device for the detection of Staphylococcus aureus on environmental surfaces. J. Appl. Microbiol. 2013, 115, 171–178. [Google Scholar] [CrossRef]
- Zhao, P.; Li, Y. Modeling and experimental validation of microbial transfer via surface touch. Environ. Sci. Technol. 2021, 55, 4148–4161. [Google Scholar] [CrossRef]
- Ahmad, A.L.; Yusuf, N.M.; Ooi, B.S. Preparation and modification of poly (vinyl) alcohol membrane: Effect of crosslinking time towards its morphology. Desalination 2012, 287, 35–40. [Google Scholar] [CrossRef]
- Parisi, E.I.; Bonelli, N.; Carretti, E.; Giorgi, R.; Ingo, G.M.; Baglioni, P. Film forming PVA-based cleaning systems for the removal of corrosion products from historical bronzes. Pure Appl. Chem. 2018, 90, 507–522. [Google Scholar] [CrossRef]
- Zhao, P.; Li, Y. New sequential-touch method to determine bacterial contact transfer rate from finger to surface. J. Appl. Microbiol. 2019, 127, 605–615. [Google Scholar] [CrossRef] [PubMed]
- Wei, N.; Nakajima, F.; Tobino, T. A microcosm study of surface sediment environmental DNA: Decay observation, abundance estimation, and fragment length comparison. Environ. Sci. Technol. 2018, 52, 12428–12435. [Google Scholar] [CrossRef]
- Gurtner, C.; Heyrman, J.; Piñar, G.; Lubitz, W.; Swings, J.; Rölleke, S. Comparative analyses of the bacterial diversity on two different biodeteriorated wall paintings by DGGE and 16S rDNA sequence analysis. Int. Biodeterior. Biodegrad. 2000, 46, 229–239. [Google Scholar] [CrossRef]
- Op De Beeck, M.; Lievens, B.; Busschaert, P.; Declerck, S.; Vangronsveld, J.; Colpaert, J.V. Comparison and validation of some ITS primer pairs useful for fungal metabarcoding studies. PLoS ONE 2014, 9, e97629. [Google Scholar]
- Fujita, S.I.; Senda, Y.; Nakaguchi, S.; Hashimoto, T. Multiplex PCR using internal transcribed spacer 1 and 2 regions for rapid detection and identification of yeast strains. J. Clin. Microbiol. 2001, 39, 3617–3622. [Google Scholar] [CrossRef] [Green Version]
- Masago, Y.; Shibata, T.; Rose, J.B. Bacteriophage P22 and Staphylococcus aureus attenuation on nonporous fomites as determined by plate assay and quantitative PCR. Appl. Environ. Microbiol. 2008, 74, 5838–5840. [Google Scholar] [CrossRef] [Green Version]
- Mubarak, S.M.; Al-Koofee, D.A.; Radhi, O.A.; Ismael, J.M.; Al-Zubaidi, Z.F. An optimization and common troubleshooting solving in polymerase chain reaction technique. Syst. Rev. Pharm. 2020, 11, 427–436. [Google Scholar]
- Baker, M.I.; Walsh, S.P.; Schwartz, Z.; Boyan, B.D. A review of polyvinyl alcohol and its uses in cartilage and orthopedic applications. J. Biomed. Mater. Research. Part B Appl. Biomater. 2012, 100, 1451–1457. [Google Scholar] [CrossRef]
- Urzı, C.; De Leo, F. Sampling with adhesive tape strips: An easy and rapid method to monitor microbial colonization on monument surfaces. J. Microbiol. Methods 2001, 44, 1–11. [Google Scholar] [CrossRef]
- Holmes, S. An overview of current surgical instrument and other medical device decontamination practices. In Decontamination in Hospitals and Healthcare; Elsevier: Amsterdam, The Netherlands, 2020; pp. 443–482. [Google Scholar]
- Barash, M.; Reshef, A.; Brauner, P. The use of adhesive tape for recovery of DNA from crime scene items. J. Forensic Sci. 2010, 55, 1058–1064. [Google Scholar] [CrossRef] [PubMed]
- Garrett, T.R.; Bhakoo, M.; Zhang, Z. Bacterial adhesion and biofilms on surfaces. Prog. Nat. Sci. 2008, 18, 1049–1056. [Google Scholar] [CrossRef]
- Piškur, J.; Rupprecht, A. Aggregated DNA in ethanol solution. FEBS Lett. 1995, 375, 174–178. [Google Scholar] [CrossRef] [Green Version]
- Adelnia, H.; Ensandoost, R.; Shebbrin Moonshi, S.; Gavgani, J.N.; Vasafi, E.I.; Ta, H.T. Freeze/thawed polyvinyl alcohol hydrogels: Present, past and future. Eur. Polym. J. 2022, 164, 110974. [Google Scholar] [CrossRef]
- Morrison, L.R. Glycerol. In Kirk-Othmer Encyclopedia of Chemical Technology; John Wiley & Sons, Inc.: Hoboken, NJ, USA, 2000. [Google Scholar]
- Katzenberger, R.H.; Rosel, A.; Vonberg, R.P. Bacterial survival on inanimate surfaces: A field study. BMC Res. Notes 2021, 14, 97. [Google Scholar] [CrossRef]
- McDonnell, G.; Russell, A.D. Antiseptics and disinfectants: Activity, action, and resistance. Clin. Microbiol. Rev. 1999, 12, 147–179. [Google Scholar] [CrossRef] [Green Version]
- Murray, G. Handbook of Materials Selection for Engineering Applications; CRC Press: Boca Raton, FL, USA, 1997. [Google Scholar]
- Bustin, S.A.; Benes, V.; Garson, J.A.; Hellemans, J.; Huggett, J.; Kubista, M.; Mueller, R.; Nolan, T.; Pfaffl, M.W.; Shipley, G.L.; et al. The MIQE guidelines: Minimum information for publication of quantitative real-time PCR experiments. Clin. Chem. 2009, 55, 611–622. [Google Scholar] [CrossRef] [Green Version]


| No. | Aim | Sampling Target | Surface | Sampling Tools × Times | Quantification | Replicates |
|---|---|---|---|---|---|---|
| 1 | To measure E under different conditions | S. aureus DNA | Glass | PVA solution (me = 32%) × 5 + Swab × 1 | qPCR | 5 |
| 2 | E. coli DNA | Glass | PVA solution (me = 32%) × 5 + Swab × 1 | qPCR | 5 | |
| 3 | Phage P22 DNA | Glass | PVA solution (me = 32%) × 5 + Swab × 1 | qPCR | 5 | |
| 4 | S. cerevisiae DNA | Glass | PVA solution (me = 32%) × 5 + Swab × 1 | qPCR | 5 | |
| 5 | S. aureus DNA | Stainless steel | PVA solution (me = 32%) × 5 + Swab × 1 | qPCR | 5 | |
| 6 | S. aureus DNA | Glass | PVA solution (me = 0) × 5 + Swab × 1 | qPCR | 5 | |
| 7 | S. aureus DNA | Glass | Swab × 6 | qPCR | 5 | |
| 8 | Microspheres | Glass | PVA solution (me = 32%) × 6 | Microscopy | 5 | |
| 9 | To measure S. aureus viability in the PVA solutions | S. aureus | Glass | PVA solution (ethanol-free) × 1 | Plate count | 6 |
| 10 | S. aureus | Glass | PVA solution (me = 3%) × 1 | Plate count | 6 | |
| 11 | S. aureus | Glass | PVA solution (me = 6%) × 1 | Plate count | 6 | |
| 12 | S. aureus | Glass | PVA solution (me = 10%) × 1 | Plate count | 6 | |
| 13 | S. aureus | Glass | PVA solution (me = 18%) × 1 | Plate count | 6 | |
| 14 | S. aureus | Glass | PVA solution (me = 25%) × 1 | Plate count | 6 | |
| 15 | S. aureus | Glass | PVA solution (me = 32%) × 1 | Plate count | 6 |
Publisher’s Note: MDPI stays neutral with regard to jurisdictional claims in published maps and institutional affiliations. |
© 2022 by the authors. Licensee MDPI, Basel, Switzerland. This article is an open access article distributed under the terms and conditions of the Creative Commons Attribution (CC BY) license (https://creativecommons.org/licenses/by/4.0/).
Share and Cite
Zhao, P.; Chan, P.-T.; Zhang, N.; Li, Y. An Advanced Tape-Stripping Approach for High-Efficiency Sampling on Non-Absorbent Surfaces. Int. J. Environ. Res. Public Health 2022, 19, 12571. https://doi.org/10.3390/ijerph191912571
Zhao P, Chan P-T, Zhang N, Li Y. An Advanced Tape-Stripping Approach for High-Efficiency Sampling on Non-Absorbent Surfaces. International Journal of Environmental Research and Public Health. 2022; 19(19):12571. https://doi.org/10.3390/ijerph191912571
Chicago/Turabian StyleZhao, Pengcheng, Pak-To Chan, Nan Zhang, and Yuguo Li. 2022. "An Advanced Tape-Stripping Approach for High-Efficiency Sampling on Non-Absorbent Surfaces" International Journal of Environmental Research and Public Health 19, no. 19: 12571. https://doi.org/10.3390/ijerph191912571