
Has the Risk of Outpatient Visits for Allergic Rhinitis, Related to Short-Term Exposure to Air Pollution, Changed over the Past Years in Beijing, China?


Abstract
:1. Introduction
2. Methods
2.1. Study Area and Data Collection
2.2. Statistical Analysis
3. Results
4. Discussion
5. Conclusions
Supplementary Materials
Author Contributions
Funding
Informed Consent Statement
Data Availability Statement
Acknowledgments
Conflicts of Interest
References
- Atkinson, R.W.; Mills, I.C.; Walton, H.A.; Anderson, H.R. Epidemiological time series studies of PM2.5 and daily mortality and hospital admissions: A systematic review and meta-analysis. J. Expo. Sci. Environ. Epidemiol. 2014, 69, 660–665. [Google Scholar] [CrossRef] [Green Version]
- Mehrotra, R.; Group, I.S.B.O.D. Health and economic impact of air pollution in the states of India: The Global Burden of Disease Study 2019. Lancet Planet. Health 2020, 5, e25–e38. [Google Scholar] [CrossRef]
- Phung, D.; Hien, T.T.; Linh, H.N.; Luong, L.; Morawska, L.; Chu, C.; Binh, N.D.; Thai, P.K. Air pollution and risk of respiratory and cardiovascular hospitalizations in the most populous city in Vietnam. Sci. Total Environ. 2016, 557–558, 322–330. [Google Scholar] [CrossRef] [PubMed] [Green Version]
- Wang, Z.; Zhou, Y.; Zhang, Y.; Huang, X.; Duan, X.; Chen, D.; Ou, Y.; Tang, L.; Liu, S.; Hu, W.; et al. Association of change in air quality with hospital admission for acute exacerbation of chronic obstructive pulmonary disease in Guangdong, China: A province-wide ecological study. Ecotoxicol. Environ. Saf. 2021, 208, 111590. [Google Scholar] [CrossRef]
- Phosri, A.; Sihabut, T.; Jaikanlaya, C. Temporal variations of short-term effects of particulate matter on hospital admissions in the most densely populated city in Thailand. Sci. Total Environ. 2020, 742, 140651. [Google Scholar] [CrossRef] [PubMed]
- Renzi, M.; Stafoggia, M.; Faustini, A.; Cesaroni, G.; Cattani, G.; Forastiere, F. Analysis of Temporal Variability in the Short-term Effects of Ambient Air Pollutants on Nonaccidental Mortality in Rome, Italy (1998–2014). Environ. Health Perspect. 2017, 125, 067019. [Google Scholar] [CrossRef] [Green Version]
- Wu, R.; Zhong, L.; Huang, X.; Xu, H.; Liu, S.; Feng, B.; Wang, T.; Song, X.; Bai, Y.; Wu, F.; et al. Temporal variations in ambient particulate matter reduction associated short-term mortality risks in Guangzhou, China: A time-series analysis (2006–2016). Sci. Total Environ. 2018, 645, 491–498. [Google Scholar] [CrossRef]
- Yue, Z.; Peng, L.; Hao, L.; Pan, J.; Kan, H.; Wang, W. Temporal variations of short-term associations between PM 10 and NO2 concentrations and emergency department visits in Shanghai, China 2008–2019. Ecotoxicol. Environ. Saf. 2022, 229, 113087. [Google Scholar]
- Liang, L.; Cai, Y.; Barratt, B.; Lyu, B.; Chan, Q.; Hansell, A.L.; Xie, W.; Zhang, D.; Kelly, F.J.; Tong, Z. Associations between daily air quality and hospitalisations for acute exacerbation of chronic obstructive pulmonary disease in Beijing, 2013–2017: An ecological analysis. Lancet Planet. Health 2019, 3, e270–e279. [Google Scholar] [CrossRef] [Green Version]
- Zeng, Y.; Cao, Y.; Qiao, X.; Seyler, B.C.; Tang, Y. Air pollution reduction in China: Recent success but great challenge for the future. Sci. Total Environ. 2019, 663, 329–337. [Google Scholar] [CrossRef]
- Li, H.; Wang, D.; Cui, L.; Gao, Y.; Huo, J.; Wang, X.; Zhang, Z.; Tan, Y.; Huang, Y.; Cao, J.; et al. Characteristics of atmospheric PM2.5 composition during the implementation of stringent pollution control measures in shanghai for the 2016 G20 summit. Sci. Total Environ. 2019, 648, 1121–1129. [Google Scholar] [CrossRef] [PubMed]
- Linares, C.; Falcón, I.; Ortiz, C.; Díaz, J. An approach estimating the short-term effect of NO2 on daily mortality in Spanish cities. Environ. Int. 2018, 116, 18–28. [Google Scholar] [CrossRef] [PubMed]
- Li, S.; Wu, W.; Wang, G.; Zhang, X.; Guo, Q.; Wang, B.; Cao, S.; Yan, M.; Pan, X.; Xue, T.; et al. Association between exposure to air pollution and risk of allergic rhinitis: A systematic review and meta-analysis. Environ. Res. 2022, 205, 112472. [Google Scholar] [CrossRef] [PubMed]
- Nordeide Kuiper, I.; Svanes, C.; Markevych, I.; Accordini, S.; Bertelsen, R.J.; Bråbäck, L.; Heile Christensen, J.; Forsberg, B.; Halvorsen, T.; Heinrich, J.; et al. Lifelong exposure to air pollution and greenness in relation to asthma, rhinitis and lung function in adulthood. Environ. Int. 2021, 146, 106219. [Google Scholar] [CrossRef]
- Wang, J.; Zhang, Y.; Li, B.; Zhao, Z.; Huang, C.; Zhang, X.; Deng, Q.; Lu, C.; Qian, H.; Yang, X.; et al. Asthma and allergic rhinitis among young parents in China in relation to outdoor air pollution, climate and home environment. Sci. Total Environ. 2020, 751, 141734. [Google Scholar] [CrossRef]
- Ge, E.; Fan, M.; Qiu, H.; Hu, H.; Tian, L.; Wang, X.; Xu, G.; Wei, X. Ambient sulfur dioxide levels associated with reduced risk of initial outpatient visits for tuberculosis: A population based time series analysis. Environ. Pollut. 2017, 228, 408–415. [Google Scholar] [CrossRef] [Green Version]
- Wang, C.; Feng, L.; Chen, K. The impact of ambient particulate matter on hospital outpatient visits for respiratory and circulatory system disease in an urban Chinese population. Sci. Total Environ. 2019, 666, 672–679. [Google Scholar] [CrossRef]
- Li, M.; Tang, J.; Yang, H.; Zhao, L.; Liu, Y.; Xu, H.; Fan, Y.; Hong, J.; Long, Z.; Li, X.; et al. Short-term exposure to ambient particulate matter and outpatient visits for respiratory diseases among children: A time-series study in five Chinese cities. Chemosphere 2021, 263, 128214. [Google Scholar] [CrossRef]
- Tian, Y.; Wu, Y.; Liu, H.; Si, Y.; Wu, Y.; Wang, X.; Wang, M.; Wu, J.; Chen, L.; Wei, C.; et al. The impact of ambient ozone pollution on pneumonia: A nationwide time-series analysis. Environ. Int. 2020, 136, 105498. [Google Scholar] [CrossRef]
- Zhao, Y.; Hu, J.; Tan, Z.; Liu, T.; Zeng, W.; Li, X.; Huang, C.; Wang, S.; Huang, Z.; Ma, W. Ambient carbon monoxide and increased risk of daily hospital outpatient visits for respiratory diseases in Dongguan, China. Sci. Total Environ. 2019, 668, 254–260. [Google Scholar] [CrossRef]
- Akaike, H. A new look at the statistical model identification. IEEE Trans. Autom. Control 1974, 19, 716–723. [Google Scholar] [CrossRef]
- Liu, Y.; Xie, S.; Yu, Q.; Huo, X.; Ming, X.; Wang, J.; Zhou, Y.; Peng, Z.; Zhang, H.; Cui, X.; et al. Short-term effects of ambient air pollution on pediatric outpatient visits for respiratory diseases in Yichang city, China. Environ. Pollut. 2017, 227, 116–124. [Google Scholar] [CrossRef] [PubMed]
- Xu, H.; Ho, S.S.H.; Cao, J.; Guinot, B.; Kan, H.; Shen, Z.; Ho, K.F.; Liu, S.; Zhao, Z.; Li, J.; et al. A 10-year observation of PM2.5-bound nickel in Xi’an, China: Effects of source control on its trend and associated health risks. Sci. Rep. 2017, 7, 41132. [Google Scholar] [CrossRef] [PubMed]
- Qiao, Z.; Guo, Y.; Yu, W.; Tong, S. Assessment of Short- and Long-Term Mortality Displacement in Heat-Related Deaths in Brisbane, Australia, 1996–2004. Environ. Health Perspect. 2015, 123, 766–772. [Google Scholar] [CrossRef] [Green Version]
- Maji, K.J.; Li, V.O.; Lam, J.C. Effects of China’s current Air Pollution Prevention and Control Action Plan on air pollution patterns, health risks and mortalities in Beijing 2014–2018. Chemosphere 2020, 260, 127572. [Google Scholar] [CrossRef]
- Han, Y.; Lam, J.C.K.; Li, V.O.K.; Reiner, D. A Bayesian LSTM model to evaluate the effects of air pollution control regulations in Beijing, China. Environ. Sci. Policy 2021, 115, 26–34. [Google Scholar] [CrossRef]
- Xue, Y.; Zhang, S.; Nie, T.; Cao, X.; Shi, A. Environmental Effective Assessment of Control Measures Implemented by Clean Air Action Plan (2013–2017) in Beijing, China. Atmosphere 2020, 11, 189. [Google Scholar] [CrossRef] [Green Version]
- Todkill, D.; de Jesus Colon Gonzalez, F.; Morbey, R.; Charlett, A.; Hajat, S.; Kovats, S.; Osborne, N.J.; McInnes, R.; Vardoulakis, S.; Exley, K.; et al. Environmental factors associated with general practitioner consultations for allergic rhinitis in London, England: A retrospective time series analysis. BMJ Open 2020, 10, e036724. [Google Scholar] [CrossRef]
- Wang, J.; Lu, M.; An, Z.; Jiang, J.; Li, J.; Wang, Y.; Du, S.; Zhang, X.; Zhou, H.; Cui, J.; et al. Associations between air pollution and outpatient visits for allergic rhinitis in Xinxiang, China. Environ. Sci. Pollut. Res. 2020, 27, 23565–23574. [Google Scholar] [CrossRef]
- Wang, M.; Wang, S.; Wang, X.; Tian, Y.; Wu, Y.; Cao, Y.; Song, J.; Wu, T.; Hu, Y. The association between PM2.5 exposure and daily outpatient visits for allergic rhinitis: Evidence from a seriously air-polluted environment. Int. J. Biometeorol. 2020, 64, 139–144. [Google Scholar] [CrossRef]
- Zhang, F.; Wang, W.; Lv, J.; Krafft, T.; Xu, J. Time-series studies on air pollution and daily outpatient visits for allergic rhinitis in Beijing, China. Sci. Total Environ. 2011, 409, 2486–2492. [Google Scholar] [CrossRef] [PubMed]
- Chen, R.; Yin, P.; Meng, X.; Wang, L.; Liu, C.; Niu, Y.; Lin, Z.; Liu, Y.; Liu, J.; Qi, J.; et al. Associations between Ambient Nitrogen Dioxide and Daily Cause-specific Mortality: Evidence from 272 Chinese Cities. Epidemiology 2018, 29, 482–489. [Google Scholar] [CrossRef] [PubMed]
- Zou, Q.-Y.; Shen, Y.; Ke, X.; Hong, S.-L.; Kang, H.-Y. Exposure to air pollution and risk of prevalence of childhood allergic rhinitis: A meta-analysis. Int. J. Pediatric Otorhinolaryngol. 2018, 112, 82–90. [Google Scholar] [CrossRef] [PubMed]
- Dunlop, J.; Matsui, E.; Sharma, H.P. Allergic Rhinitis: Environmental Determinants. Immunol. Allergy Clin. N. Am. 2016, 36, 367–377. [Google Scholar] [CrossRef]
- Fukuoka, A.; Matsushita, K.; Takano, H.; Yoshimoto, T. Diesel Exhaust Particles Exacerbate Allergic Rhinitis in Mice By Disrupting the Nasal Epithelial Barrier. J. Allergy Clin. Immunol. 2015, 135, AB276. [Google Scholar] [CrossRef]
- Jin, L.; Luo, X.; Fu, P.; Li, X. Airborne particulate matter pollution in urban China: A chemical mixture perspective from sources to impacts. Natl. Sci. Rev. 2016, 4, 593–610. [Google Scholar] [CrossRef] [Green Version]
- He, J.; Gong, S.; Liu, H.; An, X.; Yu, Y.; Zhao, S.; Wu, L.; Song, C.; Zhou, C.; Wang, J.; et al. Influences of Meteorological Conditions on Interannual Variations of Particulate Matter Pollution during Winter in the Beijing–Tianjin–Hebei Area. J. Meteorol. Res. 2017, 31, 1062–1069. [Google Scholar] [CrossRef]
- Andrade, M.d.F.; Kumar, P.; de Freitas, E.D.; Ynoue, R.Y.; Martins, J.; Martins, L.D.; Nogueira, T.; Perez-Martinez, P.; de Miranda, R.M.; Albuquerque, T.; et al. Air quality in the megacity of São Paulo: Evolution over the last 30 years and future perspectives. Atmos. Environ. 2017, 159, 66–82. [Google Scholar] [CrossRef] [Green Version]
- Wu, R.; Song, X.; Chen, D.; Zhong, L.; Huang, X.; Bai, Y.; Hu, W.; Ye, S.; Xu, H.; Feng, B.; et al. Health benefit of air quality improvement in Guangzhou, China: Results from a long time-series analysis (2006–2016). Environ. Int. 2019, 126, 552–559. [Google Scholar] [CrossRef]
- Shin, H.H.; Stieb, D.M.; Jessiman, B.; Goldberg, M.S.; Brion, O.; Brook, J.; Ramsay, T.; Burnett, R.T. A temporal, multicity model to estimate the effects of short-term exposure to ambient air pollution on health. Environ. Health Perspect. 2008, 116, 1147–1153. [Google Scholar] [CrossRef] [Green Version]
- Jin, L.; Xie, J.; Wong, C.; Chan, S.K.Y.; Abbaszade, G.; Schnelle-Kreis, J.; Zimmermann, R.; Li, J.; Zhang, G.; Fu, P.; et al. Contributions of City-Specific Fine Particulate Matter (PM(2.5)) to Differential In Vitro Oxidative Stress and Toxicity Implications between Beijing and Guangzhou of China. Environ. Sci. Technol. 2019, 53, 2881–2891. [Google Scholar] [CrossRef] [PubMed]
- Kovacic, P.; Somanathan, R. Nitroaromatic compounds: Environmental toxicity, carcinogenicity, mutagenicity, therapy and mechanism. J. Appl. Toxicol. 2014, 34, 810–824. [Google Scholar] [CrossRef] [PubMed]
- Shi, X.; Qiu, X.; Jiang, X.; Rudich, Y.; Zhu, T. Comprehensive detection of nitrated aromatic compounds in fine particulate matter using gas chromatography and tandem mass spectrometry coupled with an electron capture negative ionization source. J. Hazard. Mater. 2020, 407, 124794. [Google Scholar] [CrossRef] [PubMed]
- Li, F.; Gu, J.; Xin, J.; Schnelle-Kreis, J.; Wang, Y.; Liu, Z.; Shen, R.; Michalke, B.; Abbaszade, G.; Zimmermann, R. Characteristics of chemical profile, sources and PAH toxicity of PM(2.5) in beijing in autumn-winter transit season with regard to domestic heating, pollution control measures and meteorology. Chemosphere 2021, 276, 130143. [Google Scholar] [CrossRef] [PubMed]
- Liu, J.; Ruan, Y.; Wu, Q.; Ma, Y.; He, X.; Li, L.; Li, S.; Niu, J.; Luo, B. Has the mortality risk declined after the improvement of air quality in an ex-heavily polluted Chinese city-Lanzhou? Chemosphere 2019, 242, 125196. [Google Scholar] [CrossRef]
- Chen, R.; Huang, W.; Wong, C.-M.; Wang, Z.; Wang, Z.; Thach, T.Q.; Chen, B.; Kan, H. Short-term exposure to sulfur dioxide and daily mortality in 17 Chinese cities: The China air pollution and health effects study (CAPES). Environ. Res. 2012, 118, 101–106. [Google Scholar] [CrossRef]
- Han, J.; Meng, C.; Liu, J.; Xu, C.; Liu, Z.; Wang, Q.; Liu, Y.; Xu, D. The impacts of continuous improvements in air quality on mortality in Beijing: A longitudinal comparative study. Chemosphere 2021, 291, 132893. [Google Scholar] [CrossRef]
- Costa, A.F.; Hoek, G.; Brunekreef, B.; de Leon, A.C.M.P. Effects of NO(2) exposure on daily mortality in São Paulo, Brazil. Environ. Res. 2017, 159, 539–544. [Google Scholar] [CrossRef]
- Stieb, D.A.-O.; Zheng, C.; Salama, D.; Berjawi, R.; Emode, M.; Hocking, R.; Lyrette, N.; Matz, C.; Lavigne, E.; Shin, H.H. Systematic review and meta-analysis of case-crossover and time-series studies of short term outdoor nitrogen dioxide exposure and ischemic heart disease morbidity. Environ. Health 2020, 19, 47. [Google Scholar] [CrossRef]


| Period | Mean | SD | Min | Median | Max | IQR | |
|---|---|---|---|---|---|---|---|
| Air pollutant concentration | |||||||
| PM2.5 (μg/m3) | 2014–2020 | 60.6 | 57.3 | 3.0 | 44.0 | 477.0 | 55.0 |
| 2014–2015 | 82.3 | 70.5 | 5.0 | 62.0 | 477.0 | 80.0 | |
| 2016–2017 | 65.6 | 60.3 | 6.0 | 48.0 | 454.0 | 60.0 | |
| 2018–2020 | 42.7 | 35.7 | 3.0 | 34.0 | 233.0 | 38.0 | |
| PM10 (μg/m3) | 2014–2020 | 86.0 | 67.8 | 7.0 | 69.0 | 831.0 | 70.0 |
| 2014–2015 | 108.5 | 79.9 | 7.0 | 90.0 | 550.0 | 91.0 | |
| 2016–2017 | 91.7 | 71.4 | 7.0 | 76.0 | 764.0 | 73.0 | |
| 2018–2020 | 67.3 | 48.5 | 8.0 | 56.0 | 831.0 | 47.0 | |
| SO2 (μg/m3) | 2014–2020 | 9.2 | 12.8 | 2.0 | 4.0 | 133.0 | 7.0 |
| 2014–2015 | 16.7 | 19.6 | 2.0 | 9.0 | 9.0 | 17.0 | |
| 2016–2017 | 8.8 | 9.5 | 2.0 | 5.0 | 5.0 | 8.0 | |
| 2018–2020 | 4.5 | 3.1 | 2.0 | 3.0 | 3.0 | 3.0 | |
| NO2 (μg/m3) | 2014–2020 | 43.2 | 22.4 | 5.0 | 38.0 | 155.0 | 27.0 |
| 2014–2015 | 51.9 | 24.3 | 8.0 | 46.0 | 141.0 | 27.0 | |
| 2016–2017 | 47.1 | 22.7 | 11.0 | 42.0 | 155.0 | 25.0 | |
| 2018–2020 | 34.8 | 17.3 | 5.0 | 30.0 | 105.0 | 22.0 | |
| CO (mg/m3) | 2014–2020 | 1.1 | 0.9 | 0.1 | 1.0 | 8.0 | 0.5 |
| 2014–2015 | 1.4 | 1.0 | 0.1 | 1.0 | 8.0 | 1.0 | |
| 2016–2017 | 1.2 | 0.9 | 0.1 | 1.0 | 8.0 | 0.0 | |
| 2018–2020 | 0.8 | 0.5 | 0.1 | 1.0 | 3.0 | 0.7 | |
| 8 h-O3 (μg/m3) | 2014–2020 | 96.9 | 61.9 | 2.0 | 82.0 | 311.0 | 86.0 |
| 2014–2015 | 99.4 | 65.2 | 2.0 | 87.0 | 294.0 | 94.0 | |
| 2016–2017 | 97.2 | 65.7 | 2.0 | 83.0 | 311.0 | 89.0 | |
| 2018–2020 | 95.1 | 56.8 | 2.0 | 80.0 | 283.0 | 76.5 | |
| Meteorological measures | |||||||
| Temperature (°C) | 2014–2020 | 15.7 | 9.9 | −14.3 | 17.5 | 32.6 | 15.2 |
| Relative humidity (%) | 2014–2020 | 48.7 | 19.0 | 8.0 | 48.0 | 99.0 | 28.2 |
| Outpatient hospital visits (n/day) | |||||||
| Total | 2014–2020 | 27 | 21 | 2 | 22 | 175 | 19 |
| Male | 2014–2020 | 17 | 14 | 3 | 13 | 120 | 13 |
| Female | 2014–2020 | 10 | 8 | 2 | 8 | 75 | 8 |
| Age 18–45 | 2014–2020 | 16 | 15 | 1 | 12 | 123 | 12 |
| Age 46–65 | 2014–2020 | 6 | 5 | 2 | 5 | 31 | 5 |
| Age > 65 | 2014–2020 | 2 | 2 | 3 | 2 | 16 | 3 |
| Warm season (4–9) | 2014–2020 | 31 | 22 | 2 | 26 | 175 | 24 |
| Cool season (10-3) | 2014–2020 | 23 | 20 | 2 | 19 | 160 | 15 |
| Pollen season (4–5, 8–9) | 2014–2020 | 39 | 23 | 3 | 34 | 175 | 27 |
| Non-pollen season (others) | 2014–2020 | 21 | 18 | 1 | 18 | 160 | 13 |
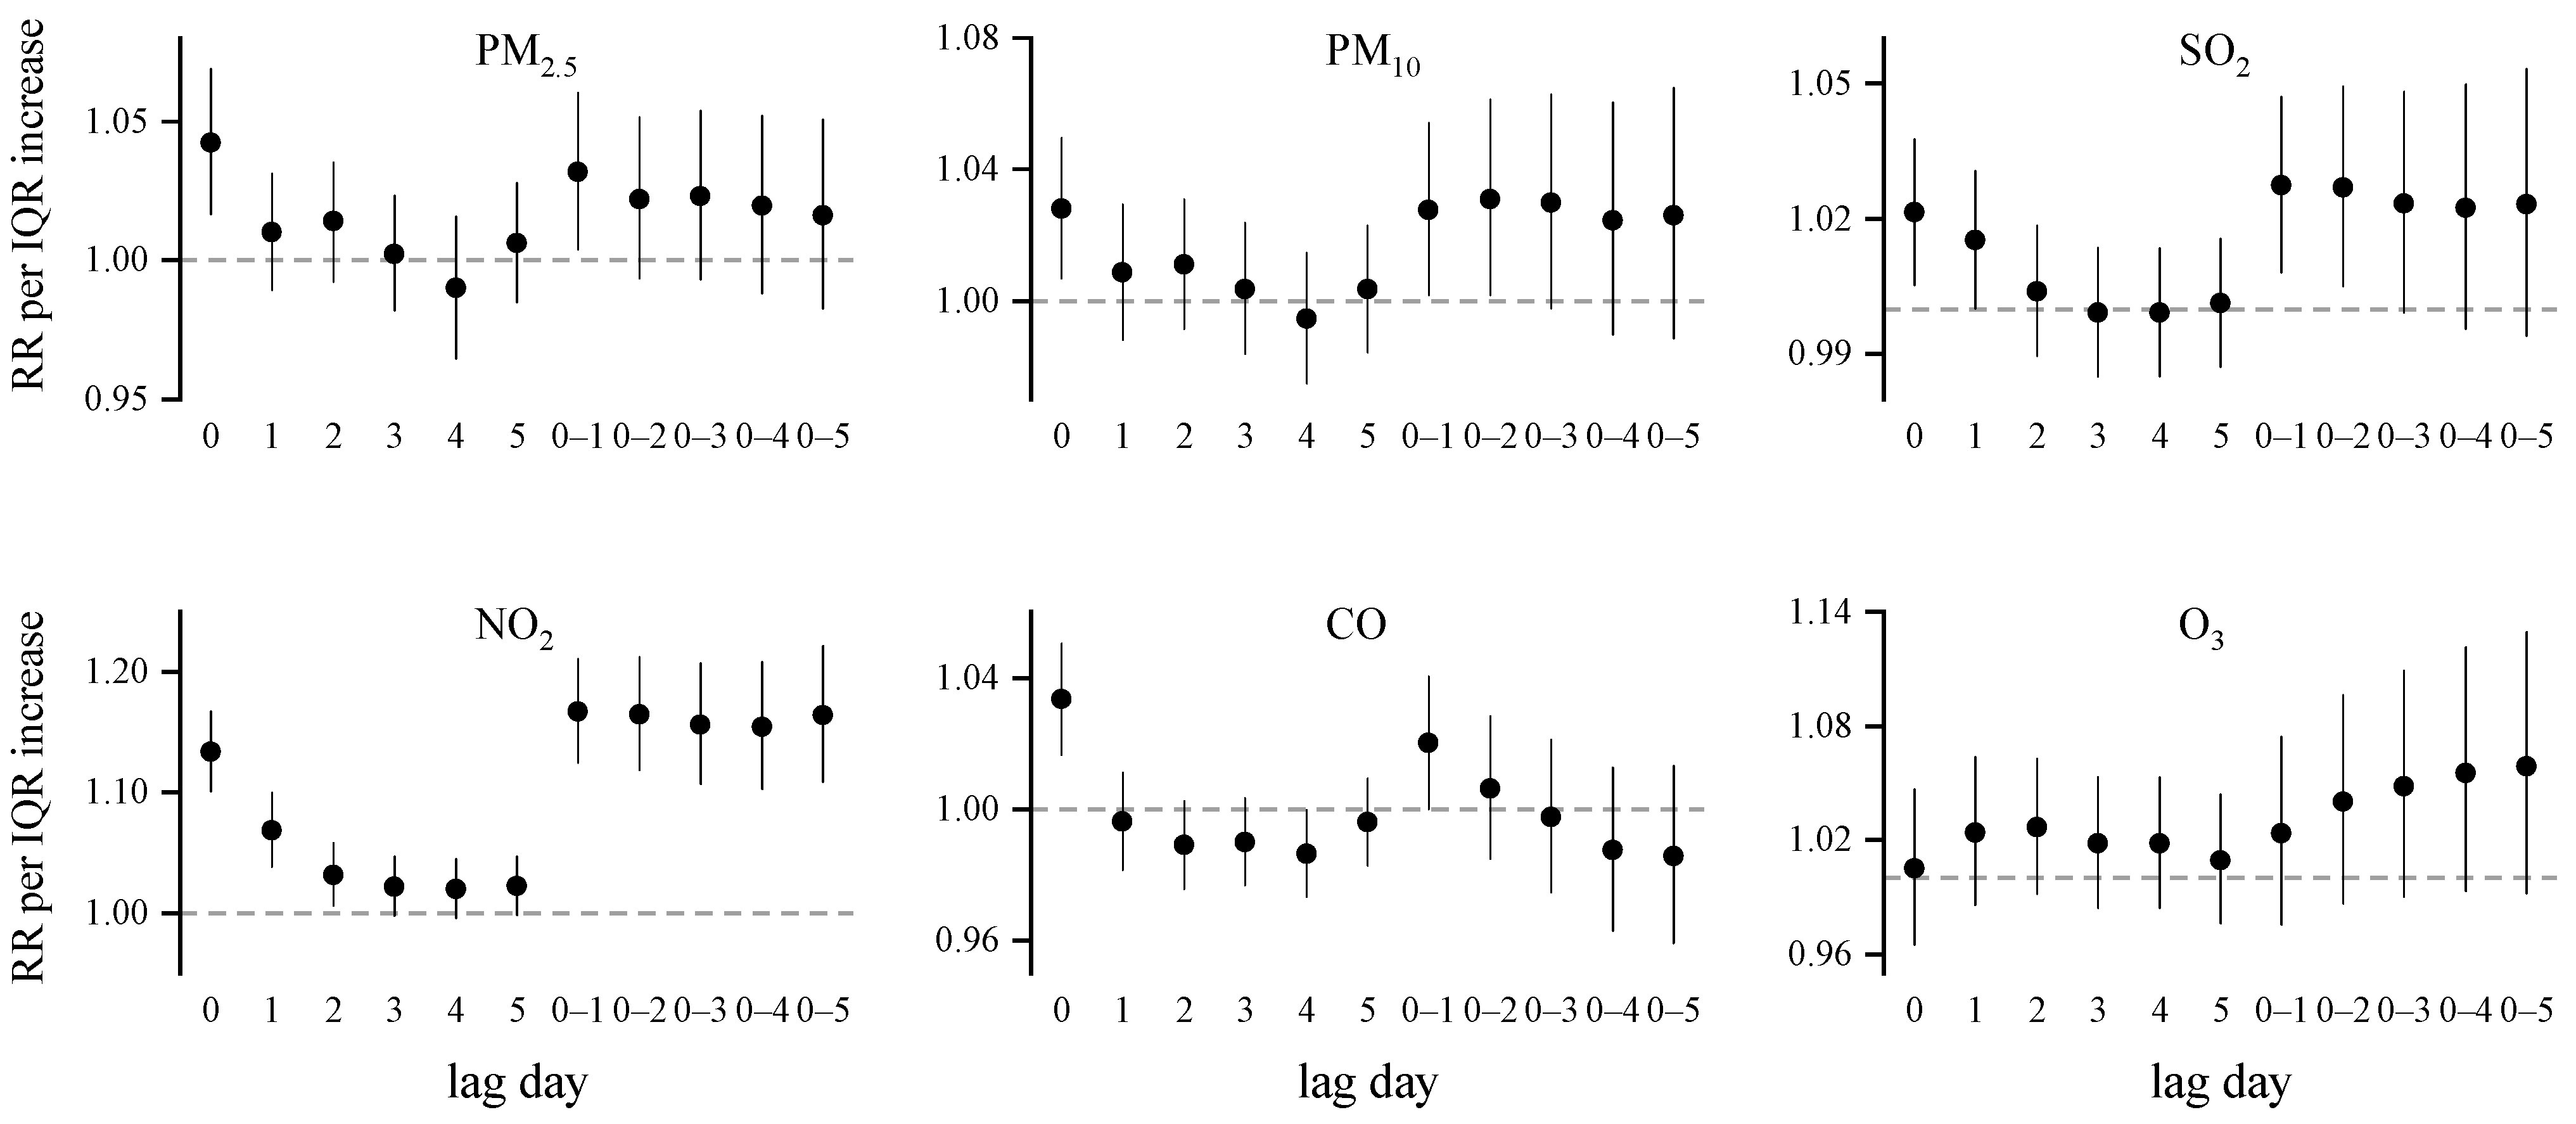
| Warm Season | Cool Season | Pollen Season | Non-Pollen Season | |
|---|---|---|---|---|
| PM2.5 | 1.044 (1.009–1.081) * | 1.027 (0.999–1.055) | 1.032 (0.992–1.074) | 1.010 (0.985–1.035) |
| PM10 | 1.020 (0.992–1.048) | 1.009 (0.986–1.031) | 1.014 (0.985–1.045) | 1.012 (0.991–1.033) |
| SO2 | 1.030 (1.001–1.059) * | 1.011 (0.996–1.025) | 1.027 (0.995–1.060) | 1.009 (0.995–1.023) |
| NO2 | 1.079 (1.031–1.129) * | 1.091 (1.058–1.125) * | 1.073 (1.020–1.128) * | 1.086 (1.057–1.117) * |
| CO | 1.027 (1.005–1.050) * | 1.001 (0.985–1.018) | 1.019 (0.991–1.047) | 1.002 (0.987–1.017) |
| O3 | 1.035 (0.998–1.073) | 0.950 (0.870–1.037) | 1.050 (1.006–1.096) * | 0.974 (0.923–1.028) |
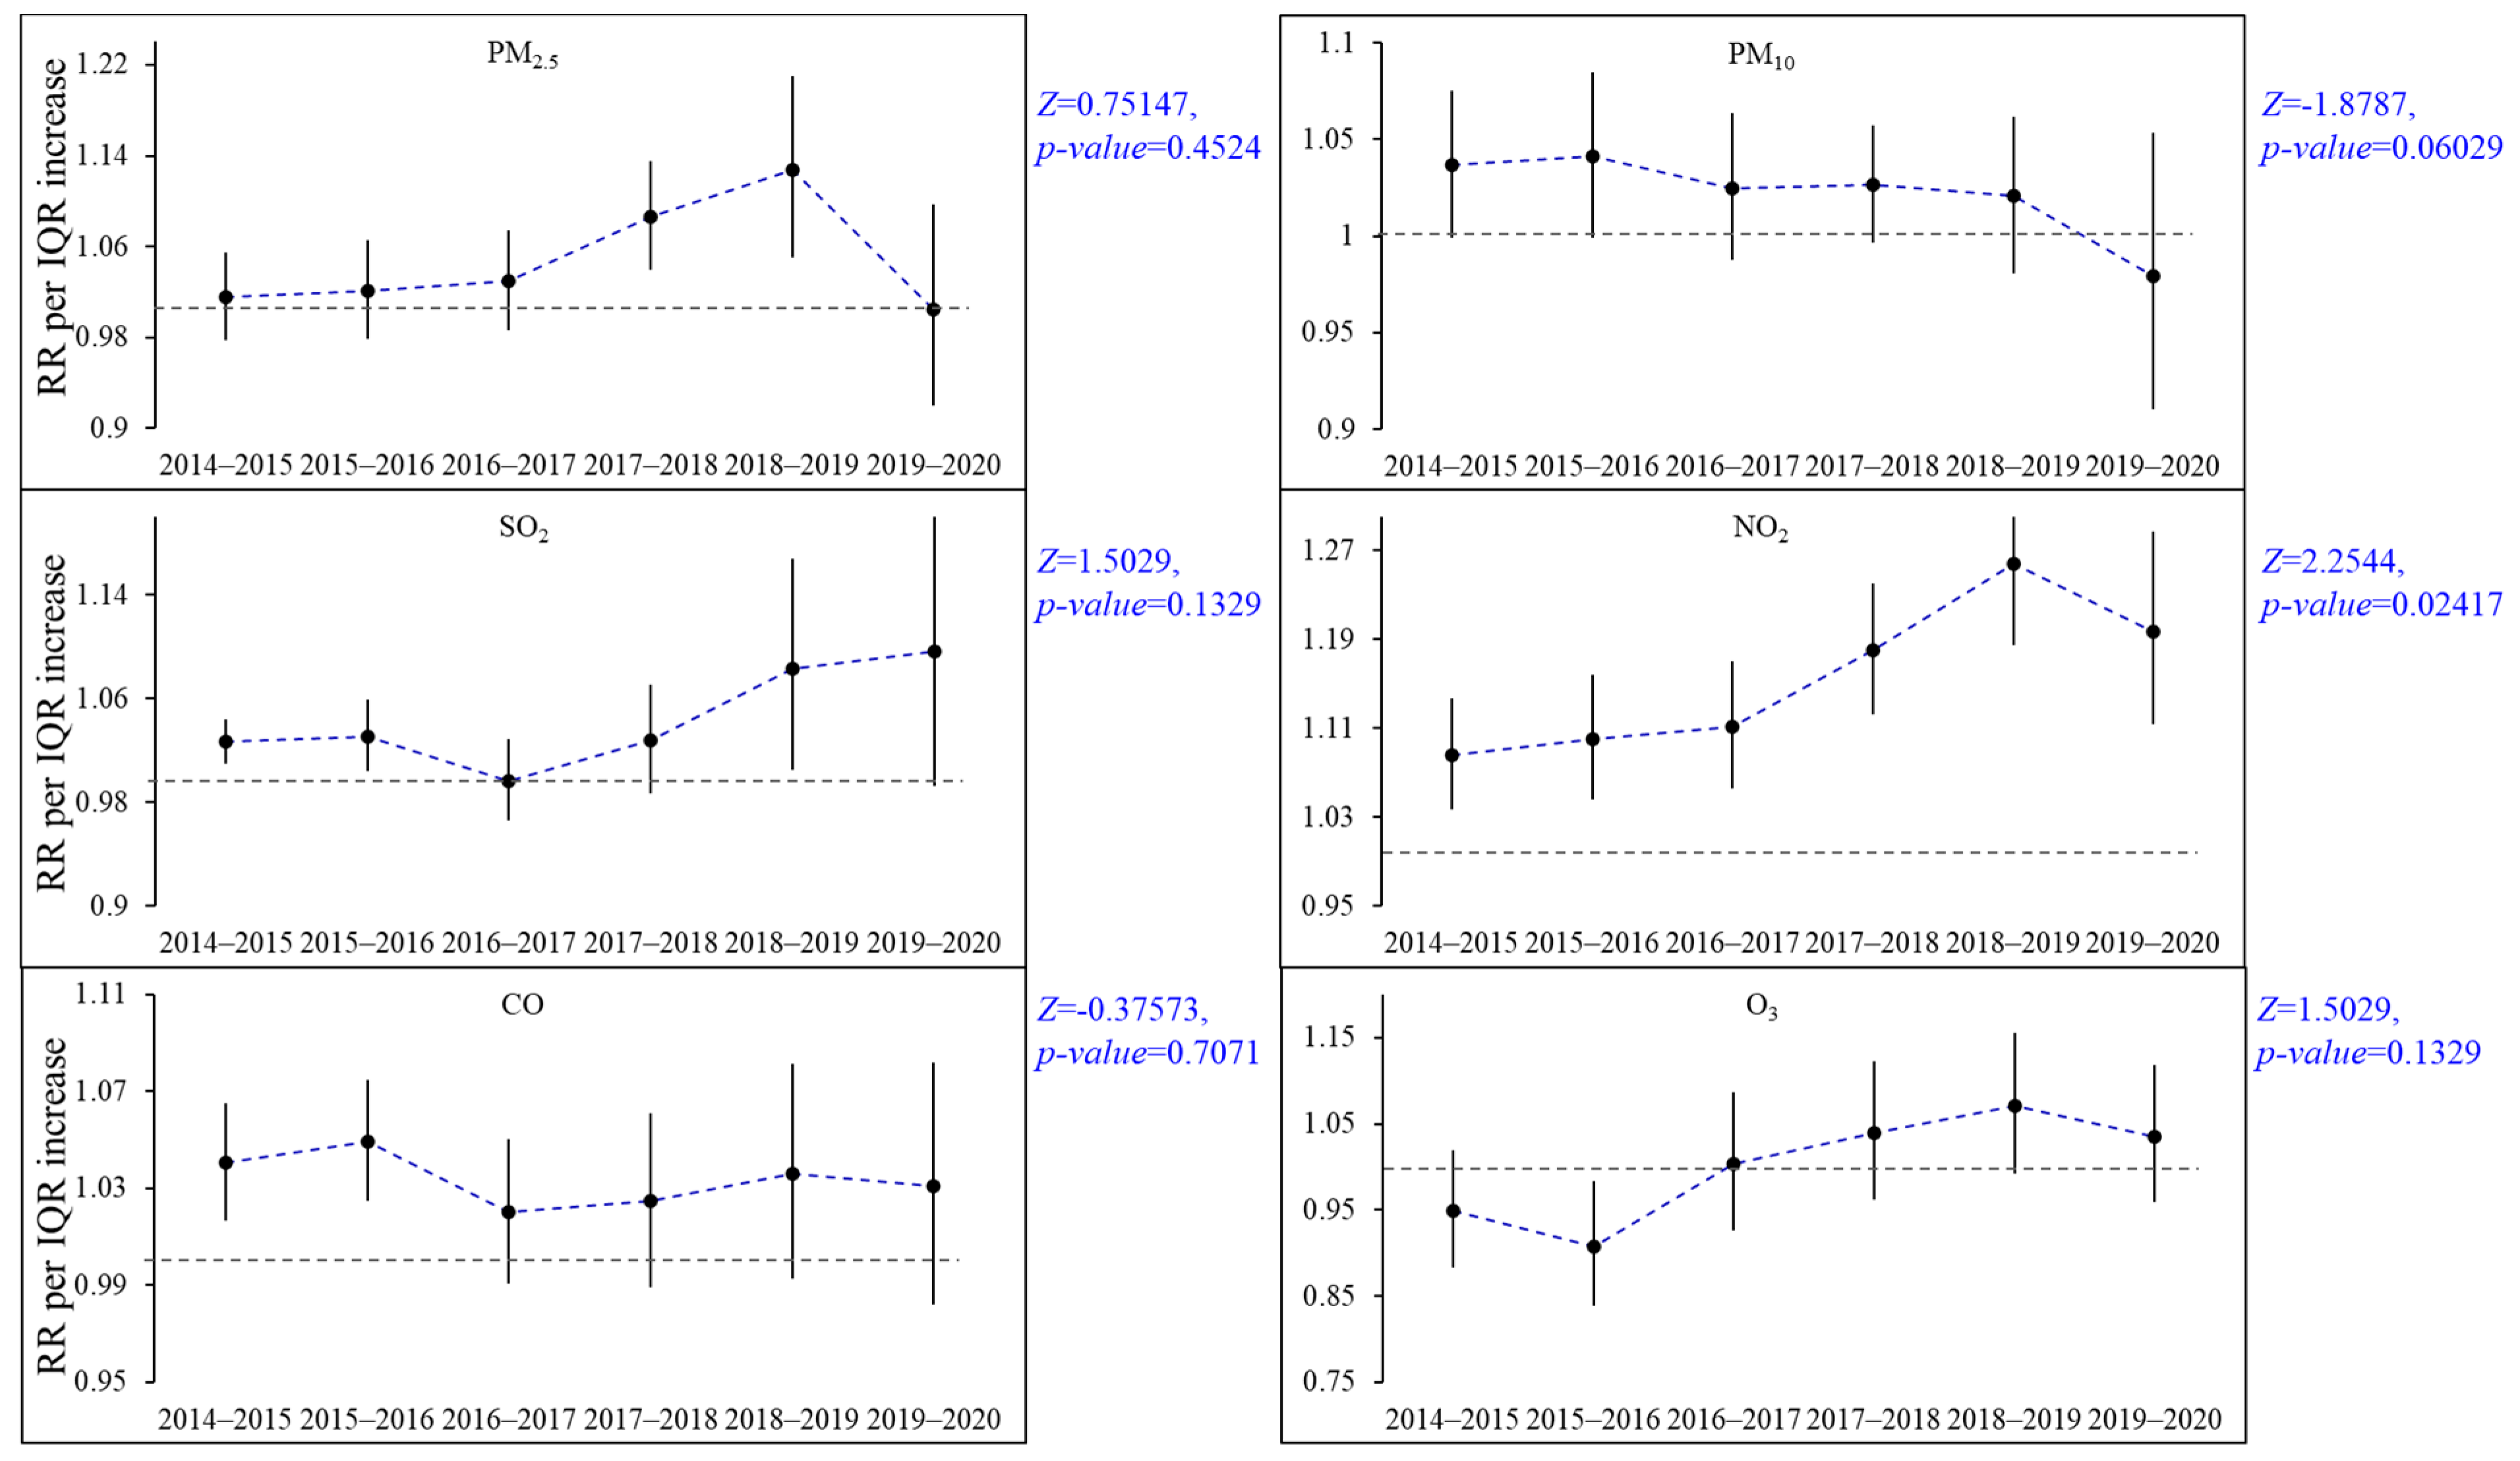
| Pollutant | Period 1 | Period 2 | Period 3 | p Value a |
|---|---|---|---|---|
| PM2.5 | 1.015 (0.978, 1.054) | 1.030 (0.987, 1.075) | 1.069 (1.005, 1.135) | 0.771 |
| PM10 | 1.037 (1.001, 1.075) | 1.025 (0.987, 1.063) | 1.008 (0.971,1.046) | 0.123 |
| SO2 | 1.027 (1.009, 1.044) | 0.997 (0.966, 1.028) | 1.074 (1.003, 1.149) | 0.725 |
| NO2 | 1.086 (1.037, 1.137) | 1.111 (1.055, 1.170) | 1.214 (1.149, 1.282) | 0.051 |
| CO | 1.041 (1.017, 1.065) | 1.020 (0.991, 1.050) | 1.027 (0.990, 1.066) | 0.112 |
| O3 | 0.949 (0.883, 1.019) | 1.003 (0.927, 1.087) | 1.040 (0.975, 1.105) | 0.353 |
Publisher’s Note: MDPI stays neutral with regard to jurisdictional claims in published maps and institutional affiliations. |
© 2022 by the authors. Licensee MDPI, Basel, Switzerland. This article is an open access article distributed under the terms and conditions of the Creative Commons Attribution (CC BY) license (https://creativecommons.org/licenses/by/4.0/).
Share and Cite
Li, S.; Wang, G.; Wang, B.; Cao, S.; Zhang, K.; Duan, X.; Wu, W. Has the Risk of Outpatient Visits for Allergic Rhinitis, Related to Short-Term Exposure to Air Pollution, Changed over the Past Years in Beijing, China? Int. J. Environ. Res. Public Health 2022, 19, 12529. https://doi.org/10.3390/ijerph191912529
Li S, Wang G, Wang B, Cao S, Zhang K, Duan X, Wu W. Has the Risk of Outpatient Visits for Allergic Rhinitis, Related to Short-Term Exposure to Air Pollution, Changed over the Past Years in Beijing, China? International Journal of Environmental Research and Public Health. 2022; 19(19):12529. https://doi.org/10.3390/ijerph191912529
Chicago/Turabian StyleLi, Sai, Gang Wang, Beibei Wang, Suzhen Cao, Kai Zhang, Xiaoli Duan, and Wei Wu. 2022. "Has the Risk of Outpatient Visits for Allergic Rhinitis, Related to Short-Term Exposure to Air Pollution, Changed over the Past Years in Beijing, China?" International Journal of Environmental Research and Public Health 19, no. 19: 12529. https://doi.org/10.3390/ijerph191912529