

Determination of Carbonyl Compounds in Different Work Environments: Comparison between LC-UV/DAD and LC–MS/MS Detection Methods
 , , and
Abstract
:1. Introduction
2. Materials and Methods
2.1. Chemical and Materials
2.2. Instrumentation
2.3. Sampling Sites and Strategy
2.4. Sample Analysis
2.5. Optimization of the Analytical Determinations
- (1)
- Lowest Level (LL): Concentration level representing an agreement between the LOQs of the detected analytes;
- (2)
- Medium Level (ML): Concentration level corresponding to the highest LOQ of the detected analytes;
- (3)
- Highest Level (HL): Concentration corresponding to 10 times the LL.
2.6. Statistical Elaboration
3. Results and Discussion
3.1. Optimization of the Chromatographic Separation
3.2. Optimization of the Spectrometric Determination and Data Quality
3.3. Optimization of the Spectroscopic Determination and Data Quality
3.4. Comparison between LC-MS/MS and LC-UV/DAD
3.5. Real Samples
4. Conclusions
Supplementary Materials
Author Contributions
Funding
Institutional Review Board Statement
Informed Consent Statement
Data Availability Statement
Conflicts of Interest
References
- Ho, S.S.H.; Cheng, Y.; Bai, Y.; Ho, K.F.; Dai, W.T.; Cao, J.J.; Lee, S.C.; Huang, Y.; Ip, H.S.S.; Deng, W.J.; et al. Risk Assessment of Indoor Formaldehyde and Other Carbonyls in Campus Environments in Northwestern China. Aerosol Air. Qual. Res. 2016, 16, 1967–1980. [Google Scholar] [CrossRef]
- De Carvalho, A.B.; Kato, M.; Rezende, M.M.; de Pereira, P.A.; de Andrade, J.B. Determination of carbonyl compounds in the atmosphere of charcoal plants by HPLC and UV detection. J. Sep. Sci. 2008, 31, 1686–1693. [Google Scholar] [CrossRef]
- Lewtas, J. Air pollution combustion emissions: Characterization of causative agents and mechanisms associated with cancer, reproductive, and cardiovascular effects. Mutat. Res. 2007, 636, 95–133. [Google Scholar] [CrossRef]
- Atkinson, R.; Arey, J. Atmospheric degradation of volatile organic compounds. Chem. Rev. 2003, 103, 4605–4638. [Google Scholar] [CrossRef]
- WHO (World Health Organization). WHO Guidelines for Indoor Air Quality. Selected Pollutants; WHO Regional Office for Europe: Copenhagen, Denmark, 2010. [Google Scholar]
- Sousa, F.W.; Caracas, I.B.; Nascimento, R.F.; Cavalcante, R.M. Exposure and cancer risk assessment for formaldehyde and acetaldehyde in the hospitals, Fortaleza-Brazil. Build Environ. 2011, 46, 2115–2120. [Google Scholar] [CrossRef]
- IARC (International Agency for Research on Cancer). Monographs on the Evaluation of Carcinogenic Risks to Humans. In Re-Evaluation of some Organic Chemicals, Hydrazine and Hydrogen Peroxide; IARC Working Group on the Evaluation of Carcinogenic Risks to Humans; IARC: Lyon, France, 1999. [Google Scholar]
- IARC (International Agency for Research on Cancer). Monographs on the Evaluation of Carcinogenic risks to Humans. In Formaldehyde, 2-Butoxyethanol and 1-Tert-Butoxypropan-2-ol; IARC Working Group on the Evaluation of Carcinogenic Risks to Humans; IARC: Lyon, France, 2006. [Google Scholar]
- Protano, C.; Buomprisco, G.; Cammalleri, V.; Pocino, R.N.; Marotta, D.; Simonazzi, S.; Cardoni, F.; Petyx, M.; Iavicoli, S.; Vitali, M. The Carcinogenic Effects of Formaldehyde Occupational Exposure: A Systematic Review. Cancers 2022, 14, 165. [Google Scholar] [CrossRef]
- Hadei, M.; Hopke, P.K.; Shahsavani, A.; Moradi, M.; Yarahmadi, M.; Emam, B.; Rastkari, N. Indoor concentrations of VOCs in beauty salons; association with cosmetic practices and health risk assessment. J. Occup. Med. Toxicol. 2018, 13, 1–9. [Google Scholar] [CrossRef]
- Jafari, M.J.; Khajevandi, A.A.; Mousavi Najarkola, S.A.; Yekaninejad, M.S.; Pourhoseingholi, M.A.; Omidi, L.; Kalantary, S. Association of sick building syndrome with indoor air parameters. Tanaffos 2015, 14, 55–62. [Google Scholar]
- EPA (United States Environmental Protection Agency). Questions about Your Community: Indoor Air; EPA: Washington, DC, USA, 2015.
- Cammalleri, V.; Pocino, R.N.; Marotta, D.; Protano, C.; Sinibaldi, F.; Simonazzi, S.; Petyx, M.; Iavicoli, S.; Vitali, M. Occupational scenarios and exposure assessment to formaldehyde: A systematic review. Indoor Air 2022, 32, e12949. [Google Scholar] [CrossRef]
- Scarselli, A.; Corfiati, M.; Di Marzio, D.; Iavicoli, S. National Estimates of Exposure to Formaldehyde in Italian Workplaces. Ann. Work Expo. Health 2017, 61, 33–43. [Google Scholar] [CrossRef]
- Jurvelin, J.; Vartiainen, M.; Jantunen, M.; Pasanen, P. Personal Exposure Levels and Microenvironmental Concentrations of Formaldehyde and Acetaldehyde in the Helsinki Metropolitan Area, Finland. J. Air Waste Manag. Assoc. 2001, 51, 17–24. [Google Scholar] [CrossRef] [Green Version]
- Maroni, M.; Seifert, B.; Lindvall, T. Indoor Air Quality a Comprehensive Reference Book, 1st ed.; Elsevier Science Ltd.: Amsterdam, The Netherlands, 1995. [Google Scholar]
- Calisti, R.; Chiaverini, A.F.; Mei, R. Aldehydes others than formaldehyde: Exposure patterns and their significance in a set of Italian indoor workplaces, 2011–2020. J. Occup. Environ. Hyg. 2020, 11, 102–146. [Google Scholar] [CrossRef]
- TOXNET. Crotonaldehyde; National Library of Medicine HSDB Database: Bethesda, MD, USA, 2020. [Google Scholar]
- Zhang, S.; Chen, H.; Wang, A.; Liu, Y.; Hou, H.; Hu, Q. Assessment of genotoxicity of four volatile pollutants from cigarette smoking based on the in vitro yH2AX assay using high content screening. Environ. Toxicol. Pharmacol. 2017, 55, 30–36. [Google Scholar] [CrossRef] [PubMed]
- Zhang, S.; Chen, H.; Wang, A.; Liu, Y.; Hou, H.; Hu, Q. Combined effect of co-exposure to formaldehyde and acrolein mixtures on cytotoxicity and genotoxicity in vitro. Environ. Sci. Pollut. Res. Int. 2018, 25, 25306–25314. [Google Scholar] [CrossRef] [PubMed]
- Xie, M.Z.; Shoulkamy, M.I.; Salem, A.M.; Oba, S.; Goda, M.; Nakano, T.; Ide, H. Aldehydes with high and low toxicities inactivate cells by damaging distinct cellular targets. Mutat. Res. 2016, 786, 41–51. [Google Scholar] [CrossRef]
- Chi, Y.; Feng, Y.; Wen, S.; Lü, H.; Yu, Z.; Zhang, W.; Sheng, G.; Fu, J. Determination of carbonyl compounds in the atmosphere by DNPH derivatization and LC-ESI-MS/MS detection. Talanta 2007, 72, 539–545. [Google Scholar] [CrossRef]
- Zeng, Y.; Wen, S.; Chen, Y.; Wang, X.; Lü, H.; Bi, X.; Sheng, G.; Fu, J. Ambient levels of carbonyl compounds and their sources in Guangzhou, China. Atmos. Environ. 2005, 39, 1789–1800. [Google Scholar] [CrossRef]
- Wang, H.W.; Tong, X.Y.; Yan, L.Q.; Sheng, J.Y.; Liu, S.M. Determination of Volatile Carbonyl Compounds in Cigarette Smoke by LC-DAD. Chromatographia 2005, 62, 631–636. [Google Scholar] [CrossRef]
- Zhang, T.; Jiang, G.; Guazzotti, S.; Elmashni, D. Quantitative Analysis of Carbonyl-DNPH Derivatives by UHPLC/UV; Thermo Fisher Scientific Application note; Thermo Fisher: Waltham, MA, USA, 2010; p. 52007. [Google Scholar]
- Lü, H.; Wen, S.; Feng, Y.; Wang, X.; Bi, X.; Sheng, G.; Fu, J. Indoor and outdoor carbonyl compounds and BTEX in the hospitals of Guangzhou, China. Sci. Total Environ. 2006, 368, 574–584. [Google Scholar] [CrossRef]
- Lü, H.; Cai, Q.Y.; Wen, S.; Chi, Y.; Guo, S.; Sheng, G.; Fu, J.; Katsoyiannis, A. Carbonyl compounds and BTEX in the special rooms of hospital in Guangzhou, China. J. Hazard Mater. 2010, 178, 673–679. [Google Scholar] [CrossRef]
- Evtyugina, M.; Vicente, E.D.; Vicente, A.M.; Nunes, T.; Lucarelli, F.; Calzolai, G.; Nava, S.; Blanco-Alegre, C.; Calvo, A.I.; Castro, A.; et al. Air quality and particulate matter speciation in a beauty salon and surrounding outdoor environment: Exploratory study. Atmos. Pollut. Res. 2021, 12, 101174. [Google Scholar] [CrossRef]
- Perdelli, F.; Spagnolo, A.M.; Cristina, M.L.; Sartini, M.; Dallera, M.; Ottria, G.; Orlando, P. Occupational exposure to formaldehyde in three pathology departments. Ann. Ig. 2006, 18, 481–490. [Google Scholar] [PubMed]
- De Ochs, M.; Grotz, L.O.; Factorine, L.S.; Rodrigues, M.R.; Pereira Netto, A.D. Occupational exposure to formaldehyde in an institute of morphology in Brazil: A comparison of area and personal sampling. Environ. Sci. Pollut. Res. Int. 2011, 19, 2813–2819. [Google Scholar] [CrossRef]
- Bellisario, V.; Mengozzi, G.; Grignani, E.; Bugiani, M.; Sapino, A.; Bussolati, G.; Bono, R. Towards a formalin-free hospital. Levels of 15-F2t-isoprostane and malondialdehyde to monitor exposure to formaldehyde in nurses from operating theatres. Toxicol. Res. 2016, 5, 1122–1129. [Google Scholar] [CrossRef]
- Higashikubo, I.; Miyauchi, H.; Yoshida, S.; Tanaka, S.; Matsuoka, M.; Arito, H.; Araki, A.; Shimizu, H.; Sakurai, H. Assessment of workplace air concentrations of formaldehyde during and before working hours in medical facilities. Ind. Health 2017, 55, 192–198. [Google Scholar] [CrossRef] [PubMed]
- Lee, E.G.; Magrm, R.; Kusti, M.; Kashon, M.L.; Guffey, S.; Costas, M.M.; Boykin, C.J.; Harper, M. Comparison between active (pumped) and passive (diffusive) sampling methods for formaldehyde in pathology and histology laboratories. J. Occup. Environ. Hyg. 2017, 14, 31–39. [Google Scholar] [CrossRef] [PubMed]
- Saraga, D.; Pateraki, S.; Papadopoulos, A.; Vasilakos, C.; Maggos, T. Studying the indoor air quality in three non-residential environments of different use: A museum, a printery industry and an office. Build Environ. 2011, 46, 2333–2341. [Google Scholar] [CrossRef]
- Loh, M.M.; Houseman, E.A.; Gray, G.M.; Levy, J.I.; Spengler, J.D.; Bennett, D.H. Measured Concentrations of VOCs in Several Non-Residential Microenvironments in the United States. Environ. Sci. Technol. 2006, 40, 6903–6911. [Google Scholar] [CrossRef]
- Liang, W.; Zhao, B.; Liu, J.; Pei, J. Can carbon dioxide be a good indicator for formaldehyde in residences?—Monte Carlo modeling for a whole year. Sci. Technol. Built. Environ. 2020, 26, 749–762. [Google Scholar] [CrossRef]
- Shao, Y.; Wang, Y.; Zhao, R.; Chen, J.; Zhang, F.; Linhardt, R.J.; Zhong, W. Biotechnology progress for removal of indoor gaseous formaldehyde. Appl. Microbiol. Biotechnol. 2020, 104, 3715–3727. [Google Scholar] [CrossRef]


| Sampling Date | Sampling SITE | Sampling Type | Main Task/Activity | Sampling Time (min) | Volume (m3) | |
|---|---|---|---|---|---|---|
| PL1-lab | 28 January 2021 | Pathology Laboratory | Laboratory Environment | Preparation of anatomical specimens in formalin | 264 | 0.037 |
| PL2-out | Environmental—External window ledge | Urban environment | 266 | 0.037 | ||
| PL3-tech | Staff—Laboratory Technician | Preparation of anatomical specimens in formalin | 261 | 0.037 | ||
| PL4-tech | Staff—Laboratory Technician | Preparation of anatomical specimens in formalin | 262 | 0.037 | ||
| PL5-doc | Staff—Ward doctor | Preparation of anatomical specimens in formalin | 202 | 0.028 | ||
| PL6-solv | Environmental—Solvent storage | Storage of formalin tanks | 273 | 0.038 | ||
| GA1-nurs | 2 February 2021 | Gastroenteroloy Ambulatory | Staff—Nurse | Clinical examinations—gastroscopy and colonoscopy | 149 | 0.021 |
| GA2-nurs | Staff—Nurse | Clinical examinations—gastroscopy and colonoscopy | 146 | 0.020 | ||
| GA3-doc | Staff—Ward doctor | Clinical examinations—gastroscopy and colonoscopy | 125 | 0.018 | ||
| GA4-lab | Laboratory Environment | Clinical examinations—gastroscopy and colonoscopy | 159 | 0.022 | ||
| GA5-out | Environmental—External window ledge | Urban environment | 140 | 0.020 | ||
| CS1-desk | 30 April 2021 | Copy Shop | Staff—desk | Cashier | 300 | 0.042 |
| CS2-glue | Staff—Gluing machine | Gluing of backs of books | 300 | 0.042 | ||
| CS3-photo | Staff—Photocopier | Use of laser photocopier | 300 | 0.042 | ||
| BS1-hair | 31 April 2021 | Beauty Salon | Staff—Hairdresser | Hairstyling, hair dye | 351 | 0.049 |
| BS2-nail | Staff—Nail Technician | Gel nails extension | 352 | 0.049 | ||
| BS3-sol | Environmental—Solarium | Tanning bed | 347 | 0.049 | ||
| BS4-rec | Staff—Receptionist | Secretarial work | 343 | 0.048 | ||
| BS5-bea | Staff—Beautician | Waxing, manicure, pedicure | 334 | 0.047 | ||
| BS6-out | Environmental—External window ledge | Urban environment | 335 | 0.047 | ||
| PH1-out | 3 May 2021 | Pharmacy | Environmental—External window ledge | Urban environment | 375 | 0.053 |
| PH2-ware | Environmental—Warehouse | Storage of pharmaceutical products | 315 | 0.044 | ||
| PH3-store | Staff—Storeman | Storage of pharmaceutical products | 313 | 0.044 | ||
| PH4-dercon | Staff—Dermocosmetic consultant | Employed to the sale | 314 | 0.044 | ||
| PH5-phar | Staff—Pharmacist | Employed to the sale | 321 | 0.045 | ||
| PH6-der | Environmental—Dermocosmetic | Presence of wooden shelves | 314 | 0.044 | ||
| HL1-lab | 22 September2021 | Histology Laboratory | Laboratory Environment | Preparation of anatomical specimens in formalin | 406 | 0.057 |
| HL2-tech | Staff—Laboratory Technician | Preparation of anatomical specimens in formalin | 406 | 0.057 | ||
| HL3-tech | Staff—Laboratory Technician | Preparation of anatomical specimens in formalin | 397 | 0.056 | ||
| HL4-sec | Staff—Secretary | Acceptance of histological samples | 394 | 0.055 | ||
| HL5-tech | Staff—Laboratory Technician | Preparation of anatomical specimens in formalin | 391 | 0.055 | ||
| HL6-out | Environmental—External window ledge | Urban environment | 393 | 0.055 | ||
| HRL1-tech | 5 April 2022 | Histology Research Laboratory | Staff—Laboratory and Enclosure Technician | Preparation of animal anatomical specimens in formalin and management of the enclosure | 154 | 0.022 |
| HRL2-lab | Laboratory Environment | Preparation of animal anatomical specimens in formalin | 155 | 0.022 | ||
| HRL3-out | Environmental—External window ledge | Urban environment | 155 | 0.022 | ||
| HRL4-bio | Staff—Biologist Head of the Enclosure | Histological sampling of animal parts and management of the enclosure | 81 | 0.011 | ||
| HRL5-lab | Laboratory environment—Enclosure | Histological sampling of animal parts | 51 | 0.007 | ||
| HpL1-out | 6 April 2022 | Histopathology Laboratory | Environmental—External window ledge | Urban environment | 244 | 0.034 |
| HpL2-tech | Staff—Laboratory Technician | Preparation of anatomical specimens in formalin | 311 | 0.044 | ||
| HpL3-lab | Laboratory Environment | Preparation of anatomical specimens in formalin | 306 | 0.043 | ||
| HpL4-lab | Laboratory Environment | Storage of anatomical specimens in formalin | 302 | 0.042 | ||
| HpL5-doc | Staff—Ward doctor | Preparation of anatomical specimens in formalin | 163 | 0.023 | ||
| HpL6-doc | Staff—Ward doctor | Preparation of anatomical specimens in formalin | 251 | 0.035 | ||
| CL1-lab | 12 April 2022 | Chemical Laboratory | Laboratory Environment | Environmental Samples Preparation and Storage | 273 | 0.038 |
| CL2-lab | Laboratory Environment | Environmental Samples Preparation and Analysis | 270 | 0.038 | ||
| CL3-lab | Laboratory Environment | Quantitative analytical chemistry | 271 | 0.038 | ||
| CL4-off | Office | Data elaboration | 271 | 0.038 | ||
| CL5-out | Environmental—External window ledge | Urban environment | 270 | 0.038 | ||
| ParL1-lab | 13 April 2022 | Parasitology Laboratory | Laboratory environment | Sample preparation and analysis | 222 | 0.031 |
| ParL2-lab | Laboratory environment | Sample preparation and analysis | 221 | 0.031 | ||
| ParL3-corr | Corridor Outside the Parasitology Laboratory | - | 222 | 0.031 | ||
| ParL4-lab | Laboratory Environment | Sample preparation and analysis | 220 | 0.031 |
| Retention Times (min) | Molecular Mass | Precursor Ion | Product Ion | Collision Energy (eV) | Collision Cell Exit Potential (V) | ||
|---|---|---|---|---|---|---|---|
| Fo-DNPH | 5.83 | 210 | 209 | Q | 151 | −11 | −15 |
| q | 163 | −11 | −15 | ||||
| Ace-DNPH | 8.05 | 224 | 223 | Q | 151 | −12 | −6 |
| q | 163 | −12 | −10 | ||||
| Pro-DNPH | 9.68 | 238 | 237 | Q | 163 | −15 | −15 |
| q | 151 | −15 | −15 | ||||
| Cro-DNPH | 10.36 | 250 | 249 | Q | 172 | −16 | −15 |
| q | 151 | −16 | −15 | ||||
| Bu-DNPH | 10.65 | 252 | 251 | Q | 163 | −15 | −15 |
| q | 151 | −15 | −15 | ||||
| Cy-DNPH | 11.29 | 278 | 277 | Q | 247 | −15 | −15 |
| q | 231 | −24 | −15 | ||||
| Val-DNPH | 11.40 | 266 | 265 | Q | 163 | −15 | −15 |
| q | 152 | −25 | −15 | ||||
| Hex-DNPH | 12.06 | 280 | 279 | Q | 152 | −25 | −15 |
| q | 163 | −15 | −15 | ||||
| Hep-DNPH | 12.73 | 294 | 293 | Q | 163 | −15 | −15 |
| q | 152 | −25 | −15 | ||||
| Oct-DNPH | 13.53 | 308 | 307 | Q | 163 | −19 | −15 |
| q | 205 | −19 | −15 | ||||
| Non-DNPH | 14.53 | 322 | 321 | Q | 163 | −20 | −15 |
| q | 205 | −20 | −15 | ||||
| Dec-DNPH | 15.85 | 336 | 335 | Q | 163 | −19 | −15 |
| q | 171 | −19 | −15 |
| Linearity | Intra-Day Repeatability (n = 10) | Inter-Day Repeatability (n = 7) | |||||||
|---|---|---|---|---|---|---|---|---|---|
| LOD | LOQ | R2 | LL | ML | HL | LL | ML | HL | |
| Fo-DNPH | 0.39 | 0.78 | 0.998 | 7.8 | 3.0 | 1.3 | 14 | 6.5 | 6.5 |
| Ace-DNPH | 0.39 | 0.78 | 0.999 | 6.8 | 2.9 | 1.2 | 10 | 6.3 | 7.7 |
| Pro-DNPH | 0.049 | 0.20 | 0.998 | 3.0 | 2.2 | 1.4 | 11 | 6.6 | 8.5 |
| Cro-DNPH | 0.049 | 0.20 | 0.998 | 3.6 | 3.3 | 1.4 | 8.8 | 7.3 | 9.4 |
| Bu-DNPH | 0.098 | 0.39 | 0.998 | 5.8 | 2.1 | 1.5 | 11 | 7.1 | 9.3 |
| Cy-DNPH | 0.012 | 0.024 | 0.997 | 3.5 | 2.5 | 2.3 | 15 | 12 | 13 |
| Val-DNPH | 0.024 | 0.098 | 0.998 | 4.6 | 2.7 | 2.6 | 11 | 9.2 | 11 |
| Hex-DNPH | 0.012 | 0.049 | 0.997 | 3.5 | 2.3 | 2.2 | 11 | 10 | 13 |
| Hep-DNPH | 0.012 | 0.098 | 0.997 | 2.3 | 1.9 | 1.8 | 13 | 14 | 16 |
| Oct-DNPH | 0.098 | 0.39 | 0.997 | 3.4 | 2.7 | 2.3 | 12 | 13 | 15 |
| Non-DNPH | 0.024 | 0.098 | 0.996 | 5.4 | 3.3 | 2.7 | 12 | 14 | 15 |
| Dec-DNPH | 0.049 | 0.20 | 0.997 | 3.7 | 1.5 | 2.6 | 8.6 | 9.8 | 11 |
| Linearity | Intra-Day Repeatability (n = 10) | Inter-Day Repeatability (n = 7) | |||||||
|---|---|---|---|---|---|---|---|---|---|
| LOD | LOQ | R2 | LL | ML | HL | LL | ML | HL | |
| Fo-DNPH | 16 | 62 | 0.999 | 10 | 4.9 | 1.6 | 9.3 | 11 | 9.5 |
| Ace-DNPH | 12 | 62 | 0.999 | 6.0 | 4.0 | 1.8 | 6.5 | 8.3 | 8.8 |
| Pro-DNPH | 8 | 31 | 0.999 | 5.8 | 2.7 | 1.0 | 5.6 | 7.6 | 9.3 |
| Cro-DNPH | 8 | 31 | 0.999 | 7.8 | 3.2 | 1.7 | 6.1 | 7.8 | 8.8 |
| Bu-DNPH | 8 | 31 | 0.999 | 3.8 | 1.3 | 0.80 | 5.6 | 7.2 | 9.2 |
| Cy-DNPH | 8 | 25 | 0.999 | 2.3 | 2.0 | 0.85 | 5.2 | 7.6 | 9.4 |
| Val-DNPH | 8 | 25 | 0.999 | 4.4 | 1.9 | 0.74 | 5.4 | 7.2 | 9.1 |
| Hex-DNPH | 8 | 25 | 0.999 | 5.6 | 1.8 | 1.3 | 5.0 | 6.8 | 9.2 |
| Hep-DNPH | 8 | 31 | 0.999 | 7.0 | 3.2 | 1.3 | 7.1 | 6.8 | 8.1 |
| Oct-DNPH | 8 | 31 | 0.999 | 6.1 | 3.7 | 1.2 | 6.3 | 6.5 | 9.3 |
| Non-DNPH | 12 | 62 | 0.999 | 8.2 | 5.6 | 1.0 | 10 | 7.1 | 9.3 |
| Dec-DNPH | 16 | 62 | 0.999 | 9.5 | 2.5 | 1.5 | 11 | 6.7 | 9.0 |
| Formaldehyde | Acetaldehyde | Propionaldehyde | |
|---|---|---|---|
| PL1-lab | 18 | 18 | - |
| PL2-out | 21 | 20 | 1.2 |
| PL3-tech | 3.9 | 0.5 | - |
| PL4-tech | 11 | 4.7 | |
| PL5-doc | 2.3 | 1.4 | - |
| PL6-solv | 0.5 | 0.6 | - |
| GA1-nurs | 12 | 16 | - |
| GA2-nurs | 18 | 24 | - |
| GA3-doc | 15 | 19 | - |
| GA4-lab | 13 | 14 | - |
| GA5-out | 7.0 | 22 | - |
| CS1-desk | 2.1 | 19 | 24 |
| CS2-glue | 3.8 | 16 | 14 |
| CS3-photo | 16 | 24 | 28 |
| BS1-hair | 14 | 13 | 31 |
| BS2-nail | 2.2 | 25 | 35 |
| BS3-sol | 12 | 26 | 31 |
| BS4-rec | 16 | 30 | 31 |
| BS5-bea | 29 | 30 | 31 |
| BS6-out | 21 | 11 | 23 |
| PH1-out | 11 | 6.0 | 35 |
| PH2-ware | 7.8 | 10 | 40 |
| PH3-store | 19 | 19 | 42 |
| PH4-dercon | 18 | 21 | 48 |
| PH5-phar | 23 | 22 | 44 |
| PH6-der | 12 | 11 | 47 |
| HL1-lab | 25 | 13 | 29 |
| HL2-tech | 3.4 | 9.7 | 5.3 |
| HL3-tech | 1.0 | 5.0 | 8.5 |
| HL4-sec | 4.2 | 16 | 22 |
| HL5-tech | 0.7 | 4.2 | 5.0 |
| HL6-out | 5.6 | 25 | - |
| HRL1-tech | 13 | 2.3 | - |
| HRL2-lab | 20 | 6.4 | - |
| HRL3-out | 18 | 30 | - |
| HRL4-bio | 7.1 | 18 | - |
| HRL5-lab | 7.1 | 1.6 | - |
| HpL1-out | 25 | 20 | - |
| HpL2-tech | 12 | 0.1 | 39 |
| HpL3-lab | 5.2 | 0.7 | 9.2 |
| HpL4-lab | 2.0 | 4.0 | - |
| HpL5-doc | 0.3 | 15 | - |
| HpL6-doc | 3.8 | 9.1 | - |
| CL1-lab | 1.2 | 0.1 | - |
| CL2-lab | 7.3 | 7.7 | - |
| CL3-lab | 0.2 | 3.1 | 49 |
| CL4-off | 8.1 | 3.7 | 50 |
| CL5-out | 12 | 6.3 | 47 |
| ParL1-lab | 26 | 0.4 | - |
| ParL2-lab | 6.1 | 0.3 | - |
| ParL3-corr | 7.3 | 15 | - |
| ParL4-lab | 8.3 | 3.2 | - |
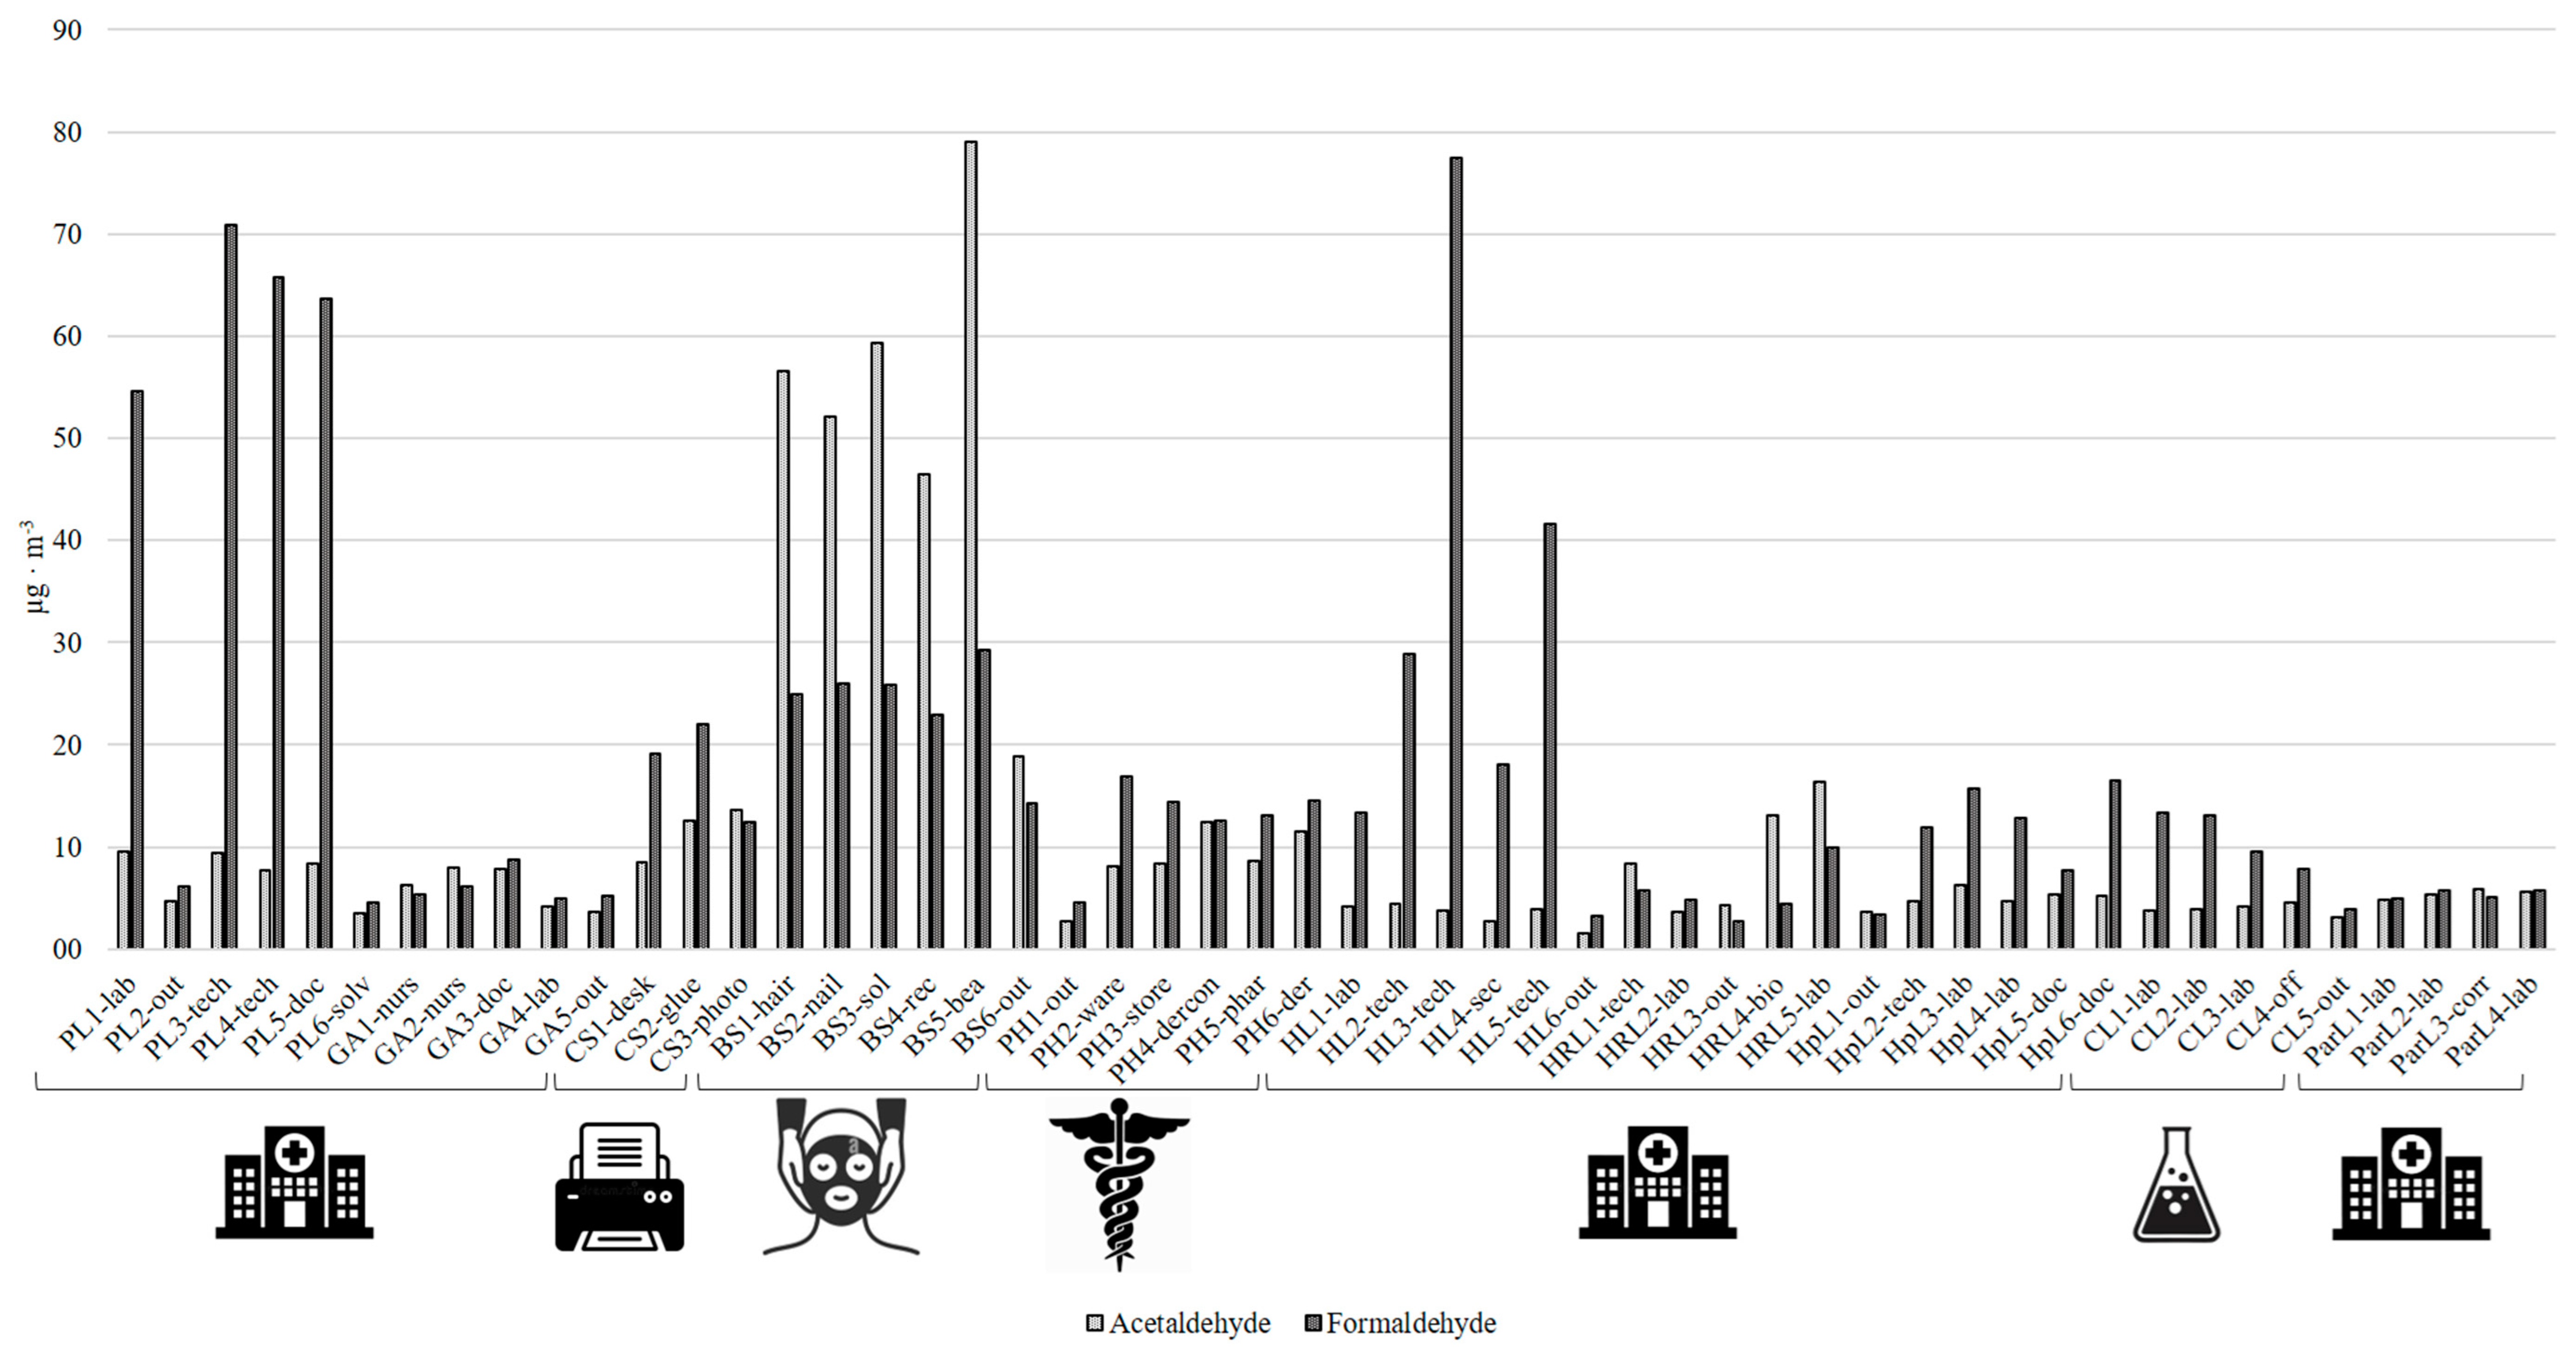
| Acetaldehyde | Butyraldehyde | Cyclohexanone | Crotonaldehyde | Decanal | Heptanal | Hexanal | Formaldehyde | Nonanal | Octanal | Propionaldehyde | Valeraldehyde | |
|---|---|---|---|---|---|---|---|---|---|---|---|---|
| PL1-lab | 9.5 | 0.46 | 0.01 | <LOQ | 0.08 | 0.03 | 0.19 | 55 | 0.49 | 0.08 | 0.67 | 0.17 |
| PL2-out | 4.7 | 0.57 | 0.08 | <LOQ | 0.12 | 0.06 | 0.06 | 6.1 | 0.73 | 0.15 | 0.95 | 0.23 |
| PL3-tech | 9.4 | 0.89 | 0.01 | <LOQ | 0.15 | 0.03 | 0.21 | 71 | 0.55 | 0.09 | 0.92 | 0.21 |
| PL4-tech | 7.7 | 1.4 | 0.11 | <LOQ | 0.11 | 0.06 | 0.19 | 66 | 0.62 | 0.12 | 0.99 | 0.71 |
| PL5-doc | 8.4 | 0.80 | 0.02 | <LOQ | 0.18 | 0.02 | 0.18 | 64 | 0.63 | 0.11 | 0.89 | 0.22 |
| PL6-solv | 3.5 | 0.76 | 0.05 | <LOQ | 0.17 | 0.06 | 0.08 | 4.5 | 0.82 | 0.14 | 0.87 | 0.29 |
| GA1-nurs | 6.2 | 0.81 | 0.11 | <LOQ | 0.19 | 0.04 | <LOQ | 5.3 | 0.81 | 0.13 | 0.74 | 0.25 |
| GA2-nurs | 7.9 | 0.61 | 0.12 | <LOQ | 0.14 | 0.00 | 0.02 | 6.1 | 0.63 | 0.09 | 0.84 | <LOQ |
| GA3-doc | 7.9 | 0.68 | 0.26 | 0.02 | 0.70 | 0.11 | 0.19 | 8.8 | 1.7 | 0.43 | 1.1 | 0.03 |
| GA4-lab | 4.2 | 0.41 | 0.13 | <LOQ | 0.25 | 0.01 | <LOQ | 5.0 | 0.68 | 0.08 | 0.63 | 0.04 |
| GA5-out | 3.7 | 0.38 | 0.16 | 0.03 | 0.46 | 0.14 | 0.14 | 5.2 | 1.9 | 0.23 | 0.72 | 0.04 |
| CS1-desk | 8.5 | 1.2 | 0.06 | 0.08 | 1.0 | 0.52 | 2.2 | 19 | 2.2 | 0.56 | 1.2 | 0.95 |
| CS2-glue | 13 | 0.82 | 0.15 | 0.06 | 1.1 | 0.50 | 2.2 | 22 | 2.2 | 0.57 | 1.2 | 0.71 |
| CS3-photo | 14 | 0.98 | 0.07 | 0.05 | 0.72 | 0.33 | 1.4 | 12 | 1.7 | 0.38 | 1.1 | 0.58 |
| BS1-hair | 57 | 1.9 | 0.11 | 0.01 | 1.0 | 0.51 | 6.5 | 25 | 2.4 | 0.01 | 4.0 | 0.64 |
| BS2-nail | 52 | 1.7 | 0.12 | 0.01 | 1.7 | 0.88 | 7.8 | 26 | 3.5 | 0.91 | 4.4 | 2.3 |
| BS3-sol | 59 | 1.8 | 0.14 | 0.01 | 1.1 | 0.75 | 8.5 | 26 | 3.2 | 0.58 | 4.3 | 2.4 |
| BS4-rec | 46 | 1.8 | 0.07 | 0.01 | 0.79 | 0.57 | 7.4 | 23 | 2.2 | 0.44 | 3.9 | 2.6 |
| BS5-bea | 79 | 2.4 | 0.07 | 0.03 | 1.6 | 1.1 | 13 | 29 | 4.5 | 1.0 | 4.7 | 2.9 |
| BS6-out | 19 | 1.7 | 0.05 | 0.01 | 0.62 | 0.67 | 2.8 | 14 | 2.5 | 0.58 | 1.7 | 1.5 |
| PH1-out | 2.7 | 0.44 | 0.12 | 0.02 | 0.39 | 0.12 | 0.32 | 4.5 | 1.1 | 0.20 | 1.8 | 0.19 |
| PH2-ware | 8.1 | 1.1 | 0.27 | 0.02 | 0.70 | 0.34 | 2.0 | 17 | 2.5 | 0.39 | 1.6 | 0.87 |
| PH3-store | 8.4 | 1.7 | 0.15 | 0.02 | 0.73 | 0.31 | 2.2 | 14 | 1.9 | 0.40 | 1.8 | 1.3 |
| PH4-dercon | 12 | 1.2 | 0.09 | 0.02 | 0.65 | 0.42 | 2.7 | 13 | 2.5 | 0.42 | 1.9 | 0.97 |
| PH5-phar | 8.7 | 1.6 | 0.18 | 0.02 | 0.93 | 0.33 | 2.2 | 13 | 2.0 | 0.45 | 1.6 | 1.5 |
| PH6-der | 11 | 1.4 | 0.10 | 0.02 | 0.49 | 0.24 | 1.8 | 15 | 1.5 | 0.29 | 1.8 | 0.96 |
| HL1-lab | 4.2 | 2.8 | 2.7 | 1.8 | 3.4 | 3.0 | 3.1 | 13 | 4.7 | 3.2 | 2.1 | 2.6 |
| HL2-tech | 4.4 | 0.76 | 0.18 | 0.01 | 1.1 | 0.42 | 0.80 | 29 | 2.4 | 2.2 | 0.60 | 0.37 |
| HL3-tech | 3.7 | 0.73 | 0.14 | 0.004 | 2.3 | 0.82 | 1.2 | 77 | 5.4 | 1.8 | 0.64 | 0.51 |
| HL4-sec | 2.7 | 0.93 | 0.14 | 0.004 | 1.3 | 0.36 | 0.98 | 18 | 2.5 | 0.74 | 0.61 | 0.53 |
| HL5-tech | 3.9 | 1.17 | 0.22 | 0.005 | 4.0 | 0.36 | 1.0 | 42 | 3.9 | 1.6 | 0.69 | 0.72 |
| HL6-out | 1.5 | 0.45 | 0.04 | 0.002 | 0.50 | 0.15 | 0.32 | 3.3 | 1.0 | 0.25 | 0.32 | 0.15 |
| HRL1-tech | 8.4 | 3.8 | 0.52 | 0.02 | 0.75 | 0.50 | 1.80 | 5.7 | 3.9 | 0.64 | 2.0 | 2.4 |
| HRL2-lab | 3.6 | 1.7 | 0.19 | 0.01 | 0.68 | 0.22 | 0.20 | 4.9 | 4.0 | 0.63 | 1.5 | 0.54 |
| HRL3-out | 4.3 | 2.5 | 0.55 | 0.02 | 0.60 | 0.63 | 2.5 | 2.7 | 3.3 | 0.63 | 1.8 | 2.9 |
| HRL4-bio | 13 | 8.1 | 1.3 | 0.02 | 1.4 | 1.2 | 4.2 | 4.4 | 6.5 | 1.1 | 3.1 | 7.0 |
| HRL5-lab | 16 | 13 | 1.30 | 0.04 | 1.6 | 1.2 | 4.6 | 10 | 9.9 | 1.6 | 5.0 | 8.0 |
| HpL1-out | 3.6 | 2.6 | 0.29 | 0.01 | 0.30 | 0.20 | 0.61 | 3.3 | 1.5 | 0.30 | 1.8 | 1.3 |
| HpL2-tech | 4.7 | 2.0 | 0.29 | 0.01 | 0.46 | 0.28 | 0.85 | 12 | 1.9 | 0.35 | 1.7 | 1.0 |
| HpL3-lab | 6.3 | 3.1 | 0.42 | 0.01 | 0.59 | 0.31 | 0.93 | 16 | 1.9 | 0.34 | 2.3 | 1.5 |
| HpL4-lab | 4.7 | 2.1 | 0.40 | 0.01 | 0.78 | 0.32 | 0.76 | 13 | 3.0 | 0.46 | 1.6 | 1.3 |
| HpL5-doc | 5.3 | 2.0 | 0.17 | 0.01 | 0.54 | 0.36 | 0.97 | 7.7 | 3.0 | 0.47 | 1.7 | 1.1 |
| HpL6-doc | 5.2 | 3.3 | 0.20 | 0.01 | 0.41 | 0.32 | 1.5 | 17 | 2.1 | 0.36 | 2.2 | 1.8 |
| CL1-lab | 3.8 | <LOQ | <LOQ | 0.45 | 0.07 | 1.2 | 0.18 | 13 | 2.1 | 0.35 | 1.7 | 1.6 |
| CL2-lab | 3.9 | 2.2 | 0.34 | 0.01 | 0.69 | 0.23 | 0.42 | 13 | 2.4 | 0.41 | 1.8 | 0.92 |
| CL3-lab | 4.2 | 2.5 | 0.43 | 0.02 | 0.75 | 0.26 | 0.56 | 9.6 | 2.4 | 0.38 | 1.9 | 1.2 |
| CL4-off | 4.6 | 3.1 | 0.33 | 0.01 | 0.39 | 0.22 | 0.51 | 7.9 | 2.2 | 0.38 | 2.0 | 1.5 |
| CL5-out | 3.2 | 3.1 | 0.44 | <LOQ | 0.47 | 0.20 | 0.54 | 4.0 | 2.0 | 0.27 | 1.9 | 1.7 |
| ParL1-lab | 4.9 | 2.3 | 0.25 | 0.01 | 0.33 | 0.19 | 0.59 | 5.0 | 1.9 | 0.30 | 1.9 | 1.1 |
| ParL2-lab | 5.4 | 2.5 | 0.26 | 0.01 | 0.30 | 0.19 | 0.50 | 5.8 | 1.7 | 0.28 | 2.0 | 1.2 |
| ParL3-corr | 5.9 | 1.5 | 0.16 | 0.01 | 0.29 | 0.15 | 0.37 | 5.2 | 1.9 | 0.31 | 1.7 | 0.61 |
| ParL4-lab | 5.7 | 2.6 | 0.27 | 0.01 | 0.32 | 0.18 | 0.46 | 5.7 | 1.8 | 0.29 | 2.0 | 1.2 |
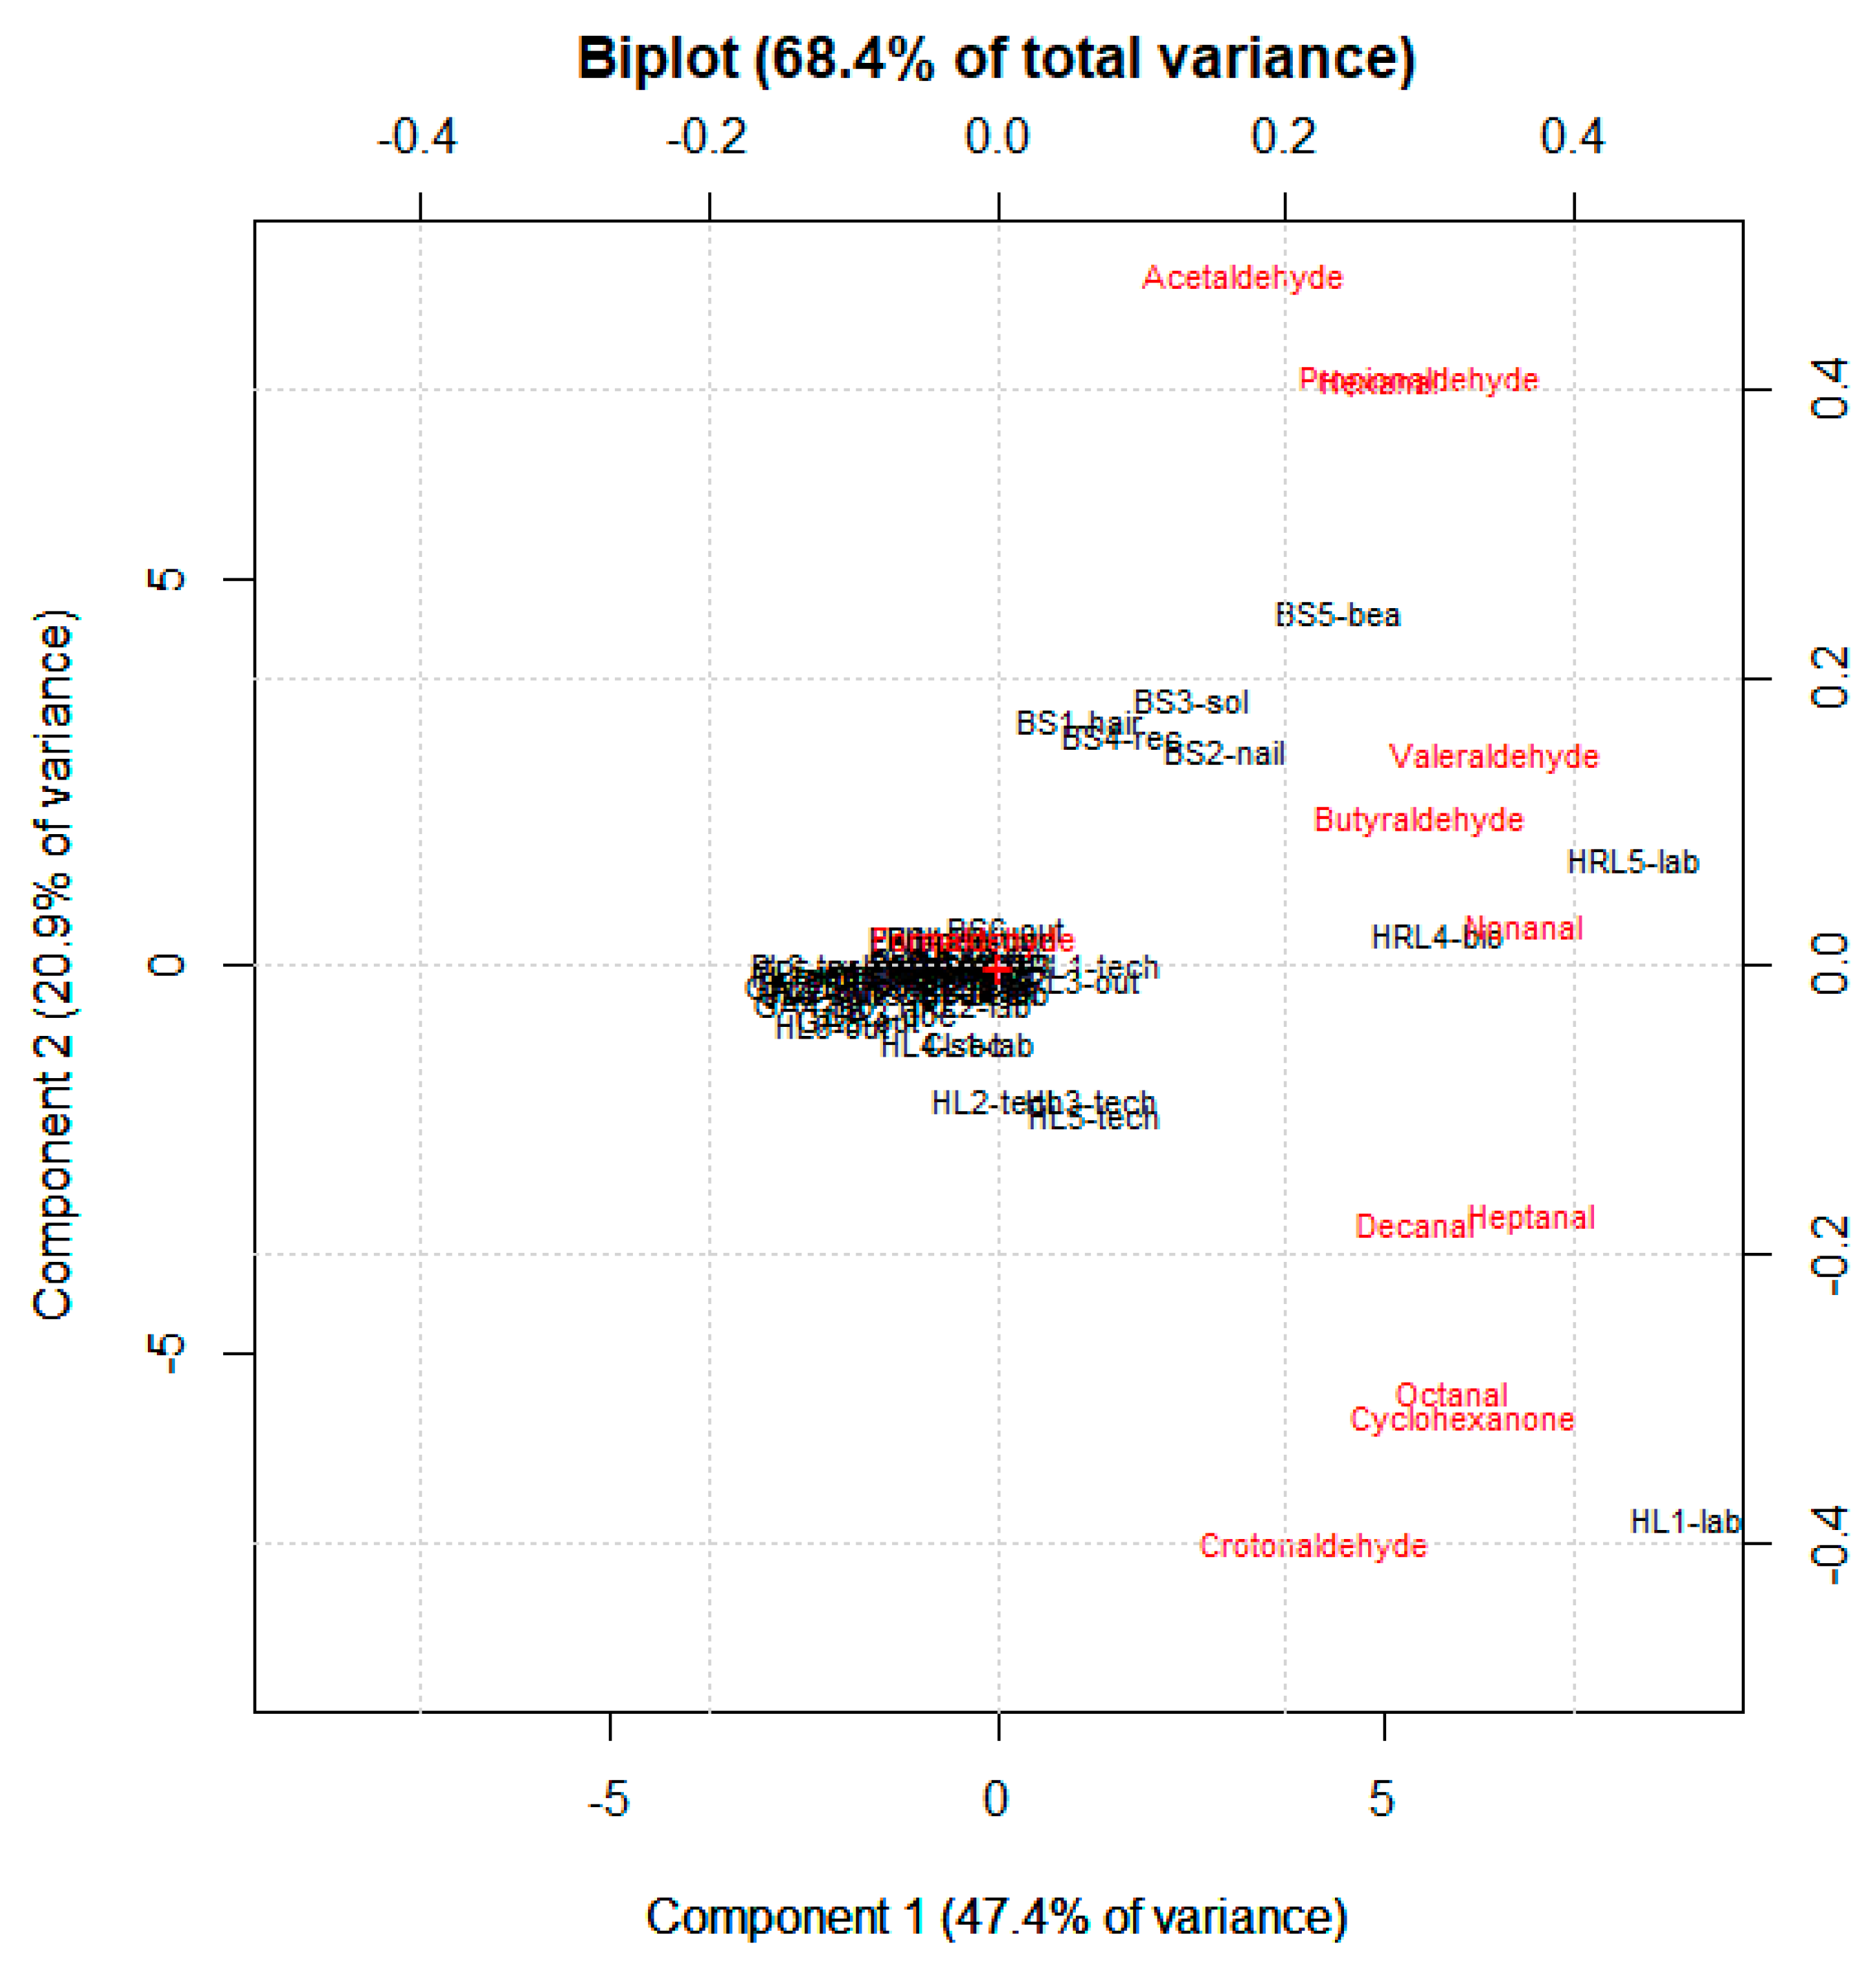
| PC1 | PC2 | PC3 | PC4 | PC5 | |
|---|---|---|---|---|---|
| Variance% | 47.4 | 20.9 | 14.5 | 8.5 | 4.5 |
| PL1−lab | −2.49 | −0.09 | 1.10 | −0.82 | −1.55 |
| PL2−out | −2.22 | −0.29 | −0.39 | 0.65 | 0.12 |
| PL3−tech | −2.32 | 0.02 | 1.45 | −1.40 | −2.13 |
| PL4−tech | −2.01 | −0.03 | 1.00 | −1.33 | −2.13 |
| PL5−doc | −2.31 | −0.04 | 1.25 | −1.22 | −1.83 |
| PL6−solv | −2.20 | −0.32 | −0.49 | 0.60 | 0.22 |
| GA1−nurs | −2.19 | −0.33 | −0.44 | 0.59 | 0.18 |
| GA2−nurs | −2.33 | −0.24 | −0.32 | 0.70 | 0.13 |
| GA3−doc | −1.39 | −0.59 | −0.01 | 0.28 | 0.54 |
| GA4−lab | −2.37 | −0.48 | −0.34 | 0.64 | 0.27 |
| GA5−out | −1.77 | −0.66 | −0.24 | 0.42 | 0.53 |
| CS1−desk | −0.37 | −0.32 | 0.56 | −0.07 | 0.34 |
| CS2−glue | −0.34 | −0.26 | 0.82 | −0.05 | 0.30 |
| CS3−photo | −1.00 | −0.11 | 0.29 | 0.34 | 0.34 |
| BS1−hair | 1.08 | 3.20 | 1.62 | 1.04 | −0.19 |
| BS2−nail | 2.92 | 2.81 | 1.99 | 0.43 | 0.49 |
| BS3−sol | 2.49 | 3.45 | 1.75 | 0.85 | −0.09 |
| BS4−rec | 1.60 | 3.00 | 1.16 | 0.84 | −0.28 |
| BS5−bea | 4.42 | 4.60 | 2.88 | 0.80 | 0.46 |
| BS6−out | 0.13 | 0.50 | 0.24 | 0.25 | 0.18 |
| PH1−out | −1.74 | −0.19 | −0.33 | 0.74 | 0.31 |
| PH2−ware | −0.48 | −0.05 | 0.08 | 0.06 | 0.13 |
| PH3−store | −0.46 | 0.19 | −0.08 | 0.12 | 0.14 |
| PH4−dercon | −0.31 | 0.40 | 0.14 | 0.30 | 0.32 |
| PH5−phar | −0.29 | 0.07 | −0.05 | 0.05 | 0.32 |
| PH6−der | −0.89 | 0.38 | −0.04 | 0.33 | −0.03 |
| HL1−lab | 8.91 | −7.13 | 2.20 | 2.94 | −1.04 |
| HL2−tech | 0.03 | −1.74 | 1.32 | −1.17 | 0.93 |
| HL3−tech | 1.21 | −1.73 | 2.88 | −3.43 | 0.18 |
| HL4−sec | −0.68 | −0.96 | 0.47 | −0.58 | 0.83 |
| HL5−tech | 1.26 | −1.92 | 2.33 | −2.71 | 2.24 |
| HL6−out | −2.12 | −0.73 | −0.22 | 0.46 | 0.64 |
| HRL1−tech | 1.15 | 0.02 | −1.32 | −0.27 | 0.20 |
| HRL2−lab | −0.41 | −0.47 | −0.67 | −0.29 | 0.89 |
| HRL3−out | 0.98 | −0.15 | −1.17 | 0.19 | 0.16 |
| HRL4−bio | 5.69 | 0.41 | −2.97 | −1.04 | −0.43 |
| HRL5−lab | 8.23 | 1.38 | −4.08 | −2.41 | −0.52 |
| HpL1−out | −0.83 | −0.07 | −1.13 | 0.44 | −0.04 |
| HpL2−tech | −0.72 | −0.16 | −0.59 | 0.14 | −0.06 |
| HpL3−lab | −0.10 | 0.09 | −0.81 | −0.03 | −0.40 |
| HpL4−lab | −0.14 | −0.34 | −0.60 | −0.23 | 0.20 |
| HpL5−doc | −0.33 | −0.08 | −0.67 | 0.01 | 0.35 |
| HpL6−doc | −0.15 | 0.36 | −0.88 | −0.16 | −0.44 |
| CL1−lab | −0.22 | −0.98 | 0.18 | 1.41 | −0.87 |
| CL2−lab | −0.50 | −0.29 | −0.62 | −0.12 | 0.08 |
| CL3−lab | −0.25 | −0.26 | −0.83 | 0.00 | 0.11 |
| CL4−off | −0.34 | 0.02 | −1.19 | 0.06 | −0.13 |
| CL5−out | −0.36 | −0.08 | −1.42 | 0.17 | −0.06 |
| ParL1−lab | −0.78 | 0.05 | −0.99 | 0.36 | 0.03 |
| ParL2−lab | −0.78 | 0.08 | −1.05 | 0.35 | −0.09 |
| ParL3−corr | −1.20 | −0.05 | −0.67 | 0.41 | 0.23 |
| ParL4−lab | −0.72 | 0.10 | −1.08 | 0.33 | −0.08 |
| PC1 | PC2 | PC3 | PC4 | PC5 | |
|---|---|---|---|---|---|
| Acetaldehyde | 0.17 | 0.48 | 0.34 | 0.21 | 0.00 |
| Butyraldehyde | 0.29 | 0.10 | −0.46 | −0.26 | −0.18 |
| Cyclohexanone | 0.32 | −0.31 | −0.17 | 0.15 | −0.23 |
| Crotonaldehyde | 0.22 | −0.40 | 0.17 | 0.45 | −0.30 |
| Decanal | 0.29 | −0.18 | 0.32 | −0.24 | 0.50 |
| Heptanal | 0.37 | −0.17 | 0.14 | 0.22 | −0.14 |
| Hexanal | 0.27 | 0.41 | 0.27 | 0.17 | 0.08 |
| Formaldehyde | −0.02 | 0.02 | 0.50 | −0.58 | −0.63 |
| Nonanal | 0.37 | 0.03 | −0.14 | −0.34 | 0.23 |
| Octanal | 0.32 | −0.29 | 0.21 | −0.17 | 0.24 |
| Propionaldehyde | 0.29 | 0.41 | −0.05 | 0.17 | −0.11 |
| Valeraldehyde | 0.35 | 0.15 | −0.32 | −0.14 | −0.18 |
Publisher’s Note: MDPI stays neutral with regard to jurisdictional claims in published maps and institutional affiliations. |
© 2022 by the authors. Licensee MDPI, Basel, Switzerland. This article is an open access article distributed under the terms and conditions of the Creative Commons Attribution (CC BY) license (https://creativecommons.org/licenses/by/4.0/).
Share and Cite
Castellani, F.; Antonucci, A.; Pindinello, I.; Protano, C.; Vitali, M. Determination of Carbonyl Compounds in Different Work Environments: Comparison between LC-UV/DAD and LC–MS/MS Detection Methods. Int. J. Environ. Res. Public Health 2022, 19, 12052. https://doi.org/10.3390/ijerph191912052
Castellani F, Antonucci A, Pindinello I, Protano C, Vitali M. Determination of Carbonyl Compounds in Different Work Environments: Comparison between LC-UV/DAD and LC–MS/MS Detection Methods. International Journal of Environmental Research and Public Health. 2022; 19(19):12052. https://doi.org/10.3390/ijerph191912052
Chicago/Turabian StyleCastellani, Federica, Arianna Antonucci, Ivano Pindinello, Carmela Protano, and Matteo Vitali. 2022. "Determination of Carbonyl Compounds in Different Work Environments: Comparison between LC-UV/DAD and LC–MS/MS Detection Methods" International Journal of Environmental Research and Public Health 19, no. 19: 12052. https://doi.org/10.3390/ijerph191912052