


GO-TiO2 as a Highly Performant Photocatalyst Maximized by Proper Parameters Selection


Abstract
:
1. Introduction
2. Materials and Methods
2.1. Reagents
2.2. Catalyst Synthesis
2.3. Catalyst Characterization
2.4. Reactor Set-Up
2.5. Process Efficiency Analysis
3. Results
3.1. Preliminary Tests
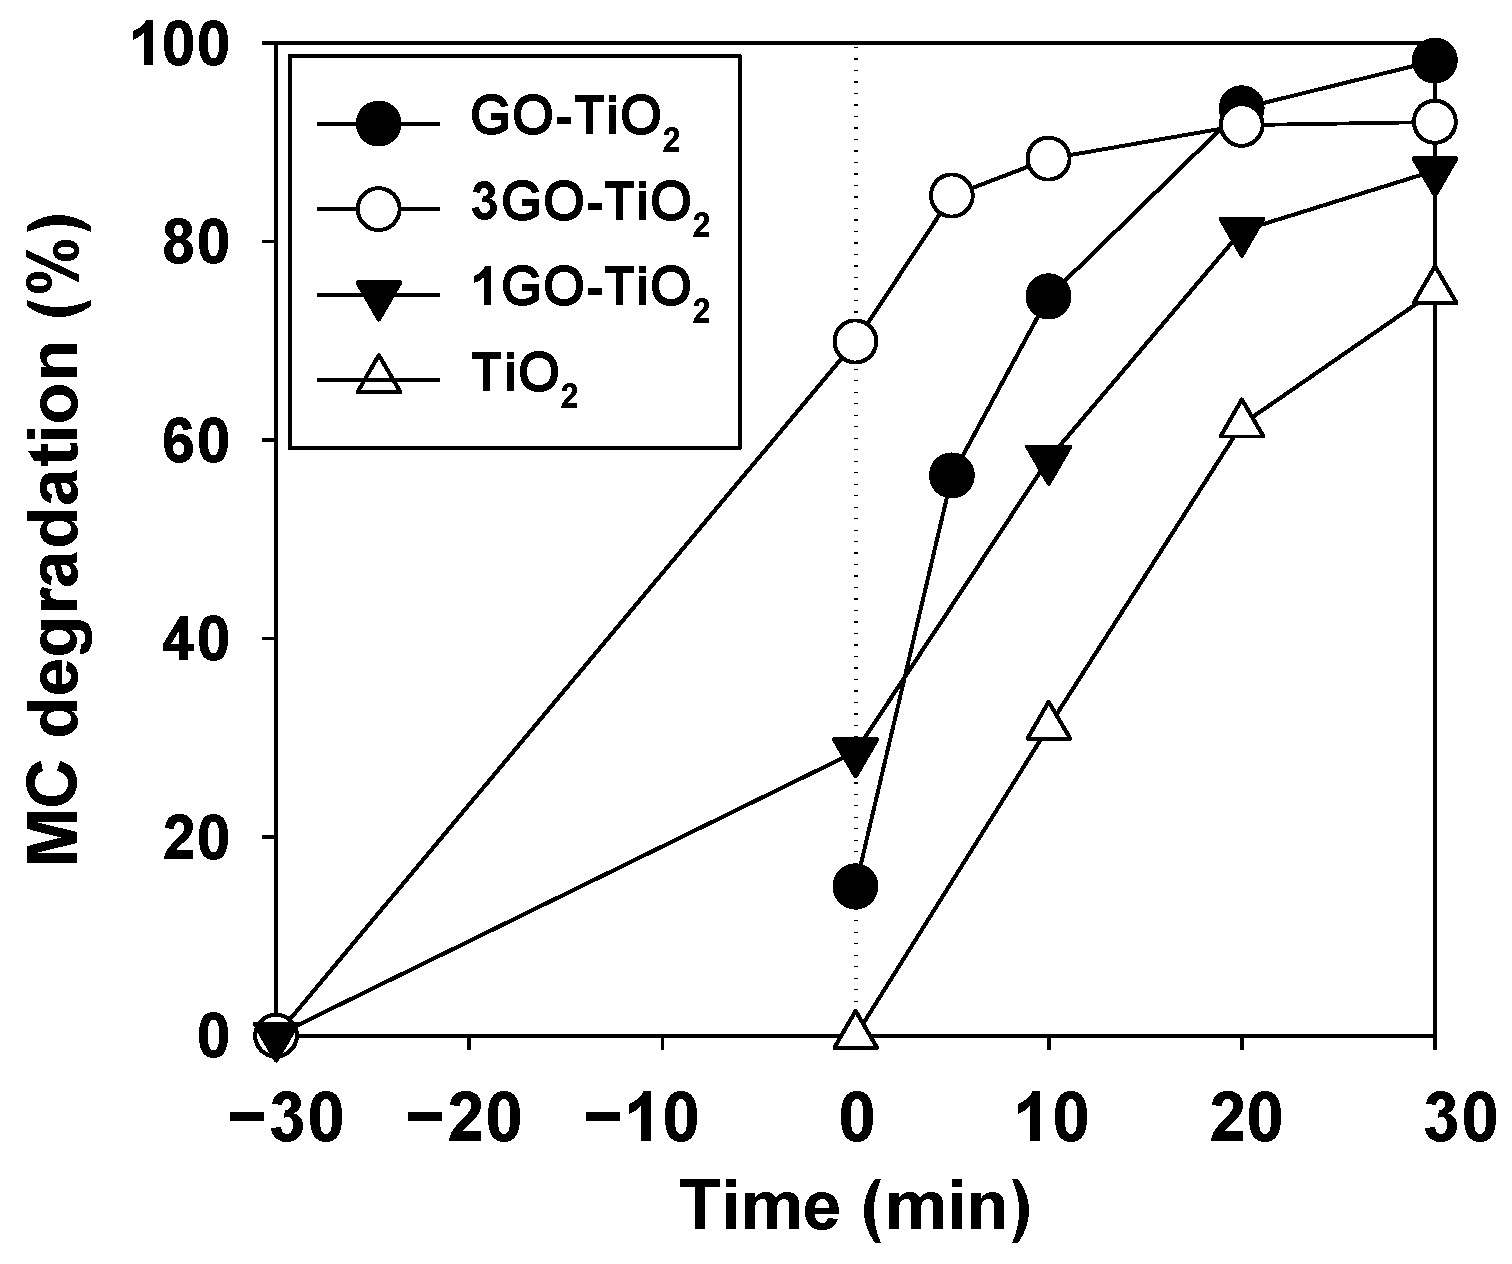
3.1.1. GO Dosage
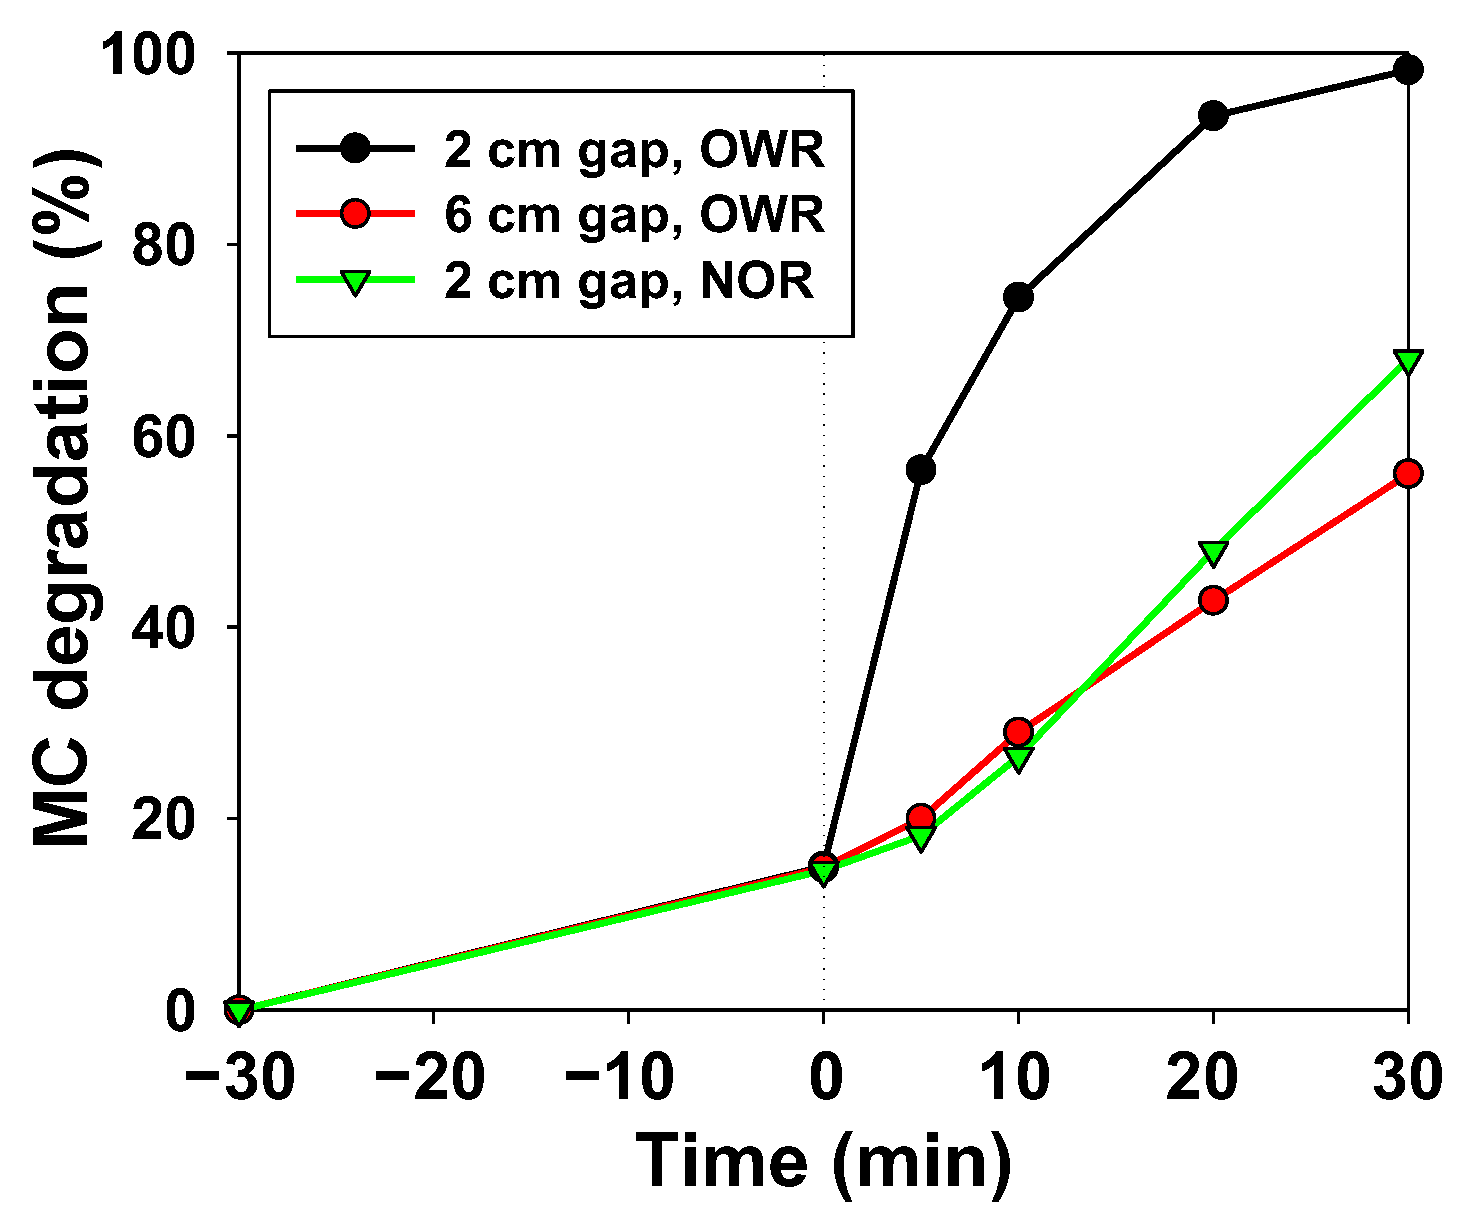
3.1.2. Reactor Set-Up
3.2. Catalyst Characterization
3.2.1. XRD
3.2.2. FTIR
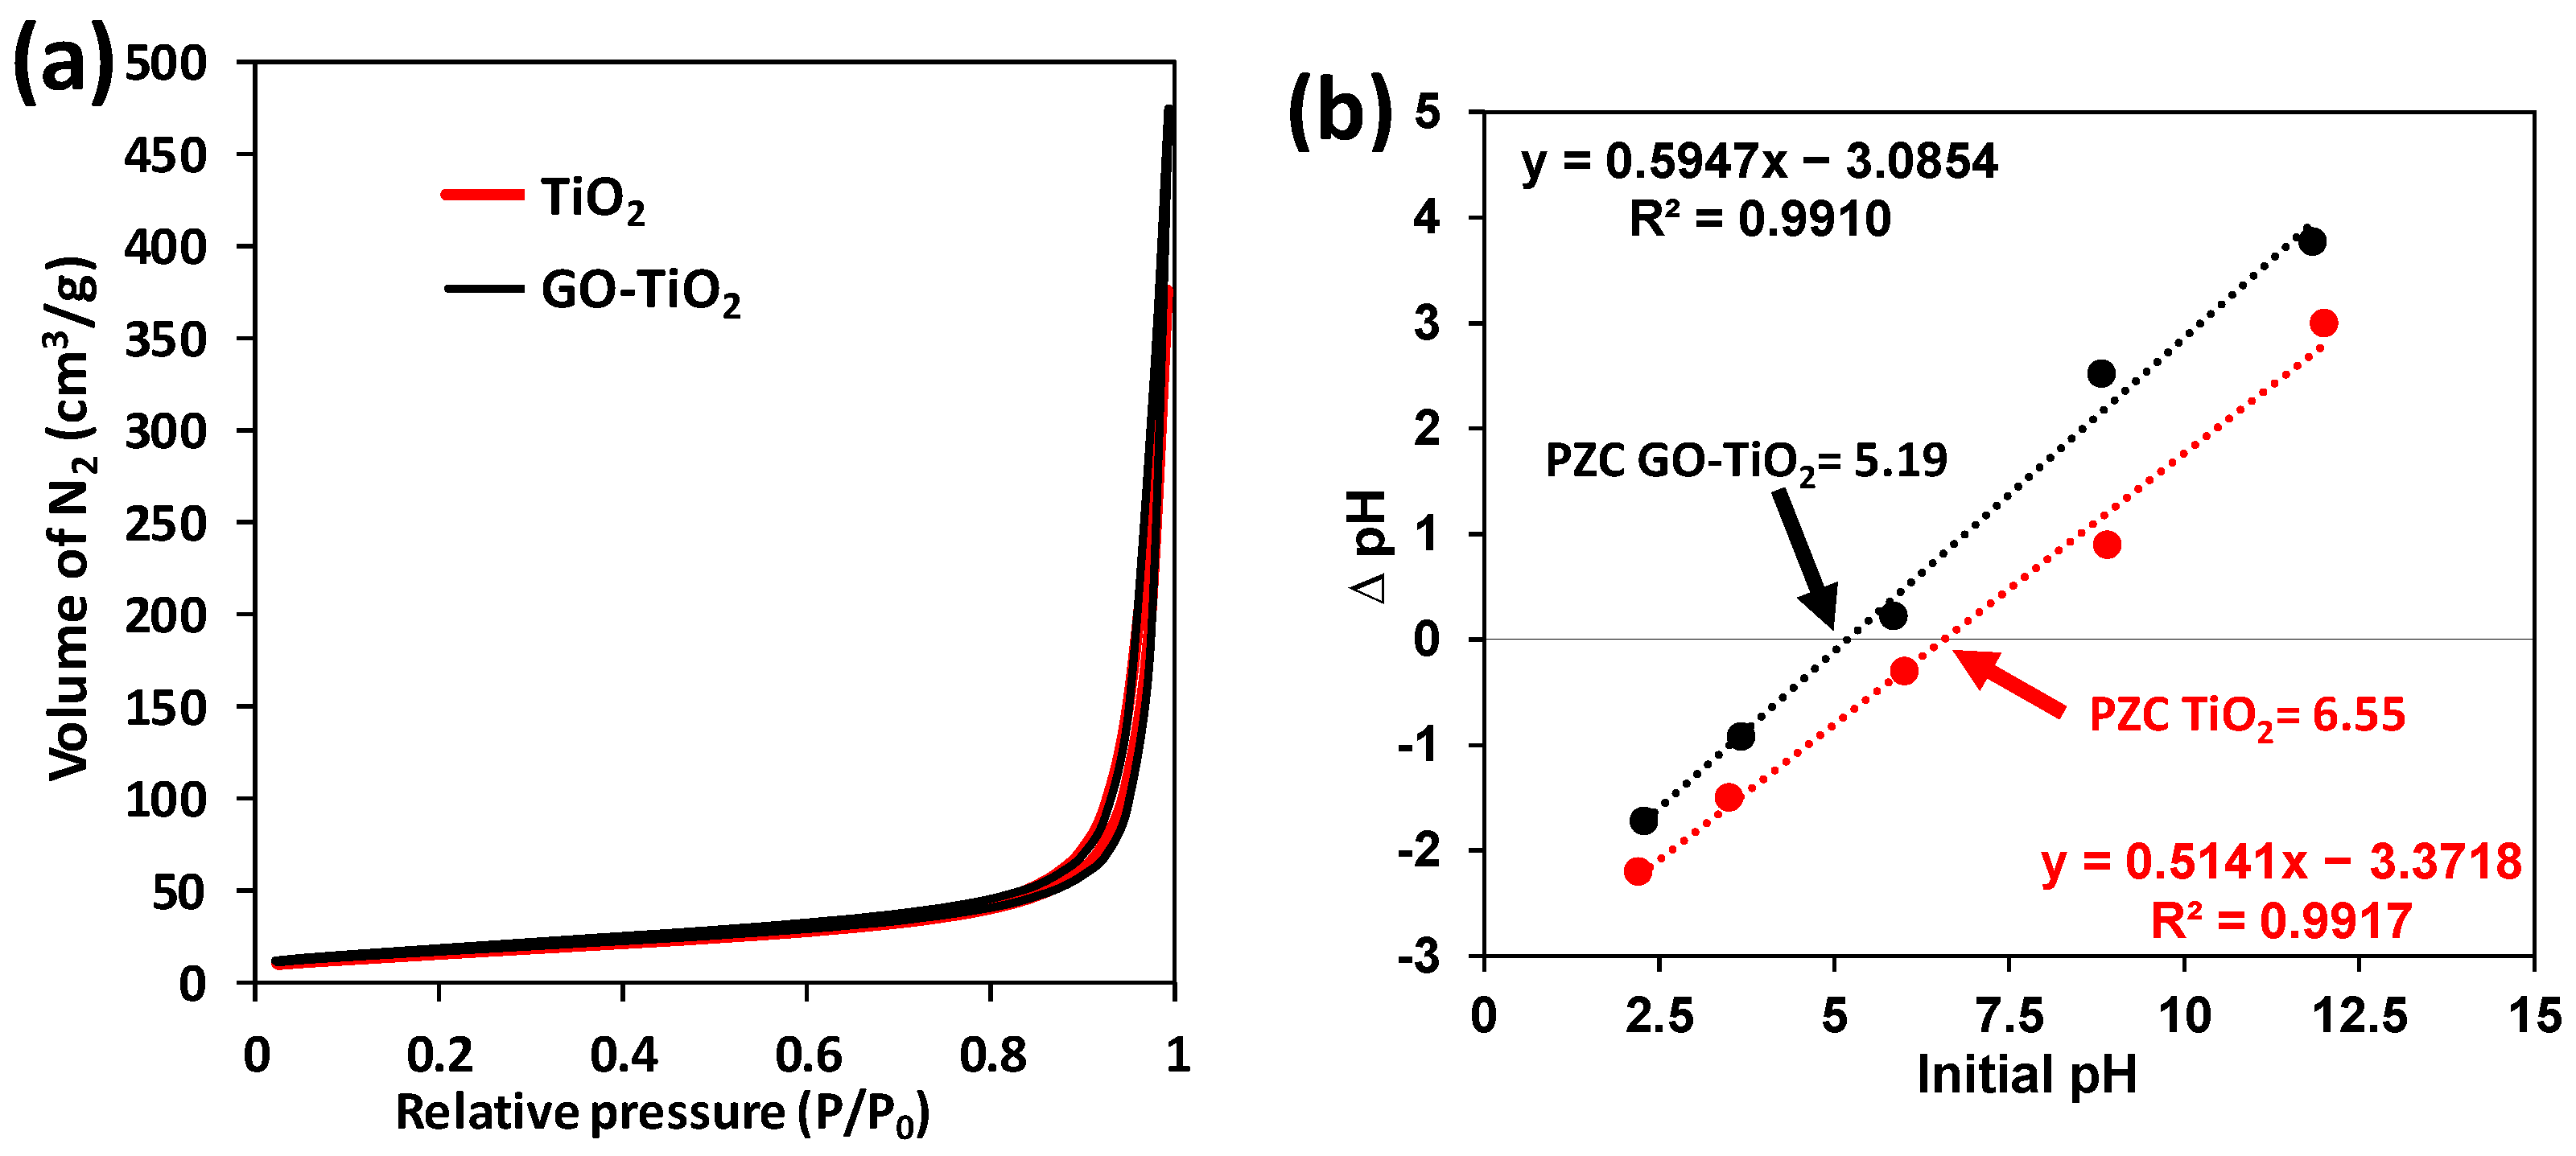
3.2.3. N2 Isotherms
3.2.4. PZC
3.2.5. UV Spectra
3.2.6. Electrochemical Measurements
3.3. MC Degradation
3.3.1. Duality UVA–Vis
3.3.2. Catalyst Reuse
3.3.3. Matrix Effect
4. Discussion
4.1. Preliminary Tests
4.1.1. GO Dosage
4.1.2. Reactor Set-Up
4.2. Characterization
4.2.1. XRD
4.2.2. FTIR
4.2.3. N2 Isotherms
4.2.4. PZC
4.2.5. UV Spectra
4.2.6. Electrochemical Measurements
4.3. MC Degradation
4.3.1. Duality UVA–Vis
4.3.2. Catalyst Reuse
4.3.3. Matrix Effect
4.3.4. Comparison with Previous Research
5. Conclusions
Supplementary Materials
Author Contributions
Funding
Institutional Review Board Statement
Informed Consent Statement
Conflicts of Interest
References
- Mahanta, U.; Khandelwal, M.; Deshpande, A.S. TiO2@SiO2 nanoparticles for methylene blue removal and photocatalytic degradation under natural sunlight and low-power UV light. Appl. Surf. Sci. 2022, 576, 151745. [Google Scholar] [CrossRef]
- Niu, L.; Zhao, X.; Tang, Z.; Lv, H.; Wu, F.; Wang, X.; Zhao, T.; Wang, J.; Wu, A.; Giesy, J. Difference in performance and mechanism for methylene blue when TiO2 nanoparticles are converted to nanotubes. J. Clean. Prod. 2021, 297, 126498. [Google Scholar] [CrossRef]
- Chakinala, N.; Gogate, R.R.; Chakinala, G. Highly efficient bi-metallic bismuth-silver doped TiO2 photocatalyst for dye degradation. Korean J. Chem. Eng. 2021, 38, 2468–2478. [Google Scholar] [CrossRef]
- Kurniawan, T.A.; Mengting, Z.; Fu, D.; Yeap, S.K.; Othman, M.H.D.; Avtar, R.; Ouyang, T. Functionalizing TiO2 with graphene oxide for enhancing photocatalytic degradation of methylene blue (MB) in contaminated wastewater. J. Environ. Manag. 2020, 270, 110871. [Google Scholar] [CrossRef] [PubMed]
- Wafi, M.A.E.; Ahmed, M.A.; Abdel-Samad, H.S.; Medien, H.A.A. Exceptional removal of methylene blue and p-aminophenol dye over novel TiO2/RGO nanocomposites by tandem adsorption-photocatalytic processes. Mater. Sci. Energy Technol. 2022, 5, 217–231. [Google Scholar] [CrossRef]
- Zhang, X.; Chen, W.; Bahmanrokh, G.; Kumar, V.; Ho, N.; Koshy, P.; Sorrell, C.C. Synthesis of V- and Mo-doped/codoped TiO2 powders for photocatalytic degradation of methylene blue. Nano-Struct. Nano-Objects 2020, 24, 100557. [Google Scholar] [CrossRef]
- Ojha, A.; Thareja, P. Graphene-based nanostructures for enhanced photocatalytic degradation of industrial dyes. Emerg. Mater. 2020, 3, 169–180. [Google Scholar] [CrossRef]
- Coleman, N.; Lovander, M.D.; Leddy, J.; Gillan, E.G. Phosphorus-Rich Metal Phosphides: Direct and Tin Flux-Assisted Synthesis and Evaluation as Hydrogen Evolution Electrocatalysts. Inorg. Chem. 2019, 58, 5013–5024. [Google Scholar] [CrossRef]
- Abd Elkodous, M.S.; El-Sayyad, G.; Abdel Maksoud, M.I.A.; Kumar, R.; Maegawa, K.; Kawamura, G.; Tan, W.K.; Matsuda, A. Nanocomposite matrix conjugated with carbon nanomaterials for photocatalytic wastewater treatment. J. Hazard. Mater. 2021, 410, 124657. [Google Scholar] [CrossRef] [PubMed]
- Anku, W.; Oppong, S.O.; Shukla, S.K.; Govender, P.P. Comparative photocatalytic degradation of monoazo and diazo dyes under simulated visible light using Fe3 /C/S doped-TiO2 nanoparticles. Acta Chim. Slov. 2016, 63, 380–391. [Google Scholar] [CrossRef]
- Zheng, H.; Meng, X.; Chen, J.; Que, M.; Wang, W.; Liu, X.; Yang, L.; Zhao, Y. In situ phase evolution of TiO2/Ti3C2Tx heterojunction for enhancing adsorption and photocatalytic degradation. Appl. Surf. Sci. 2021, 545, 149031. [Google Scholar] [CrossRef]
- Pang, X.; Xue, S.; Zhou, T.; Xu, Q.; Lei, W. 2D/2D nanohybrid of Ti3C2 MXene/WO3 photocatalytic membranes for efficient water purification. Ceram. Int. 2022, 48, 3659–3668. [Google Scholar] [CrossRef]
- Chinh, P.D.; Duyen, C.T.M.; Cuong, N.M.; Dong, N.T.; Hoang, N.V.; Hoi, B.V.; Nguyen, T.T.T. Integrating photocatalysis and microfiltration for methylene blue degradation: Kinetic and cost estimation. Chem. Eng. Technol. 2022, 45, 1748–1758. [Google Scholar] [CrossRef]
- Kocijan, M.; Ćurković, L.; Radošević, T.; Podlogar, M. Enhanced Photocatalytic Activity of Hybrid rGO@ TiO2/CN Nanocomposite for Organic Pollutant Degradation under Solar Light Irradiation. Catalysts 2021, 11, 1023. [Google Scholar] [CrossRef]
- Castanheira, B.; Otubo, L.; Oliveira, C.L.P.; Montes, R.; Quintana, J.B.; Rodil, R.; Brochsztain, S.; Vilar, V.J.; Teixeira, A.C.S. Functionalized mesoporous silicas SBA-15 for heterogeneous photocatalysis towards CECs removal from secondary urban wastewater. Chemosphere 2022, 287, 132023. [Google Scholar] [CrossRef] [PubMed]
- Casado, C.; Timmers, R.; Sergejevs, A.; Clarke, C.T.; Allsopp, D.W.E.; Bowen, C.R.; van Grieken, R.; Marugán, J. Design and validation of a LED-based high intensity photocatalytic reactor for quantifying activity measurements. Chem. Eng. J. 2017, 327, 1043–1055. [Google Scholar] [CrossRef]
- Diamantopoulou, A.; Sakellis, E.; Romanos, G.E.; Gardelis, S.; Ioannidis, N.; Boukos, N.; Falaras, P.; Likodimos, V. Titania photonic crystal photocatalysts functionalized by graphene oxide nanocolloids. Appl. Catal. B Environ. 2019, 240, 277–290. [Google Scholar] [CrossRef]
- Alosaimi, E.H.; Alsohaimi, I.H.; Dahan, T.E.; Chen, Q.; Younes, A.A.; El-Gammal, B.; Melhi, S. Photocatalytic Degradation of Methylene Blue and Antibacterial Activity of Mesoporous TiO2-SBA-15 Nanocomposite Based on Rice Husk. Adsorpt. Sci. Technol. 2021, 2021, 9290644. [Google Scholar] [CrossRef]
- Danyliuk, N.; Tatarchuk, T.; Kannan, K.; Shyichuk, A. Optimization of TiO2-P25 photocatalyst dose and H2O2 concentration for advanced photo-oxidation using smartphone-based colorimetry. Water Sci. Technol. 2021, 84, 469–483. [Google Scholar] [CrossRef]
- Náfrádi, M.; Hernadi, K.; Kónya, Z.; Alapi, T. Investigation of the efficiency of BiOI/BiOCl composite photocatalysts using UV, cool and warm white LED light sources—Photon efficiency, toxicity, reusability, matrix effect, and energy consumption. Chemosphere 2021, 280, 130636. [Google Scholar] [CrossRef]
- Badvi, K.; Javanbakht, V. Enhanced photocatalytic degradation of dye contaminants with TiO2 immobilized on ZSM-5 zeolite modified with nickel nanoparticles. J. Clean. Prod. 2021, 280, 124518. [Google Scholar] [CrossRef]
- Sun, X.; Xu, K.; Chatzitakis, A.; Norby, T. Photocatalytic generation of gas phase reactive oxygen species from adsorbed water: Remote action and electrochemical detection. J. Environ. Chem. Eng. 2021, 9, 104809. [Google Scholar] [CrossRef]
- Acosta-Esparza, M.A.; Rivera, L.P.; Pérez-Centeno, A.; Zamudio-Ojeda, A.; González, D.R.; Chávez-Chávez, A.; Santana-Aranda, M.A.; Santos-Cruz, J.; Quiñones-Galván, J. UV and Visible light photodegradation of methylene blue with graphene decorated titanium dioxide. Mater. Res. Express 2020, 7, 035504. [Google Scholar] [CrossRef]
- Constantino, D.S.M.; Dias, M.M.; Silva, A.M.T.; Faria, J.L.; Silva, C.G. Intensification strategies for improving the performance of photocatalytic processes: A review. J. Clean. Prod. 2022, 340, 130800. [Google Scholar] [CrossRef]


| MC (mg/L) | Catalyst (mg/L) | Lamp (nm, w) | Time (min) | Degradation (%) | EC (W·h/mg) | Reference |
|---|---|---|---|---|---|---|
| 20 | GO-TiO2 (800) | 360–365 nm, 4.8 W | 30 | 100 | 0.12 | This study |
| 10 | TiO2-SiO2 (1000) | 8 W | 30 | 85 | 0.47 | [1] |
| 10 | TiO2 nanoparticles (60) | UV, 300 W, >420 nm | 24 | 99 | 12.12 | [2] |
| 10 | Bi-Ag-TiO2 (15) | Vis, 250 W | 120 | 90 | 111.1 | [3] |
| 5 | GO-TiO2 (200) | 500 W | 60 | 92 | 108.70 | [4] |
| 6.4 | Reduced GO-TiO2 (1000) | 6 W, 365 nm | 60 | 86 | 1.09 | [5] |
| 3.2 | V/Mo-TiO2 (1000) | 365 nm, 8 W | 60 | 86.7 | 2.88 | [6] |
| 10 | Zeolite/TiO2 (50) | UV, 16 W | 120 | 100 | 3.20 | [21] |
| 73.57 | Graphene-TiO2 (50) | 360 nm, 17 W | 480 | 87 | 2.12 | [23] |
Publisher’s Note: MDPI stays neutral with regard to jurisdictional claims in published maps and institutional affiliations. |
© 2022 by the authors. Licensee MDPI, Basel, Switzerland. This article is an open access article distributed under the terms and conditions of the Creative Commons Attribution (CC BY) license (https://creativecommons.org/licenses/by/4.0/).
Share and Cite
Díez, A.M.; Pazos, M.; Sanromán, M.Á.; Kolen’ko, Y.V. GO-TiO2 as a Highly Performant Photocatalyst Maximized by Proper Parameters Selection. Int. J. Environ. Res. Public Health 2022, 19, 11874. https://doi.org/10.3390/ijerph191911874
Díez AM, Pazos M, Sanromán MÁ, Kolen’ko YV. GO-TiO2 as a Highly Performant Photocatalyst Maximized by Proper Parameters Selection. International Journal of Environmental Research and Public Health. 2022; 19(19):11874. https://doi.org/10.3390/ijerph191911874
Chicago/Turabian StyleDíez, Aida M., Marta Pazos, M. Ángeles Sanromán, and Yury V. Kolen’ko. 2022. "GO-TiO2 as a Highly Performant Photocatalyst Maximized by Proper Parameters Selection" International Journal of Environmental Research and Public Health 19, no. 19: 11874. https://doi.org/10.3390/ijerph191911874