

Reservoir Regulation for Ecological Protection and Remediation: A Case Study of the Irtysh River Basin, China

Abstract
:1. Introduction
2. Materials and Methods
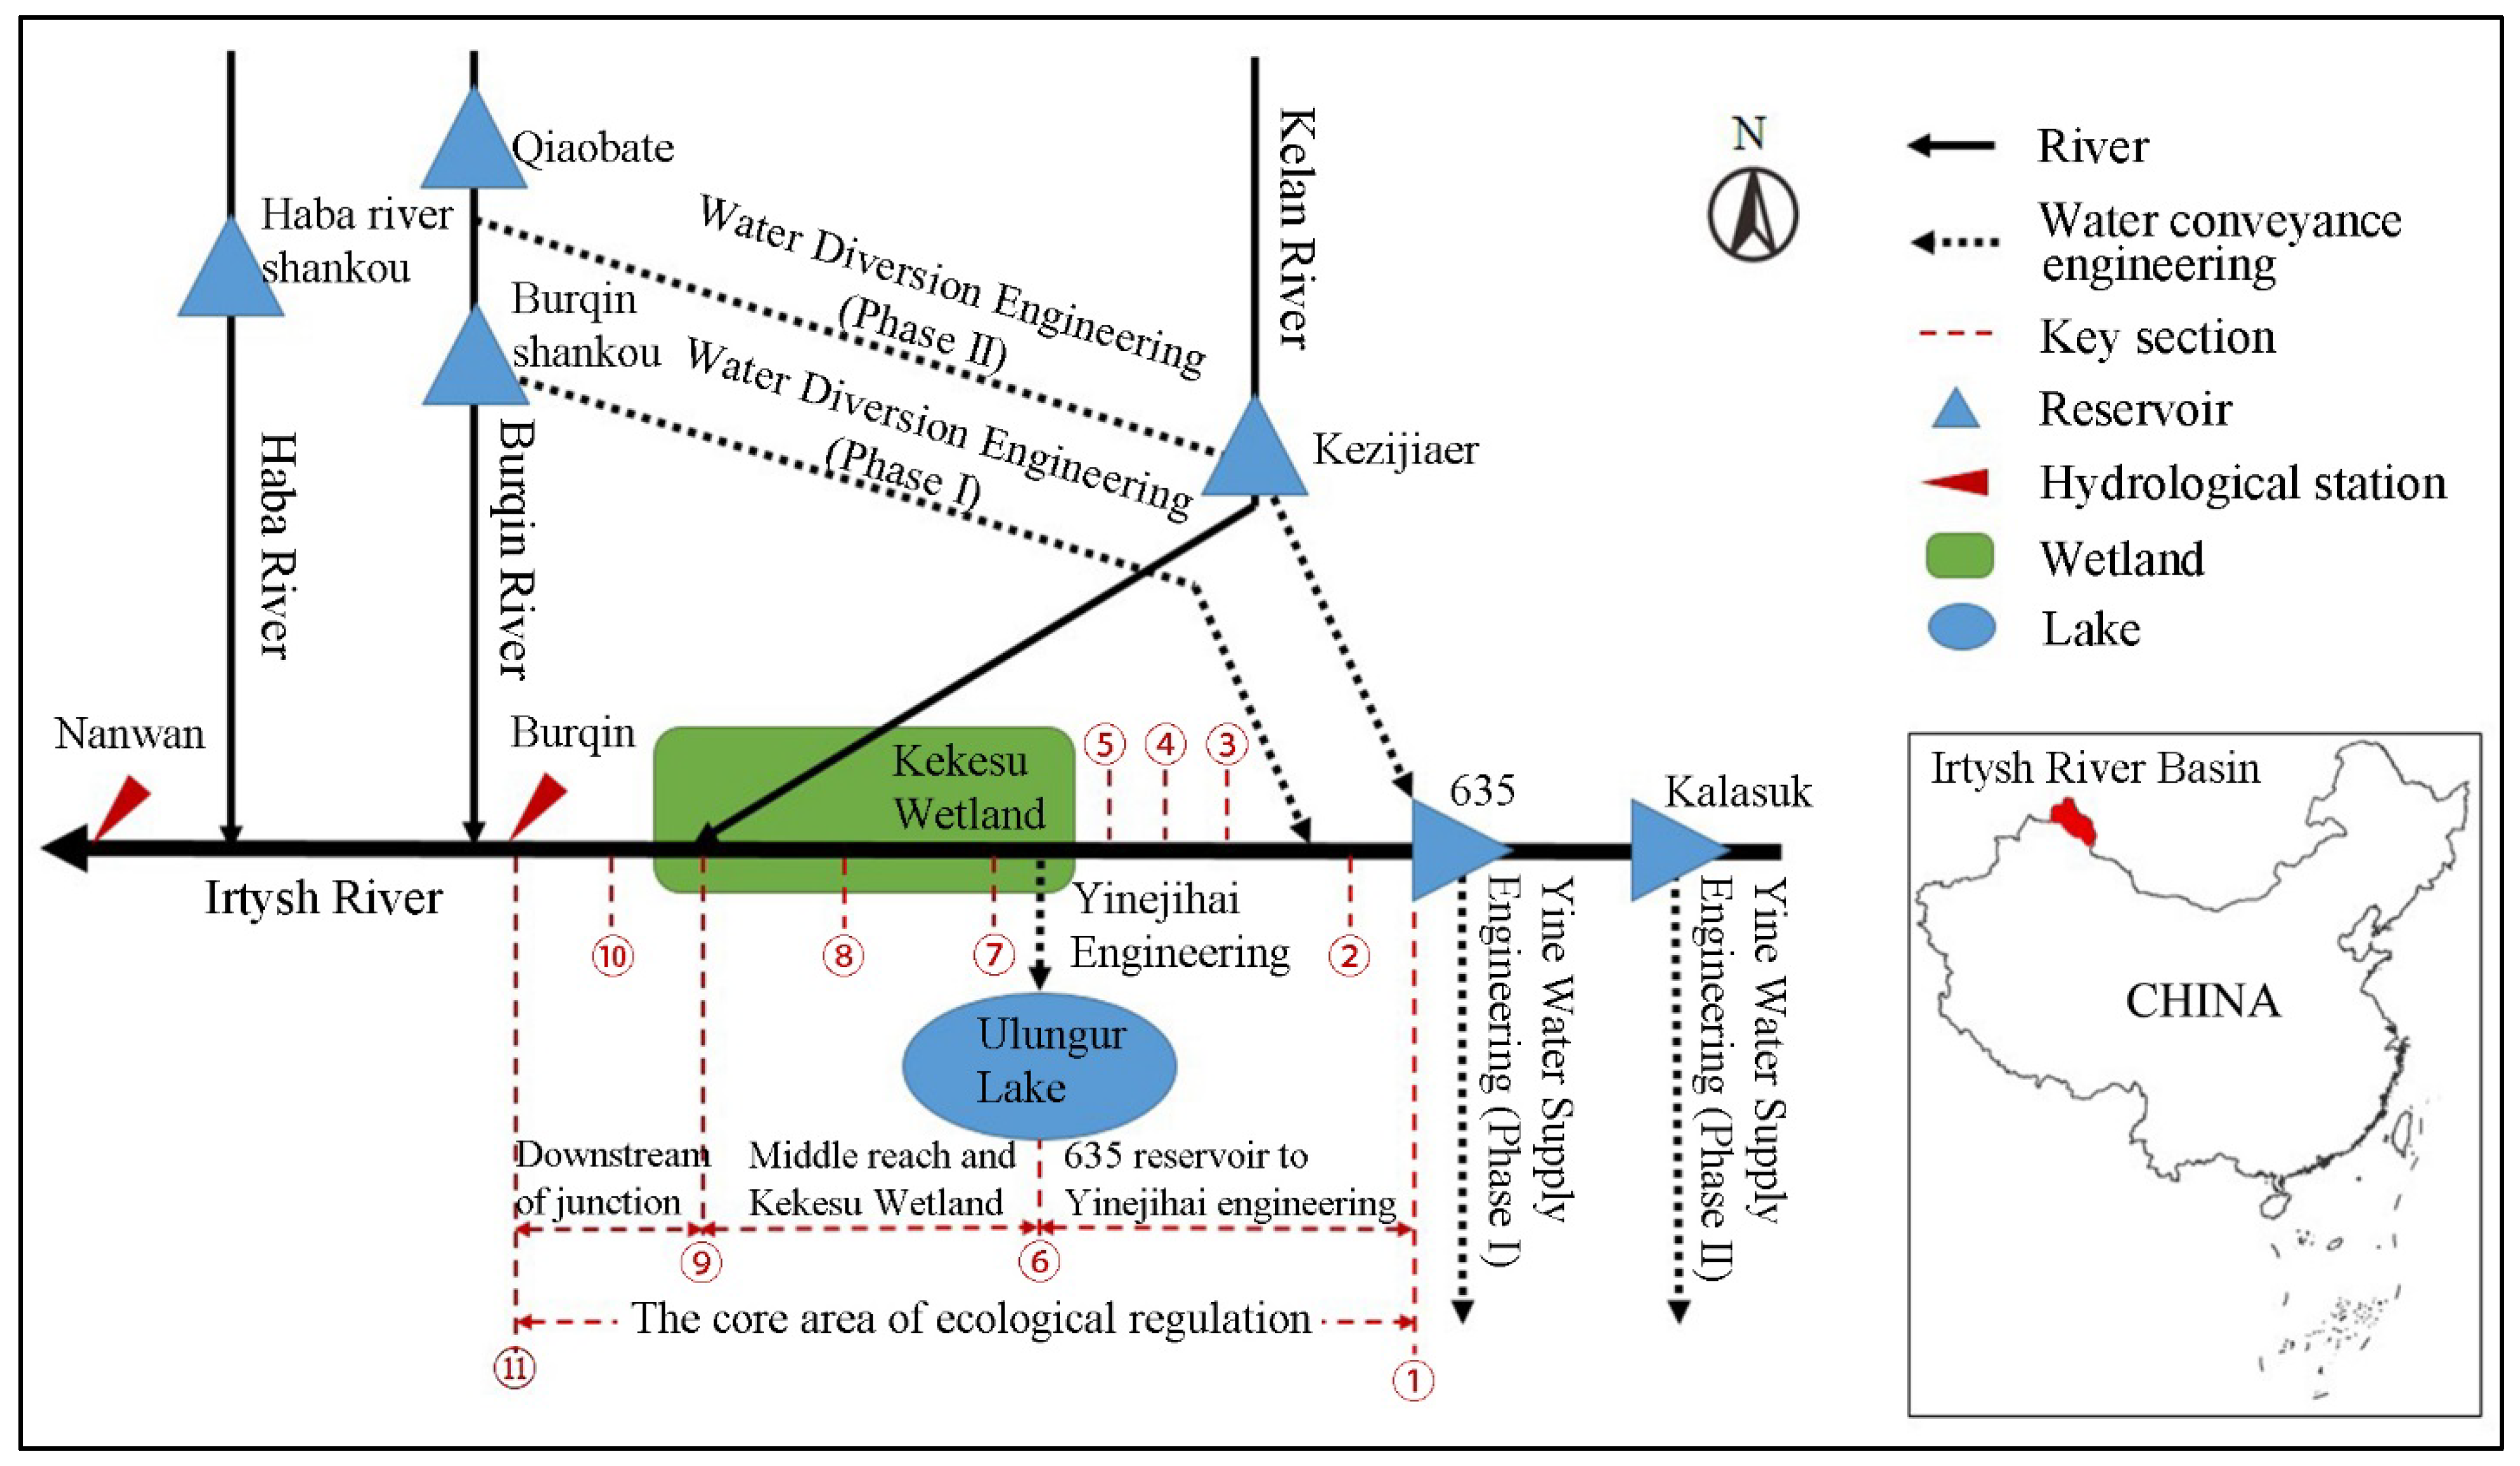
2.1. Study Area
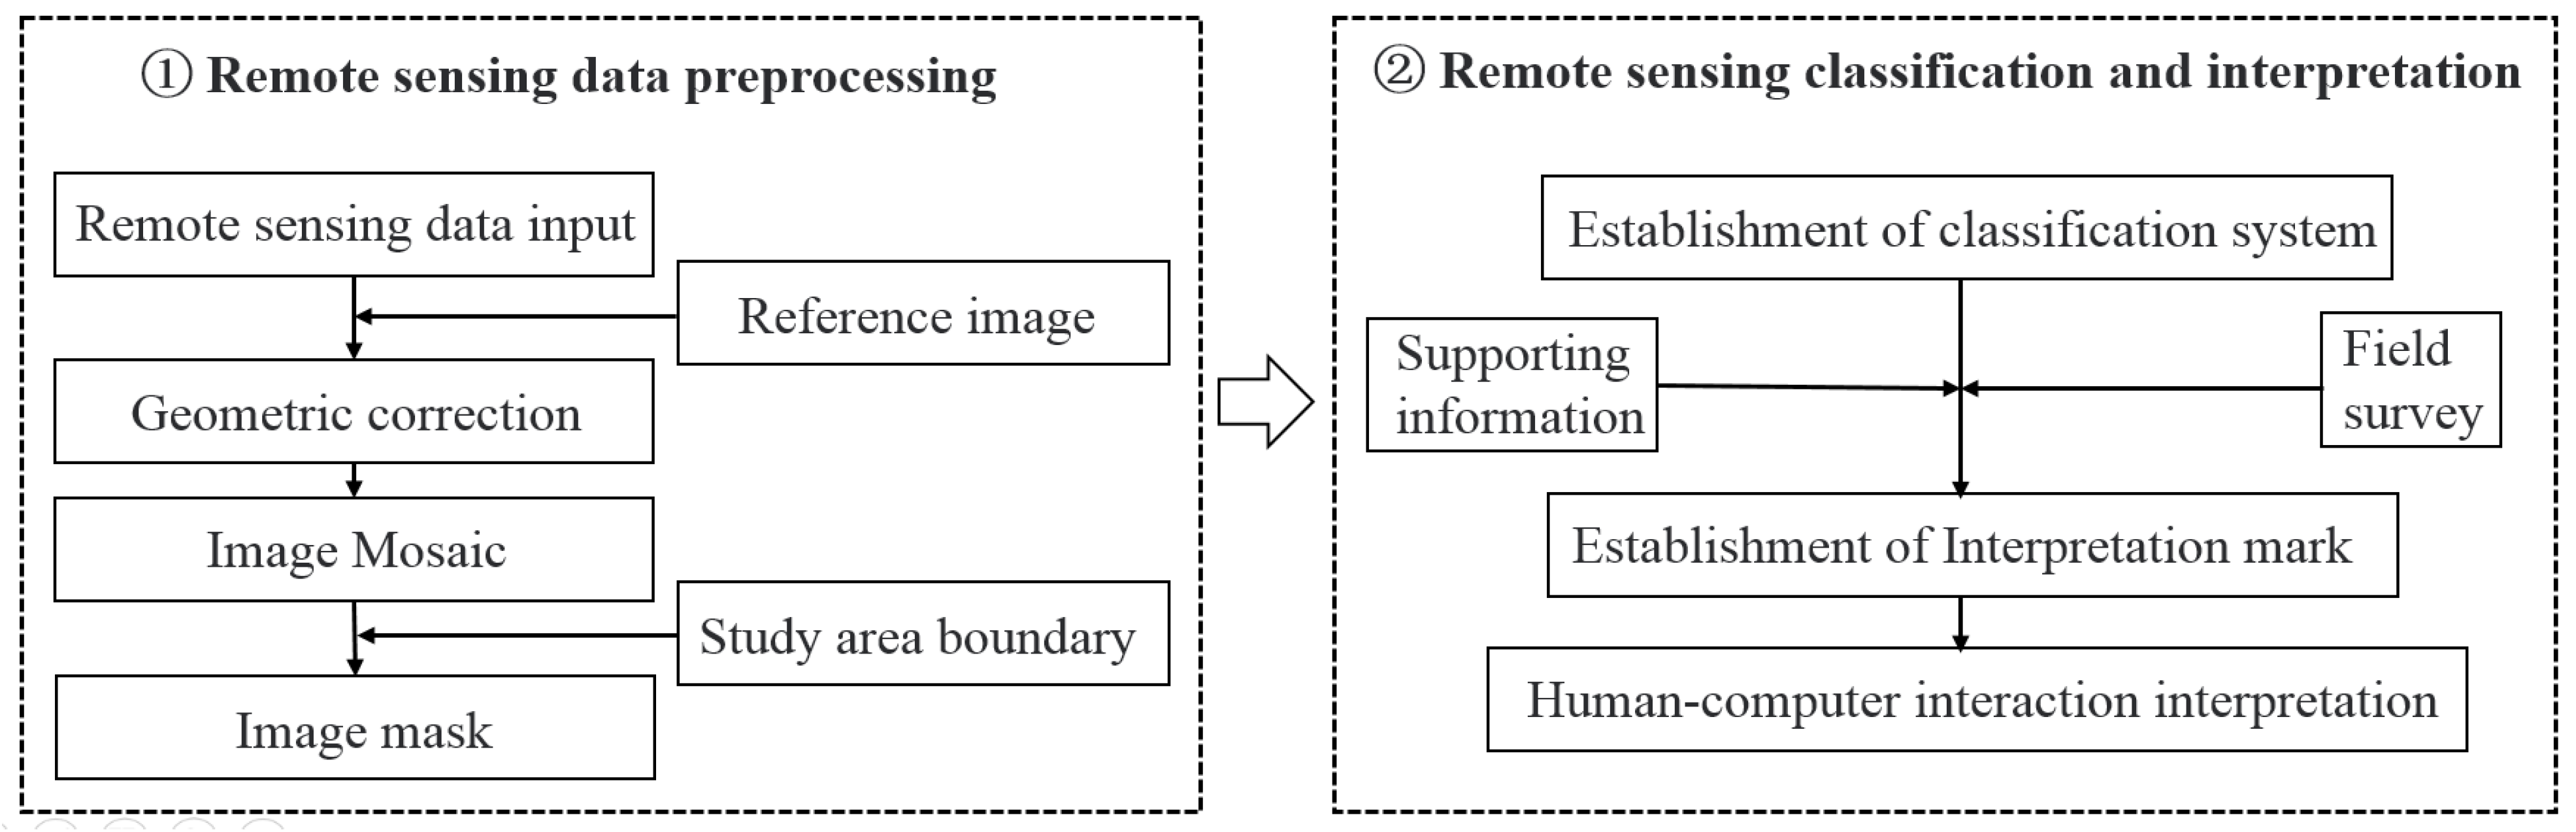
2.2. Data Sources
2.3. Methods
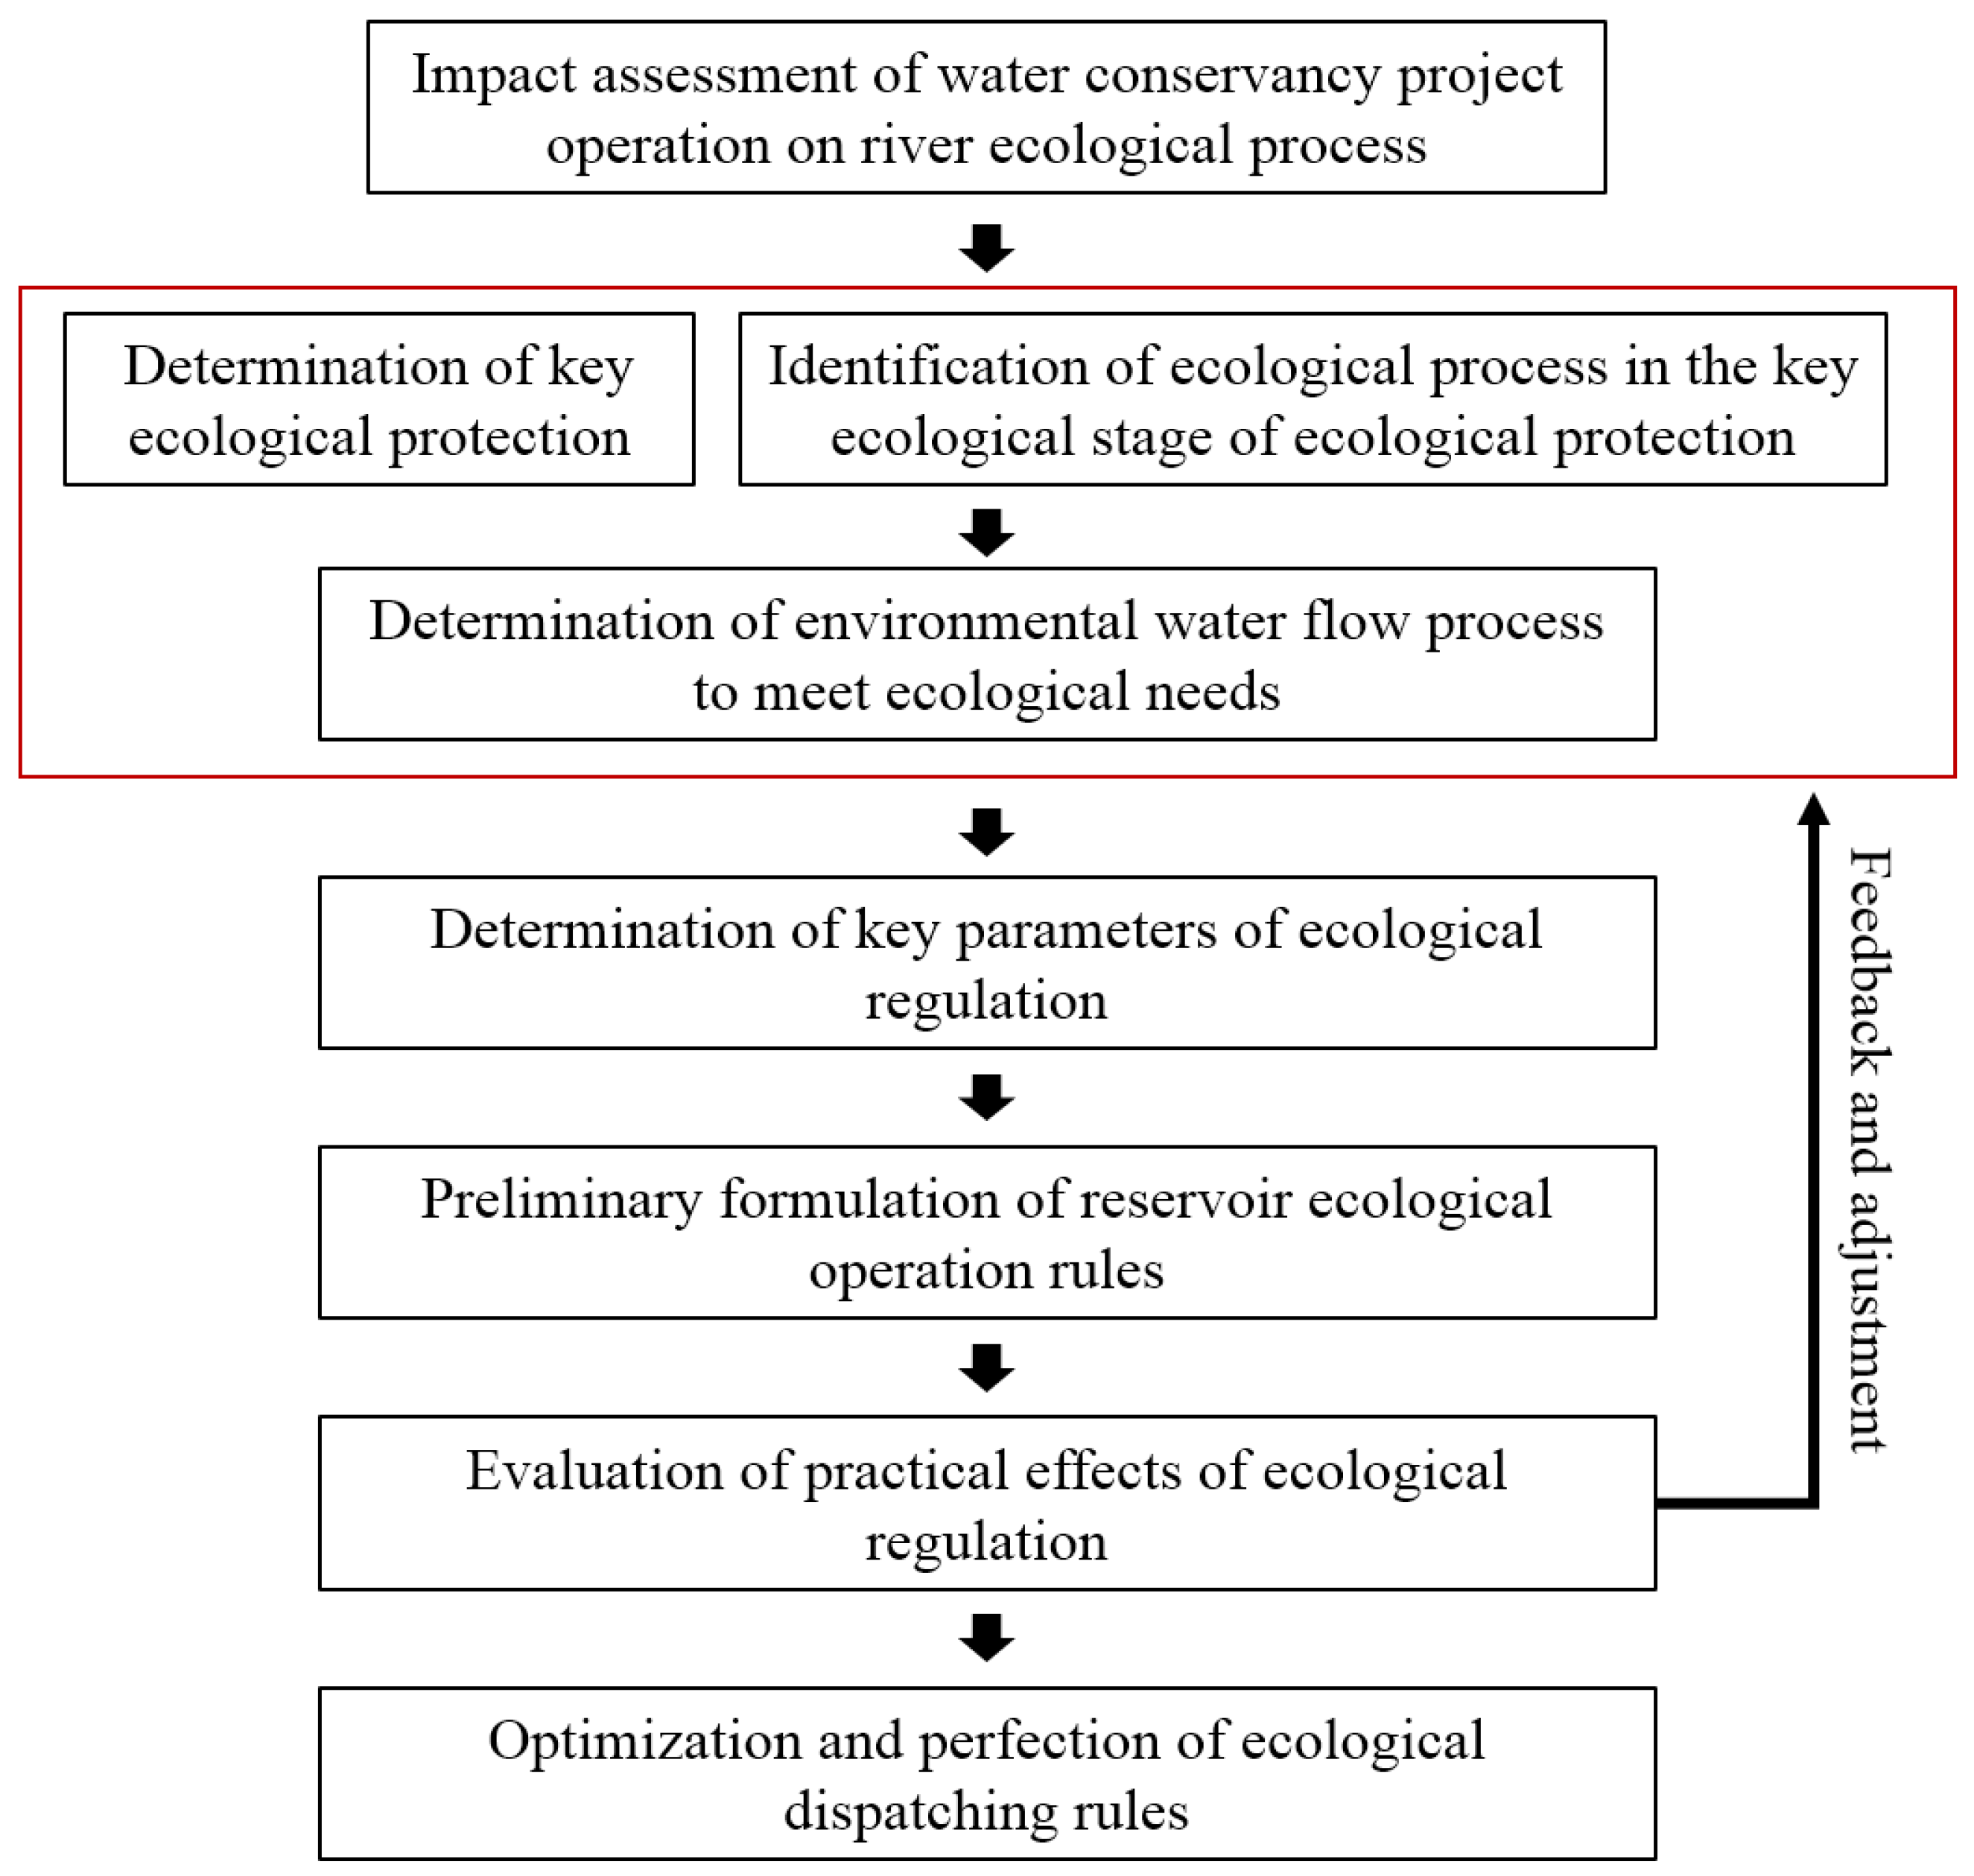
2.3.1. Theory of Reservoir Regulation
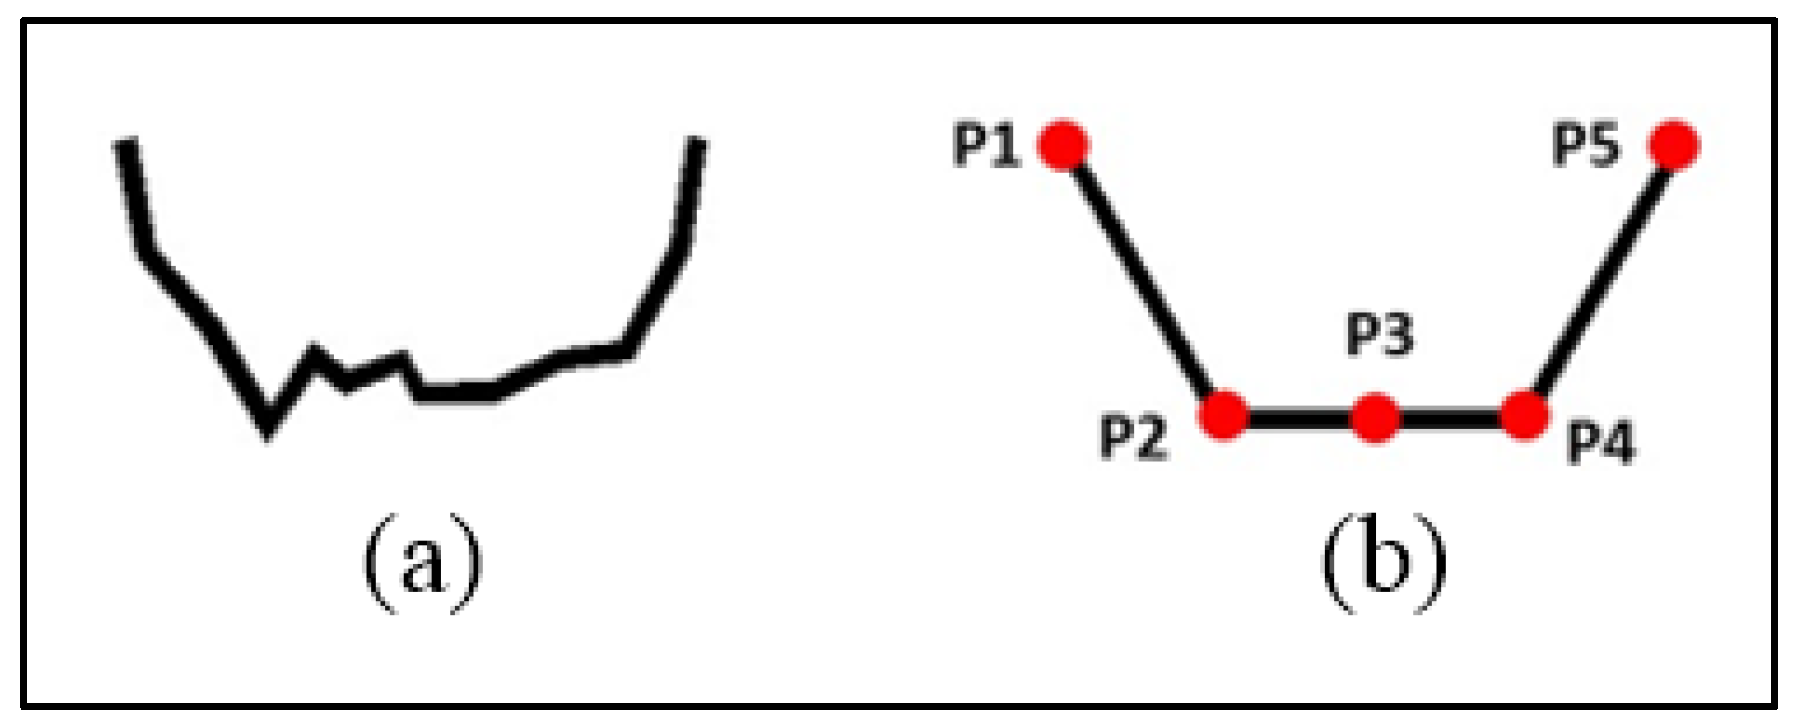
2.3.2. Computation Principle and Reliability Evaluation of the Two-Dimensional Hydrodynamic Model
2.3.3. Key Parameters for the Hydrological Process Remediation
3. Results
3.1. Calibration and Validation of the Two-Dimensional Hydrodynamic Model
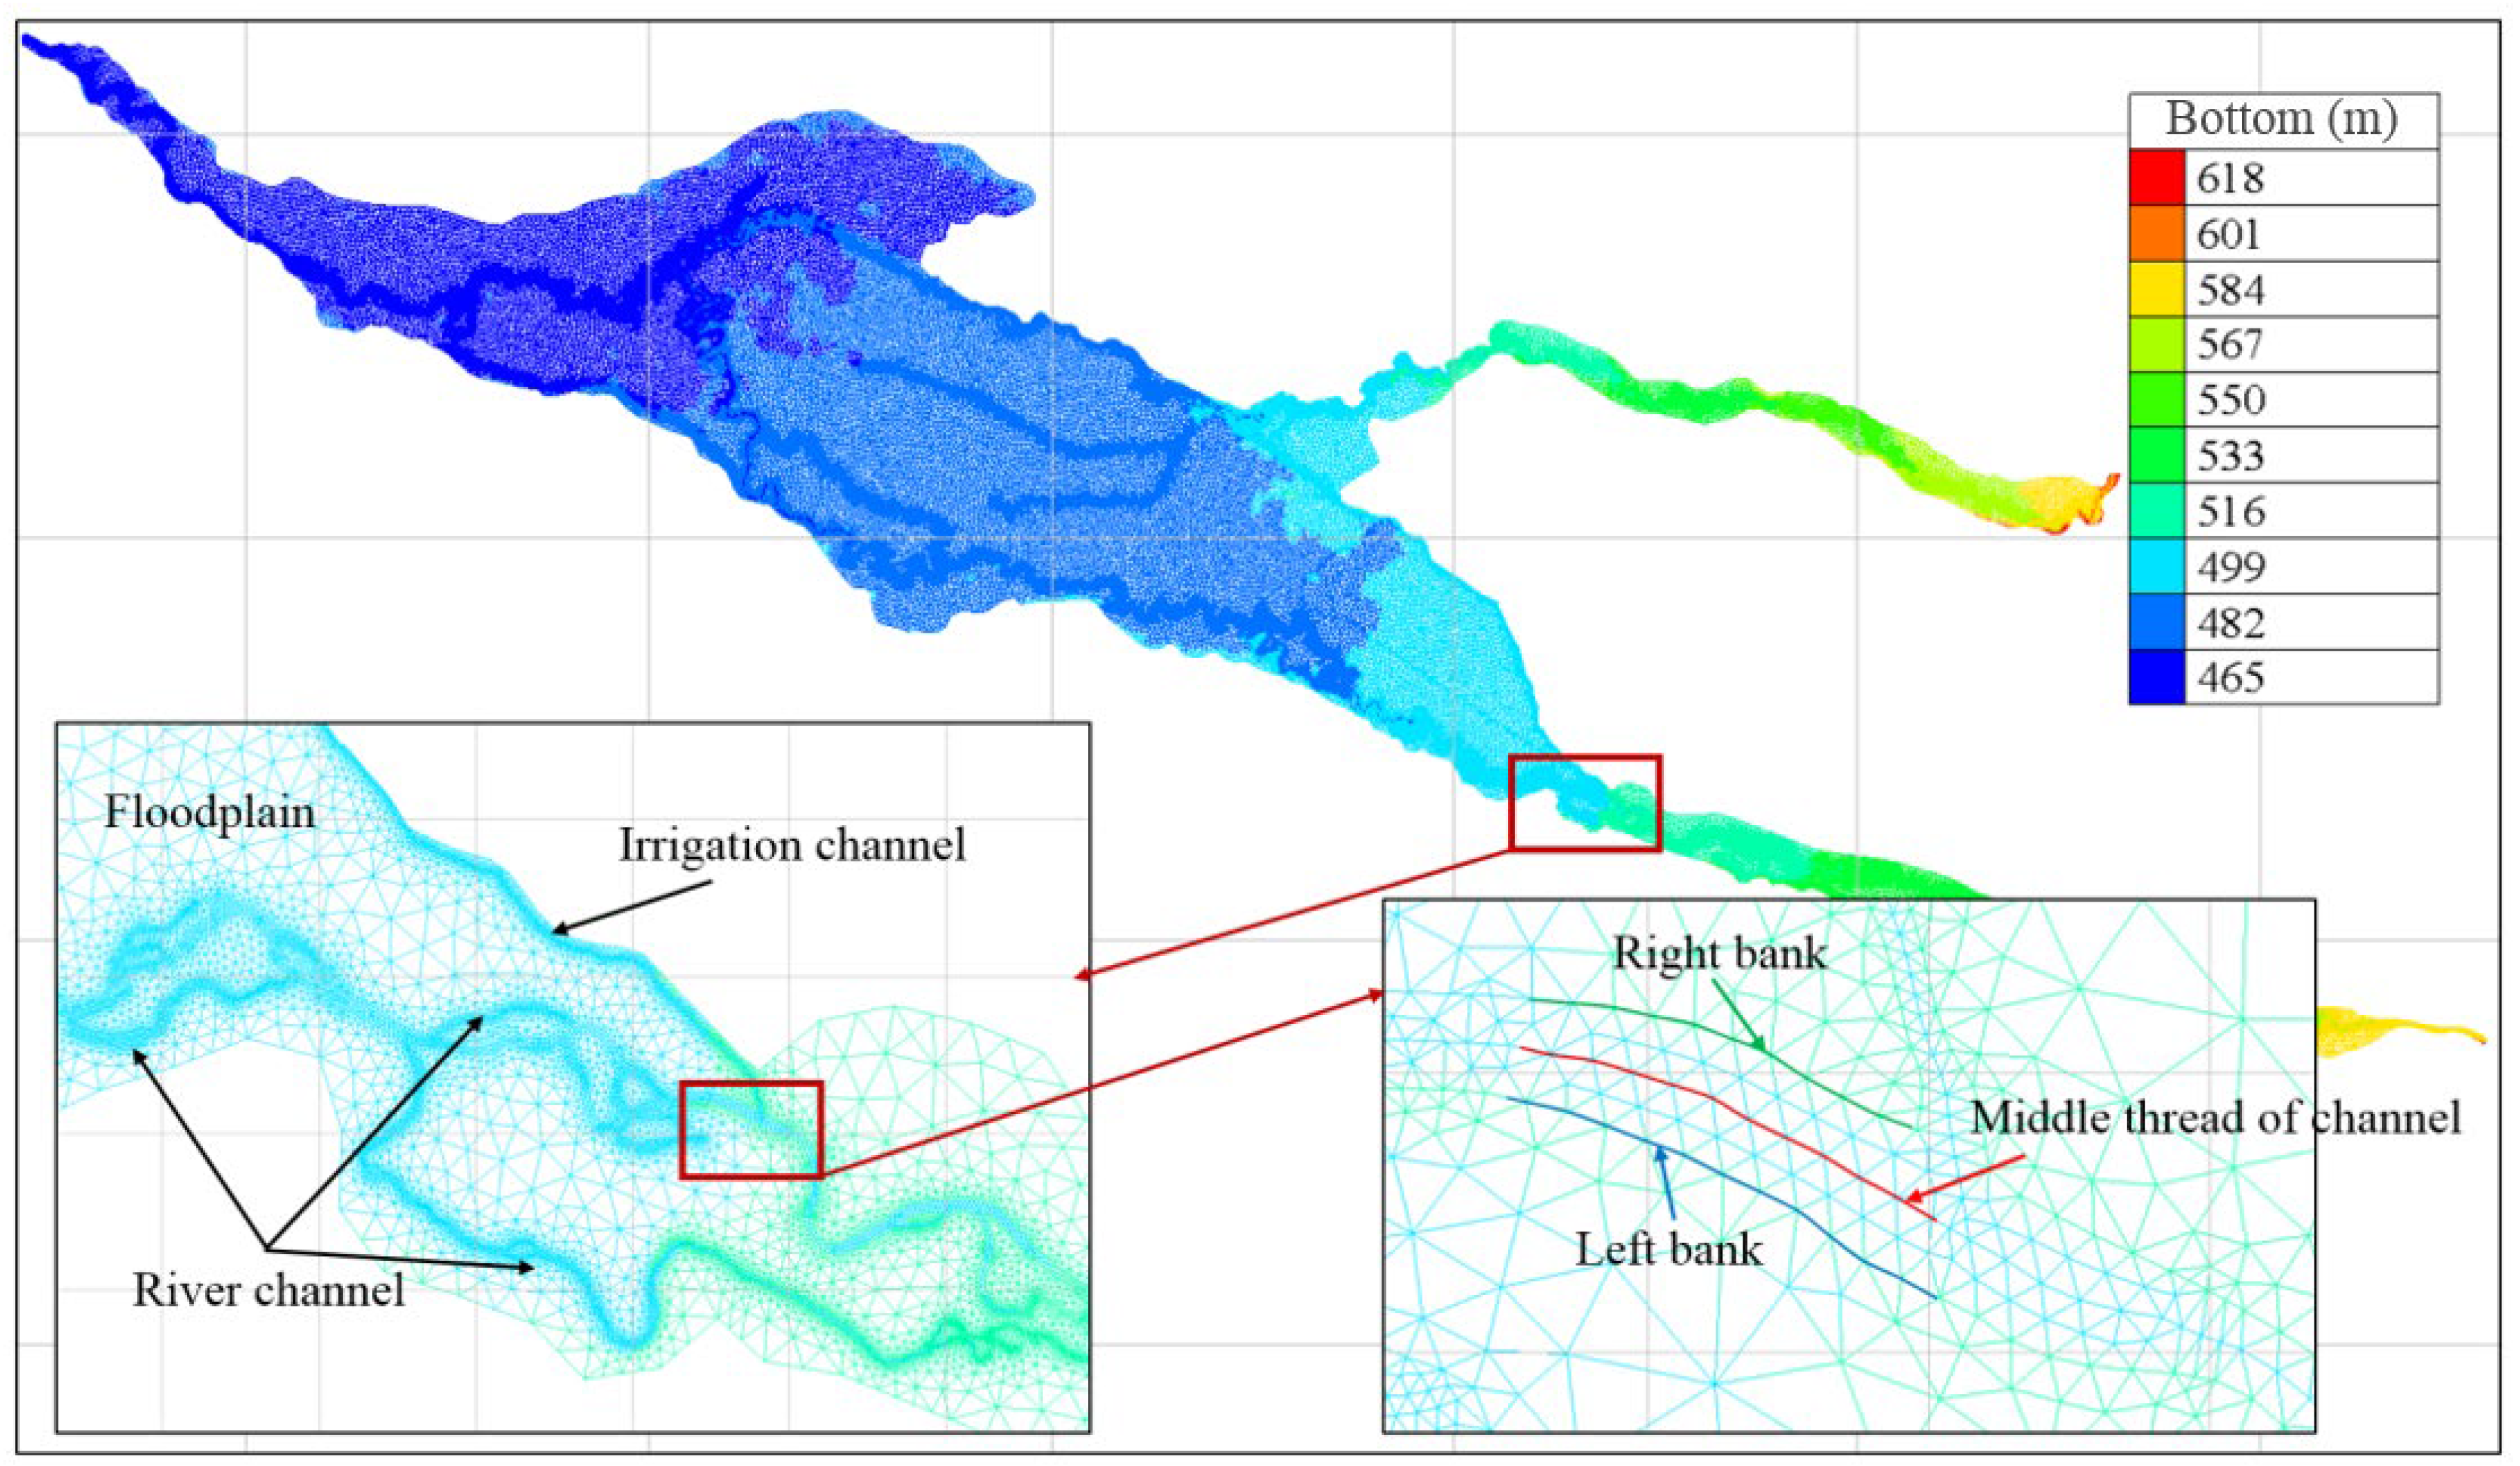
3.1.1. Model Establishment
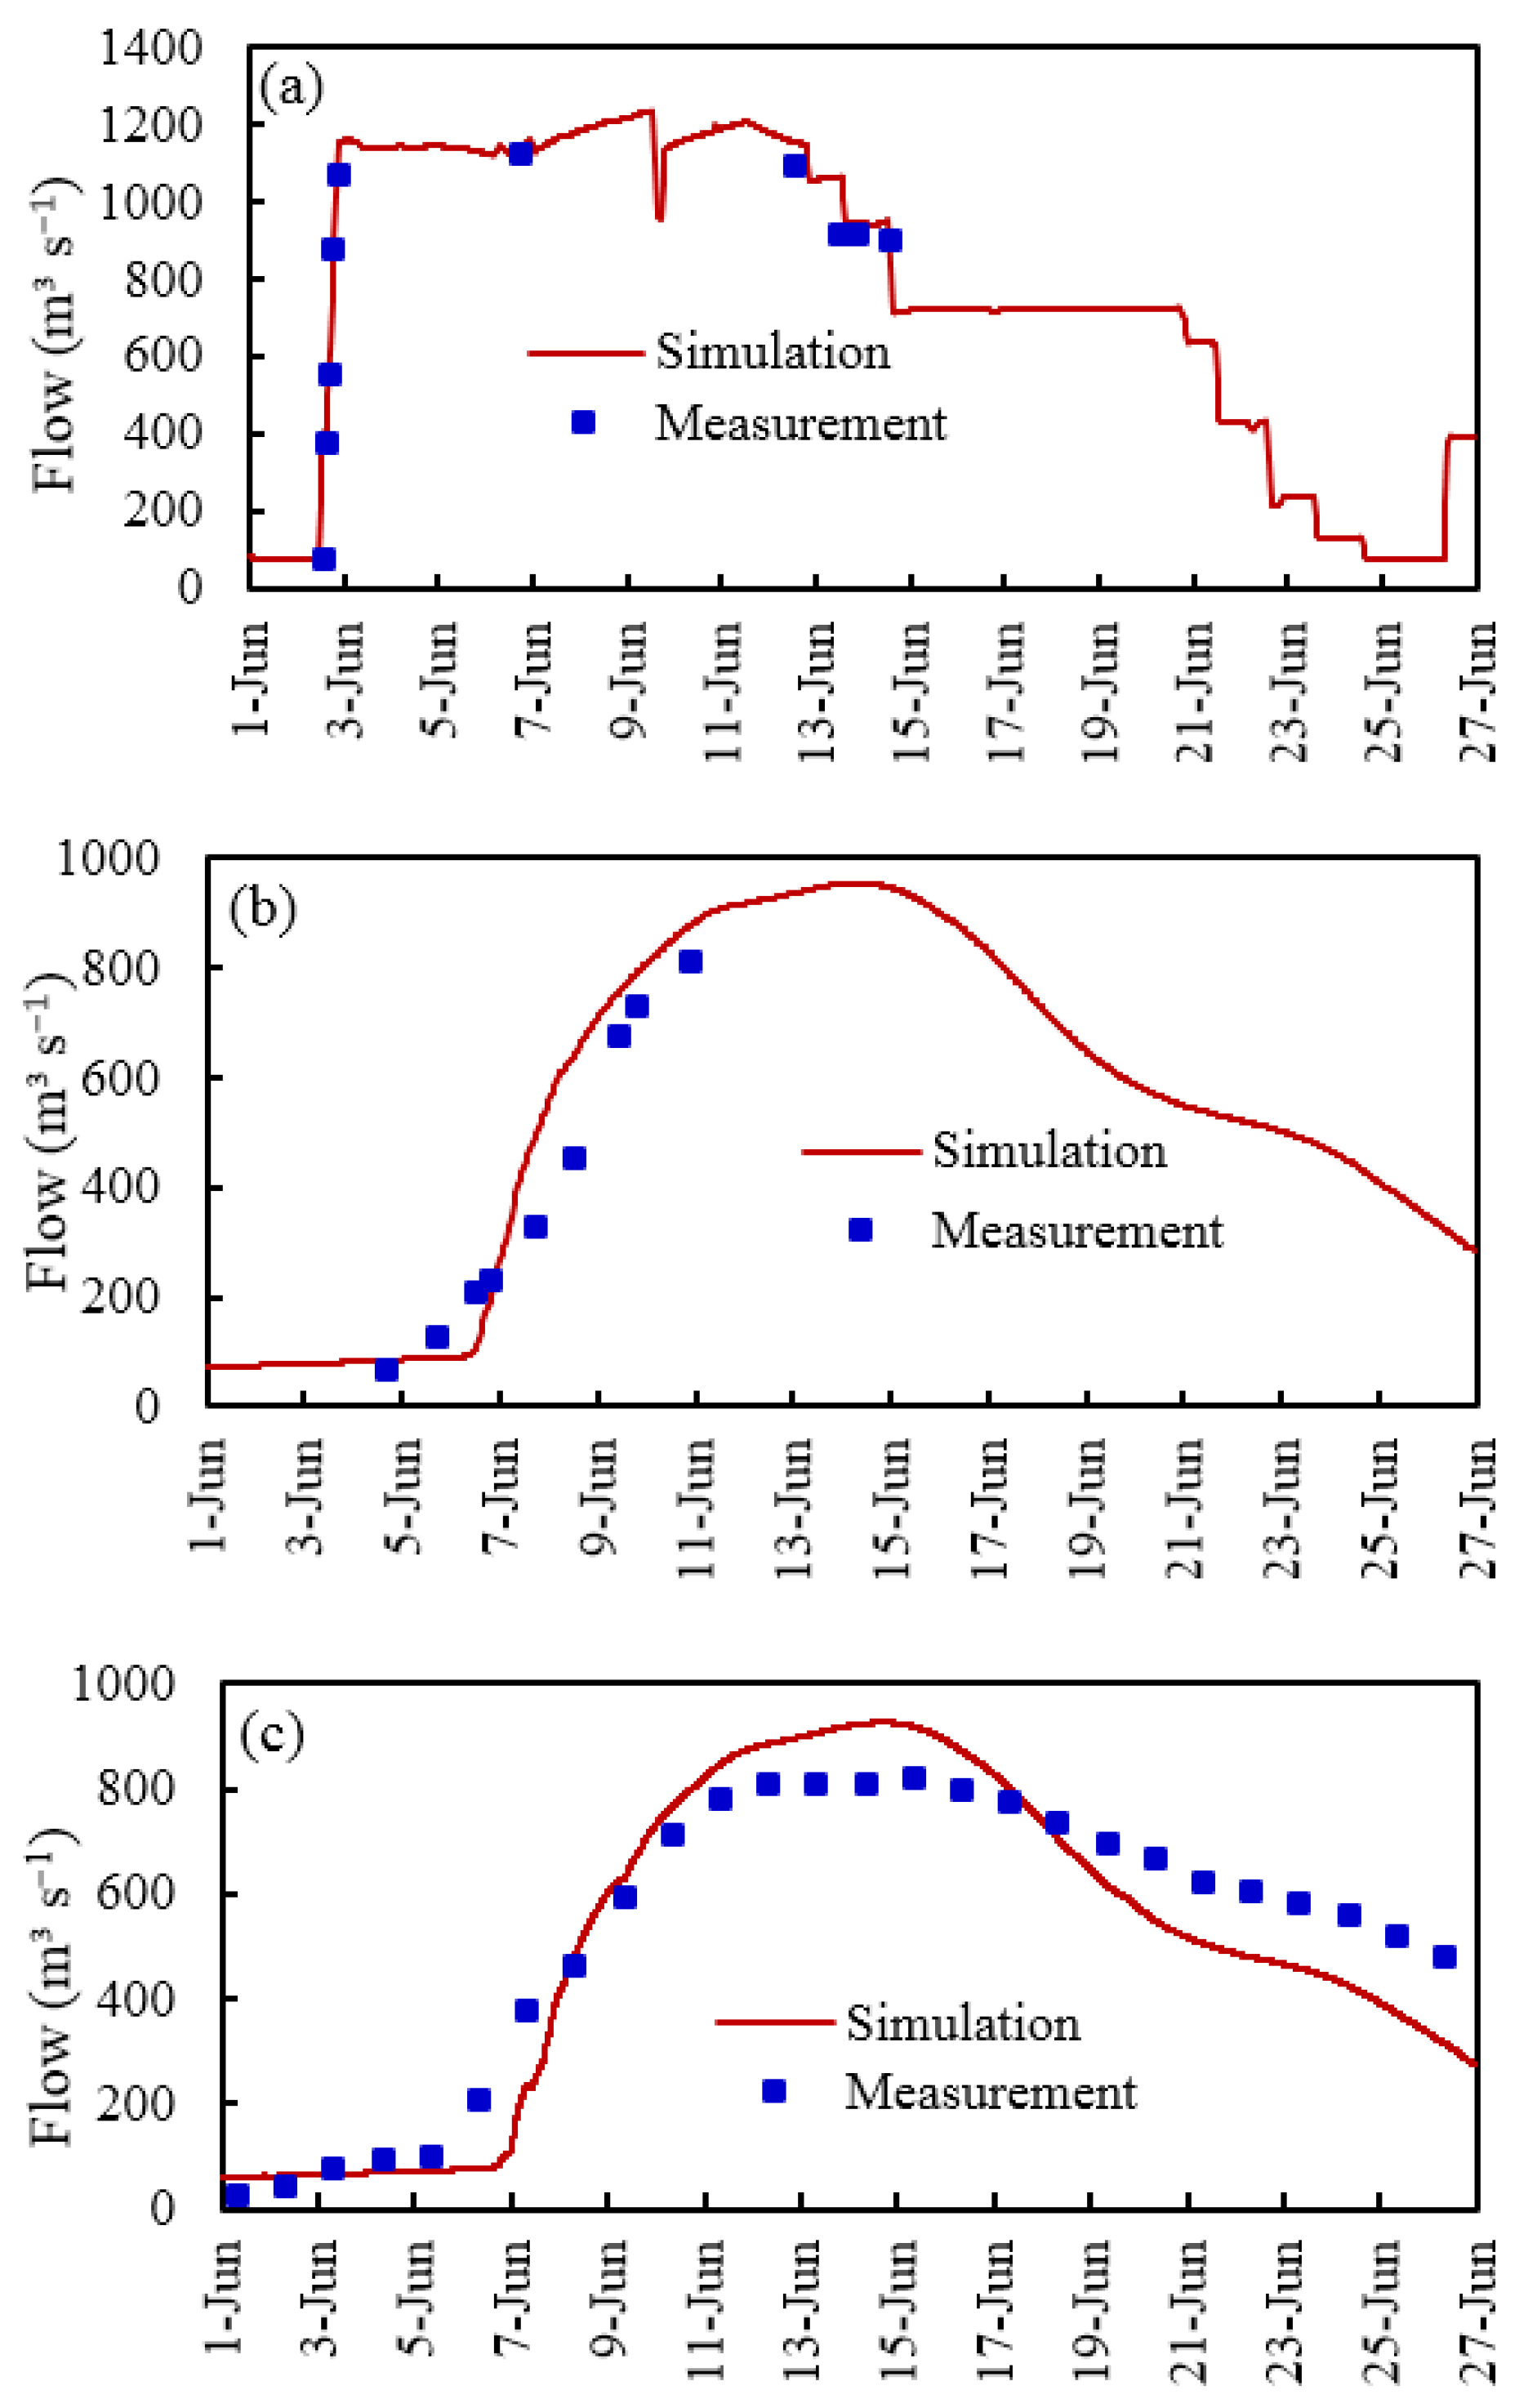
3.1.2. Model Calibration
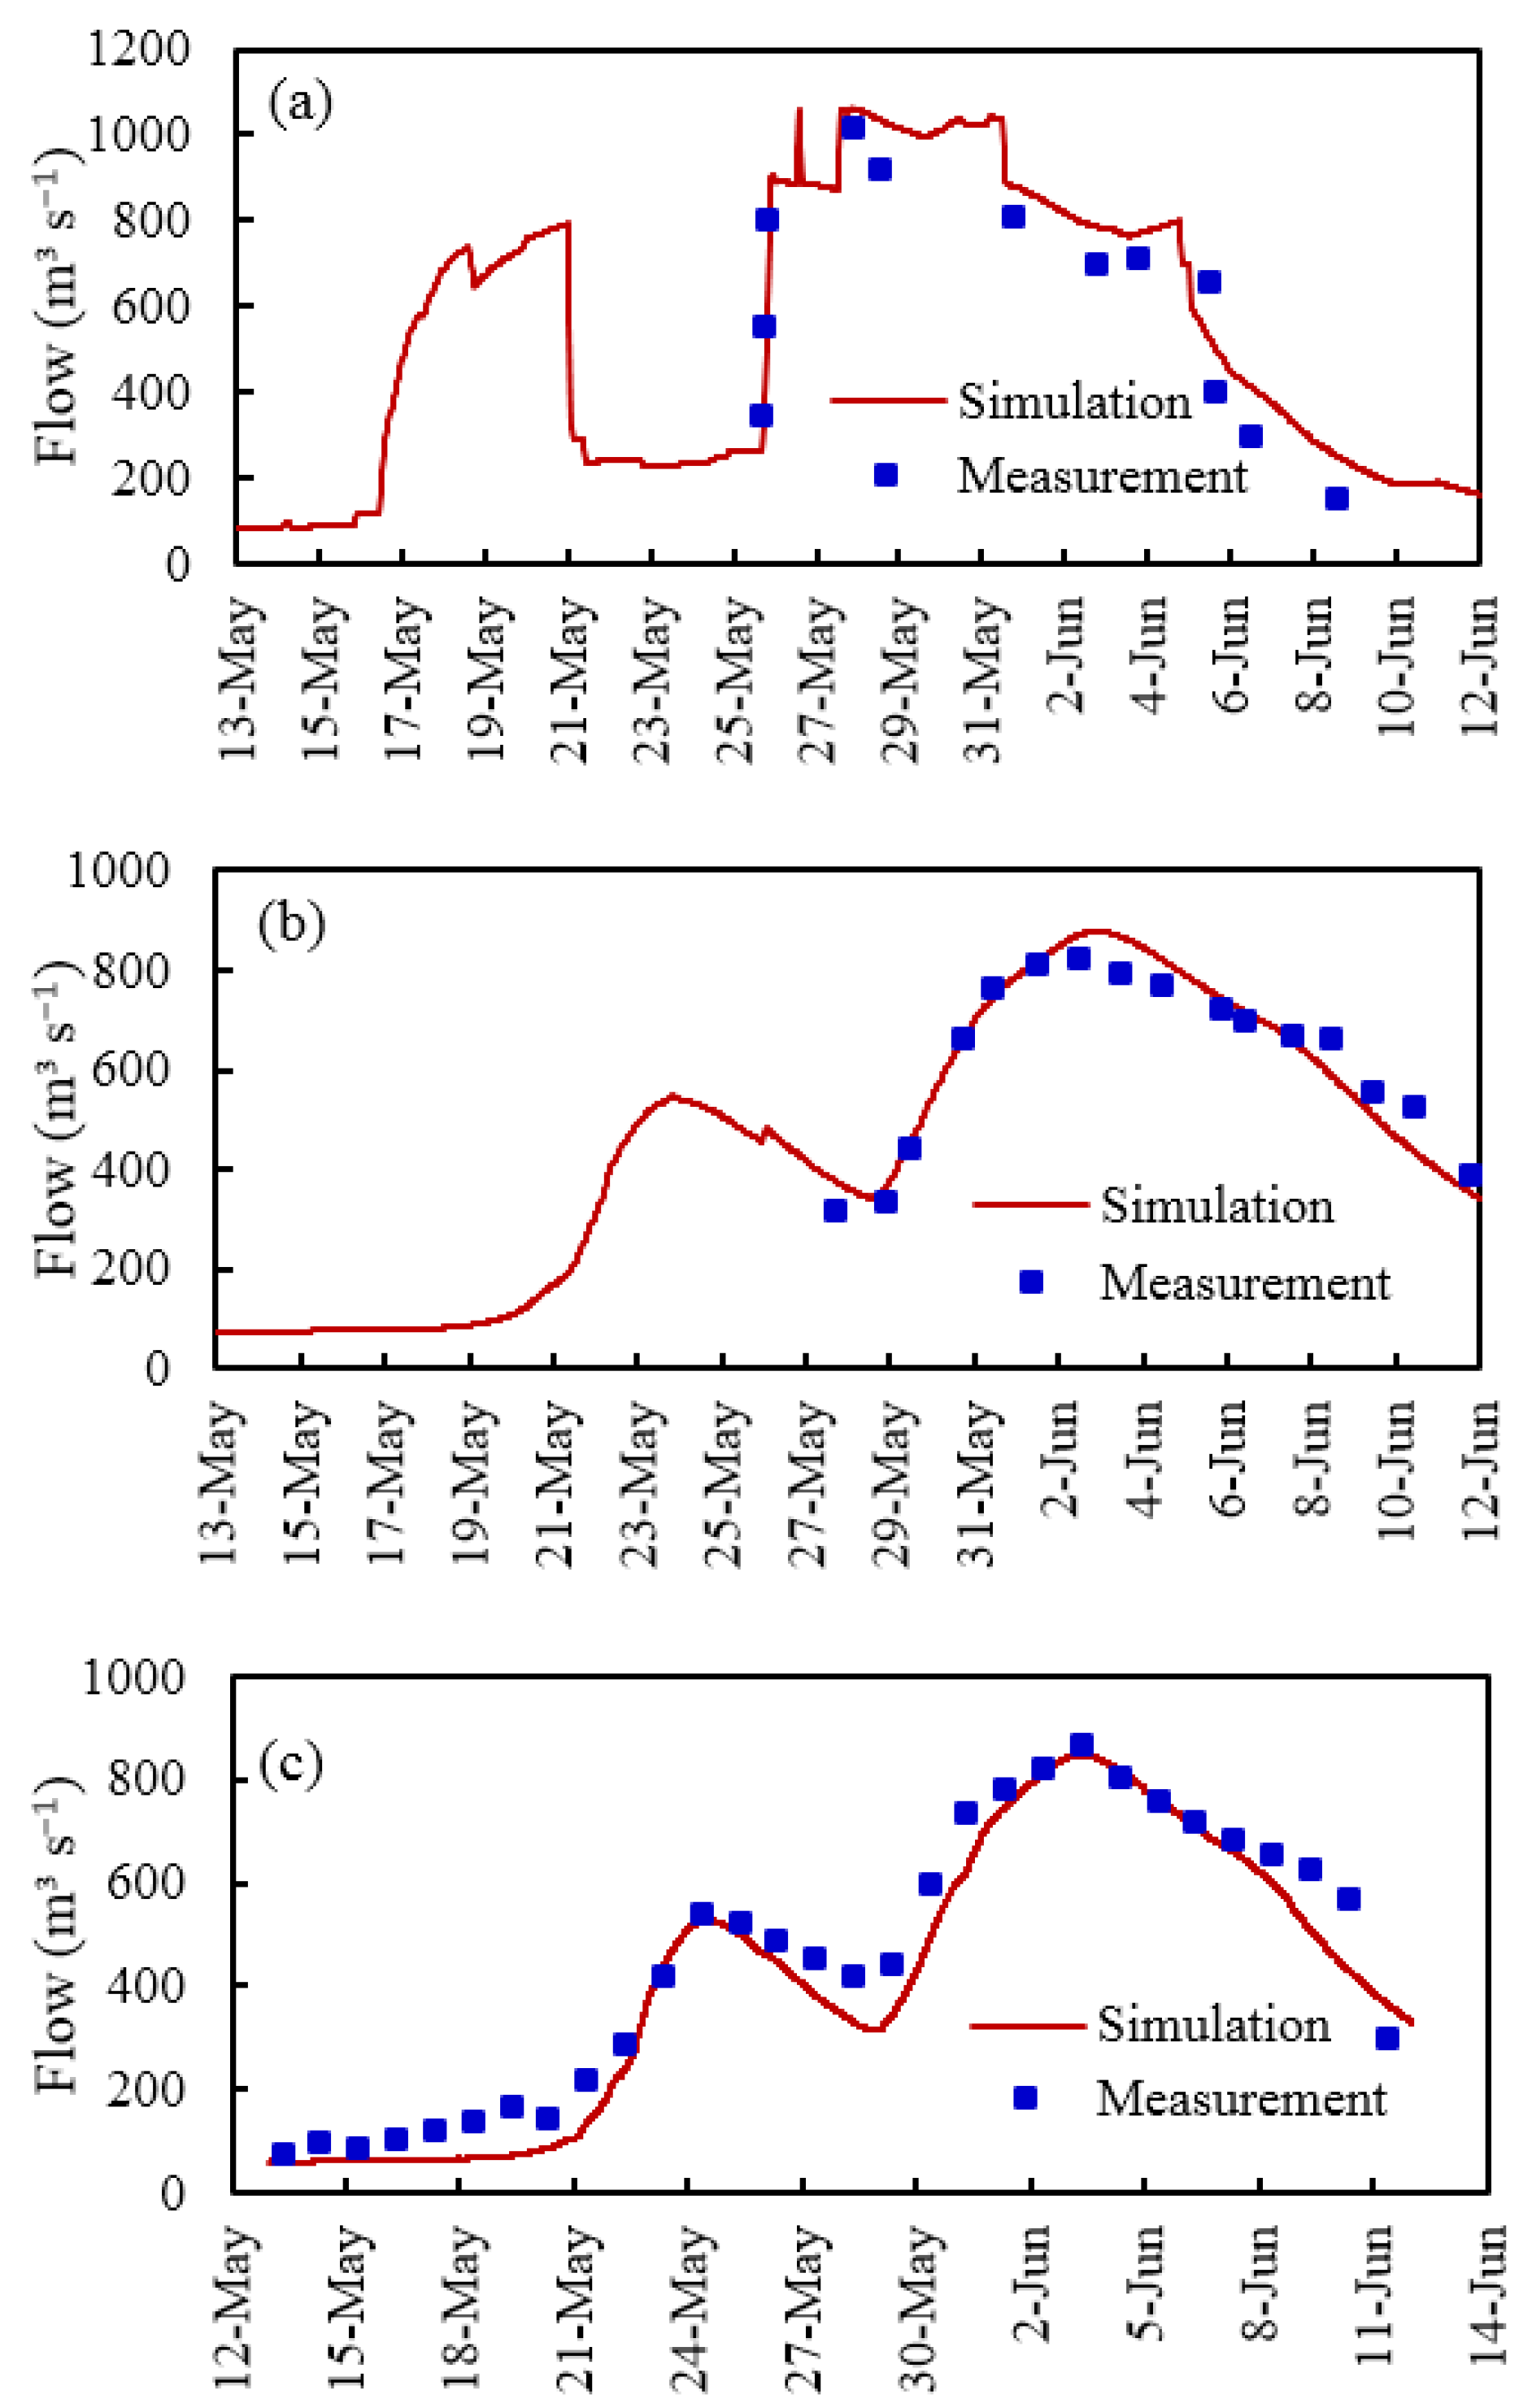
3.1.3. Model Validation
3.2. Key Parameters for the Hydrological Process Remediation
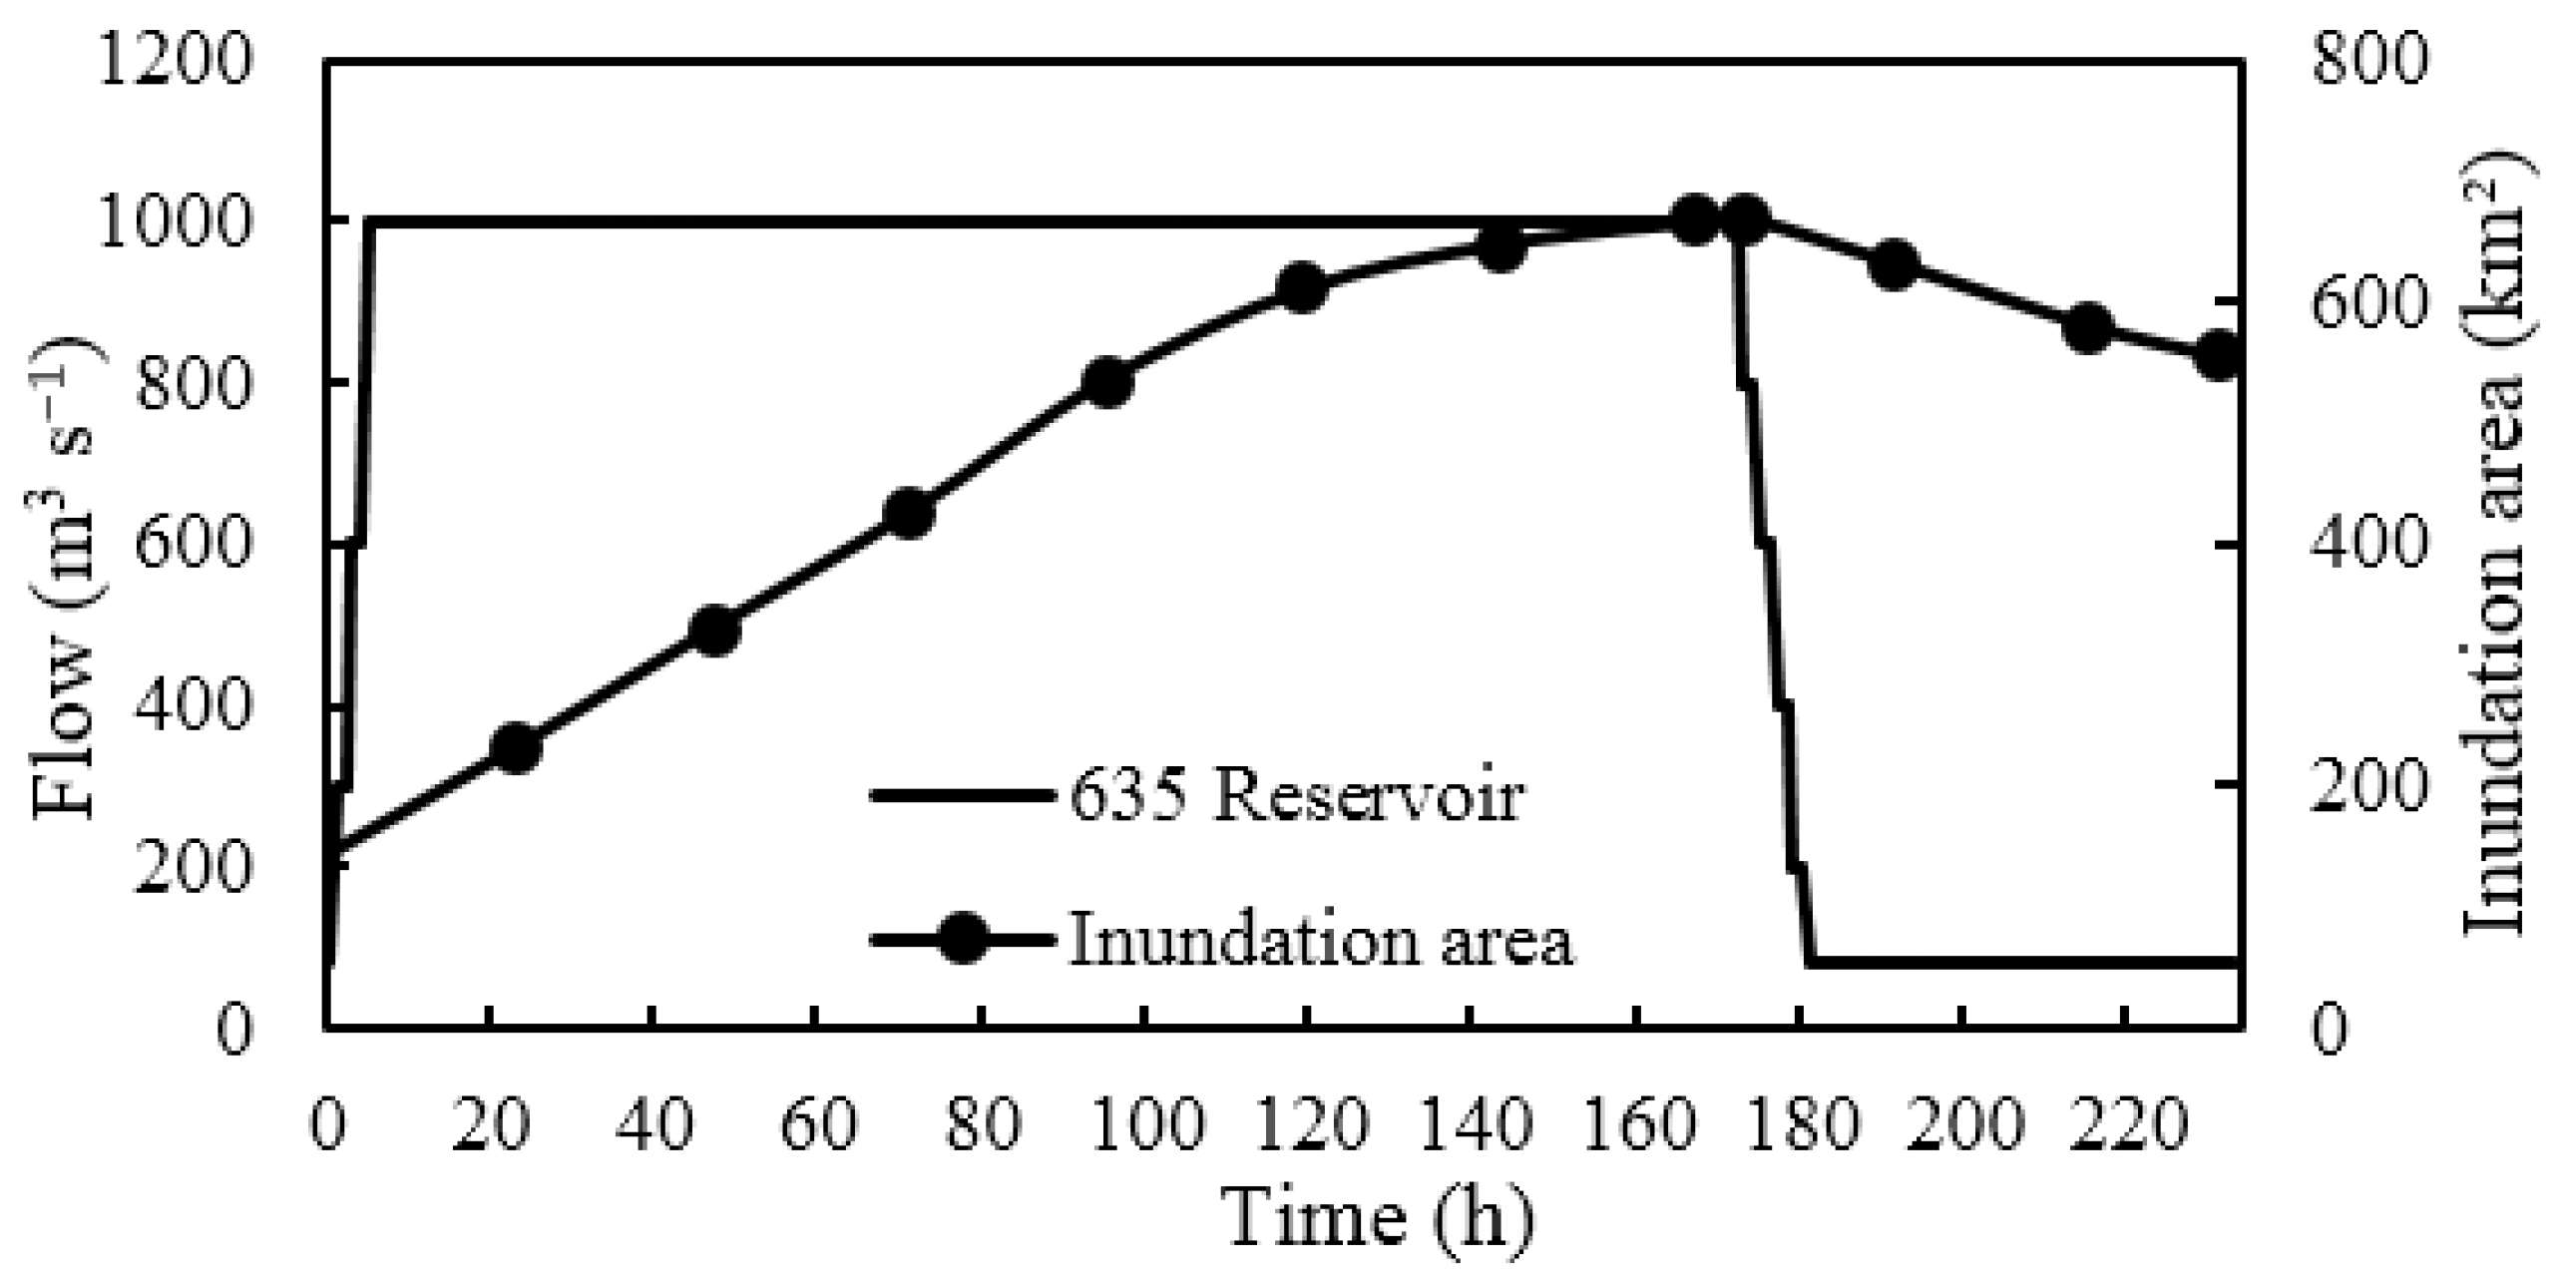
3.2.1. The Flood Peak Flow of Ecological Regulation
3.2.2. The Water Volume of Ecological Regulation
3.3. Evaluation of the Ecological Regulation Effects
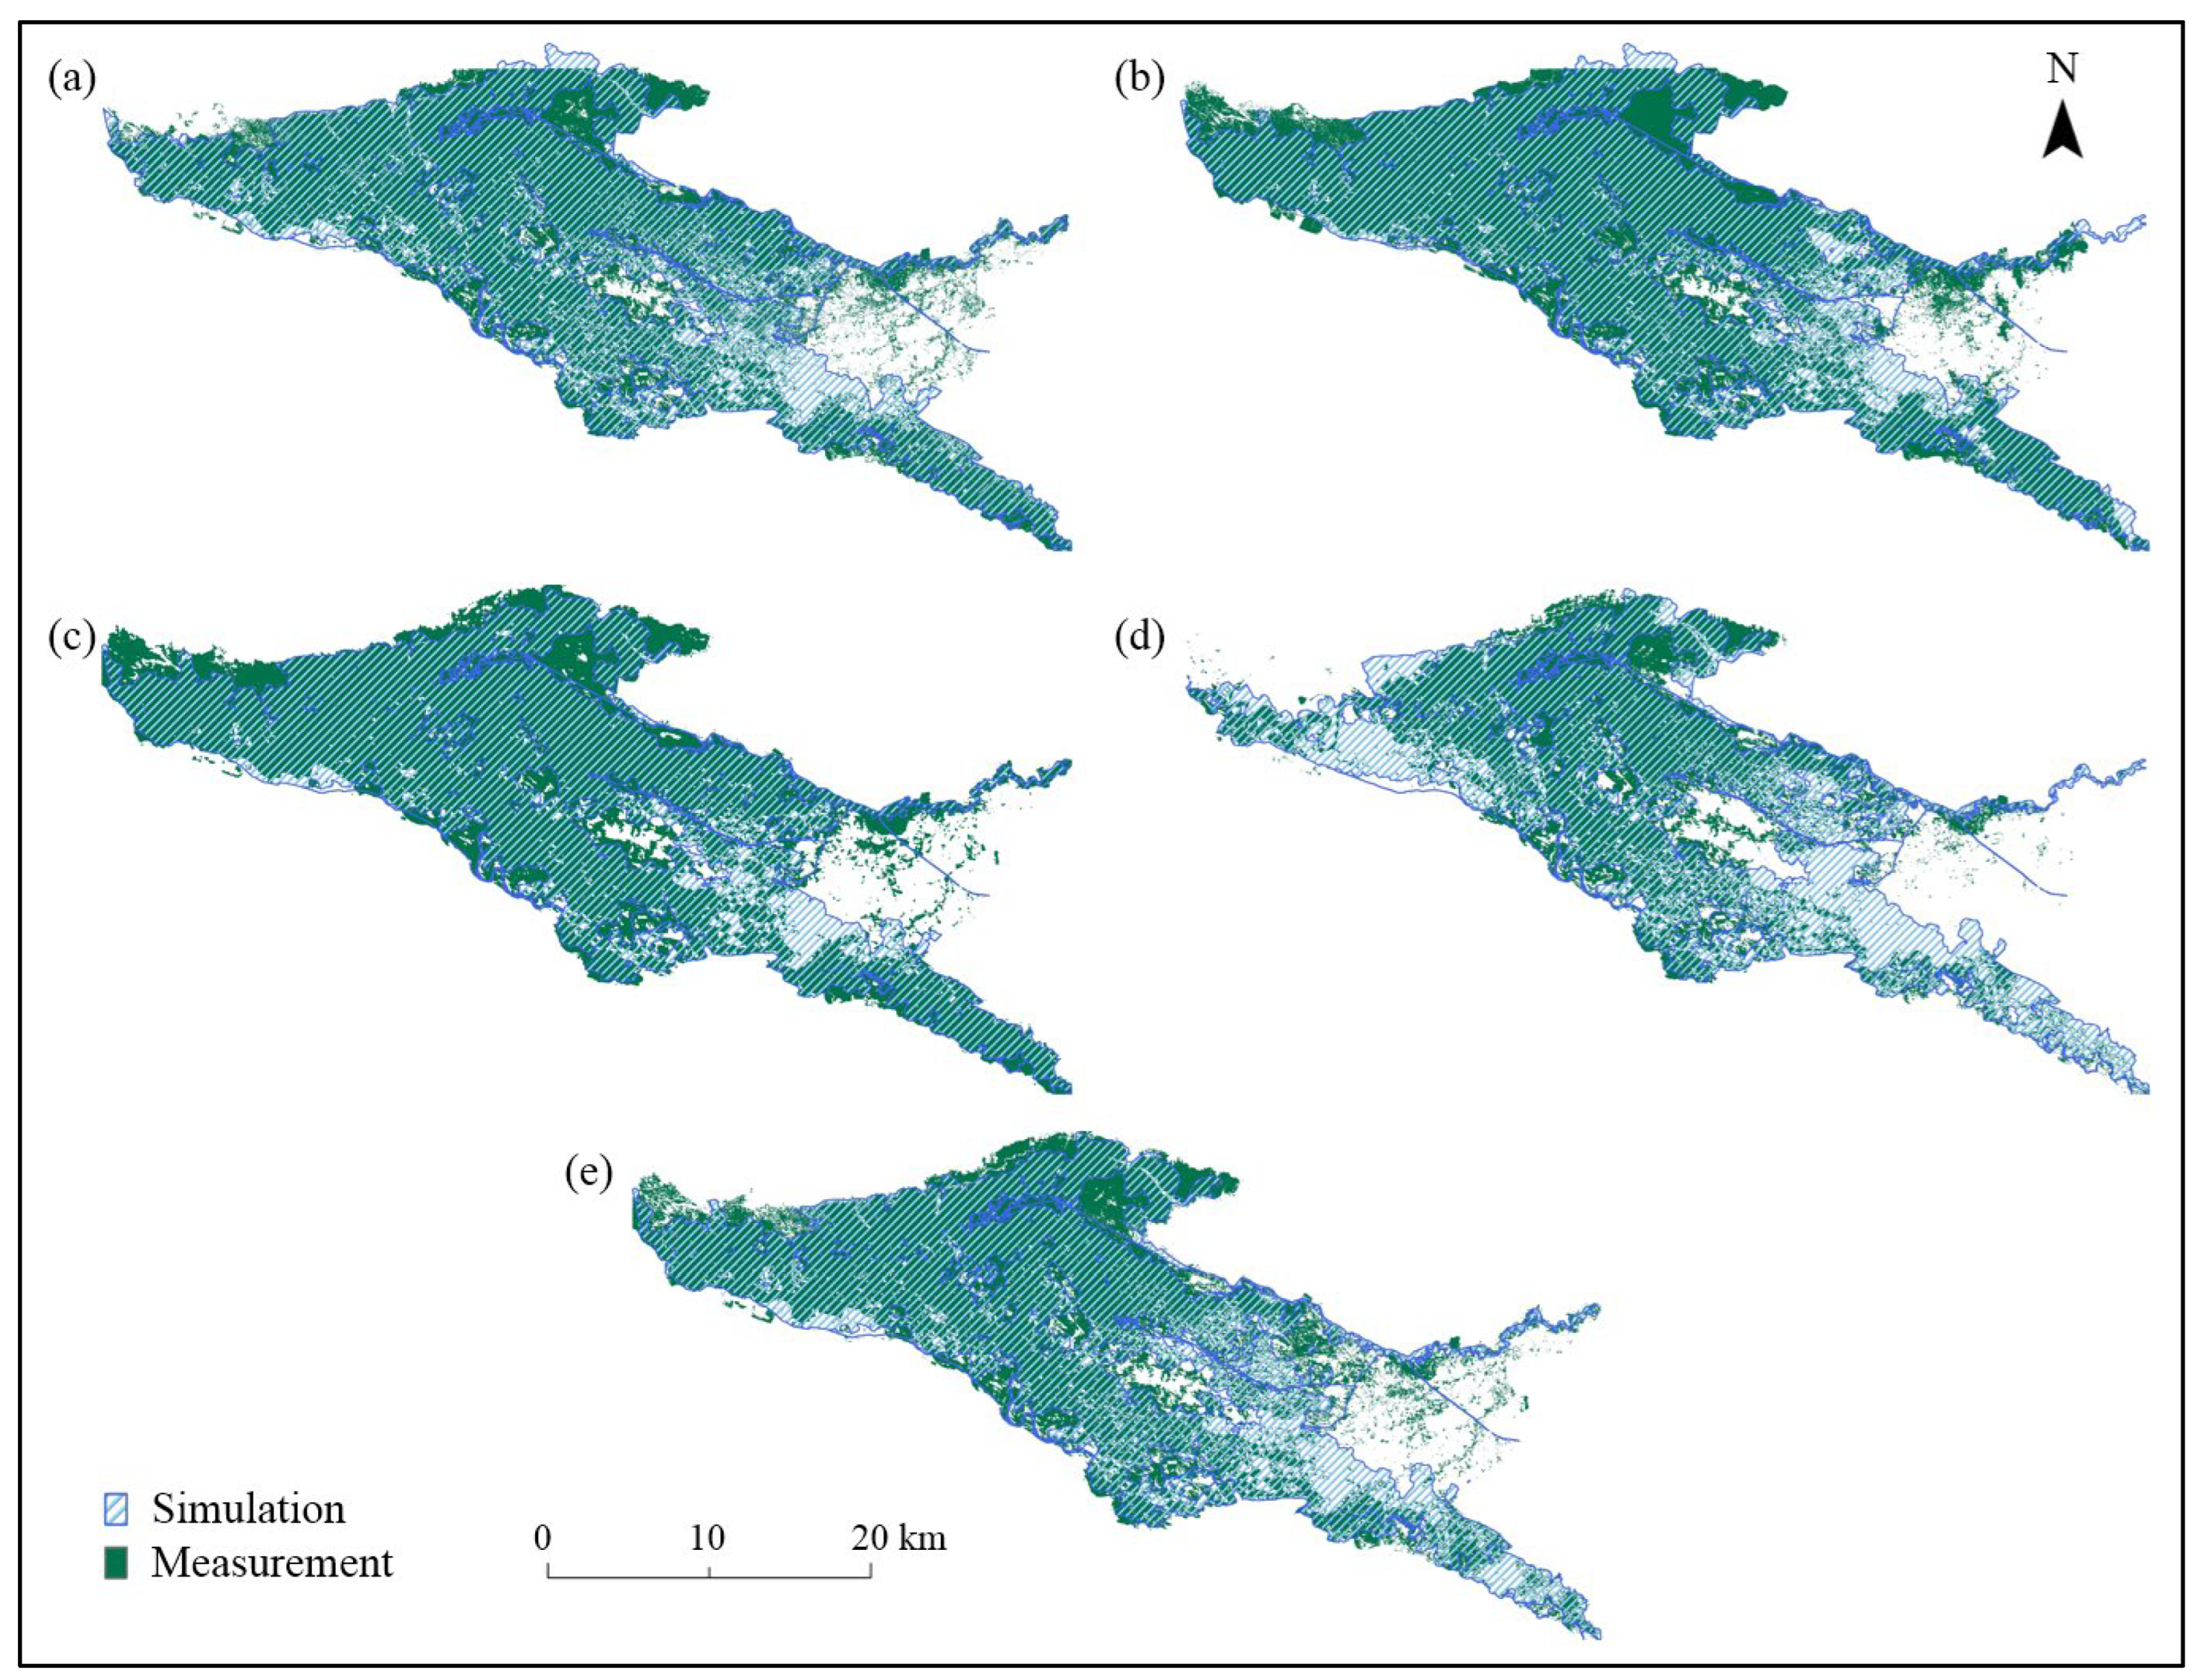
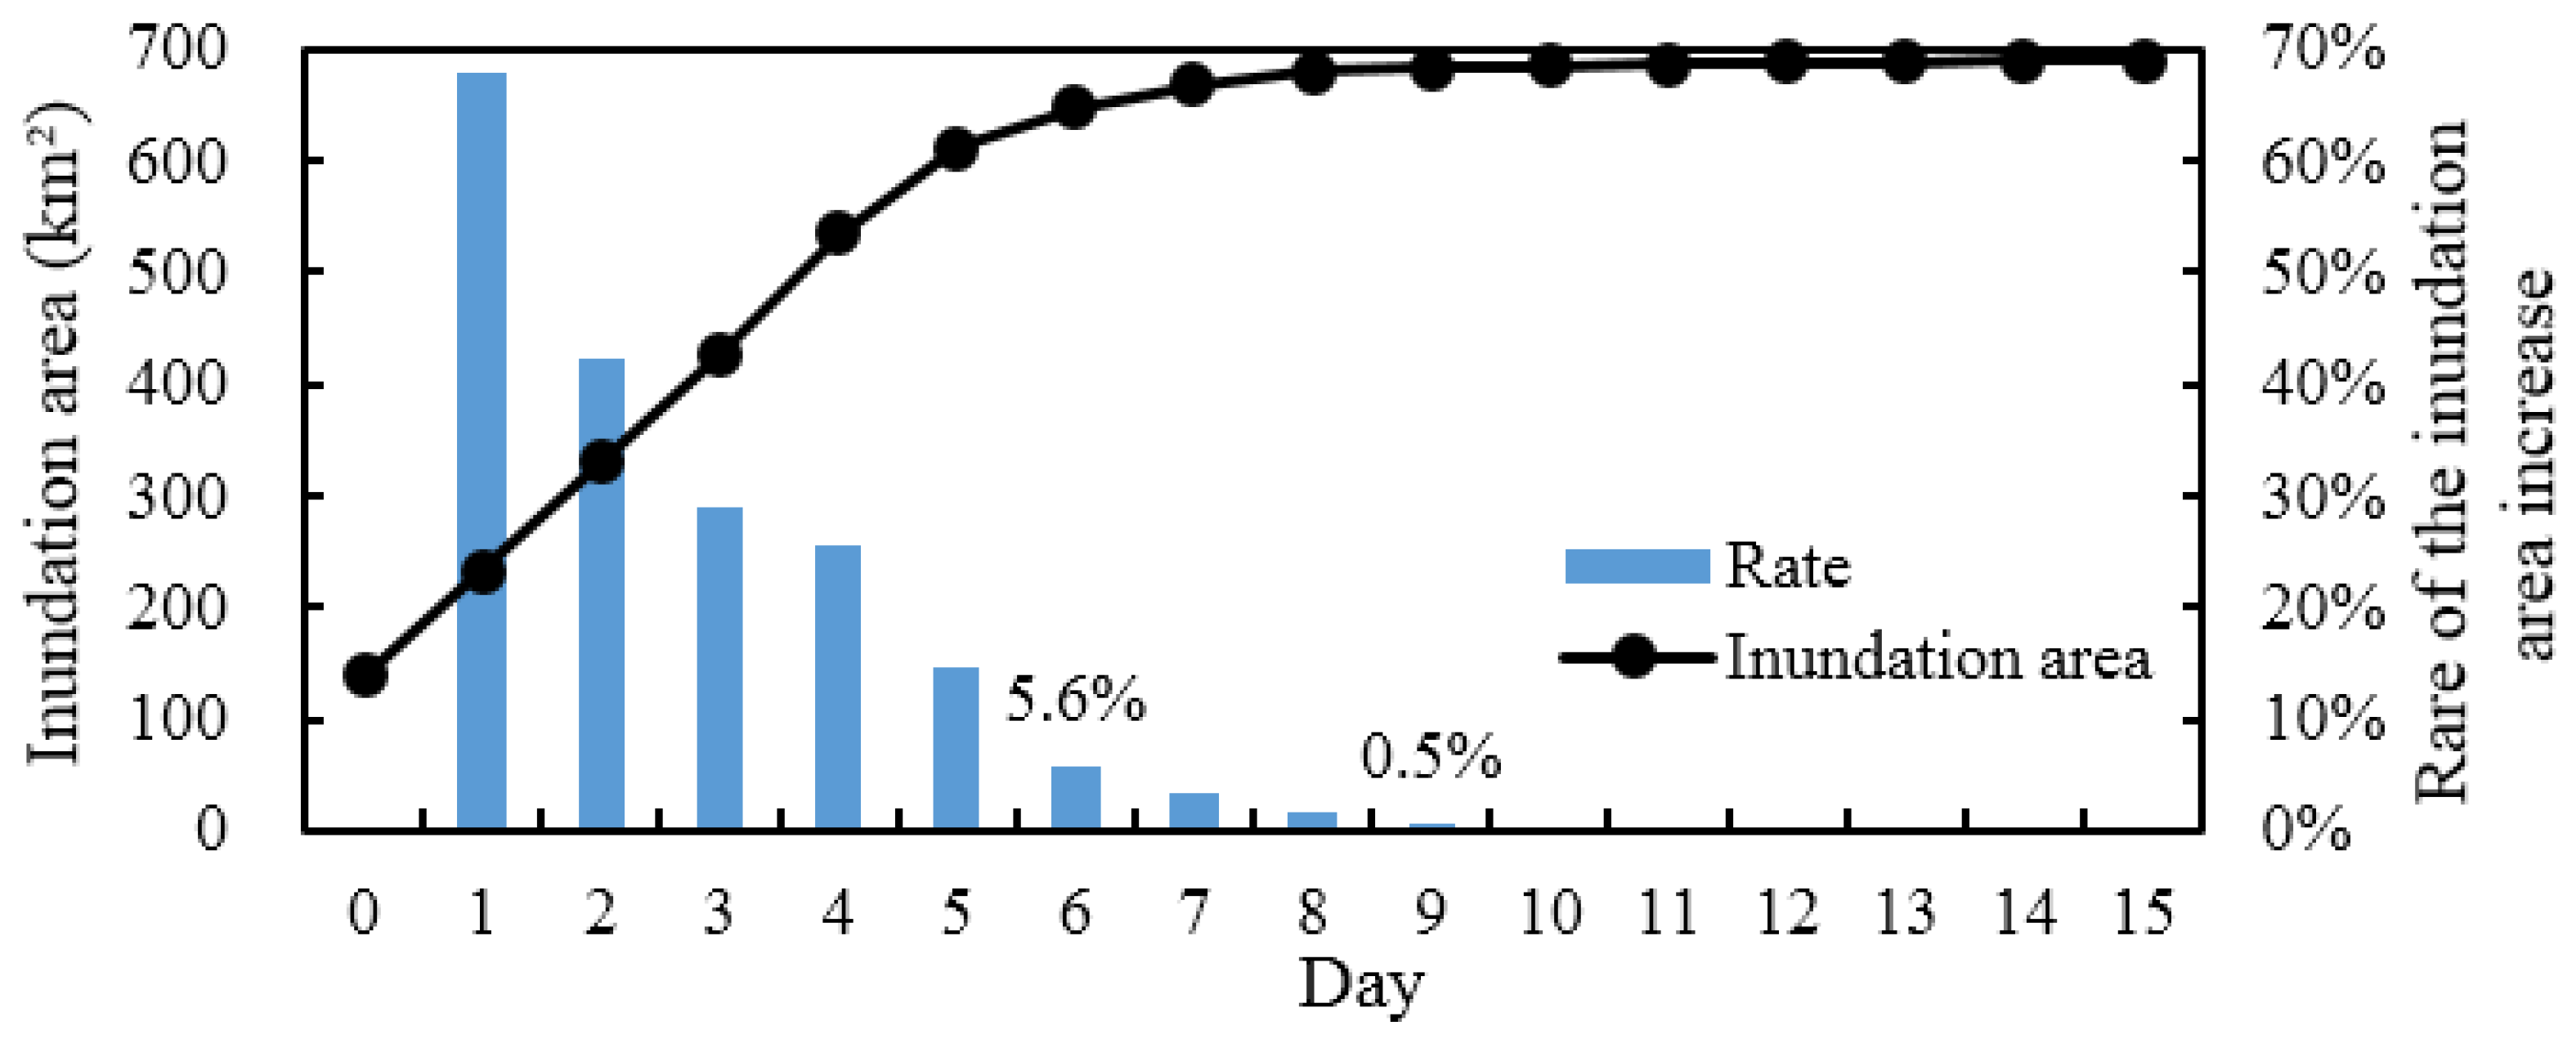
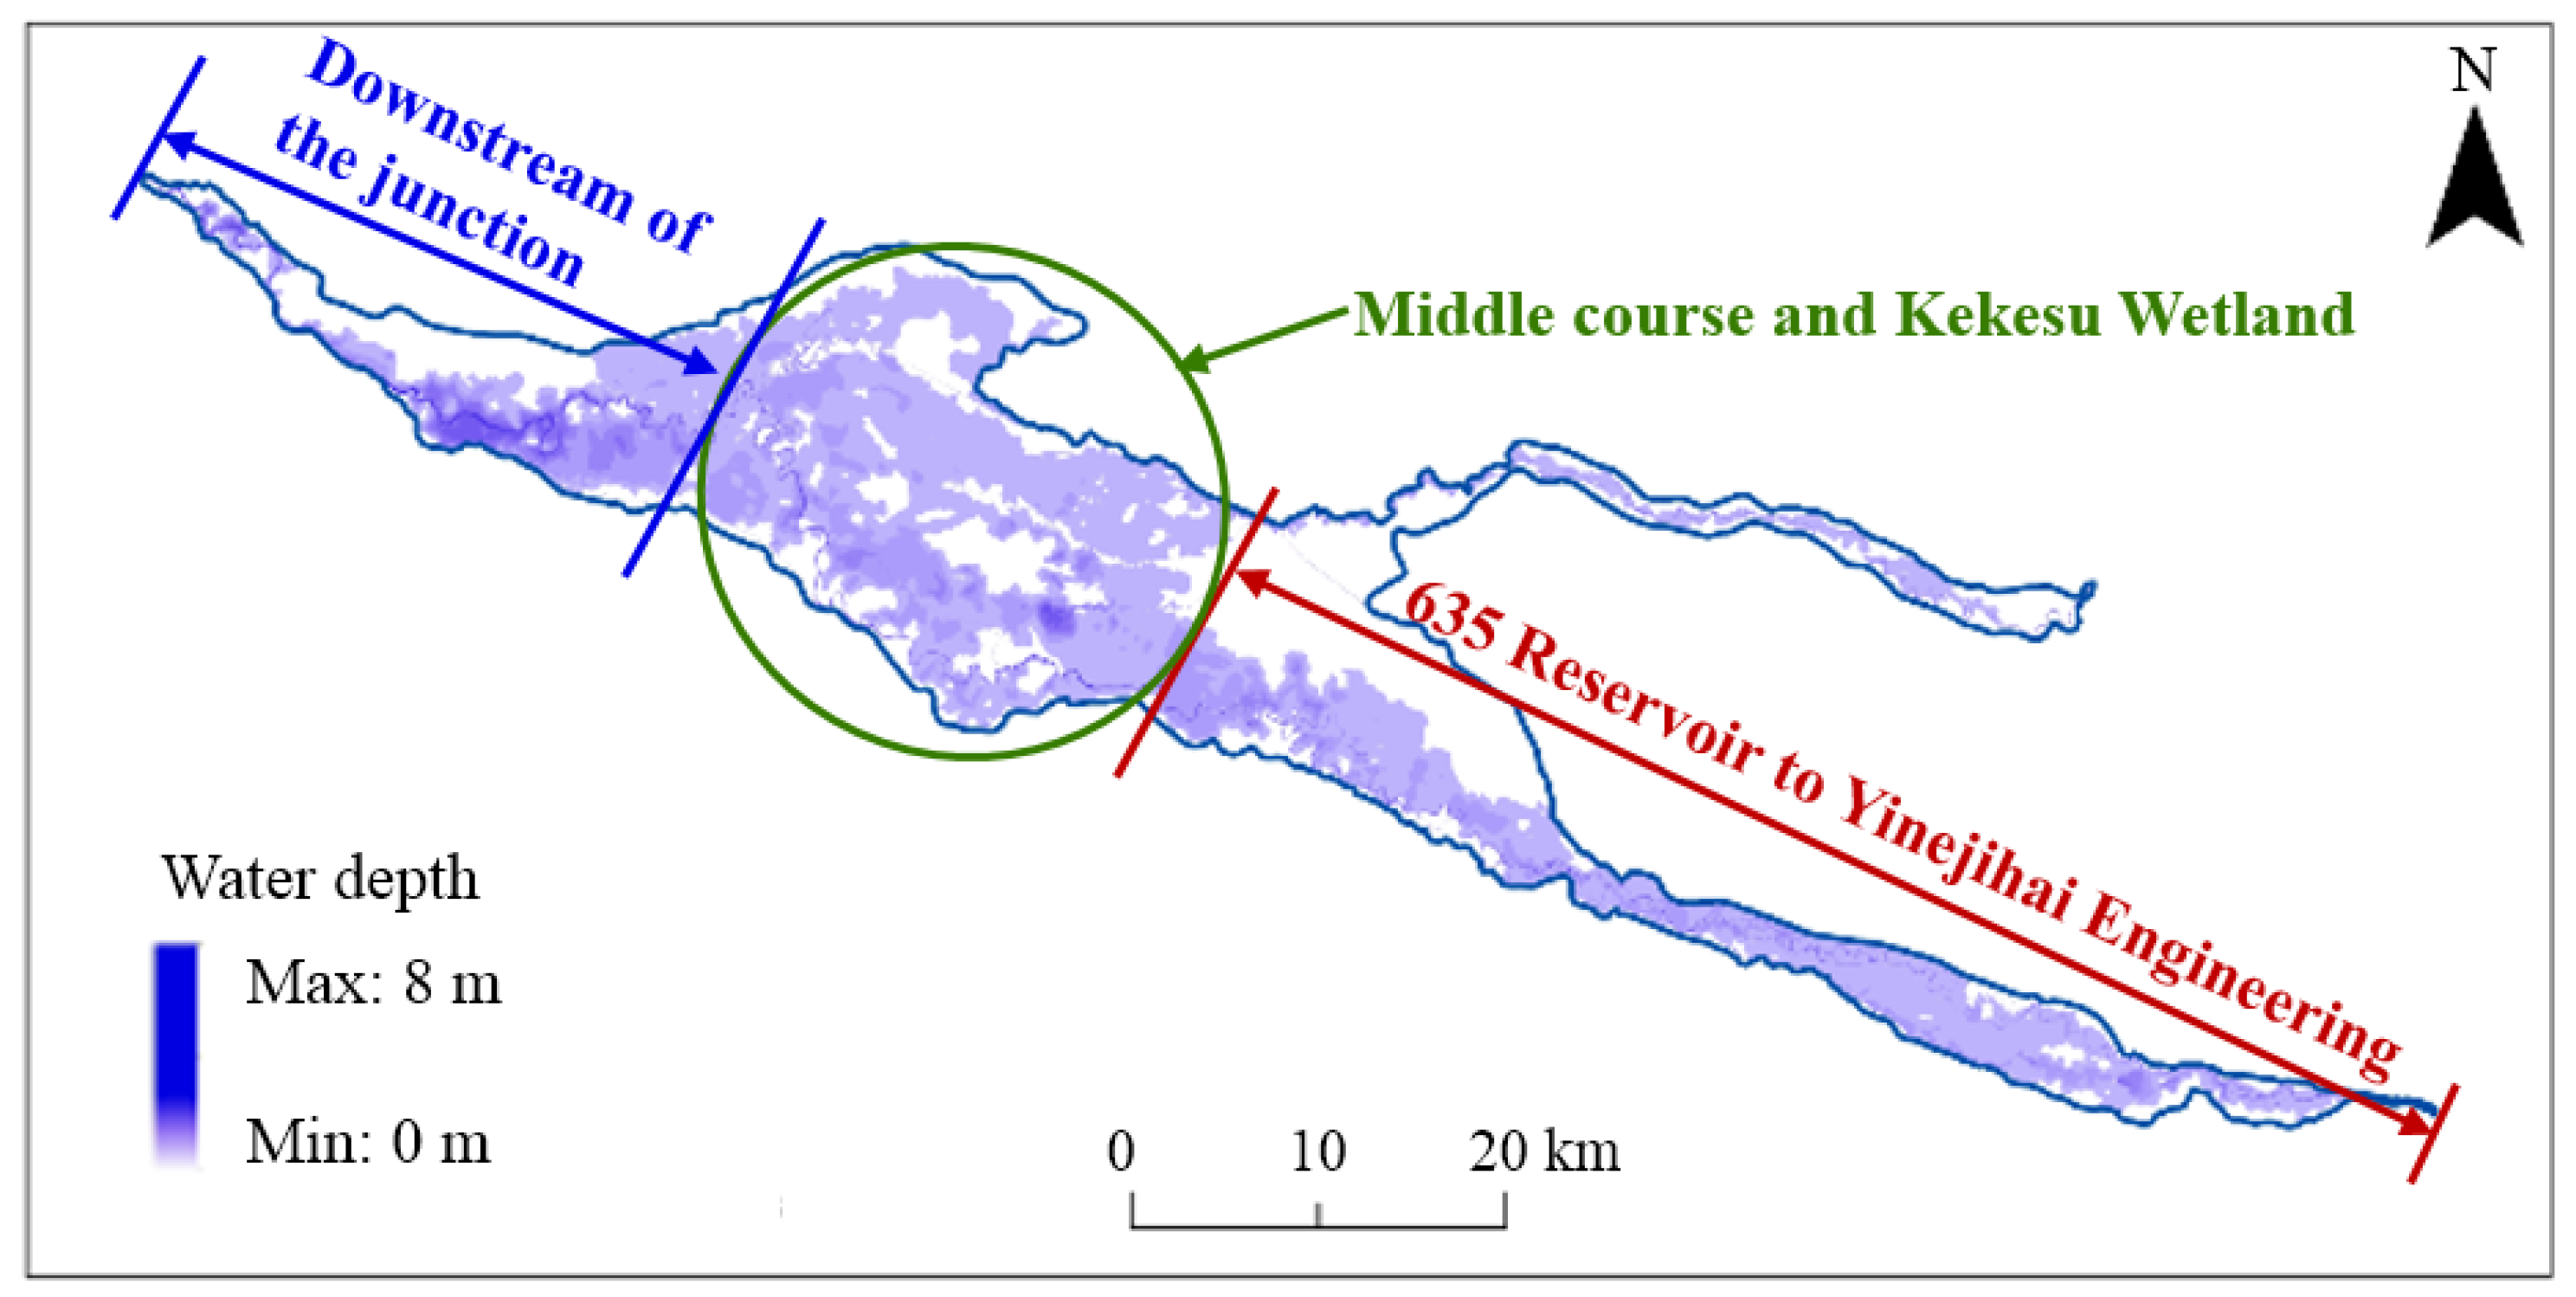
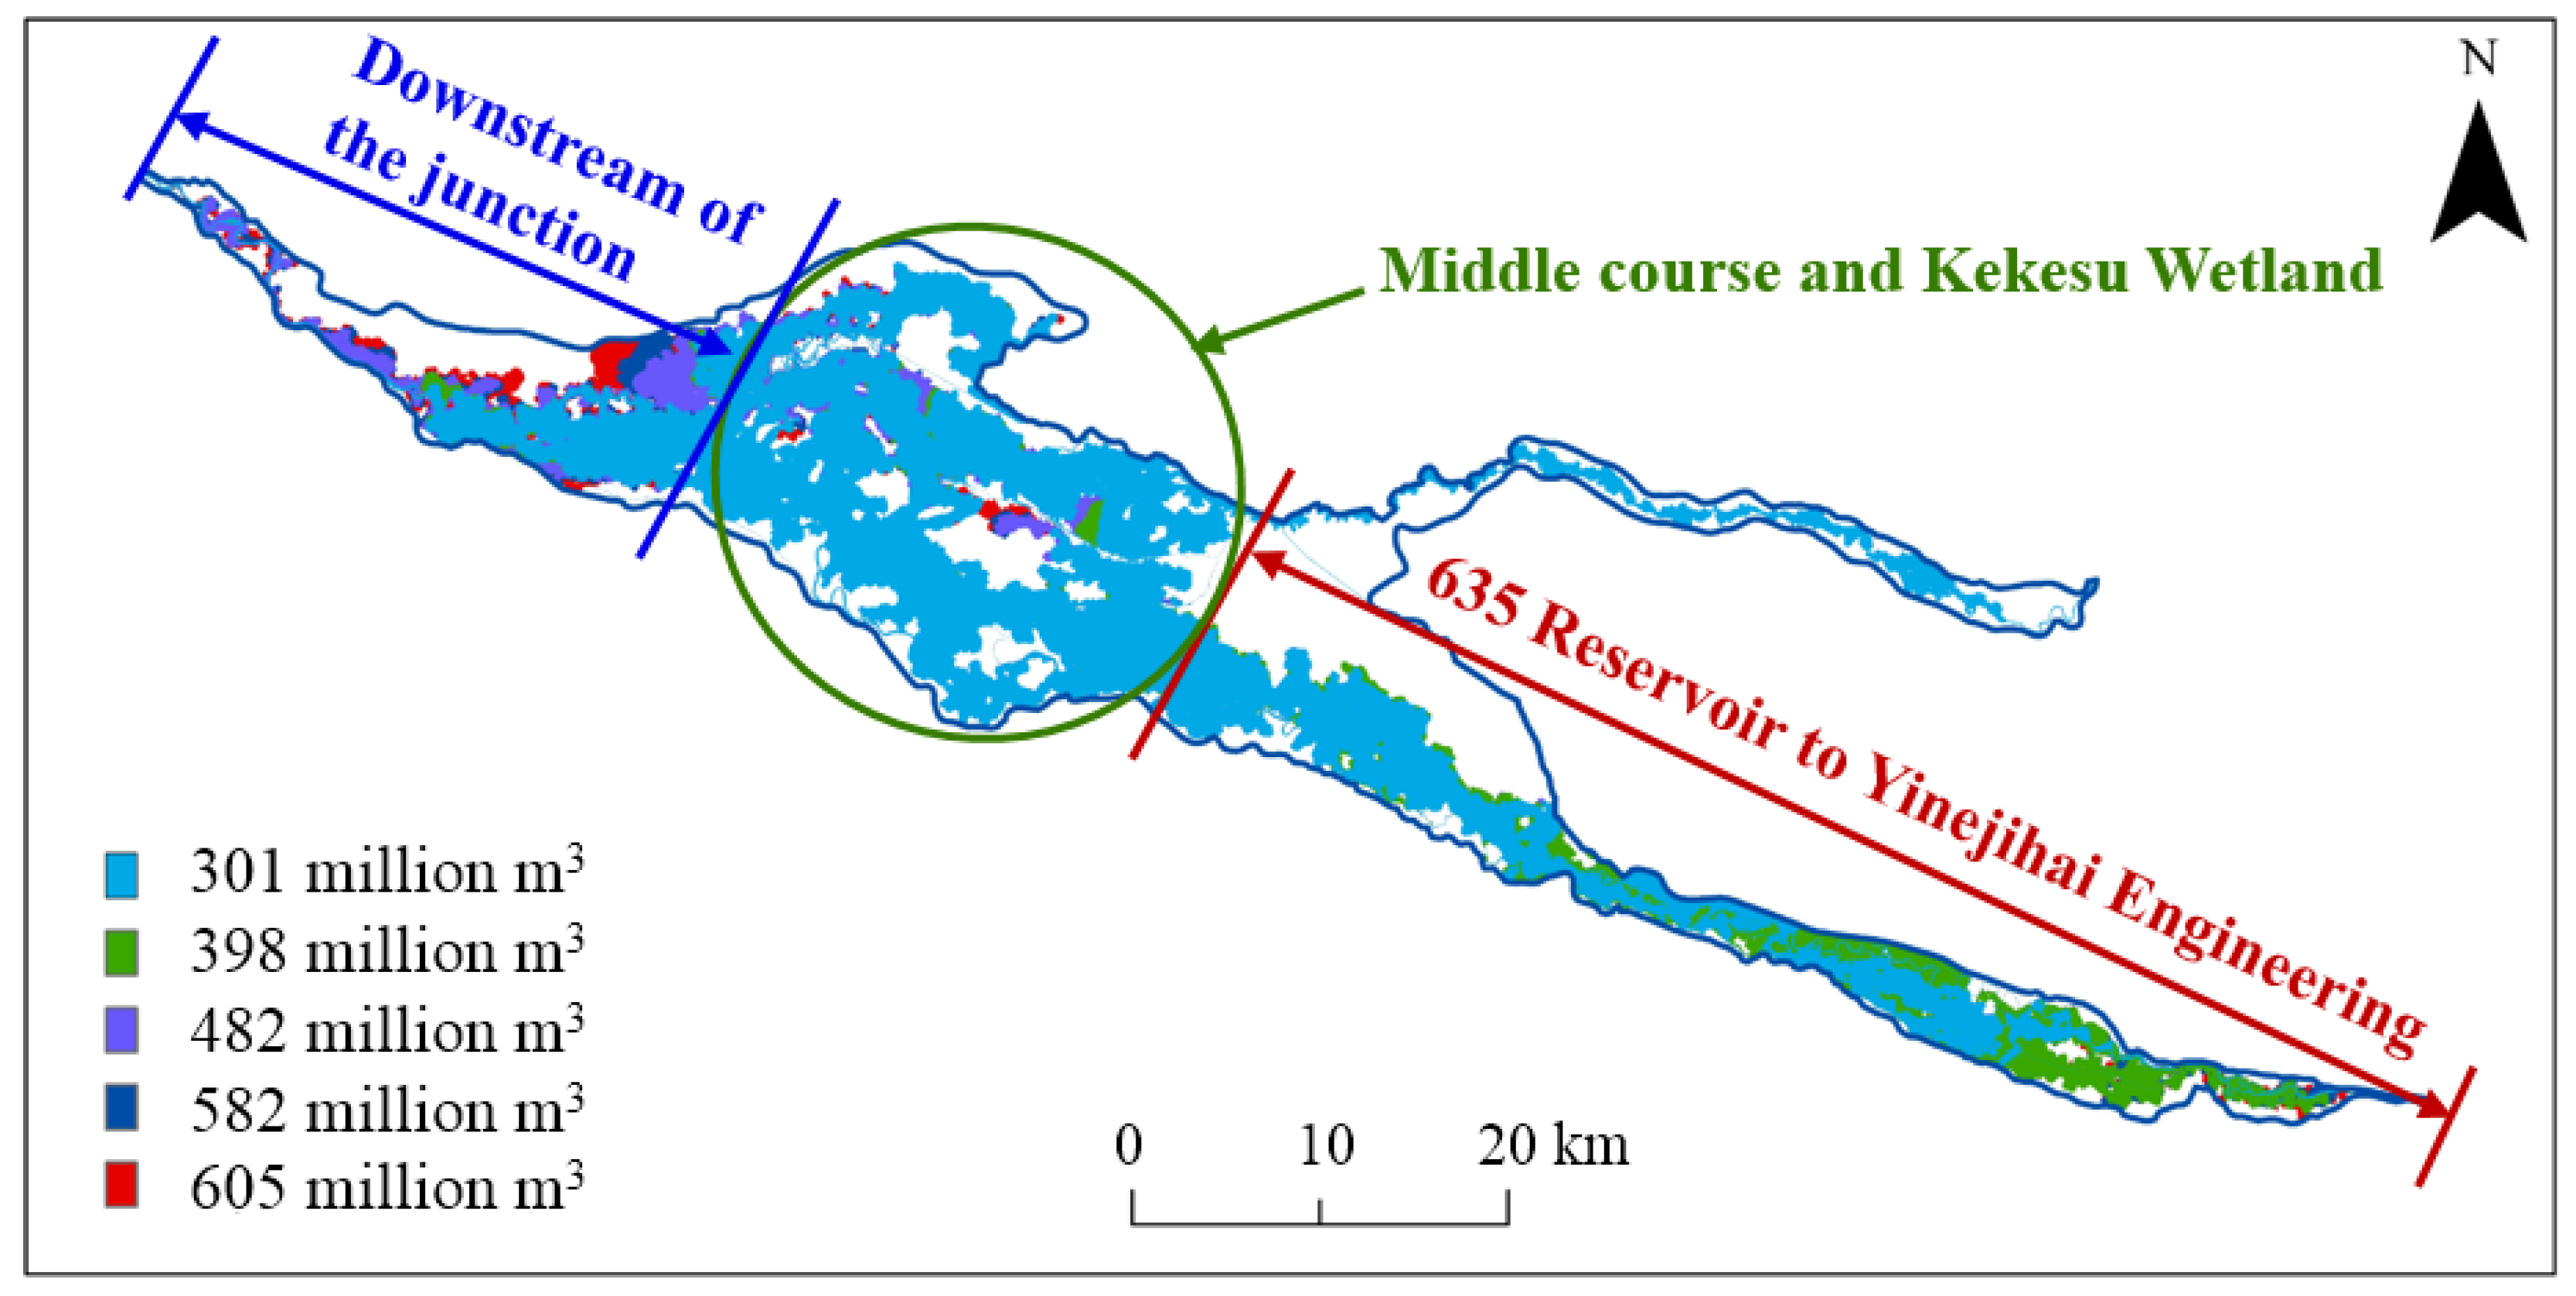
3.3.1. Inundation Area and Range
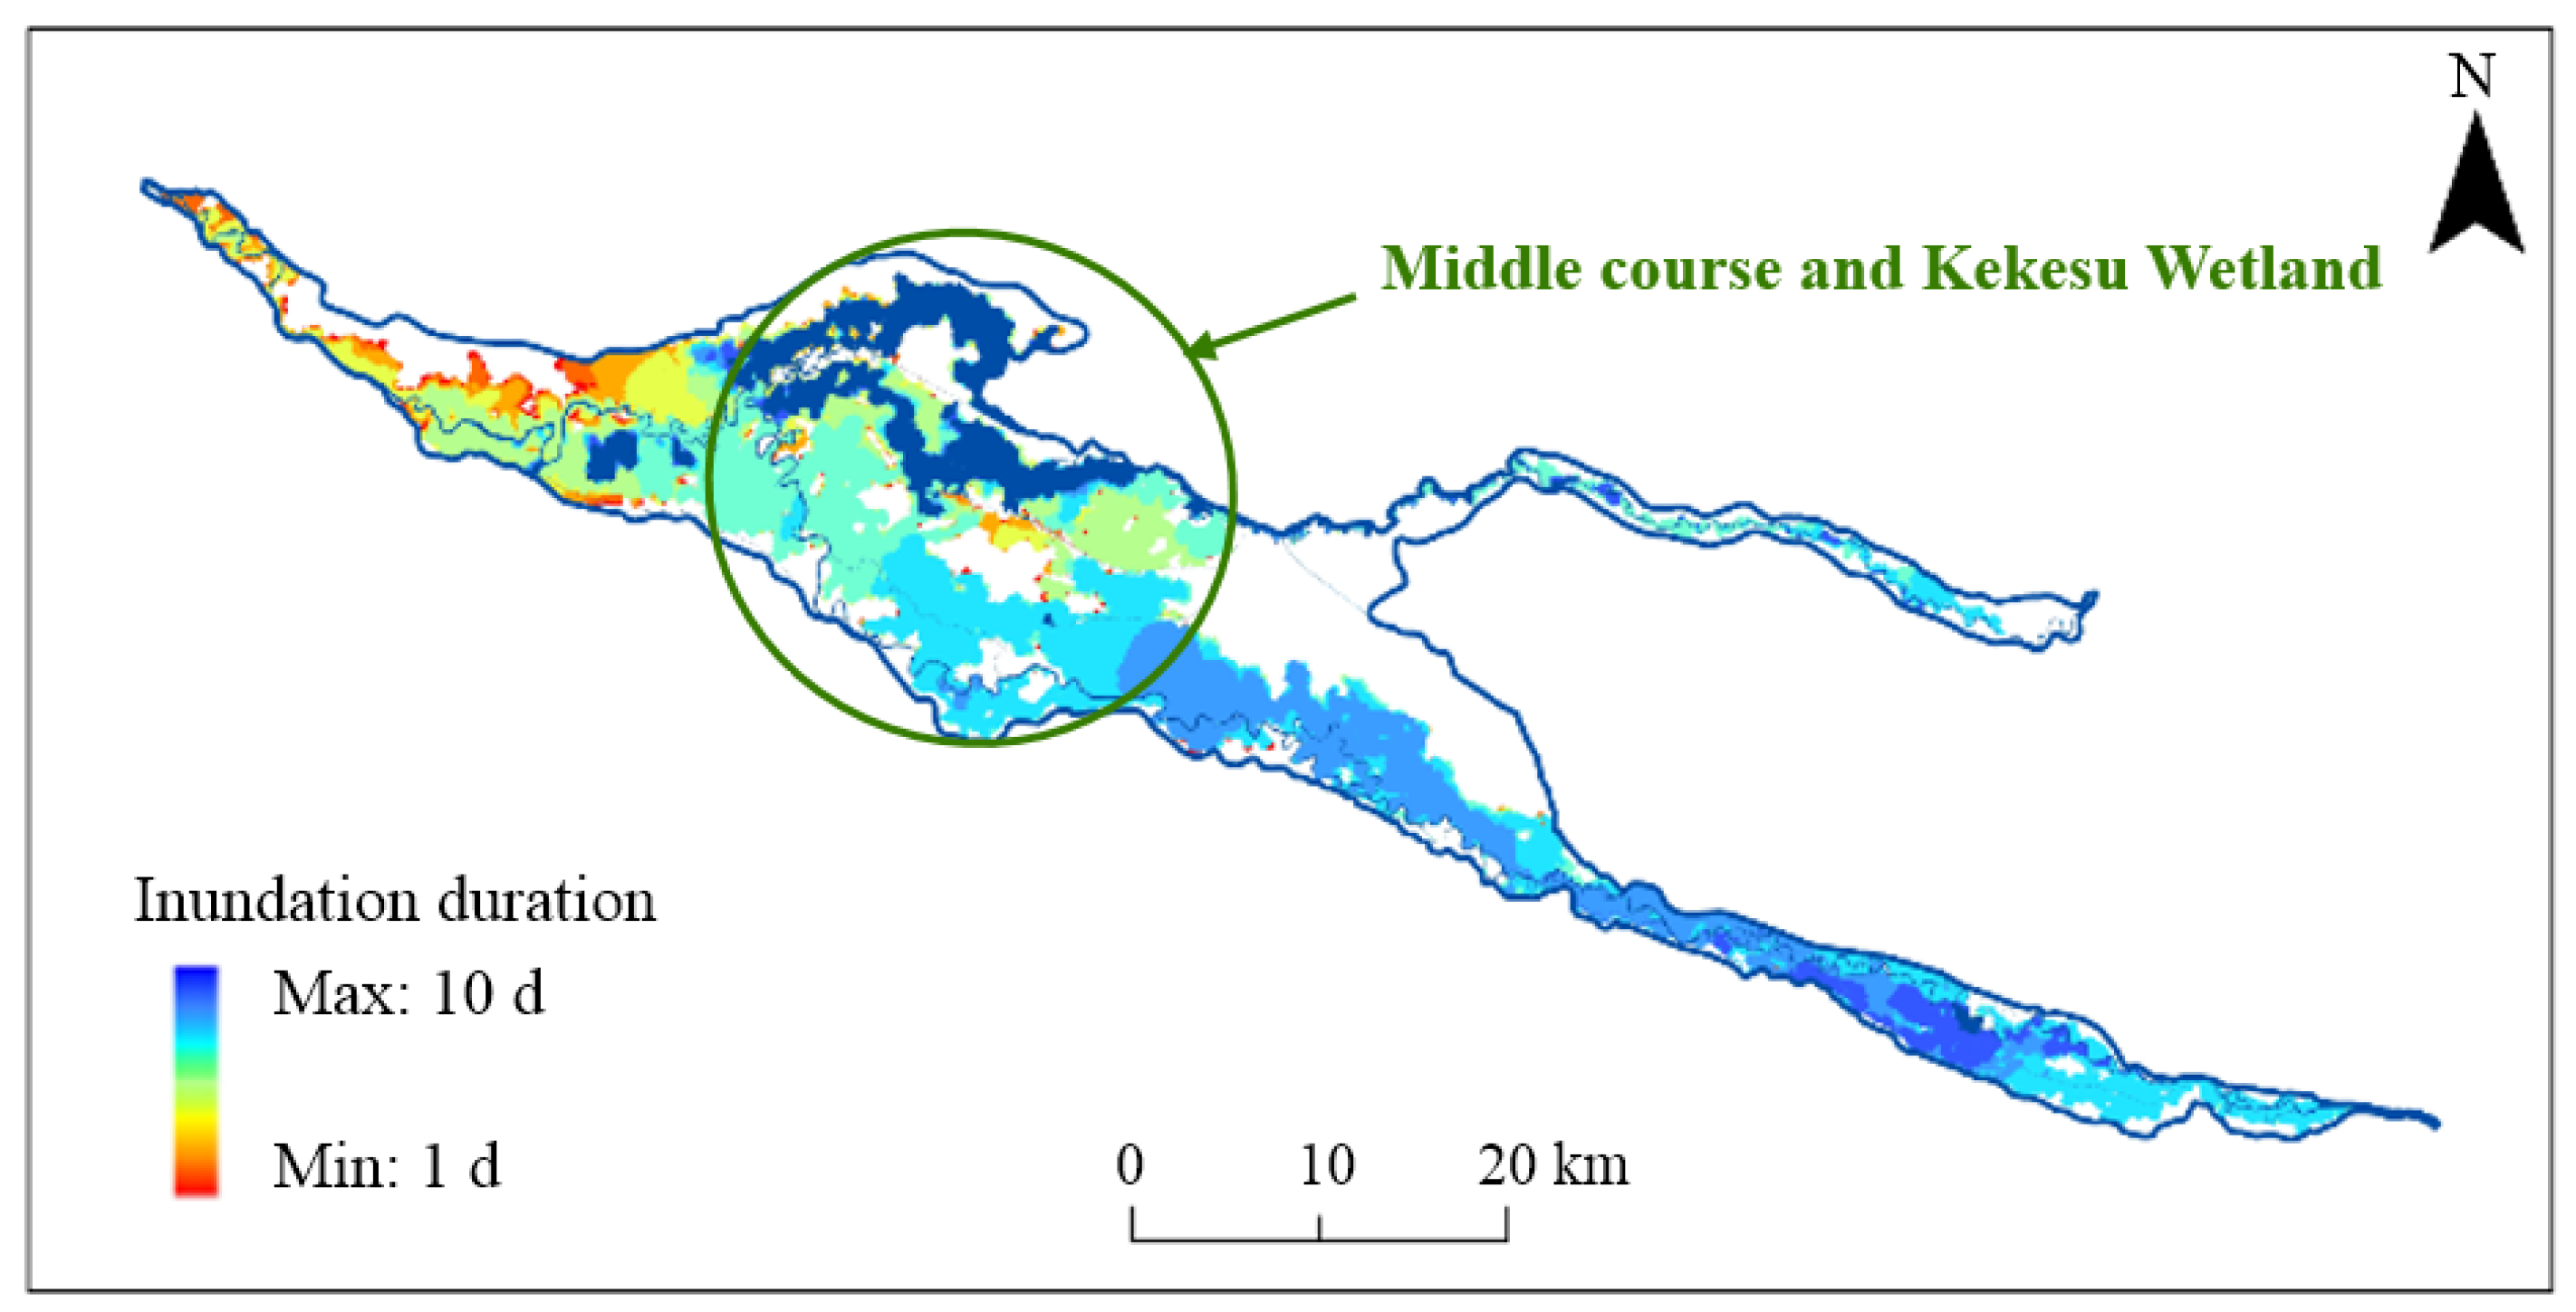
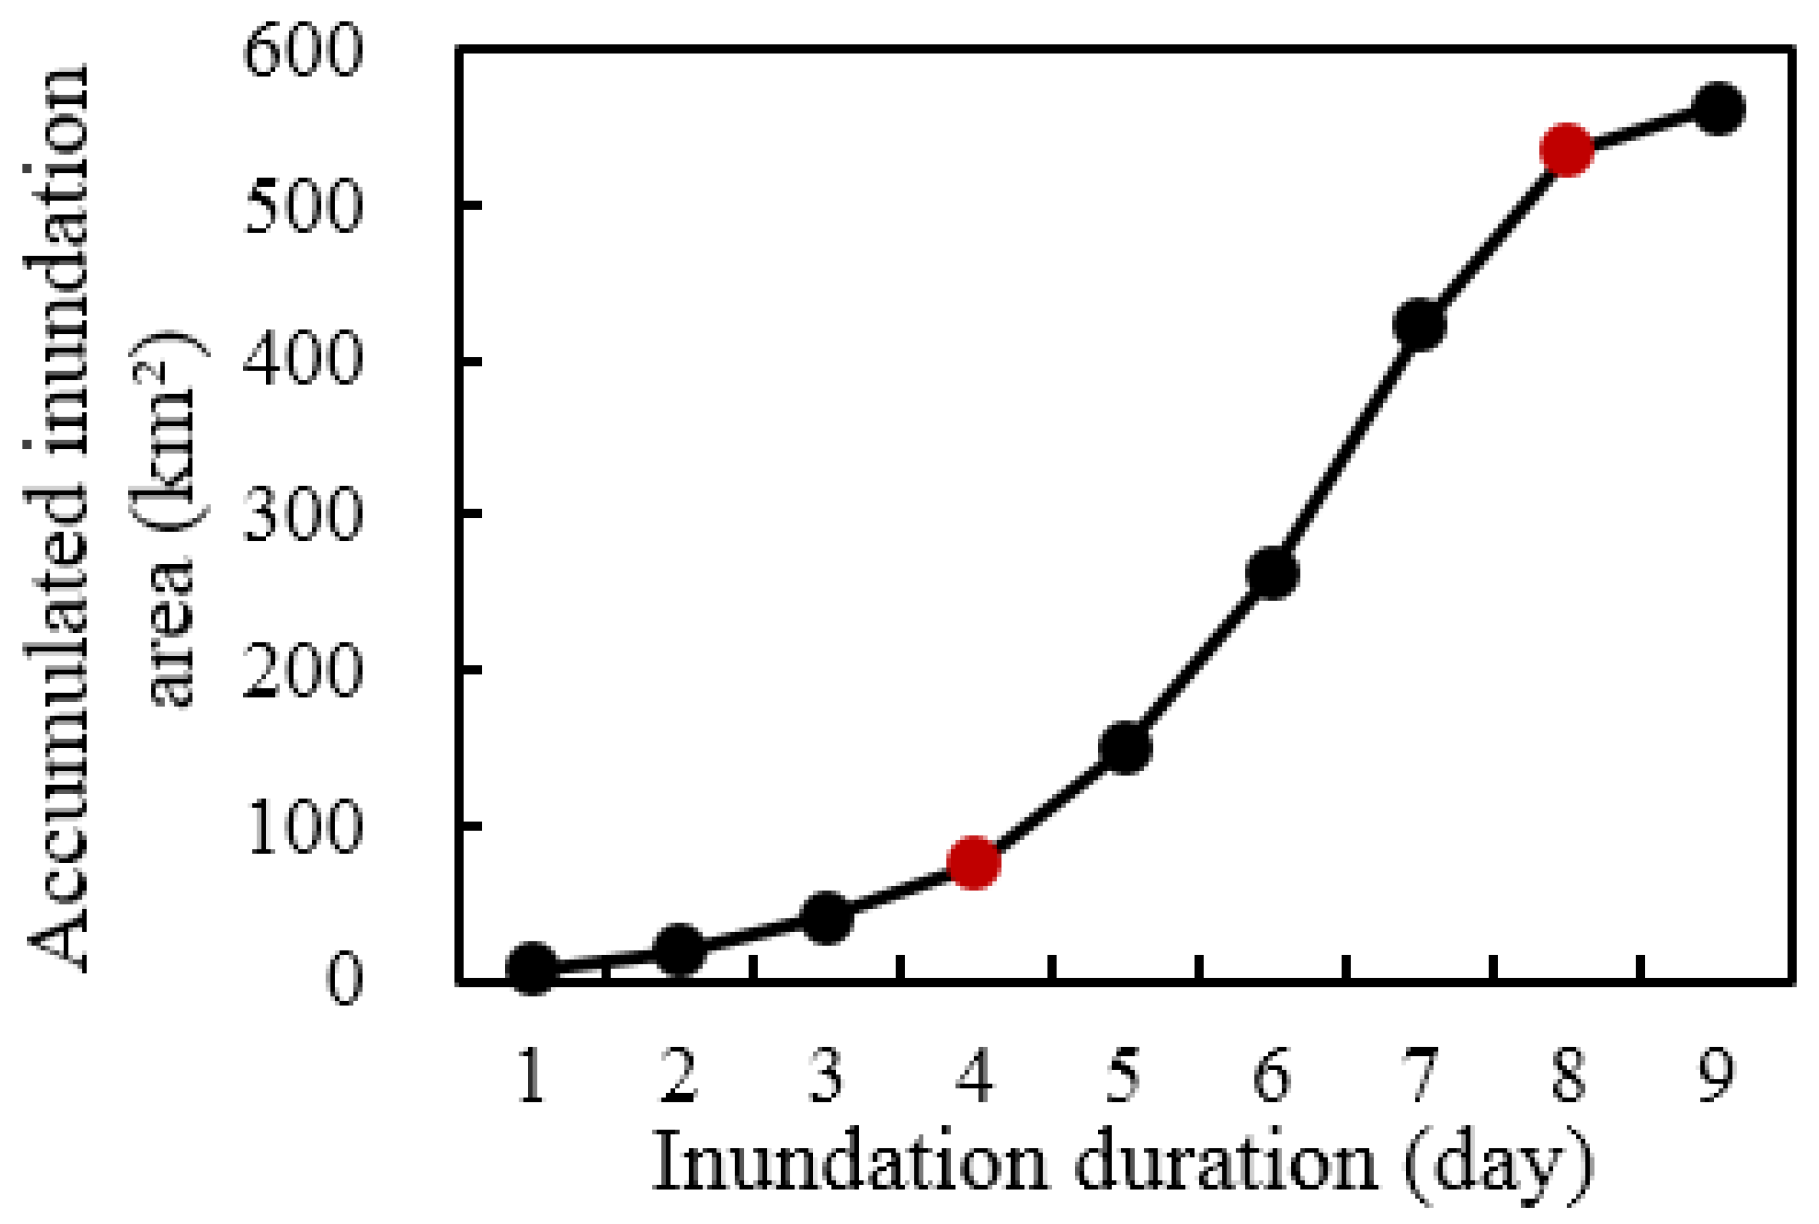
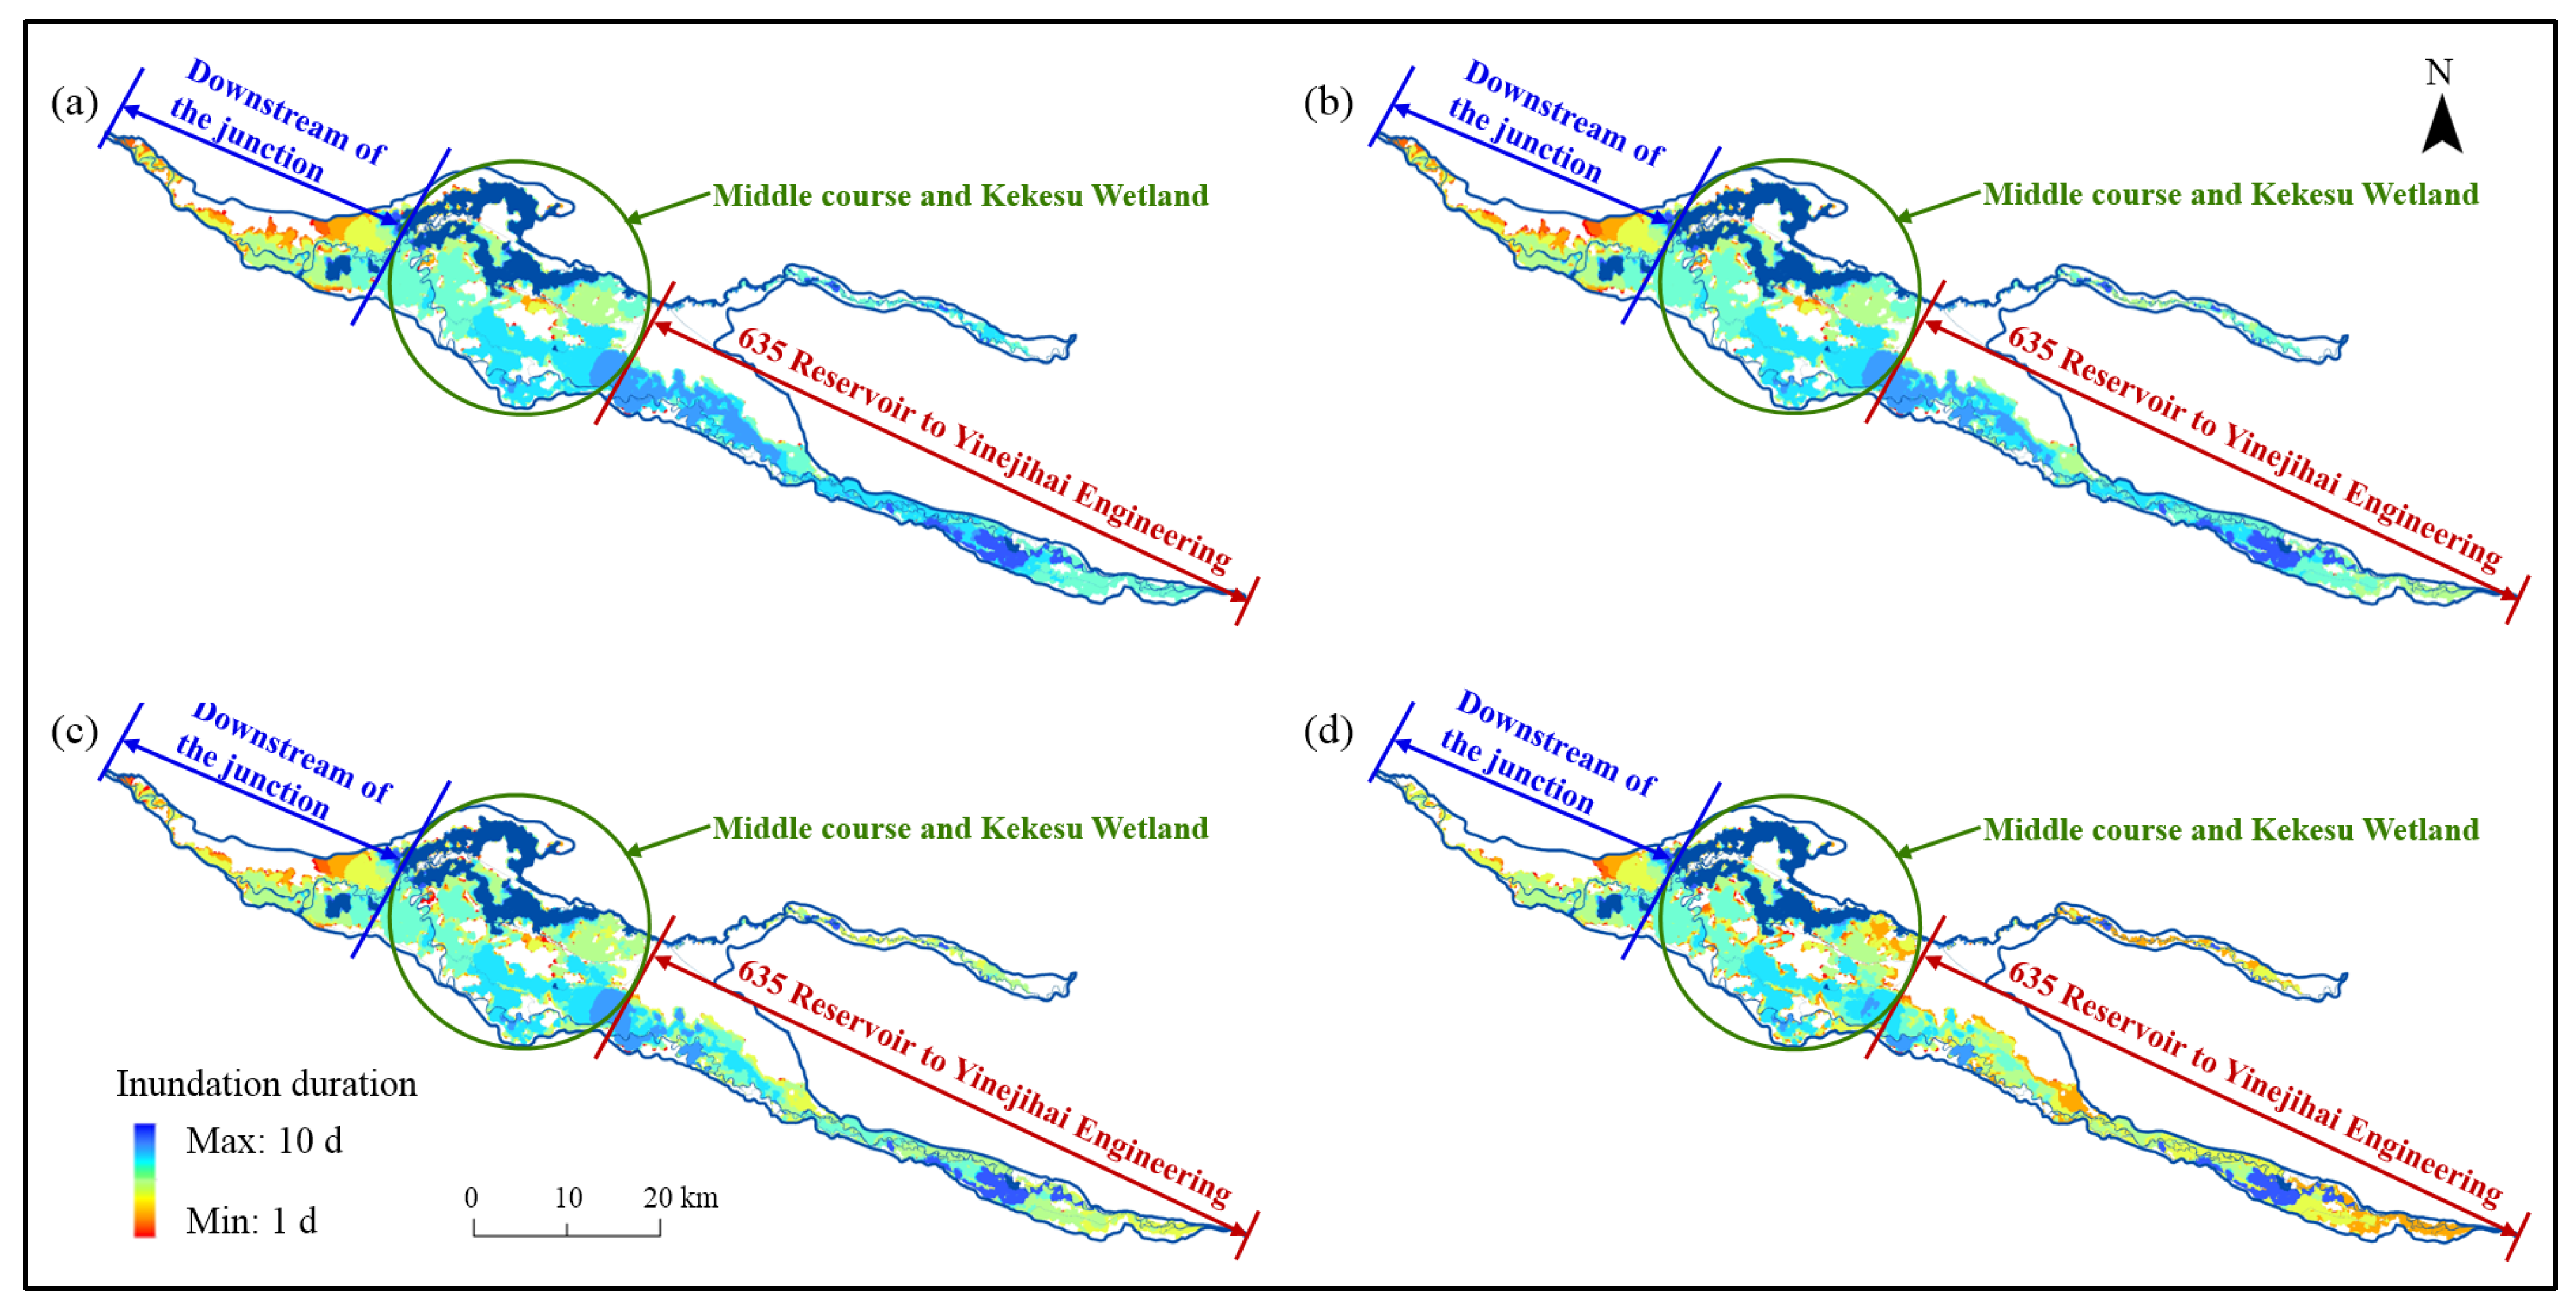
3.3.2. Distribution of the Inundation Duration
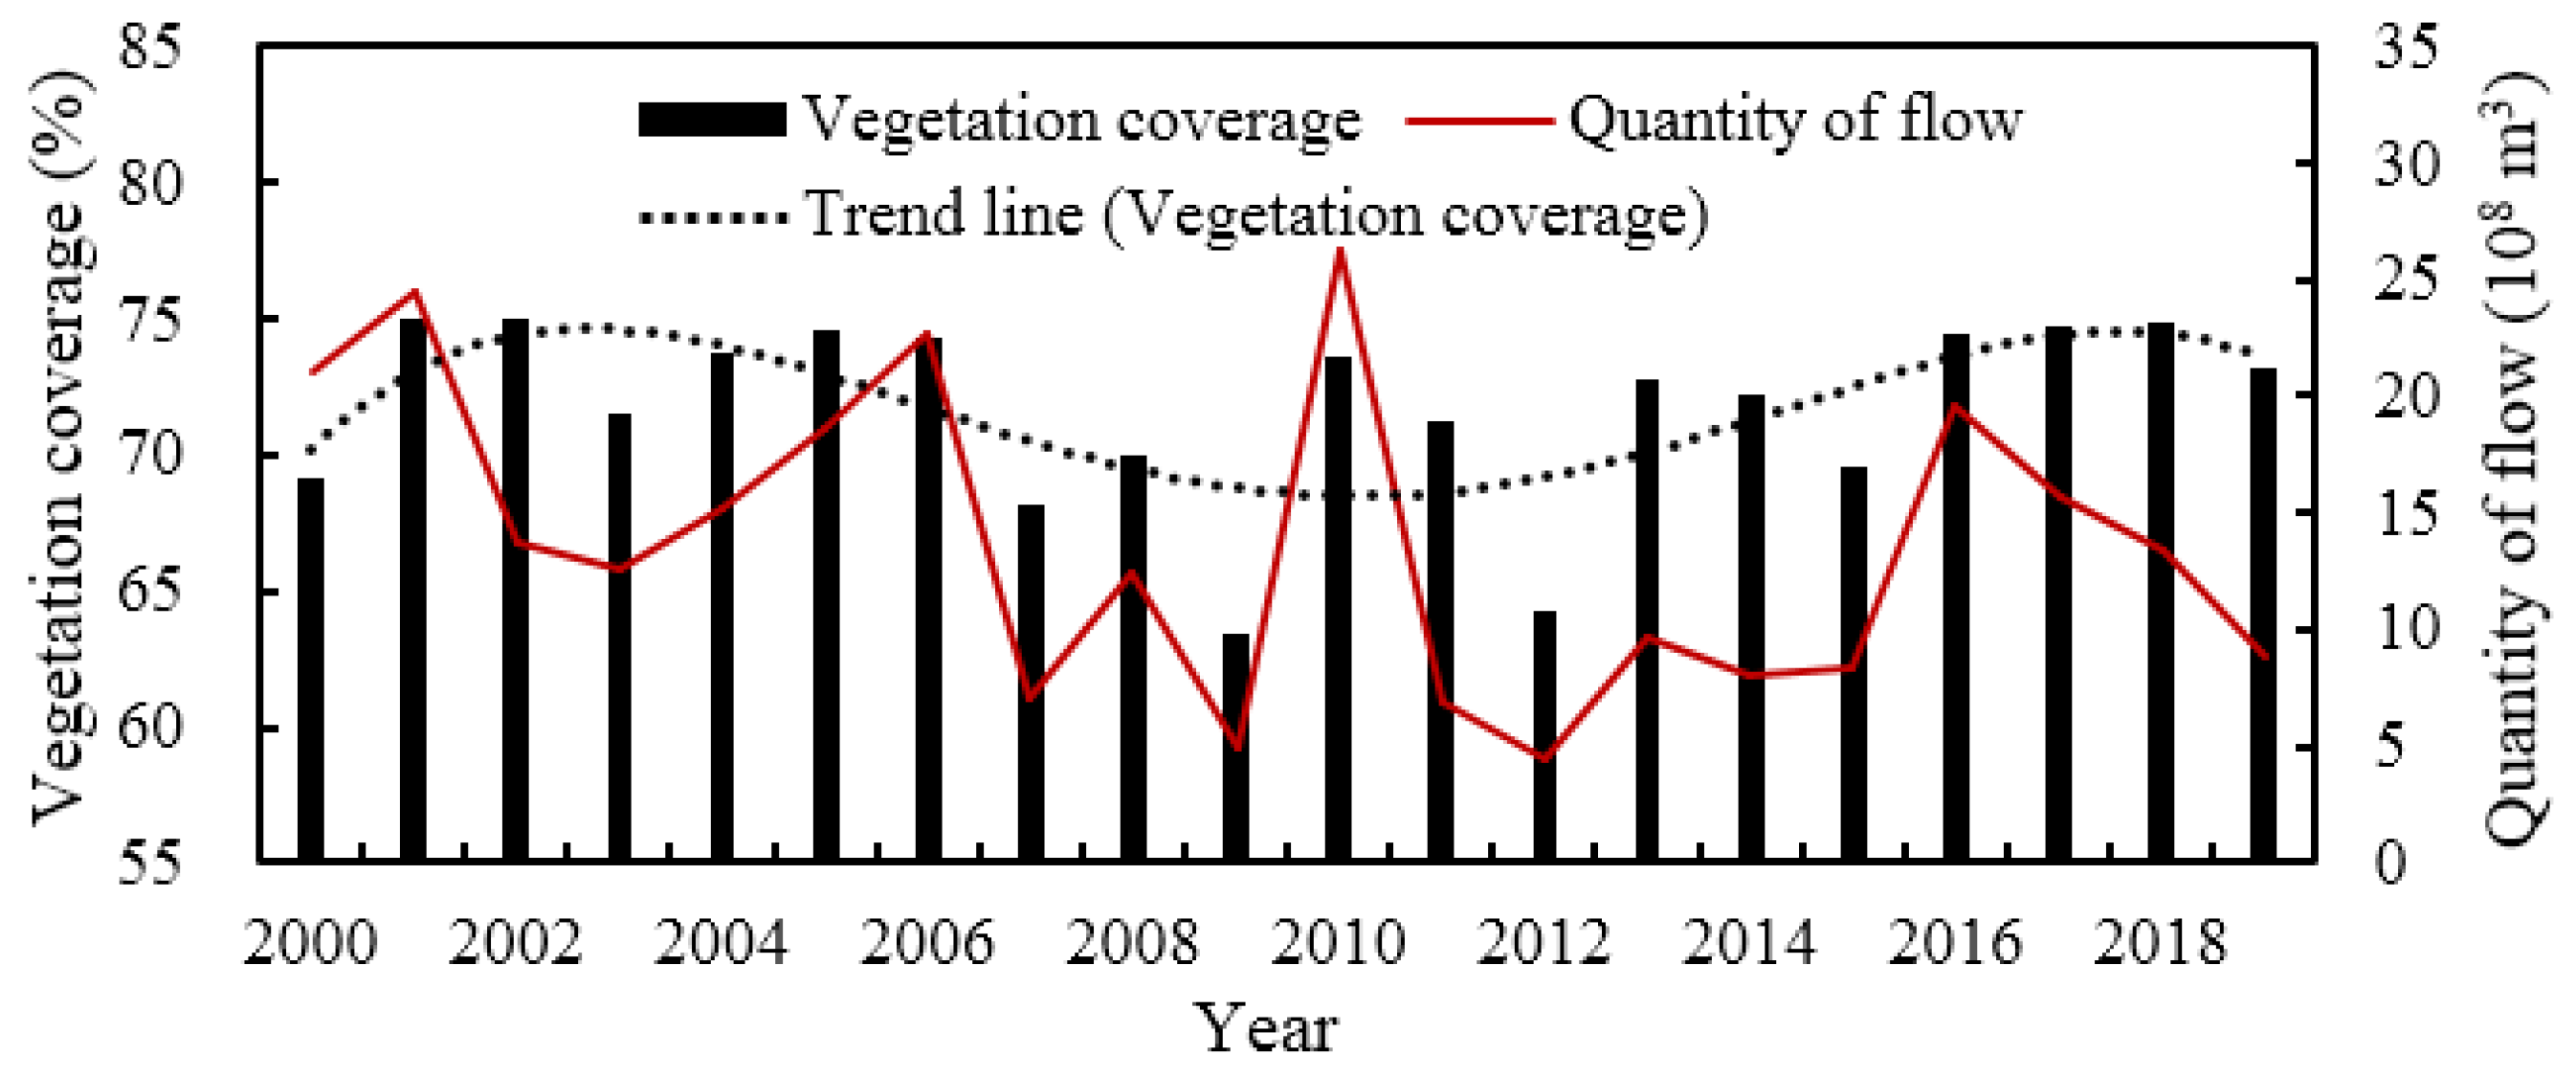
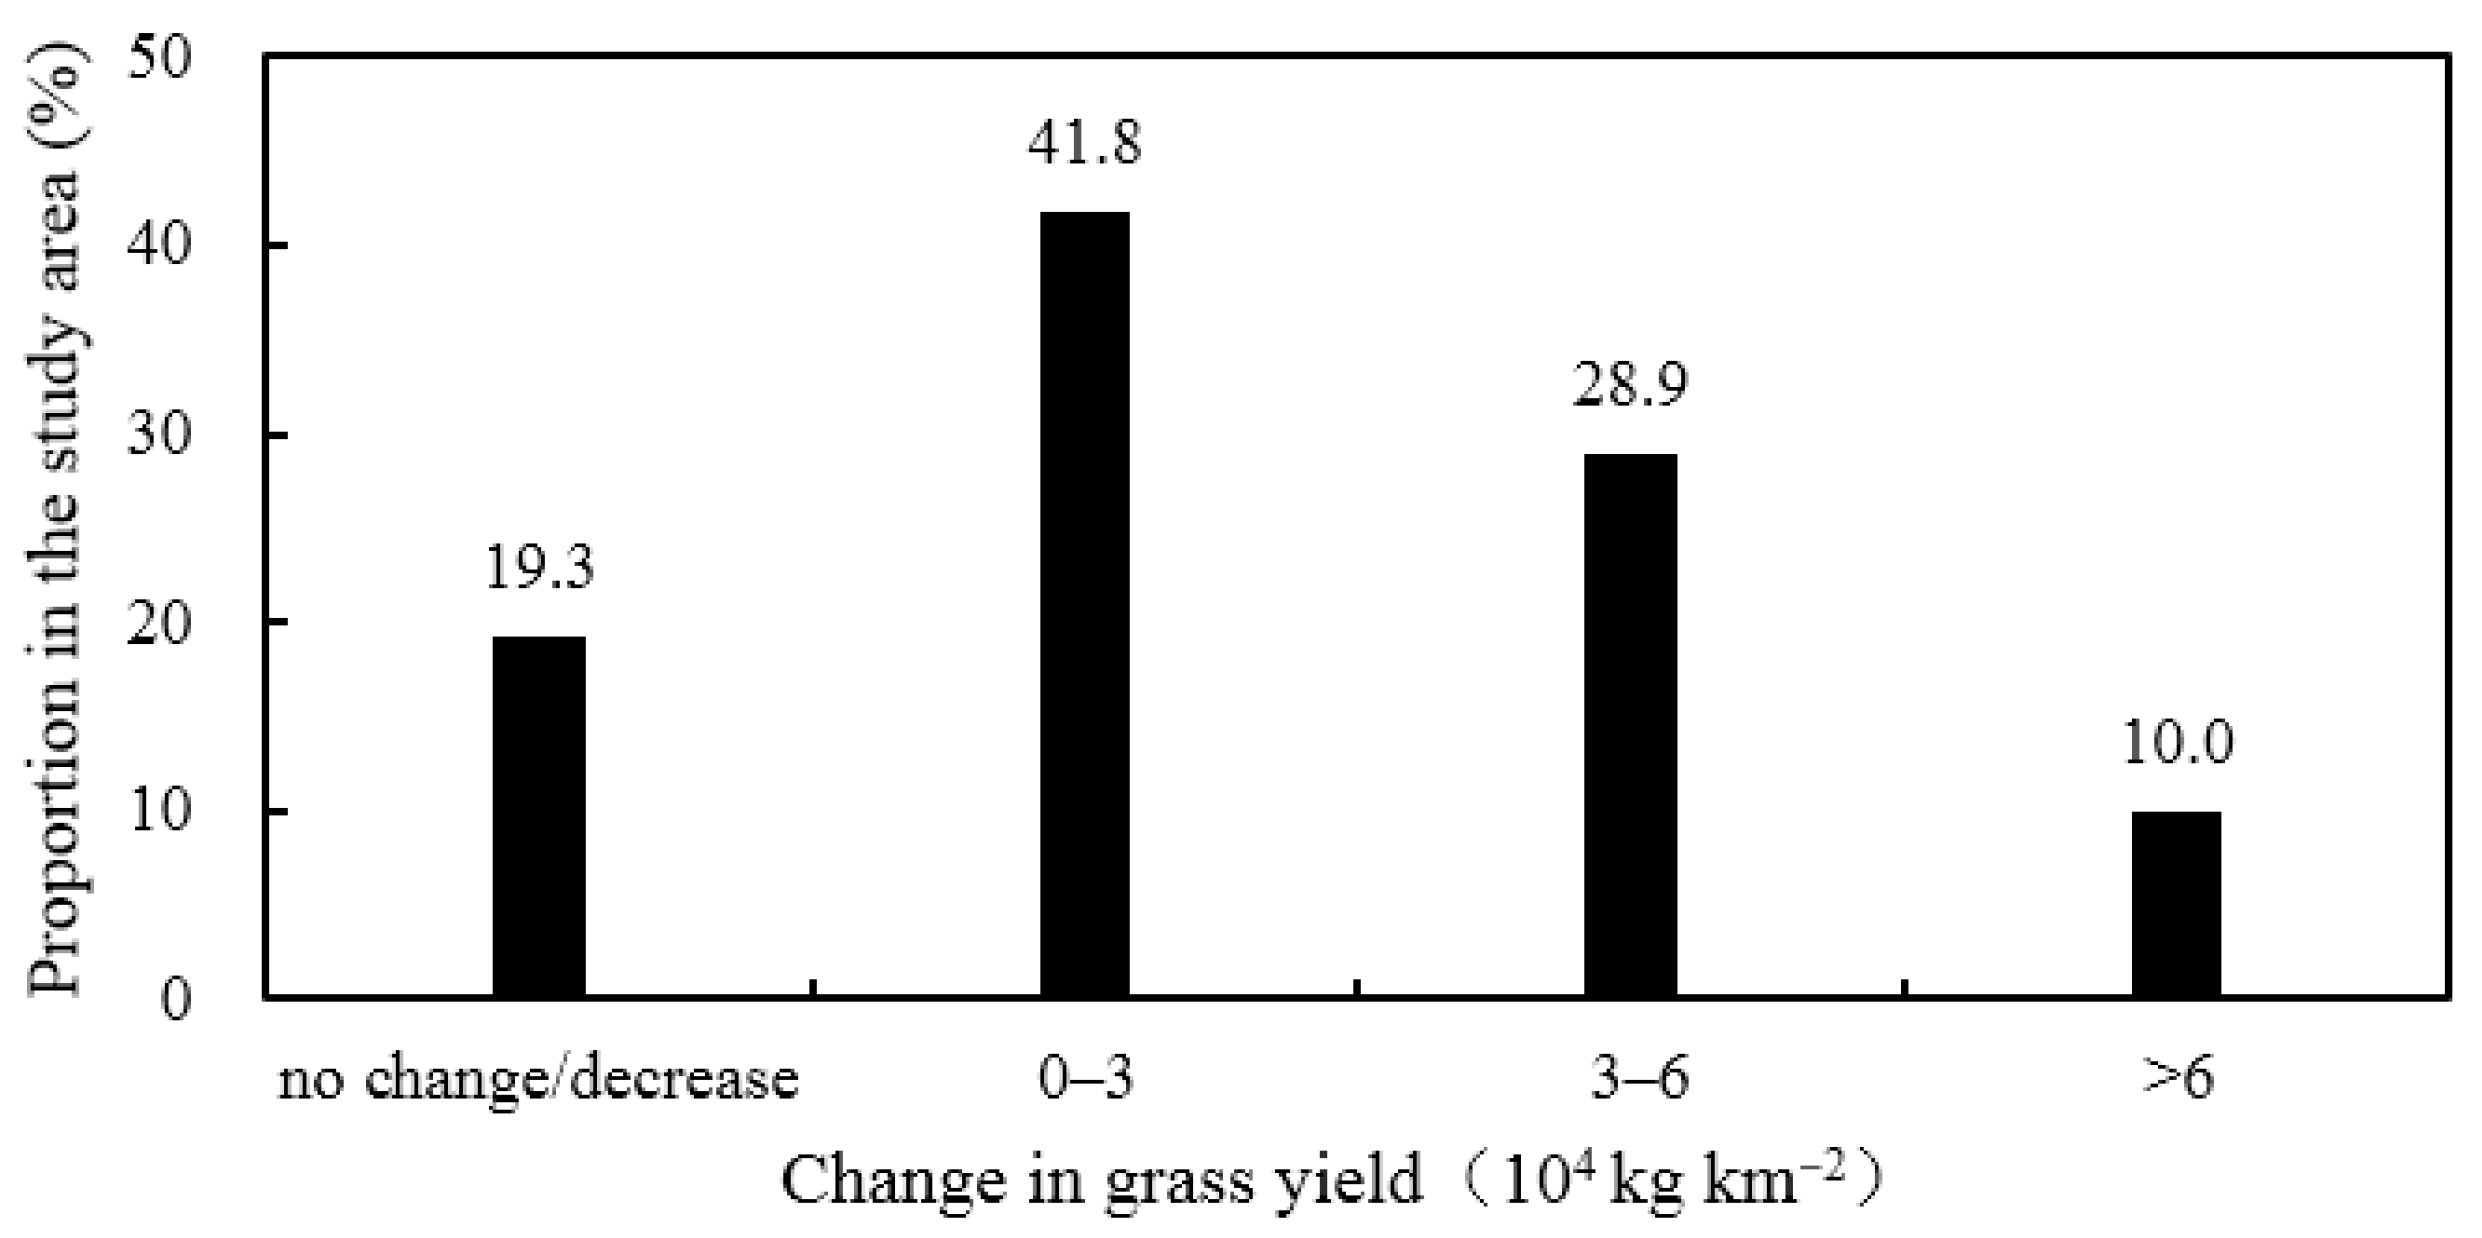
3.3.3. Variation in the Vegetation Coverage
3.4. Impacts of Insufficient Ecological Water Supply on Ecological Regulation
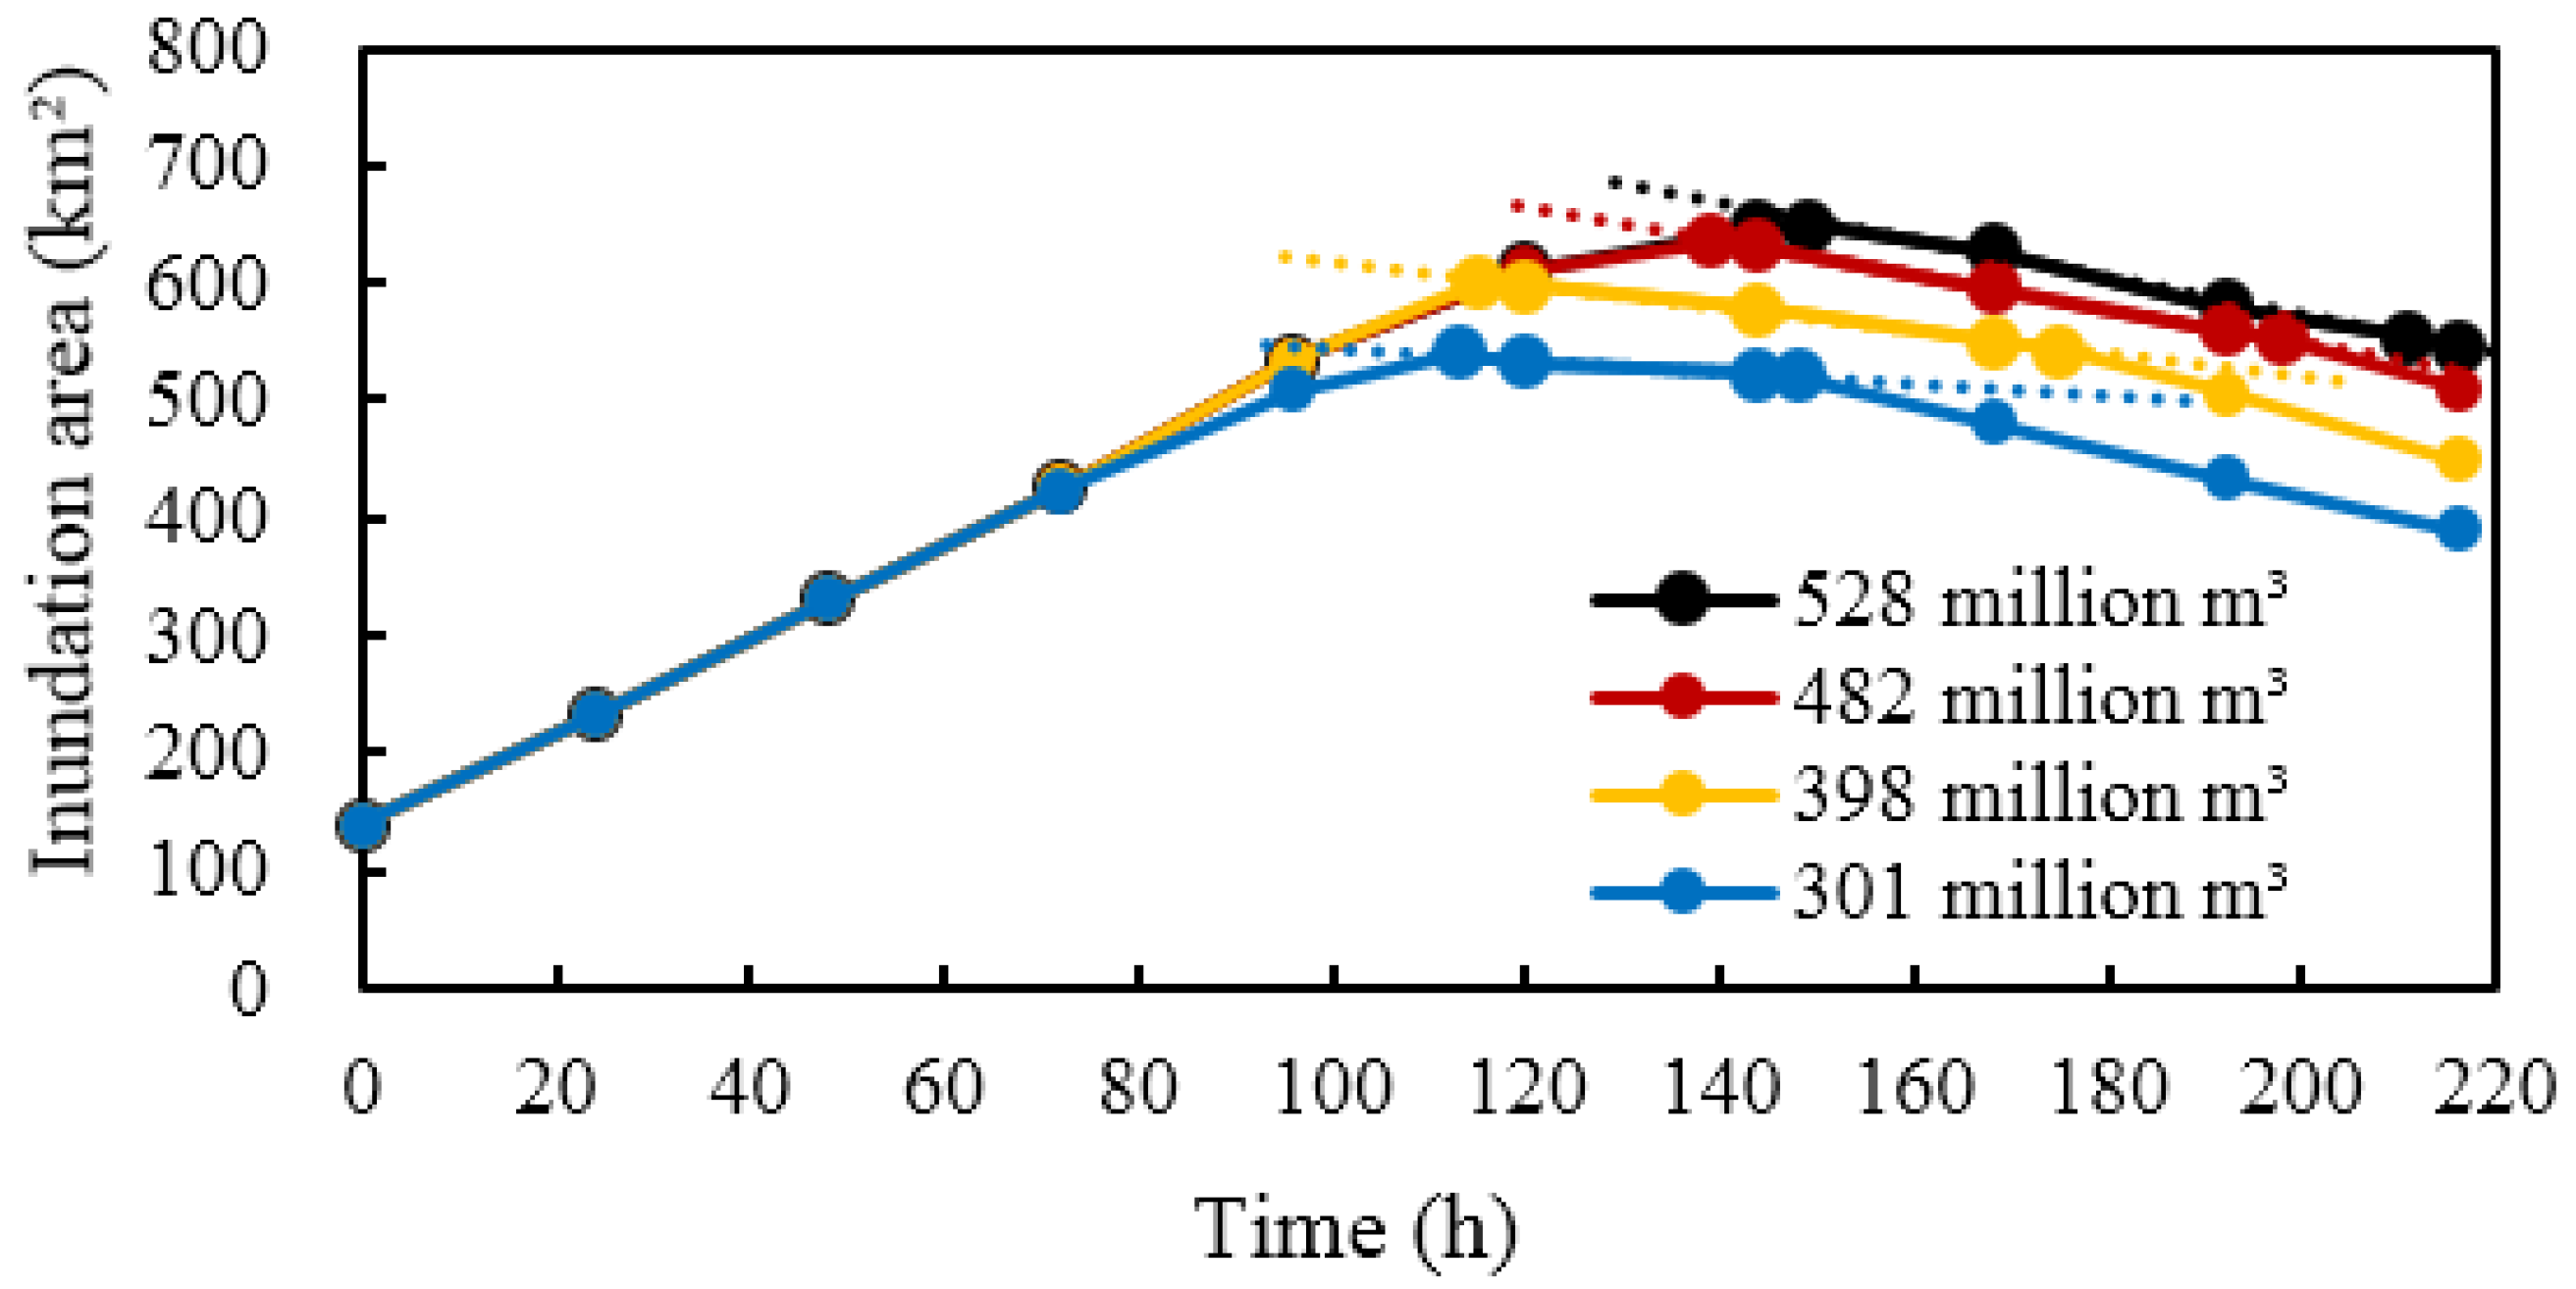
3.4.1. Impacts on the Inundation Area and Range
3.4.2. Impacts on the Inundation Duration and Distribution
3.5. Ecological Regulation Optimization Measures Based on the Ecological Sluices
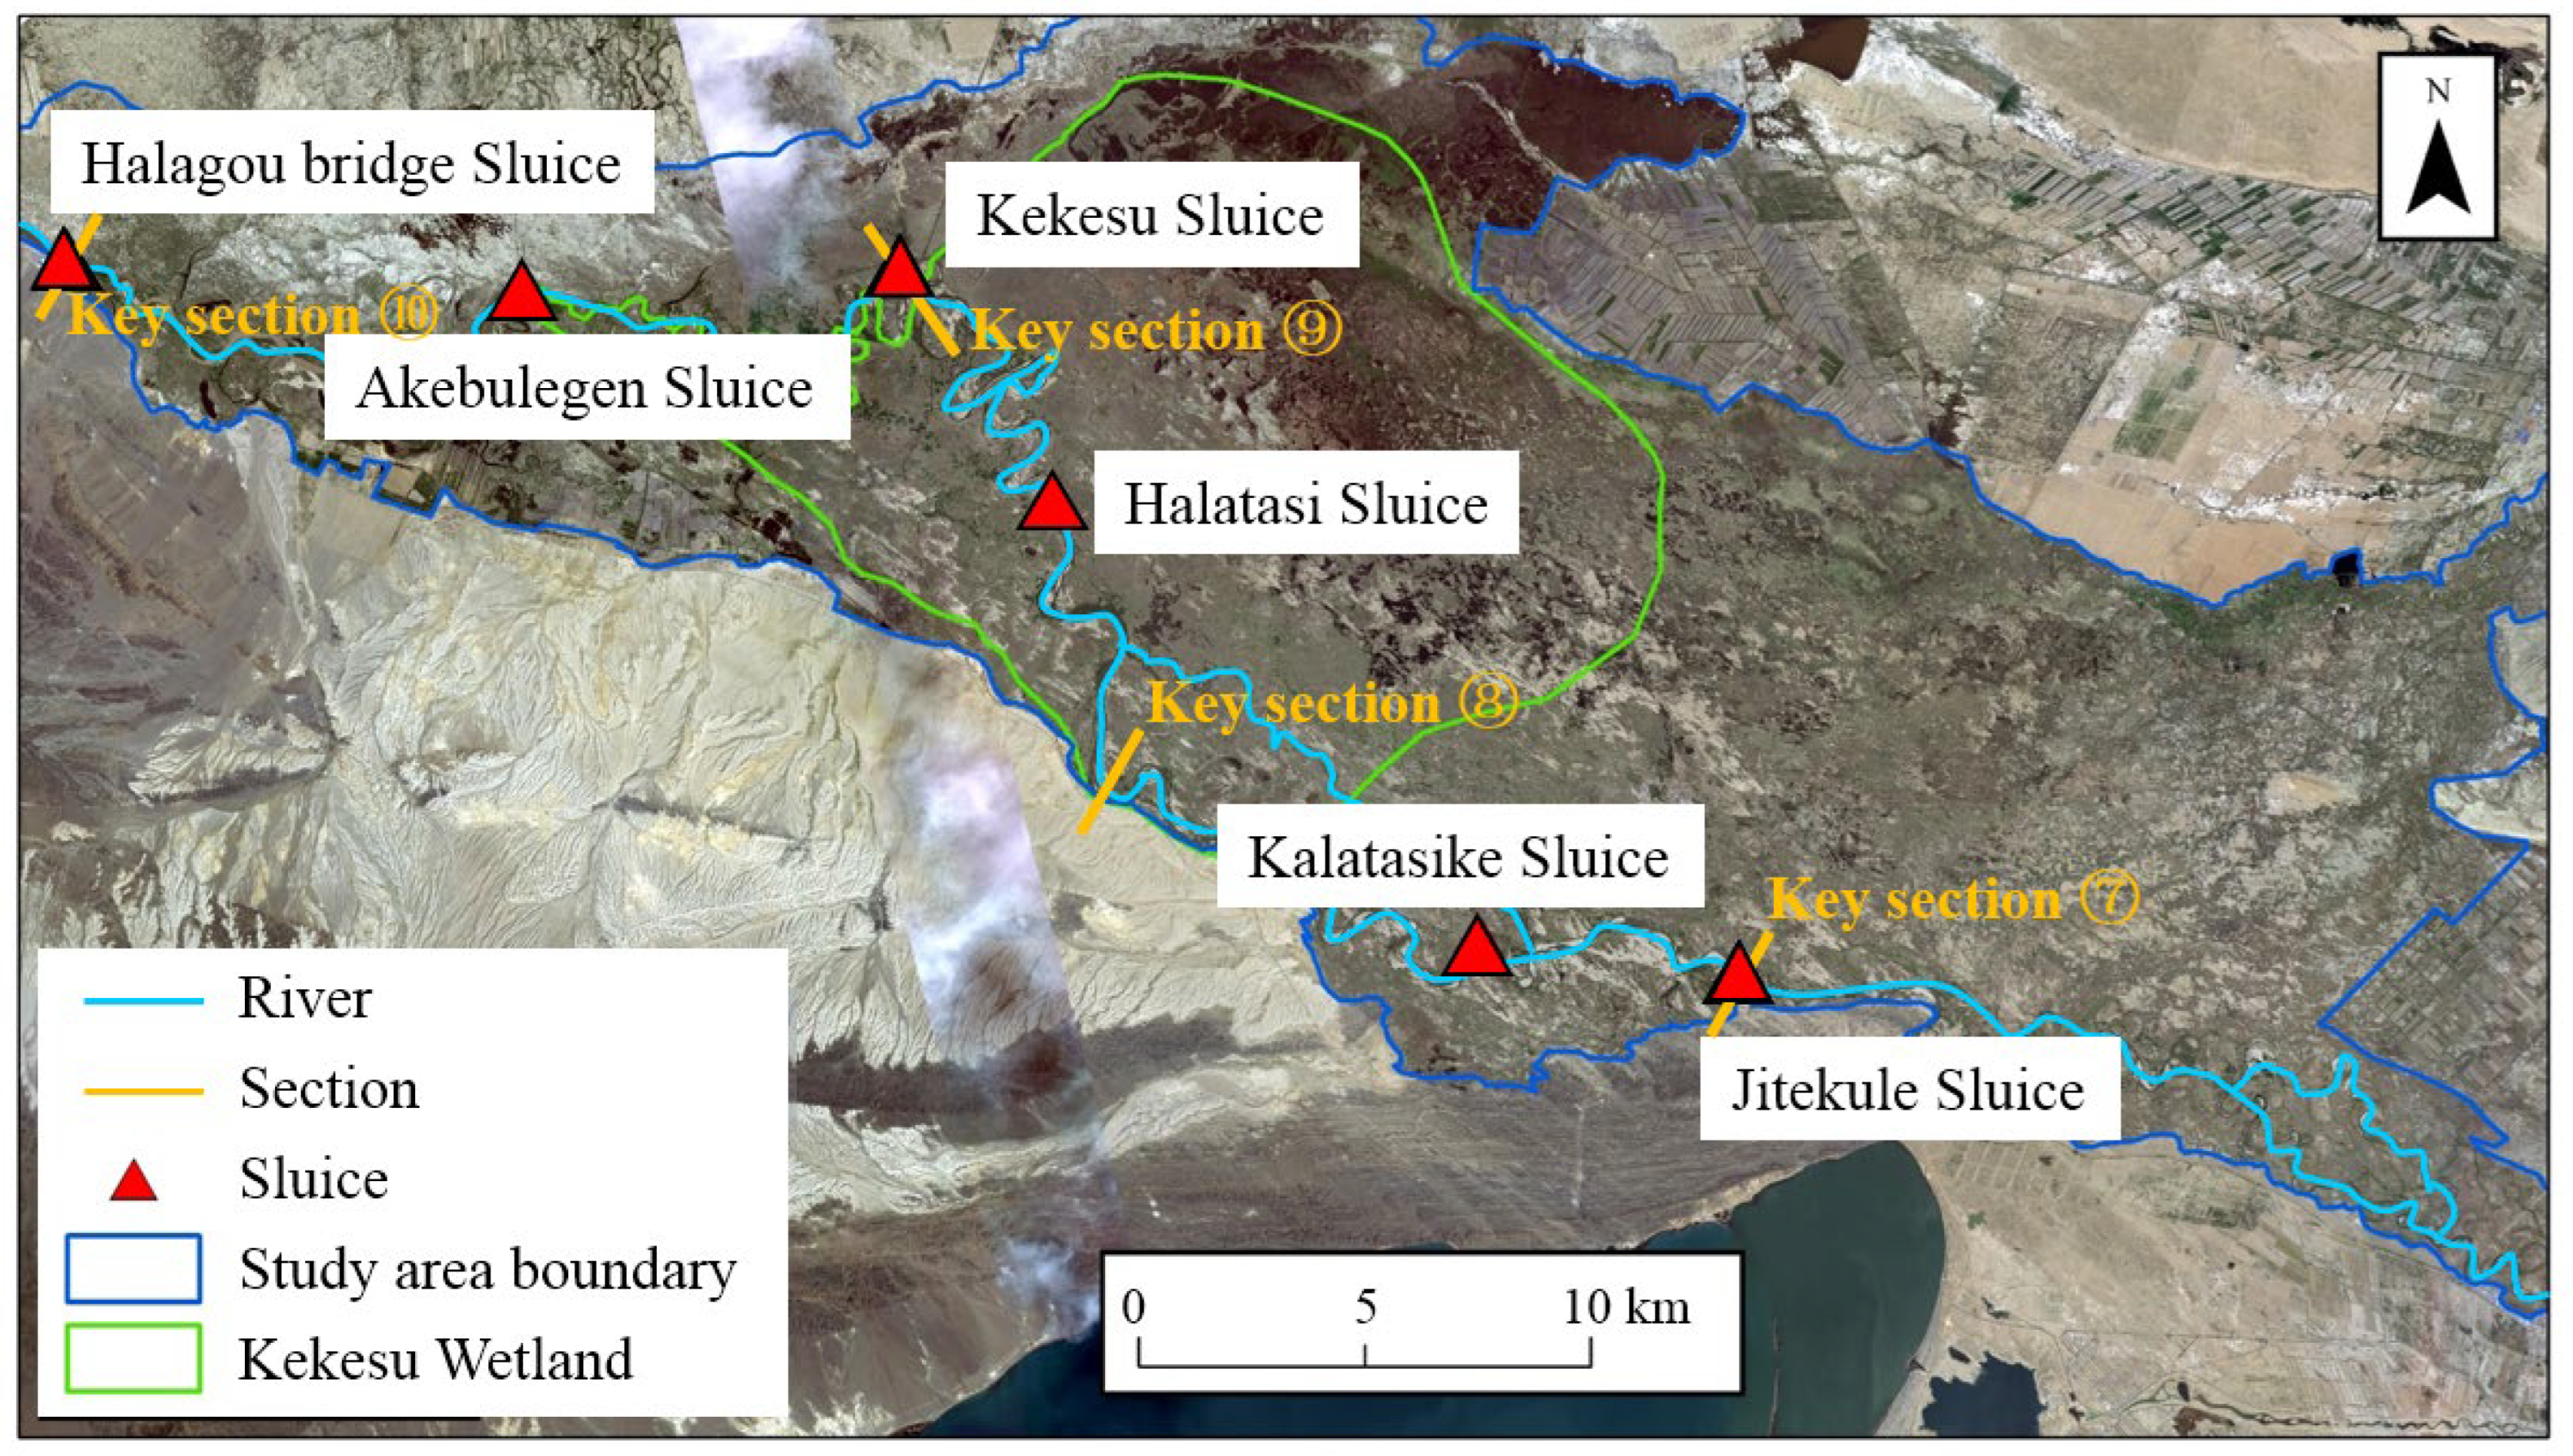
3.5.1. Geographic Locations of the Ecological Sluices
3.5.2. Optimization of the Ecological Regulation Rules
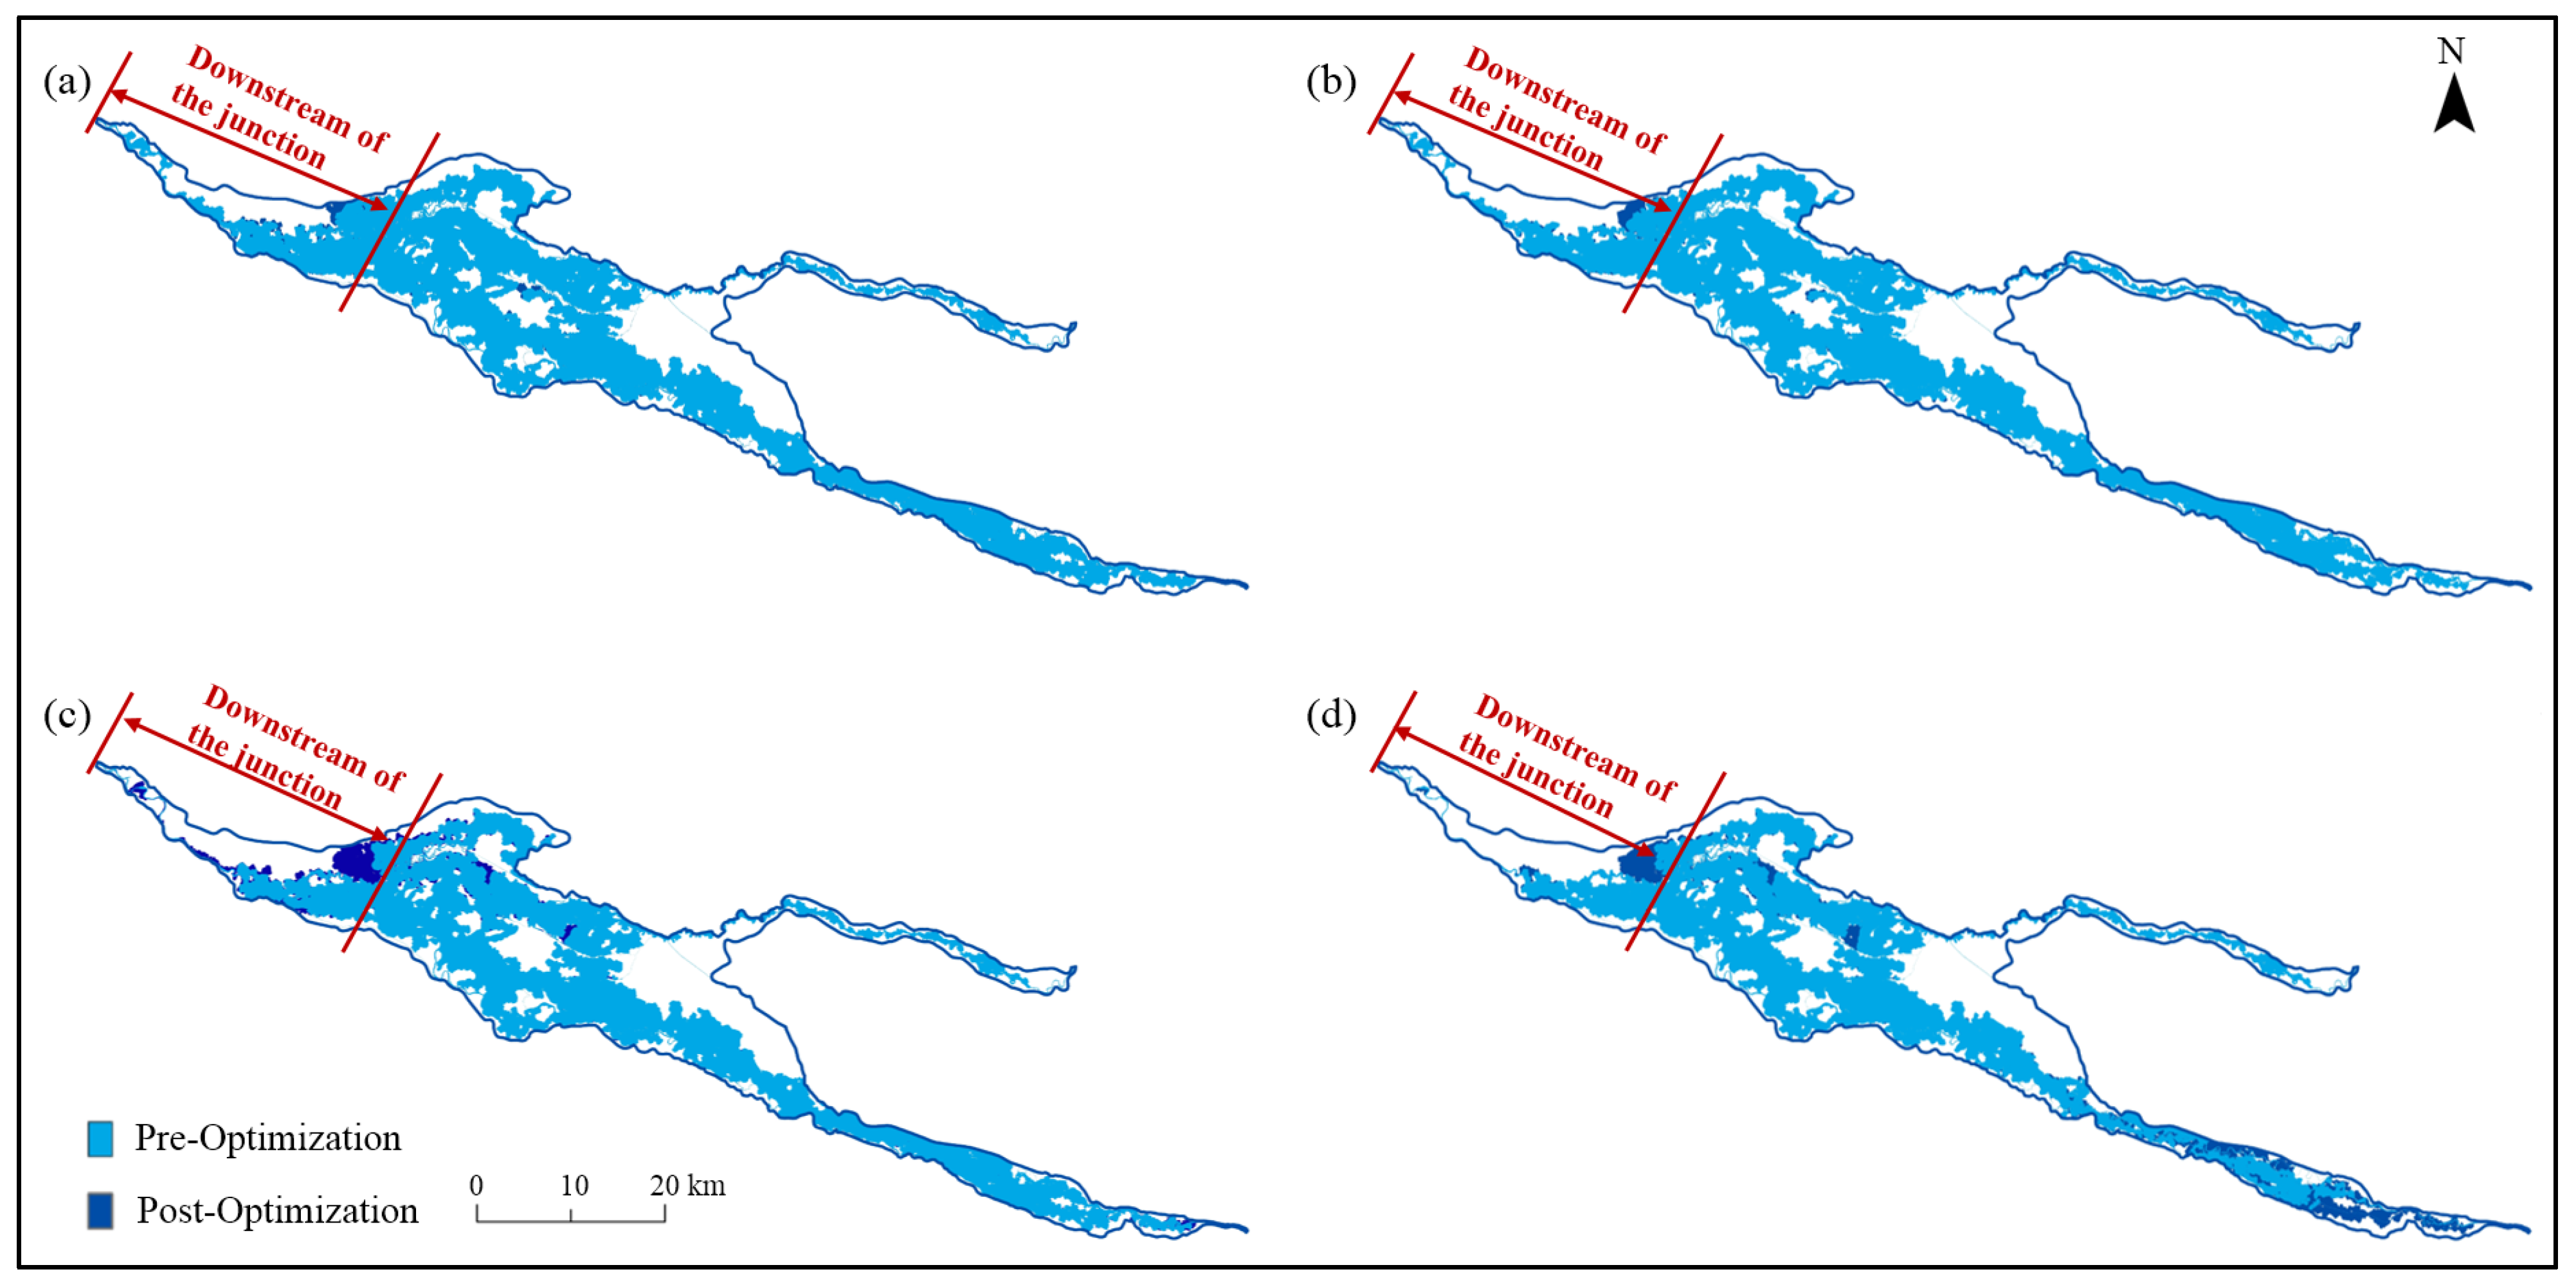
3.5.3. Improvement Effects of Ecological Regulation
4. Discussion
5. Conclusions
Author Contributions
Funding
Institutional Review Board Statement
Informed Consent Statement
Data Availability Statement
Acknowledgments
Conflicts of Interest
References
- Boithias, L.; Terrado, M.; Corominas, L.; Ziv, G.; Kumar, V.; Marqués, M.; Schuhmacher, M.; Acuña, V. Analysis of the uncertainty in the monetary valuation of ecosystem services—A case study at the river basin scale. Sci. Total Environ. 2016, 543, 683–690. [Google Scholar] [CrossRef] [PubMed]
- Gu, J.; Li, M.; Guo, P.; Huang, G. Risk Assessment for Ecological Planning of Arid Inland River Basins Under Hydrological and Management Uncertainties. Water Resour. Manag. 2016, 30, 1415–1431. [Google Scholar] [CrossRef]
- Wang, L.; D’Odorico, P.; Evans, J.P.; Eldridge, D.J.; McCabe, M.F.; Caylor, K.K.; King, E.G. Dryland ecohydrology and climate change: Critical issues and technical advances. Hydrol. Earth Syst. Sci. 2012, 16, 2585–2603. [Google Scholar] [CrossRef]
- Patil, R.; Wei, Y.; Pullar, D.; Shulmeister, J. Sensitivity of streamflow patterns to river regulation and climate change and its implications for ecological and environmental management. J. Environ. Manage. 2020, 319, 115680. [Google Scholar] [CrossRef]
- Deng, L.; Wang, K.; Li, J.; Zhao, G.; Shangguan, Z. Effect of soil moisture and atmospheric humidity on both plant productivity and diversity of native grasslands across the Loess Plateau, China. Ecol. Eng. 2016, 94, 525–531. [Google Scholar] [CrossRef]
- Zhang, X.; Guan, T.; Zhou, J.; Cai, W.; Gao, N.; Du, H.; Jiang, L.; Lai, L.; Zheng, Y. Groundwater Depth and Soil Properties Are Associated with Variation in Vegetation of a Desert Riparian Ecosystem in an Arid Area of China. Forests 2018, 9, 34. [Google Scholar] [CrossRef]
- Garssen, A.G.; Baattrup-Pedersen, A.; Voesenek, L.A.C.J.; Verhoeven, J.T.A.; Soons, M.B. Riparian plant community responses to increased flooding: A meta-analysis. Glob. Chang. Biol. 2015, 21, 2881–2890. [Google Scholar] [CrossRef]
- Ling, H.; Zhang, P.; Xu, H.; Zhang, G. Determining the ecological water allocation in a hyper-arid catchment with increasing competition for water resources. Glob. Planet. Chang. 2016, 145, 143–152. [Google Scholar] [CrossRef]
- Campitelli, B.E.; Des Marais, D.L.; Juenger, T.E. Ecological interactions and the fitness effect of water-use efficiency: Competition and drought alter the impact of natural MPK12 alleles in Arabidopsis. Ecolo. Lett. 2016, 19, 424–434. [Google Scholar] [CrossRef]
- Chen, Y.; Xu, C.; Chen, Y.; Liu, Y.; Li, W. Progress, Challenges and Prospects of Eco-Hydrological Studies in the Tarim River Basin of Xinjiang, China. Environ. Manag. 2012, 51, 138–153. [Google Scholar] [CrossRef]
- Viola, F.; Pumo, D.; Noto, L.V. EHSM: A conceptual ecohydrological model for daily streamflow simulation. Hydrol. Processes 2013, 28, 3361–3372. [Google Scholar] [CrossRef]
- Hamdan, A.; Stromberg, J.C. Changes in riparian plant communities due to a canal barrier traversing ephemeral stream channels in the Sonoran Desert. J. Arid. Environ. 2016, 125, 1–7. [Google Scholar] [CrossRef]
- Wang, Y.; Zhang, N.; Wang, D.; Wu, J.; Zhang, X. Investigating the impacts of cascade hydropower development on the natural flow regime in the Yangtze River, China. Sci. Total Environ. 2018, 624, 1187–1194. [Google Scholar] [CrossRef]
- Yigzaw, W. Hossain, F. Leveraging Precipitation Modification around Large Reservoirs in Orographic Environments for Water Resources Management. J. Civil Environ. Eng. 2014, 4, 5. [Google Scholar] [CrossRef]
- He, S.; Guo, S.; Yang, G.; Chen, K.; Liu, D.; Zhou, Y. Optimizing Operation Rules of Cascade Reservoirs for Adapting Climate Change. Water Resour. Manag. 2019, 34, 101–120. [Google Scholar] [CrossRef]
- Wang, H.; Brill, E.D.; Ranjithan, R.S.; Sankarasubramanian, A. A framework for incorporating ecological releases in single reservoir operation. Adv. Water Resour. 2015, 78, 9–21. [Google Scholar] [CrossRef]
- Sadat, M.A.; Guan, Y.; Zhang, D.; Shao, G.; Cheng, X.; Yang, Y. The associations between river health and water resources management lead to the assessment of river state. Ecol. Indic. 2020, 109, 105814. [Google Scholar] [CrossRef]
- Vörösmarty, C.J.; Meybeck, M.; Fekete, B.; Sharma, K.; Green, P.; Syvitski, J.P.M. Anthropogenic sediment retention: Major global impact from registered river impoundments. Glob. Planet. Chang. 2003, 39, 169–190. [Google Scholar] [CrossRef]
- Wang, Y.; Rhoads, B.; Wang, D. Assessment of the flow regime alterations in the middle reach of the Yangtze River associated with dam construction: Potential ecological implications. Hydrol. Processes 2016, 30, 3949–3966. [Google Scholar] [CrossRef]
- Wang, D.; Singh, V.P.; Zhu, Y.; Wu, J. Stochastic observation error and uncertainty in water quality evaluation. Adv. Water Resour. 2009, 32, 1526–1534. [Google Scholar] [CrossRef]
- Poff, N.L.; Allan, J.D.; Palmer, M.A.; Hart, D.D.; Richter, B.D.; Arthington, A.H.; Rogers, K.H.; Meyer, J.L.; Stanford, J.A. River flows and water wars: Emerging science for environmental decision making. Front. Ecol. Environ. 2003, 1, 298–306. [Google Scholar] [CrossRef]
- Suen, J.-P. Determining the Ecological Flow Regime for Existing Reservoir Operation. Water Resour. Manag. 2010, 25, 817–835. [Google Scholar] [CrossRef]
- Ding, Z.; Fang, G.; Wen, X.; Tan, Q.; Huang, X.; Lei, X.; Tian, Y.; Quan, J. A novel operation chart for cascade hydropower system to alleviate ecological degradation in hydrological extremes. Ecol. Model. 2018, 384, 10–22. [Google Scholar] [CrossRef]
- Jiang, Y.; Zhang, R.; Wang, B. Scenario-based approach for emergency operational response: Implications for reservoir management decisions. Int. J. Disaster Risk Reduct. 2022, 80, 103192. [Google Scholar] [CrossRef]
- Zhang, R.; Zhang, S.; Xu, W.; Wang, B.; Wang, H. Flow regime of the three outlets on the south bank of Jingjiang River, China: An impact assessment of the Three Gorges Reservoir for 2003–2010. Stoch. Environ. Res. Risk Assess. 2015, 29, 2047–2060. [Google Scholar] [CrossRef]
- Dudgeon, D.; Arthington, A.H.; Gessner, M.O.; Kawabata, Z.-I.; Knowler, D.J.; Lévêque, C.; Naiman, R.J.; Prieur-Richard, A.-H.; Soto, D.; Stiassny, M.L. Freshwater biodiversity: Importance, threats, status and conservation challenges. Biol. Rev. 2006, 81, 163–182. [Google Scholar] [CrossRef]
- Agostinho, A.A.; Gomes, L.C.; Veríssimo, S.; Okada, E.K. Flood regime, dam regulation and fish in the Upper Paraná River: Effects on assemblage attributes, reproduction and recruitment. Rev. Fish. Biol. Fish. 2004, 14, 11–19. [Google Scholar] [CrossRef]
- Restrepo, J.D.; Escobar, R.; Tosic, M. Fluvial fluxes from the Magdalena River into Cartagena Bay, Caribbean Colombia: Trends, future scenarios, and connections with upstream human impacts. Geomorphology 2018, 302, 92–105. [Google Scholar] [CrossRef]
- Li, B.; Shi, X.; Chen, Y.; Jiang, Y. Quantitative assessment of the ecological effects of land use/cover change in the arid region of Northwest China. Environ. Monit. Assess. 2019, 191, 704. [Google Scholar] [CrossRef]
- Gubiani, É.A.; Gomes, L.C.; Agostinho, A.A.; Baumgartner, G. Variations in fish assemblages in a tributary of the upper Paraná River, Brazil: A comparison between pre and post-closure phases of dams. River Res. Appl. 2009, 26, 848–865. [Google Scholar] [CrossRef]
- Suen, J.-P.; Eheart, J.W. Reservoir management to balance ecosystem and human needs: Incorporating the paradigm of the ecological flow regime. Water Resour. Res. 2006, 42, W03417. [Google Scholar] [CrossRef]
- Zhou, Y.; Guo, S. Incorporating ecological requirement into multipurpose reservoir operating rule curves for adaptation to climate change. J. Hydrol. 2013, 498, 153–164. [Google Scholar] [CrossRef]
- Richter, B.D.; Mathews, R.; Harrison, D.L.; Wigington, R. Ecologicaiiy sustsinable water management: Managing river flows for ecological integrity. Ecol. Appl. 2003, 13, 206–224. [Google Scholar] [CrossRef]
- Richter, B.D.; Thomas, G.A. Restoring Environmental Flows by Modifying Dam Operations. Ecol. Soc. 2007, 12, 181–194. [Google Scholar] [CrossRef]
- Wu, X.; Wei, X.; Guo, W. Multi-objective Ecological Operation Model of Cascade Hydropower Reservoirs. Procedia Eng. 2012, 29, 3996–4001. [Google Scholar] [CrossRef]
- Li, Y.; Lin, J.; Liu, Y.; Yao, W.; Zhang, D.; Peng, Q.; Qian, S. Refined operation of cascade reservoirs considering fish ecological demand. J. Hydrol. 2022, 607, 127559. [Google Scholar] [CrossRef]
- Dai, L.; Mao, J.; Wang, Y.; Dai, H.; Zhang, P.; Guo, J. Optimal operation of the Three Gorges Reservoir subject to the ecological water level of Dongting Lake. Environ. Earth Sci. 2016, 75, 1111. [Google Scholar] [CrossRef]
- Huang, Q.; Zhao, M.; Li, Y. Advancements in studies on reservoir ecological operation. J. Hydroelectr. Eng. 2017, 36, 1–11. [Google Scholar] [CrossRef]
- Moulinec, C.; Denis, C.; Pham, C.T.; Rougé, D.; Hervouet, J.M.; Razafindrakoto, E.; Barber, R.W.; Emerson, D.R.; Gu, X.J. TELEMAC: An efficient hydrodynamics suite for massively parallel architectures. Comput. Fluids 2011, 51, 30–34. [Google Scholar] [CrossRef]
- Brière, C.; Abadie, S.; Bretel, P.; Lang, P. Assessment of TELEMAC system performances, a hydrodynamic case study of Anglet, France. Coast. Eng. 2007, 54, 345–356. [Google Scholar] [CrossRef]
- Galland, J.-C.; Goutal, N.; Hervouet, J.-M. TELEMAC: A new numerical model for solving shallow water equations. Adv. Water Resour. 1991, 14, 138–148. [Google Scholar] [CrossRef]
- Jain, S.K.; Sudheer, K.P. Fitting of Hydrologic Models: A Close Look at the Nash–Sutcliffe Index. J. Hydrol. Eng. 2008, 13, 981–986. [Google Scholar] [CrossRef]
- McFeeters, S.K. The use of the Normalized Difference Water Index (NDWI) in the delineation of open water features. Int. J. Remote Sens. 1996, 17, 1425–1432. [Google Scholar] [CrossRef]
- Ediriwickrema, J.; Khorram, S. Hierarchical maximum-likelihood classification for improved accuracies. IEEE Trans. Geosci. Remote Sens. 1997, 35, 810–816. [Google Scholar] [CrossRef]
- Chein, I.C.; Ren, H. A generalized orthogonal subspace projection approach to unsupervised multispectral image classification. IEEE Trans. Geosci. Remote Sens. 2000, 38, 2515–2528. [Google Scholar] [CrossRef]
- Yuan, M.; Ouyang, J.; Zheng, S.; Tian, Y.; Sun, R.; Bao, R.; Li, T.; Yu, T.; Li, S.; Wu, D.; et al. Research on Ecological Effect Assessment Method of Ecological Restoration of Open-Pit Coal Mines in Alpine Regions. Int. J. Environ. Res. Public Health 2002, 19, 7682. [Google Scholar] [CrossRef]
- King, A.J.; Ward, K.A.; O’Connor, P.; Green, D.; Tonkin, Z.; Mahoney, J. Adaptive management of an environmental watering event to enhance native fish spawning and recruitment. Freshw. Biol. 2010, 55, 17–31. [Google Scholar] [CrossRef]
- Xu, W. Study on Multi-Objective Operation Strategy for Multi-Reservoirs in Small-Scale Watershed Considering Ecological Flows. Water Resour. Manag. 2020, 34, 4725–4738. [Google Scholar] [CrossRef]
- Feng, Z.; Niu, W.; Cheng, C. Optimization of hydropower reservoirs operation balancing generation benefit and ecological requirement with parallel multi-objective genetic algorithm. Energy 2018, 153, 706–718. [Google Scholar] [CrossRef]
- Baumgartner, M.T.; Piana, P.A.; Baumgartner, G.; Gomes, L.C. Storage or Run-of-river Reservoirs: Exploring the Ecological Effects of Dam Operation on Stability and Species Interactions of Fish Assemblages. Environ. Manag. 2020, 65, 220–231. [Google Scholar] [CrossRef]
- Ahmed, F. Cumulative Hydrologic Impact of Wetland Loss: Numerical Modeling Study of the Rideau River Watershed, Canada. J. Hydrol. Eng. 2014, 19, 593–606. [Google Scholar] [CrossRef]
- Zhou, D.; Yu, J.; Guan, B.; Li, Y.; Yu, M.; Qu, F.; Zhan, C.; Lv, Z.; Wu, H.; Wang, Q.; et al. A Comparison of the Development of Wetland Restoration Techniques in China and Other Nations. Wetlands 2020, 40, 2755–2764. [Google Scholar] [CrossRef]
- Ma, M.; Xiang, L.; Huang, Y.; Gong, H. Water Quality Restoration with Ecological Water Demand Allocation Regulation. IOP Conf. Ser. Earth Environ. Sci. 2020, 585, 012072. [Google Scholar] [CrossRef]
- Choi, B.; Choi, S. Integrated Hydraulic Modelling, Water Quality Modelling and Habitat Assessment for Sustainable Water Management: A Case Study of the Anyang-Cheon Stream, Korea. Sustainability 2021, 13, 4330. [Google Scholar] [CrossRef]
- Xing, Z.; Huang, H.; Li, Y.; Liu, S.; Wang, D.; Yuan, Y.; Zhao, Z.; Bu, L. Management of sustainable ecological water levels of endorheic salt lakes in the Inner Mongolian Plateau of China based on eco-hydrological processes. Hydrol. Processes 2021, 35, e14192. [Google Scholar] [CrossRef]
- Fan, Z.; Wang, Z.; Li, Y.; Wang, W.; Tang, C.; Zeng, F. Water Level Fluctuation under the Impact of Lake Regulation and Ecological Implication in Huayang Lakes, China. Water 2020, 12, 702. [Google Scholar] [CrossRef]
- Han, Y.; Zhai, Y.; Guo, M.; Cao, X.; Lu, H.; Li, J.; Wang, S.; Yue, W. Hydrochemical and Isotopic Characterization of the Impact of Water Diversion on Water in Drainage Channels, Groundwater, and Lake Ulansuhai in China. Water 2021, 13, 3033. [Google Scholar] [CrossRef]


| Section Number | Name | Section Number | Name |
|---|---|---|---|
| 1 | 635 Reservoir | 7 | Zhonghui Bridge |
| 2 | Sarbulak | 8 | Halatielieke |
| 3 | Beitun Bridge | 9 | The junction of the Irtysh River and Kelan River |
| 4 | 7 km Section | ||
| 5 | 14 km Section | 10 | Halagou Mudao Bridge |
| 6 | Yinejihai Engineering | 11 | Burqin Hydrological Station |
| Data Type | Data Content |
|---|---|
| Geological data | Channel section, 2.5 m contour line, measured elevation points with a precision of 1 km, DEM data with a resolution of 15 m |
| Hydrological data | 2 h outflow processes of the 635 and Keaijiaer reservoirs, daily water levels and flows of the Burqin Hydrological Station, and daily flows of Yinejihai Engineering |
| Meteorological data | Daily evaporation and infiltration observation data |
| Remote sensing image data | Remote sensing imaging from the SPOT-6 satellite and Environment-1 satellite during the corresponding period |
| Section Location | Peak Occurrence Time | Measured Flow (m3 s−1) | Simulated Flow (m3 s−1) | Flow Error (%) | NSE |
|---|---|---|---|---|---|
| Key section ② | 6 June 2016 | 1120 | 1140 | 2.1 | 0.85 |
| Key section ⑩ | 10 June 2016 | 811 | 878 | 8.3 | 0.85 |
| Key section ⑪ | 15 June 2016 | 822 | 918 | 11.7 | 0.88 |
| Section Location | Peak Occurrence Time | Measured Flow (m3 s−1) | Simulated Flow (m3 s−1) | Flow Error (%) | NSE |
|---|---|---|---|---|---|
| Key section ② | 27 May 2017 | 1020 | 1060 | 4.2 | 0.93 |
| Key section ⑩ | 2 June 2017 | 821 | 870 | 6.0 | 0.85 |
| Key section ⑪ | 24 May 2017 | 538 | 525 | −2.4 | 0.94 |
| 3 June 2017 | 868 | 847 | −2.5 |
| Date | Inundation Area (km2) | Area Error (%) | |
|---|---|---|---|
| Measured | Simulated | ||
| 9 June 2016 | 493.2 | 492.7 | −0.1 |
| 12 June 2016 | 545.4 | 499.4 | −8.5 |
| 14 June 2016 | 569.9 | 497.9 | −12.6 |
| 22 May 2017 | 352.7 | 395.6 | 12.2 |
| 3 June 2017 | 471.3 | 464.3 | −1.5 |
| Section Number | Bottomland Elevation (m) | Flood Peak 800 m3 s−1 | Flood Peak 1000 m3 s−1 | ||
|---|---|---|---|---|---|
| Calculated Highest water Level (m) | Flooding on the Floodplain | Calculated Highest Water Level (m) | Flooding on the Floodplain | ||
| Key section ③ | 507.64 | 507.14 | × | 507.33 | × |
| Key section ④ | 499.28 | 499.13 | × | 499.33 | √ |
| Key section ⑤ | 496.50 | 496.36 | √ | 496.55 | √ |
| Key section ⑦ | 489.30 | 488.75 | × | 489.04 | × |
| Key section ⑧ | 482.40 | 482.66 | √ | 482.83 | √ |
| Key section ⑨ | 480.38 | 480.32 | × | 480.57 | √ |
| Key section ⑩ | 475.77 | 475.45 | × | 475.77 | √ |
| Inundation Duration (d) | Area (km2) | Inundation Duration (d) | Area (km2) |
|---|---|---|---|
| 0 | 352.0 | 6 | 112.9 |
| 1 | 6.7 | 7 | 159.9 |
| 2 | 12.0 | 8 | 111.5 |
| 3 | 22.4 | 9 | 29.6 |
| 4 | 35.0 | 10 | 124.2 |
| 5 | 72.9 |
| Ecological Water Supply Volume (Million m3) | Maximum Inundation Area (km2) | Amount of Variation (km2) | Rate of Variation (%) |
|---|---|---|---|
| 605 | 668.5 | / | / |
| 528 | 649.9 | −18.6 | −2.8 |
| 482 | 634.7 | −33.8 | −5.1 |
| 398 | 599.5 | −69.0 | −10.3 |
| 301 | 539.7 | −128.8 | −19.3 |
| Water Supply Volumes (Million m3) | Inundation Duration (d) | ||||||||
|---|---|---|---|---|---|---|---|---|---|
| 1 | 2 | 3 | 4 | 5 | 6 | 7 | 8 | 9 | |
| 605 | 6.7 | 12.0 | 22.4 | 35.0 | 72.9 | 112.9 | 159.9 | 111.5 | 29.6 |
| 528 | 4.7 | 12.7 | 22.0 | 36.4 | 81.1 | 164.8 | 140.8 | 70.2 | 27.6 |
| 482 | 5.9 | 11.2 | 21.6 | 38.8 | 117.7 | 163.3 | 113.9 | 58.9 | 27.1 |
| 398 | 7.3 | 7.9 | 21.8 | 81.9 | 153.9 | 122.1 | 89.8 | 39.0 | 26.9 |
| 301 | 5.0 | 12.4 | 74.9 | 116.2 | 104.5 | 98.2 | 75.5 | 19.2 | 26.8 |
| Ecological Water Supply Volume (Million m3) | Inundation Area (km2) | ||||||
|---|---|---|---|---|---|---|---|
| Without Ecological Sluices | With Sluices | ||||||
| Guaranteeing the Flood Peak Flow | Variation in the Area | Rate of Variation (%) | Guaranteeing the Flood Peak Duration | Variation in the Area | Rate of Variation (%) | ||
| 528 | 649.9 | 655.3 | 5.4 | 0.8% | 652.9 | 3.0 | 0.5% |
| 482 | 634.7 | 639.4 | 4.7 | 0.7% | 621.2 | −13.5 | −2.1% |
| 398 | 599.5 | 609.0 | 9.5 | 1.6% | 609.7 | 10.2 | 1.7% |
| 301 | 539.7 | 549.9 | 10.2 | 1.9% | 577.3 | 37.6 | 7.0% |
| Water Supply Volumes (Million m3) | Inundation Duration (d) | ||||||||
|---|---|---|---|---|---|---|---|---|---|
| 1 | 2 | 3 | 4 | 5 | 6 | 7 | 8 | 9 | |
| 528 | 4.6 | 12.7 | 20.1 | 32.1 | 81.5 | 173.0 | 139.5 | 78.6 | 21.2 |
| 482 | 5.7 | 10.7 | 20.3 | 34.0 | 117.2 | 174.2 | 113.9 | 64.6 | 20.6 |
| 398 | 12.8 | 16.1 | 18.8 | 34.4 | 89.5 | 93.4 | 141.8 | 86.0 | 22.6 |
| 301 | 15.6 | 14.5 | 22.5 | 55.1 | 71.0 | 92.9 | 124.7 | 66.6 | 21.3 |
Publisher’s Note: MDPI stays neutral with regard to jurisdictional claims in published maps and institutional affiliations. |
© 2022 by the authors. Licensee MDPI, Basel, Switzerland. This article is an open access article distributed under the terms and conditions of the Creative Commons Attribution (CC BY) license (https://creativecommons.org/licenses/by/4.0/).
Share and Cite
Wang, D.; Zhang, S.; Wang, G.; Liu, Y.; Wang, H.; Gu, J. Reservoir Regulation for Ecological Protection and Remediation: A Case Study of the Irtysh River Basin, China. Int. J. Environ. Res. Public Health 2022, 19, 11582. https://doi.org/10.3390/ijerph191811582
Wang D, Zhang S, Wang G, Liu Y, Wang H, Gu J. Reservoir Regulation for Ecological Protection and Remediation: A Case Study of the Irtysh River Basin, China. International Journal of Environmental Research and Public Health. 2022; 19(18):11582. https://doi.org/10.3390/ijerph191811582
Chicago/Turabian StyleWang, Dan, Shuanghu Zhang, Guoli Wang, Yin Liu, Hao Wang, and Jingjing Gu. 2022. "Reservoir Regulation for Ecological Protection and Remediation: A Case Study of the Irtysh River Basin, China" International Journal of Environmental Research and Public Health 19, no. 18: 11582. https://doi.org/10.3390/ijerph191811582