
Focus on Self-Presentation on Social Media across Sociodemographic Variables, Lifestyles, and Personalities: A Cross-Sectional Study
 ,
,
Abstract
:1. Introduction
2. Materials and Methods
2.1. Study Design and Setting
2.2. Variables
2.2.1. Social Media Use: Background Information
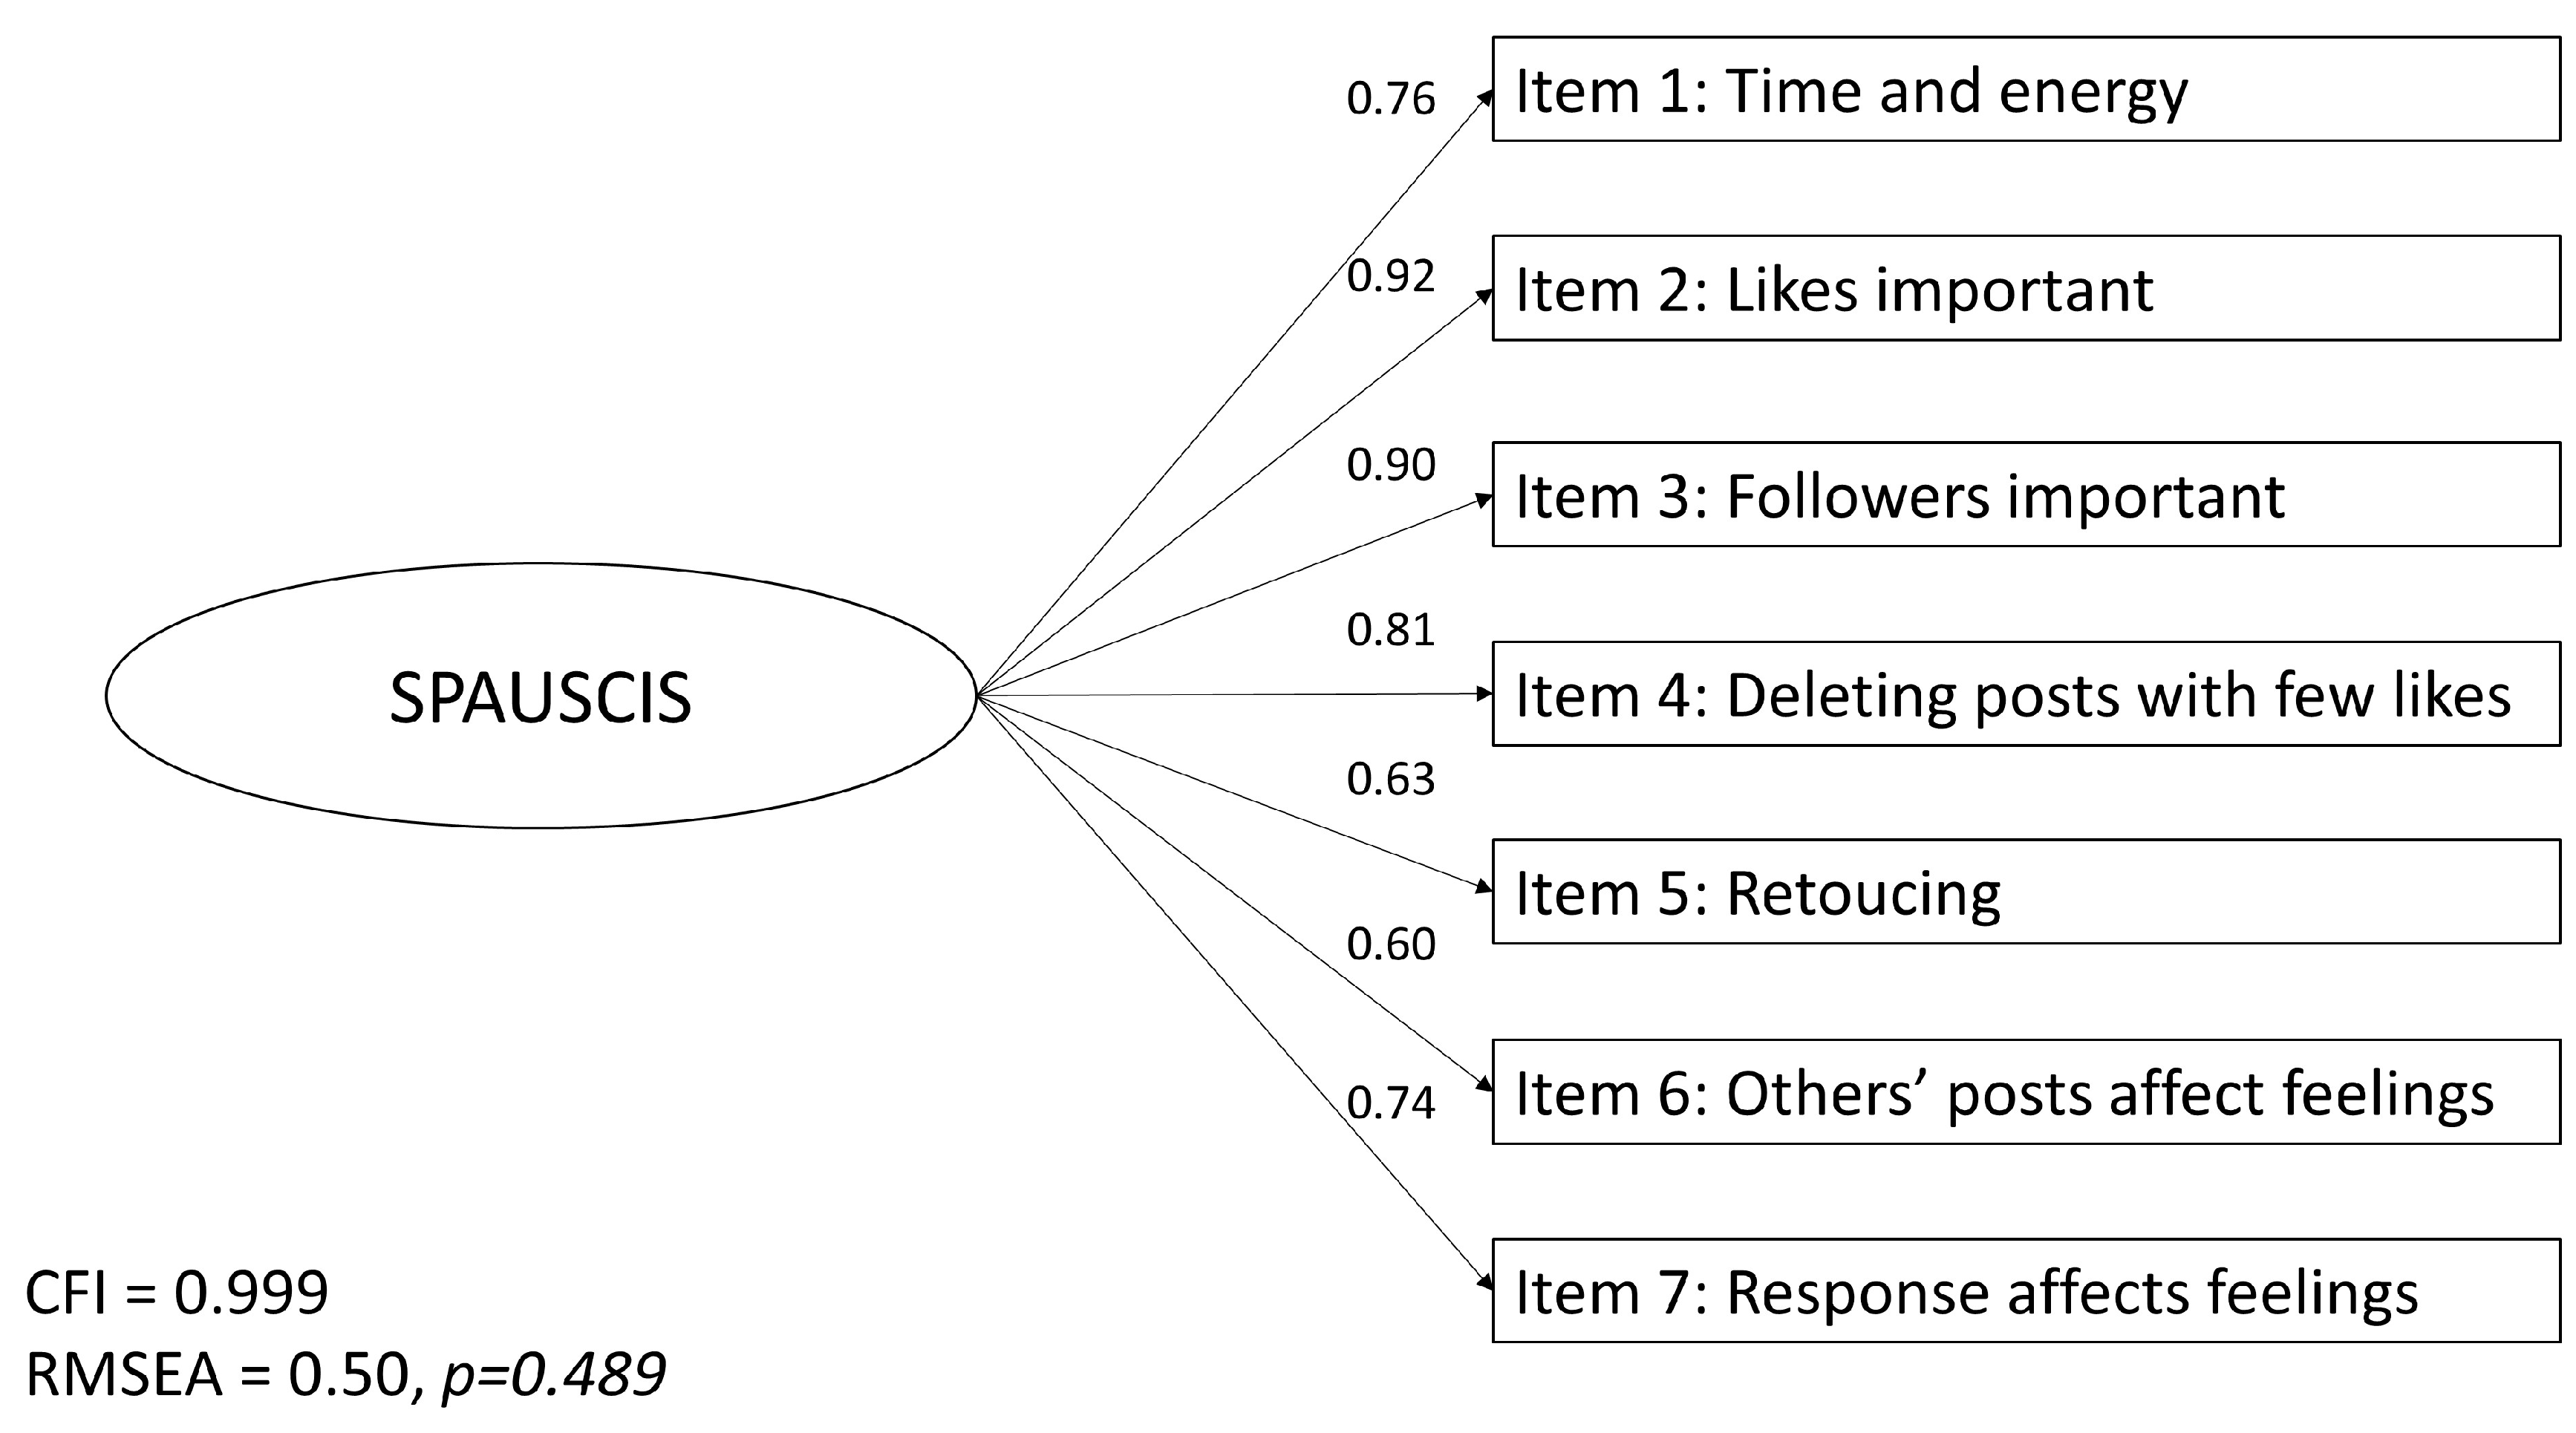
2.2.2. Self-Presentation and Upward Social Comparison Inclination Scale (SPAUSCIS)
- I use a lot of time and energy on the content I post on social media
- It is important to me that my posts receive many likes and/or comments
- It is important to me to have many followers on social media
- I delete posts on social media that do not receive enough likes and/or comments
- I retouch images of myself to look better before I post them on social media
- It’s easier to be myself on social media
- What others post on social media (images/status updates/stories) makes me feel less content with myself and my life
- The response I get for what I post (images/status updates/stories) impacts how I feel
- I don’t care about how many likes or comments I receive on social media
2.2.3. Sociodemographic and Background Variables
2.2.4. Lifestyle Factors
2.2.5. Personality
2.3. Analysis
2.3.1. Structural Validity of the SPAUSCIS
2.3.2. Identifying the Number of Classes and the Description of Retained Classes
2.3.3. Class Belongingness and Covariates
2.3.4. Missing Data
3. Results
3.1. Structural Validity of the SPAUSCIS
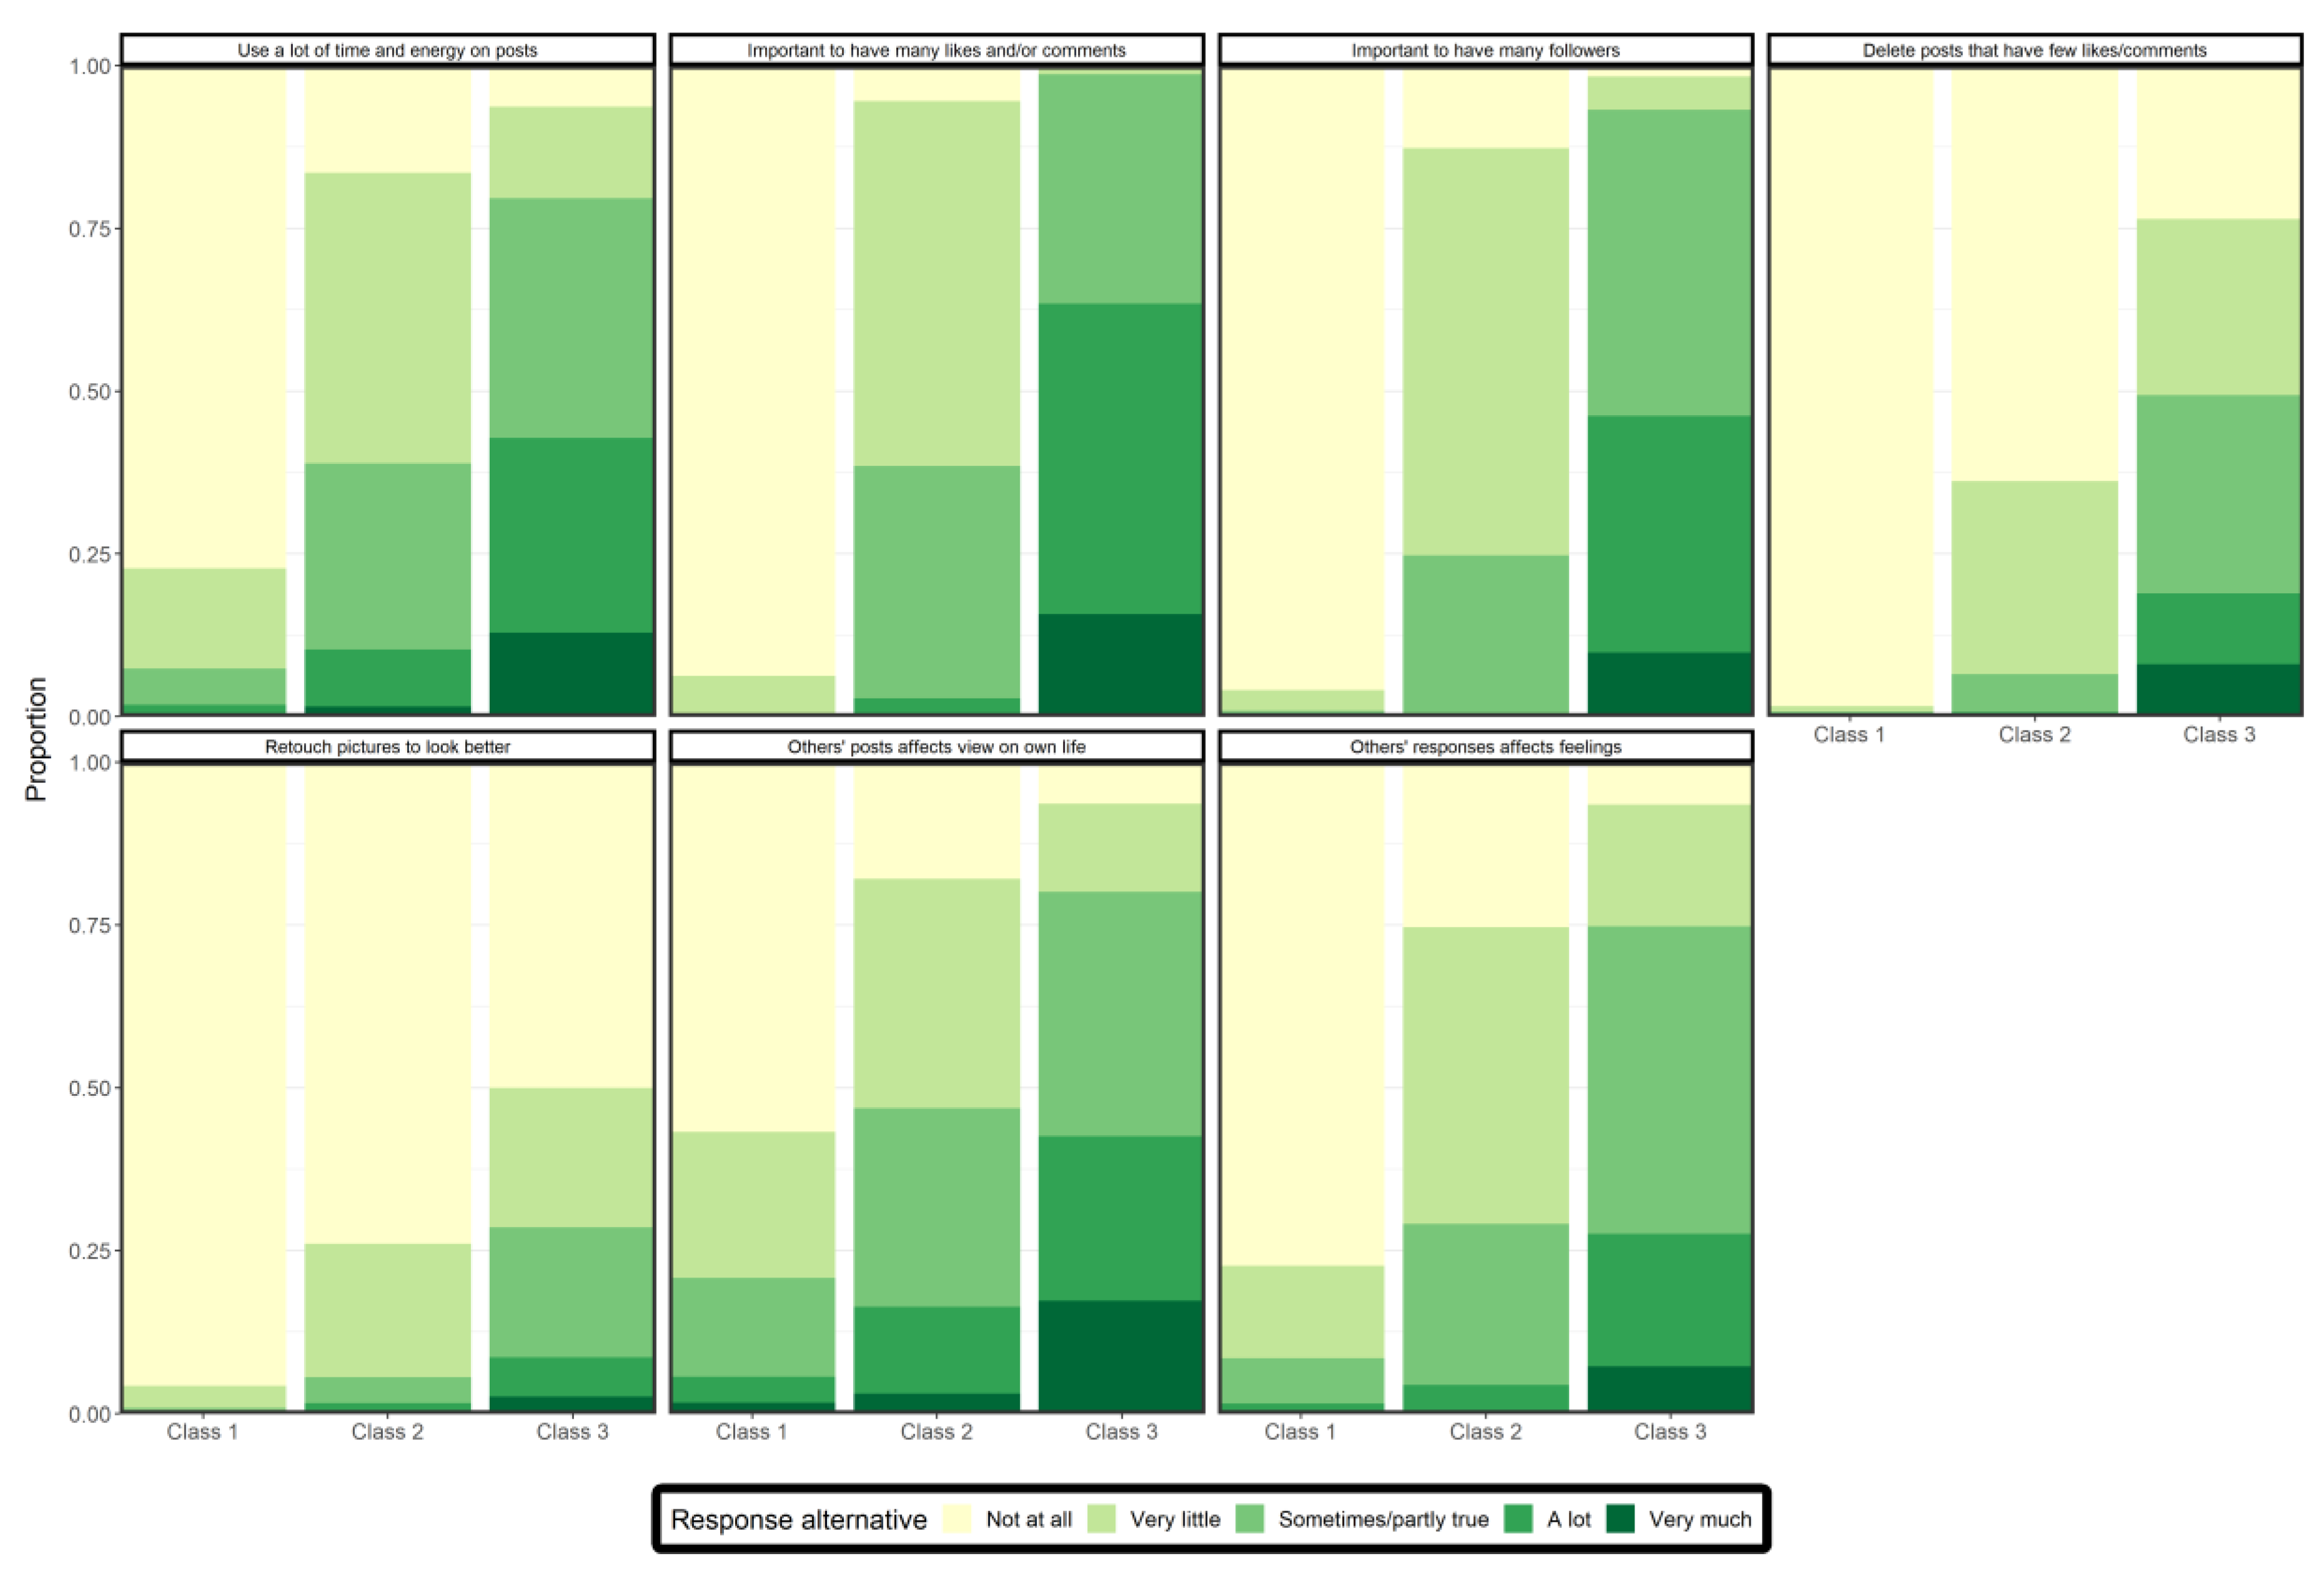
3.2. Number and Characteristics of Latent Classes
3.3. Class Belongingness and Covariates
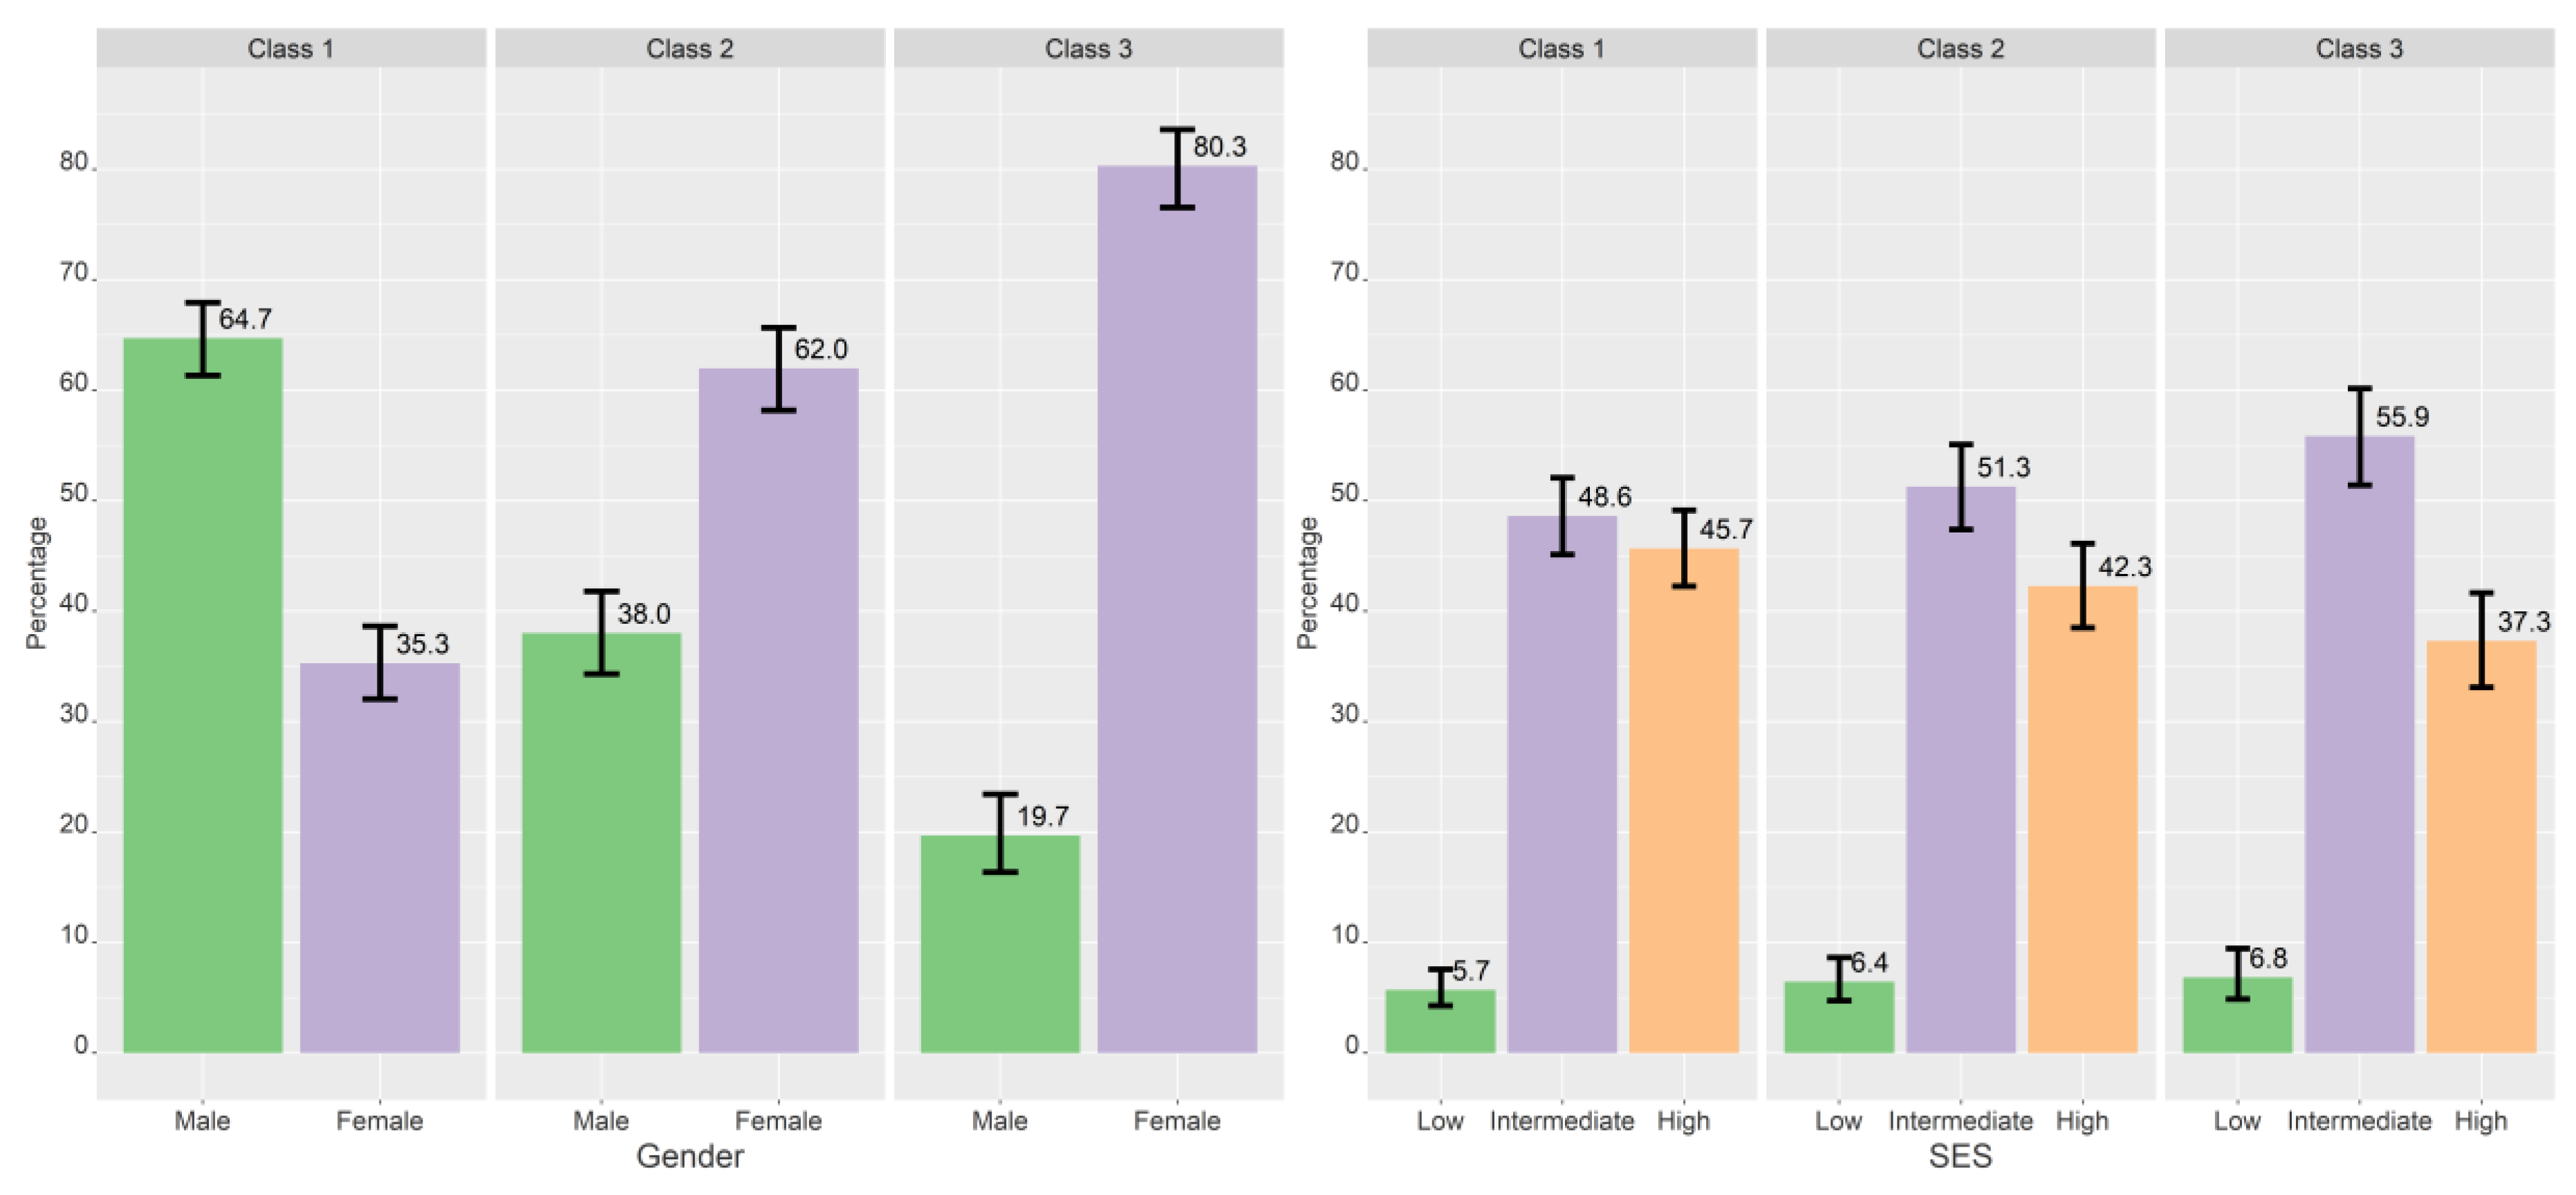
3.3.1. Sociodemographic Factors

| Class 2 vs. Class 1 (Intermediate vs. Low Focus on Self-Presentation) | Controlled for Gender | Class 3 vs. Class 1 (High vs. Low Focus on Self-Presentation) | Controlled for Gender | Class 3 vs. Class 2 (High vs. Intermediate Focus on Self-Presentation) | Controlled for Gender | |
|---|---|---|---|---|---|---|
| RRR (95 CI) | RRR (95 CI) | RRR (95 CI) | RRR (95 CI) | RRR (95 CI) | RRR (95 CI) | |
| Gender | ||||||
| Boy | Ref. | Ref. | Ref. | Ref. | Ref. | Ref. |
| Girl | 2.99 (2.42–3.59) **** | - | 7.48 (5.77–9.70) **** | - | 2.50 (1.91–3.27) **** | - |
| Age | ||||||
| 16 | 0.97 (0.69–1.36) | 1.04 (0.73–1.47) | 0.99 (0.69–1.43) | 1.11 (0.75–1.65) | 1.03 (0.70–1.51) | 1.08 (0.73–1.59) |
| 17 | 1.01 (0.81–1.25) | 1.06 (0.84–1.32) | 0.96 (0.76–1.25) | 1.04 (0.81–1.34) | 0.96 (0.75–1.22) | 0.99 (0.77–1.26) |
| 18 | Ref. | Ref. | Ref. | Ref. | Ref. | Ref. |
| SES | ||||||
| Low | 1.22 (0.78–1.90) | 0.97 (0.61–1.53) | 1.47 (0.92–2.35) | 1.00 (0.61–1.66) | 1.20 (0.74–1.95) | 1.04 (0.64–1.69) |
| Intermediate | 1.14 (0.92–1.41) | 1.02 (0.82–1.27) | 1.41 (1.12–1.77) *** | 1.17 (0.92–1.50) | 1.23 (0.97–1.57) | 1.15 (0.90–1.46) |
| High (ref) | Ref. | Ref. | Ref. | Ref. | Ref. | Ref. |
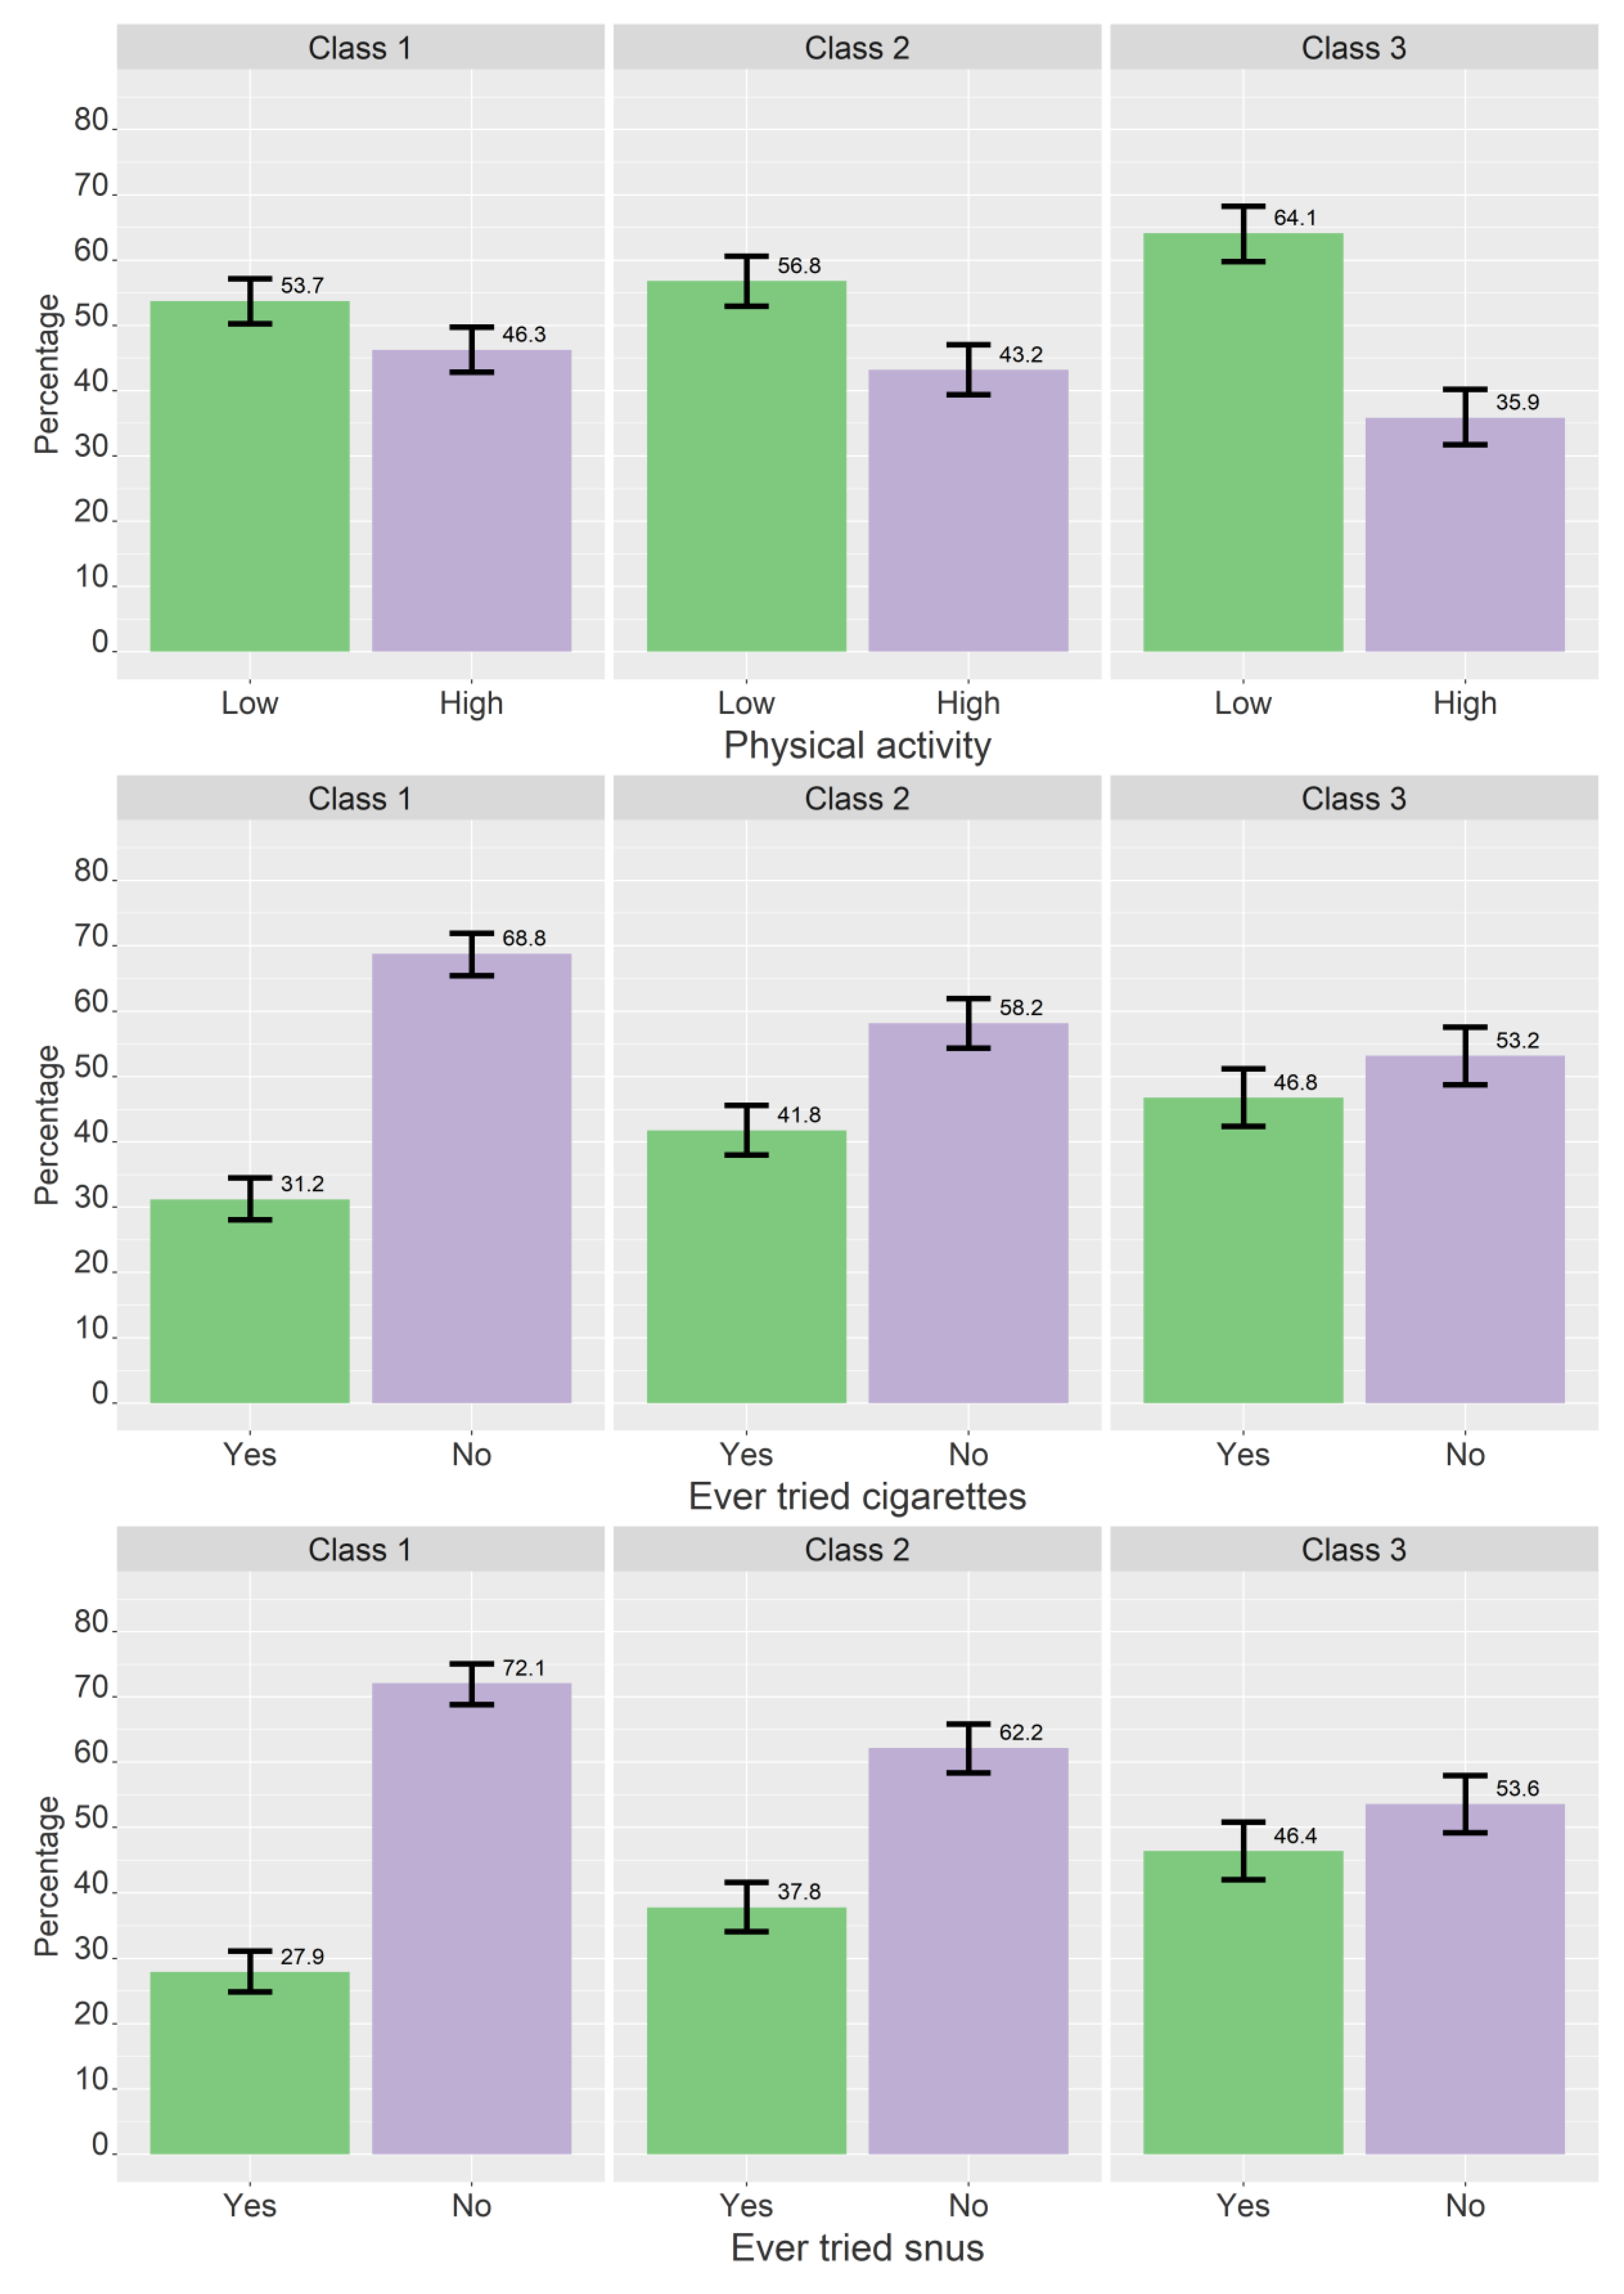
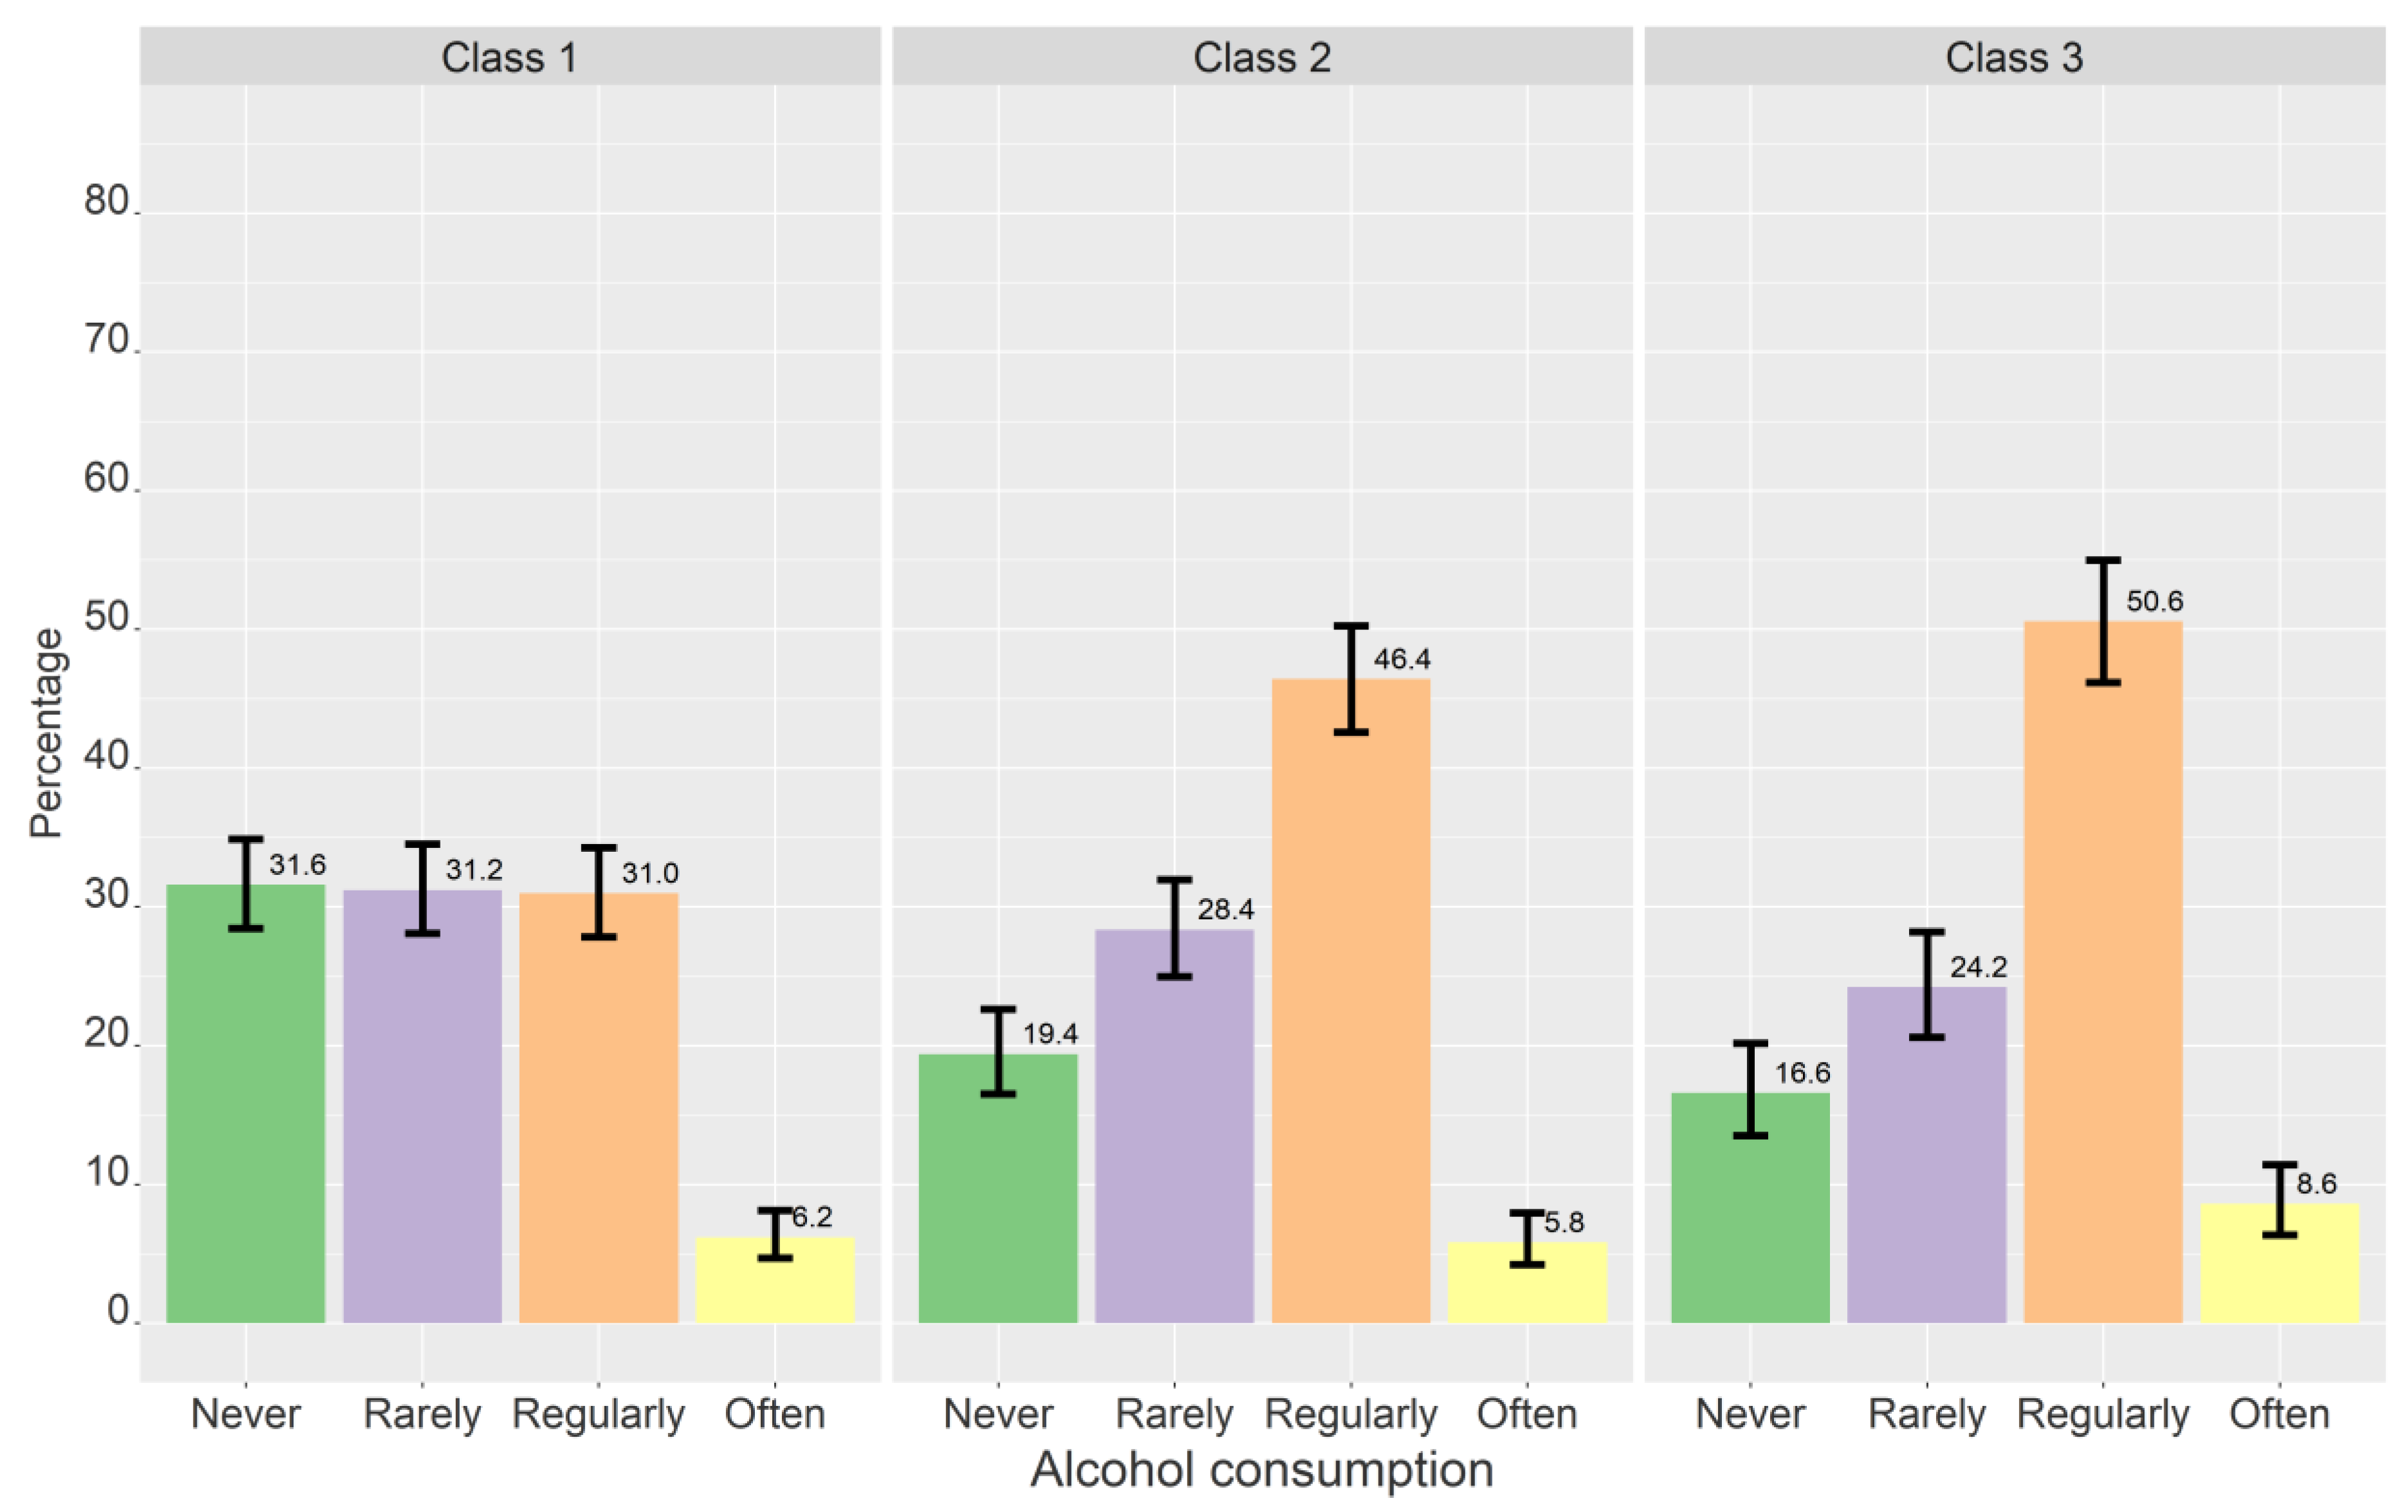
3.3.2. Lifestyle
| Class 2 vs. Class 1 (Intermediate vs. Low Focus on Self-Presentation) | Controlled for Gender | Class 3 vs. Class 1 (High vs. Low Focus on Self-Presentation) | Controlled for Gender | Class 3 vs. Class 2 (High vs. Intermediate Focus on Self-Presentation) | Controlled for Gender | |
|---|---|---|---|---|---|---|
| Physical activity | ||||||
| Low/moderate | 1.13 (0.92–1.39) | 0.96 (0.77–1.18) | 1.54 (1.23–1.93) **** | 1.15 (0.90–1.47) | 1.36 (1.07–1.72) * | 1.21 (0.95–1.54) |
| High | Ref. | Ref. | Ref. | Ref. | Ref. | Ref. |
| Alcohol | ||||||
| Never | Ref. | Ref. | Ref. | Ref. | Ref. | Ref. |
| Rarely | 1.48 (1.12–1.96) ** | 1.43 (1.09–1.91) * | 1.48 (1.07–2.04) * | 1.39 (0.98–1.96) | 1.00 (0.70–1.42) | 0.97 (0.68–1.39) |
| Regularly | 2.44 (1.87–3.19) **** | 2.25 (1.71–2.96) **** | 3.11 (2.30–4.19) **** | 2.70 (1.96–3.72) **** | 1.27 (0.93–1.75) | 1.20 (0.87–1.66) |
| Often | 1.53 (0.96–2.44) | 1.71 (1.06–2.76) * | 2.64 (1.65–4.23) **** | 3.25 (1.95–5.42) **** | 1.73 (1.04–2.87) * | 1.90 (1.13–3.19) * |
| Ever tried cigarettes | ||||||
| No | Ref. | Ref. | Ref. | Ref. | Ref. | Ref. |
| Yes | 1.58 (1.28–1.96) **** | 1.77 (1.42–2.21) **** | 1.94 (1.54–2.43) **** | 2.34 (1.83–3.00) **** | 1.22 (0.97–1.54) | 1.32 (1.04–1.67) * |
| Ever tried snus | ||||||
| No | Ref. | Ref. | Ref. | Ref. | Ref. | Ref. |
| Yes | 1.57 (1.26–1.95) **** | 1.75 (1.40–2.19) **** | 2.24 (1.77–2.82) **** | 2.69 (2.09–3.46) **** | 1.42 (1.13–1.80) *** | 1.54 (1.21–1.95) **** |
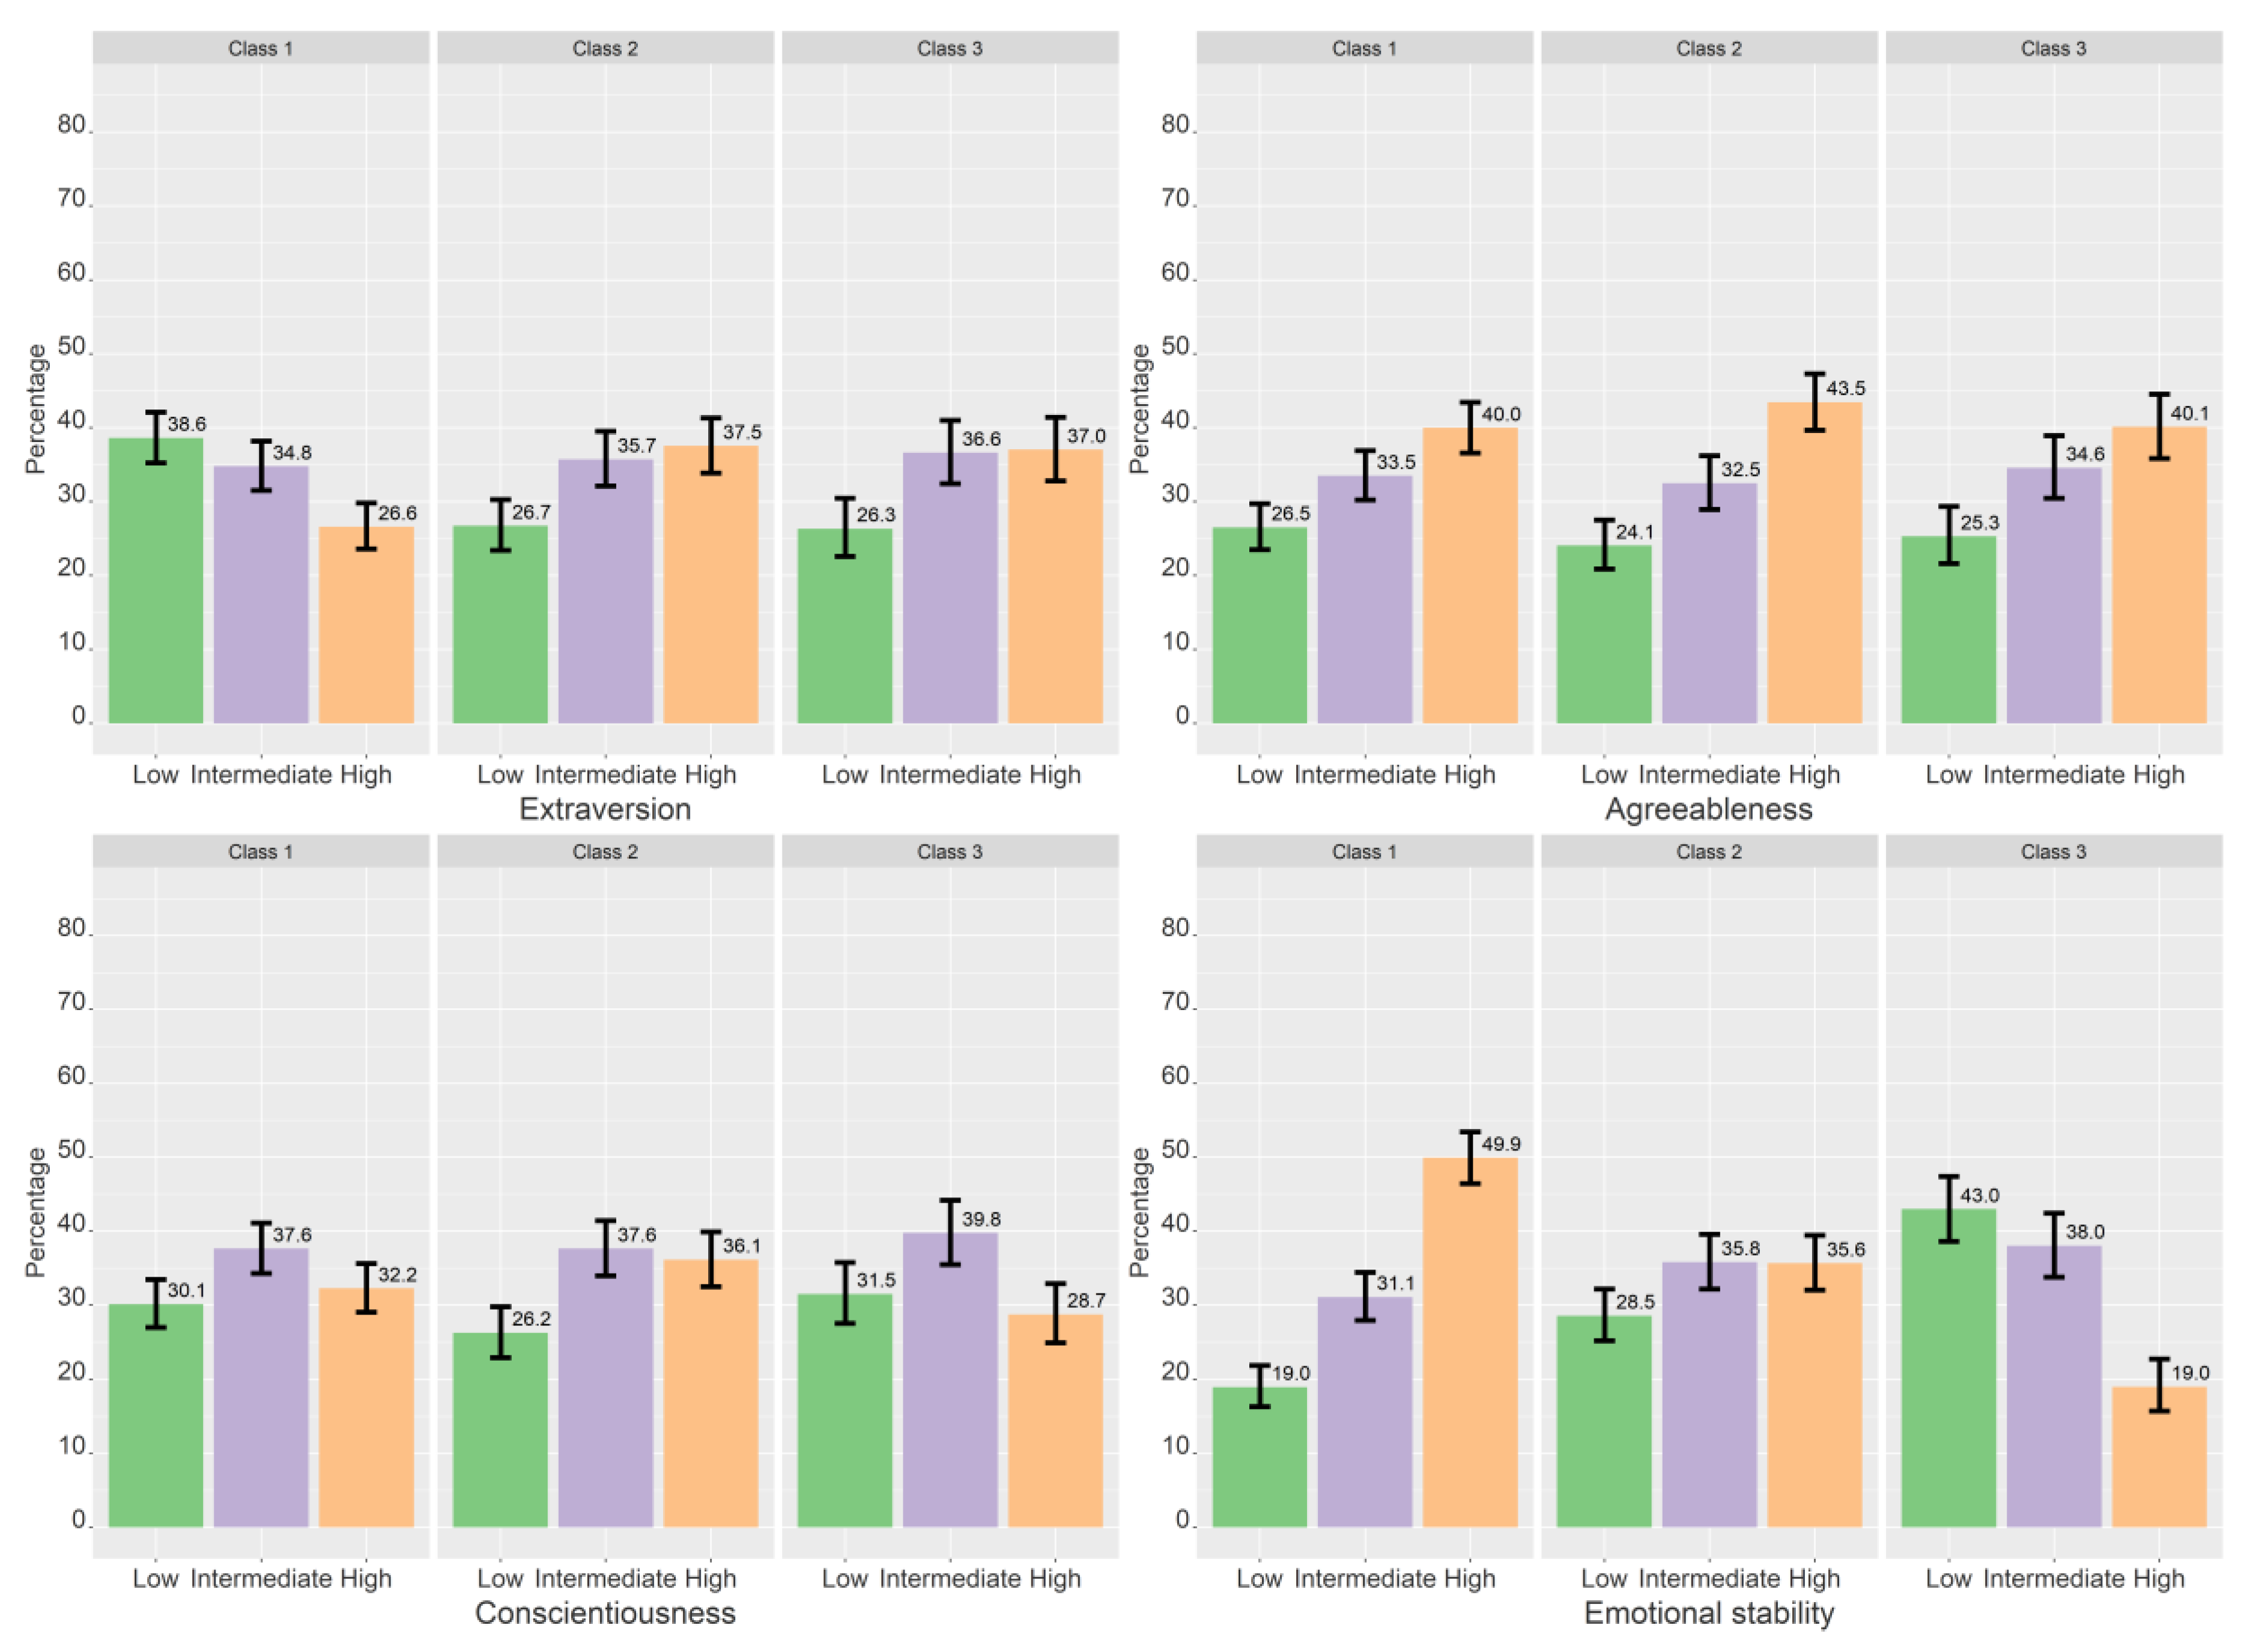
3.3.3. Personality
| Class 2 vs. Class 1 (Intermediate vs. Low Focus on Self-Presentation) | Controlled for Gender | Class 3 vs. Class 1 (High vs. Low Focus on Self-Presentation) | Controlled for Gender | Class 3 vs. Class 2 (High vs. Intermediate Focus on Self-Presentation) | Controlled for Gender | |
|---|---|---|---|---|---|---|
| Extraversion | ||||||
| Low | Ref. | Ref. | Ref. | Ref. | Ref. | Ref. |
| Intermediate | 1.49 (1.15–1.91) *** | 1.58 (1.22–2.05) **** | 1.54 (1.17–2.03) *** | 1.71 (1.28–2.31) **** | 0.92 (0.68–1.25) | 0.96 (0.70–1.31) |
| High | 2.04 (1.57–265) **** | 2.16 (1.65–2.83) **** | 2.04 (1.54–2.71) **** | 2.25 (1.66–3.05) **** | 0.95 (0.73–1.23) | 0.98 (0.75–1.28) |
| Agreeableness | ||||||
| Low | Ref. | Ref. | Ref. | Ref. | Ref. | Ref. |
| Intermediate | 1.07 (0.81–1.40) | 0.95 (0.71–1.25) | 1.08 (0.81–1.45) | 0.87 (0.63–1.19) | 1.02 (0.78–1.34) | 0.97 (0.73–1.27) |
| High | 1.20 (0.92–1.55) | 0.97 (0.74–1.27) | 1.05 (0.79–1.39) | 0.73 (0.53–0.99) * | 0.90 (0.67–1.20) | 0.78 (0.58–1.05) |
| Conscientiousness | ||||||
| Low | Ref. | Ref. | Ref. | Ref. | Ref. | Ref. |
| Intermediate | 1.15 (0.89–1.48) | 1.09 (0.84–1.42) | 1.01 (0.77–1.32) | 0.92 (0.69–1.23) | 0.91 (0.68–1.21) | 0.89 (0.66–1.19) |
| High | 1.29 (0.99–1.67) | 1.15 (0.88–1.51) | 0.85 (0.64–1.13) | 0.71 (0.52–0.96) | 0.69 (0.52–0.90) ** | 0.64 (0.49–0.85) *** |
| Emotional stability | ||||||
| Low | 2.11 (1.61–2.75) **** | 1.45 (1.09–1.93) * | 5.95 (4.39–8.06) **** | 3.24 (2.34–4.49) **** | 2.85 (2.03–4.02) **** | 2.20 (1.54–3.14) **** |
| Intermediate | 1.61 (1.27–2.05) **** | 1.29 (1.00–1.65) * | 3.21 (2.40–4.30) **** | 2.19 (1.61–2.98) **** | 1.70 (1.18–2.46) *** | 1.45 (1.00–2.10) |
| High | Ref. | Ref. | Ref. | Ref. | Ref. | Ref. |
| Openness | ||||||
| Low | Ref. | Ref. | Ref. | Ref. | Ref. | Ref. |
| Intermediate | 1.15 (0.89–1.48) | 1.15 (0.88–1.49) | 0.87 (0.67–1.14) | 0.87 (0.65–1.16) | 0.98 (0.74–1.29) | 0.97 (0.73–1.28) |
| High | 1.19 (0.90–1.58) | 1.28 (0.96–1.71) | 0.91 (0.68–1.23) | 1.03 (0.75–1.42) | 0.90 (0.68–1.19) | 0.94 (0.71–1.25) |


4. Discussion
4.1. Implications
4.2. Strengths and Limitations
5. Conclusions
Supplementary Materials
Author Contributions
Funding
Institutional Review Board Statement
Informed Consent Statement
Data Availability Statement
Acknowledgments
Conflicts of Interest
References
- Statista. Social Media & User-Generated Content. Available online: https://www.statista.com/statistics/272014/global-social-networks-ranked-by-number-of-users/ (accessed on 12 June 2022).
- Kietzmann, J.H.; Hermkens, K.; McCarthy, I.P.; Silvestre, B.S. Social media? Get serious! Understanding the functional building blocks of social media. Bus. Horiz. 2011, 54, 241–251. [Google Scholar] [CrossRef]
- Anderson, M.; Jiang, J. Teens, Social Media & Technology 2018; Pew Research Center: Washington, DC, USA, 2018. [Google Scholar]
- Medietilsynet. Barn og Medier 2020: En Kartlegging av 9-18-Åringers Digitale Medievaner; Medietilsynet: Fredrikstad, Norway, 2020. [Google Scholar]
- Bakken, A. Ungdata 2020: Nasjonale Resultater [Ungdata 2020: National Results]; 16/20; NOVA, OsloMet: Oslo, Norway, 2020; p. 24. [Google Scholar]
- Schønning, V.; Hjetland, G.J.; Aarø, L.E.; Skogen, J.C. Social Media Use and Mental Health and Well-Being Among Adolescents–A Scoping Review. Front. Psychol. 2020, 11, 1949. [Google Scholar] [CrossRef] [PubMed]
- Orben, A. Teenagers, screens and social media: A narrative review of reviews and key studies. Soc. Psychiatry Psychiatr. Epidemiol. 2020, 55, 407–414. [Google Scholar] [CrossRef]
- Appel, M.; Marker, C.; Gnambs, T. Are Social Media Ruining Our Lives? A Review of Meta-Analytic Evidence. Rev. Gen. Psychol. 2020, 24, 60–74. [Google Scholar] [CrossRef]
- Valkenburg, P.M.; Meier, A.; Beyens, I. Social media use and its impact on adolescent mental health: An umbrella review of the evidence. Curr. Opin. Psychol. 2022, 44, 58–68. [Google Scholar] [CrossRef]
- Keles, B.; McCrae, N.; Grealish, A. A systematic review: The influence of social media on depression, anxiety and psychological distress in adolescents. Int. J. Adolesc. Youth 2020, 25, 79–93. [Google Scholar] [CrossRef]
- Frison, E.; Eggermont, S. Exploring the relationships between different types of Facebook use, perceived online social support, and adolescents’ depressed mood. Soc. Sci. Comput. Rev. 2016, 34, 153–171. [Google Scholar] [CrossRef]
- Steinsbekk, S.; Wichstrøm, L.; Stenseng, F.; Nesi, J.; Hygen, B.W.; Skalická, V. The impact of social media use on appearance self-esteem from childhood to adolescence–A 3-wave community study. Comput. Hum. Behav. 2021, 114, 106528. [Google Scholar] [CrossRef]
- Kingsbury, M.; Reme, B.-A.; Skogen, J.C.; Sivertsen, B.; Øverland, S.; Cantor, N.; Hysing, M.; Petrie, K.; Colman, I. Differential associations between types of social media use and university students’ non-suicidal self-injury and suicidal behavior. Comput. Hum. Behav. 2021, 115, 106614. [Google Scholar] [CrossRef]
- Winstone, L.; Mars, B.; Haworth, C.M.; Heron, J.; Kidger, J. Adolescent social media user types and their mental health and well-being: Results from a longitudinal survey of 13–14-year-olds in the United Kingdom. JCPP Adv. 2022, 2, e12071. [Google Scholar] [CrossRef]
- Boniel-Nissim, M.; van den Eijnden, R.J.; Furstova, J.; Marino, C.; Lahti, H.; Inchley, J.; Šmigelskas, K.; Vieno, A.; Badura, P. International perspectives on social media use among adolescents: Implications for mental and social well-being and substance use. Comput. Hum. Behav. 2022, 129, 107144. [Google Scholar] [CrossRef]
- Jarman, H.K.; Marques, M.D.; McLean, S.A.; Slater, A.; Paxton, S.J. Motivations for social media use: Associations with social media engagement and body satisfaction and well-being among adolescents. J. Youth Adolesc. 2021, 50, 2279–2293. [Google Scholar] [CrossRef] [PubMed]
- Woods, H.C.; Scott, H. #Sleepyteens: Social media use in adolescence is associated with poor sleep quality, anxiety, depression and low self-esteem. J. Adolesc. 2016, 51, 41–49. [Google Scholar] [CrossRef]
- de Vries, D.A.; Peter, J.; Nikken, P.; de Graaf, H. The effect of social network site use on appearance investment and desire for cosmetic surgery among adolescent boys and girls. Sex Roles 2014, 71, 283–295. [Google Scholar] [CrossRef]
- Bekalu, M.A.; McCloud, R.F.; Viswanath, K. Association of social media use with social well-being, positive mental health, and self-rated health: Disentangling routine use from emotional connection to use. Health Educ. Behav. 2019, 46, 69S–80S. [Google Scholar] [CrossRef]
- Neira, C.J.; Barber, B.L. Social networking site use: Linked to adolescents’ social self-concept, self-esteem, and depressed mood. Aust. J. Psychol. 2014, 66, 56–64. [Google Scholar] [CrossRef]
- Verduyn, P.; Lee, D.S.; Park, J.; Shablack, H.; Orvell, A.; Bayer, J.; Ybarra, O.; Jonides, J.; Kross, E. Passive Facebook usage undermines affective well-being: Experimental and longitudinal evidence. J. Exp. Psychol. Gen. 2015, 144, 480. [Google Scholar] [CrossRef]
- Verduyn, P.; Ybarra, O.; Résibois, M.; Jonides, J.; Kross, E. Do social network sites enhance or undermine subjective well-being? A critical review. Soc. Issues Policy Rev. 2017, 11, 274–302. [Google Scholar] [CrossRef]
- Beyens, I.; Pouwels, J.L.; van Driel, I.I.; Keijsers, L.; Valkenburg, P.M. The effect of social media on well-being differs from adolescent to adolescent. Sci. Rep. 2020, 10, 10763. [Google Scholar] [CrossRef]
- Subrahmanyam, K.; Šmahel, D. Constructing identity online: Identity exploration and self-presentation. In Digital Youth; Springer: New York, NY, USA, 2011; pp. 59–80. [Google Scholar]
- Nesi, J.; Prinstein, M.J. Using social media for social comparison and feedback-seeking: Gender and popularity moderate associations with depressive symptoms. J. Abnorm. Child Psychol. 2015, 43, 1427–1438. [Google Scholar] [CrossRef]
- Kross, E.; Verduyn, P.; Sheppes, G.; Costello, C.K.; Jonides, J.; Ybarra, O. Social media and well-being: Pitfalls, progress, and next steps. Trends Cogn. Sci. 2020, 25, 55–66. [Google Scholar] [CrossRef]
- Twomey, C.; O’Reilly, G. Associations of self-presentation on Facebook with mental health and personality variables: A systematic review. Cyberpsychol. Behav. Soc. Netw. 2017, 20, 587–595. [Google Scholar] [CrossRef]
- Scully, M.; Swords, L.; Nixon, E. Social comparisons on social media: Online appearance-related activity and body dissatisfaction in adolescent girls. Ir. J. Psychol. Med. 2020, 1–12. [Google Scholar] [CrossRef]
- Spitzer, E.G.; Crosby, E.S.; Witte, T.K. Looking through a filtered lens: Negative social comparison on social media and suicidal ideation among young adults. Psychol. Pop. Media 2022. [Google Scholar] [CrossRef]
- Nadkarni, A.; Hofmann, S.G. Why do people use Facebook? Personal. Individ. Differ. 2012, 52, 243–249. [Google Scholar] [CrossRef]
- Goffman, E. The Presentation of Self in Everyday Life; Anchor: Harmondsworth, UK, 1978; Volume 21. [Google Scholar]
- Bazarova, N.N.; Choi, Y.H. Self-disclosure in social media: Extending the functional approach to disclosure motivations and characteristics on social network sites. J. Commun. 2014, 64, 635–657. [Google Scholar] [CrossRef]
- Leary, M.R. Self-Presentation: Impression Management and Interpersonal Behavior; Routledge: Milton Park, UK, 2019. [Google Scholar]
- Walther, J.B.; Whitty, M.T. Language, psychology, and new new media: The hyperpersonal model of mediated communication at twenty-five years. J. Lang. Soc. Psychol. 2021, 40, 120–135. [Google Scholar] [CrossRef]
- Walther, J.B. Computer-mediated communication: Impersonal, interpersonal, and hyperpersonal interaction. Commun. Res. 1996, 23, 3–43. [Google Scholar] [CrossRef]
- Firth, J.; Torous, J.; Stubbs, B.; Firth, J.A.; Steiner, G.Z.; Smith, L.; Alvarez-Jimenez, M.; Gleeson, J.; Vancampfort, D.; Armitage, C.J. The “online brain”: How the Internet may be changing our cognition. World Psychiatry 2019, 18, 119–129. [Google Scholar] [CrossRef]
- Nesi, J.; Prinstein, M.J. In search of likes: Longitudinal associations between adolescents’ digital status seeking and health-risk behaviors. J. Clin. Child Adolesc. Psychol. 2018, 48, 740–748. [Google Scholar] [CrossRef] [PubMed]
- Reinecke, L.; Trepte, S. Authenticity and well-being on social network sites: A two-wave longitudinal study on the effects of online authenticity and the positivity bias in SNS communication. Comput. Hum. Behav. 2014, 30, 95–102. [Google Scholar] [CrossRef]
- Festinger, L. A theory of social comparison processes. Hum. Relat. 1954, 7, 117–140. [Google Scholar] [CrossRef]
- Chou, H.-T.G.; Edge, N. “They are happier and having better lives than I am”: The impact of using Facebook on perceptions of others’ lives. Cyberpsychol. Behav. Soc. Netw. 2012, 15, 117–121. [Google Scholar] [CrossRef] [PubMed]
- Castellacci, F.; Tveito, V. Internet use and well-being: A survey and a theoretical framework. Res. Policy 2018, 47, 308–325. [Google Scholar] [CrossRef]
- Moroney, E.; Lee, S.S.; Ebbert, A.M.; Luthar, S.S. Digital media use frequency, online behaviors, and risk for negative mental health in adolescents in high-achieving schools. Clin. Child Psychol. Psychiatry 2022, 13591045221108834. [Google Scholar] [CrossRef]
- Skogen, J.C.; Hjetland, G.J.; Bøe, T.; Hella, R.T.; Knudsen, A.K. Through the Looking Glass of Social Media. Focus on Self-Presentation and Association with Mental Health and Quality of Life. A Cross-Sectional Survey-Based Study; Norwegian Institute of Public Health: Oslo, Norway, 2021; p. 3319. [Google Scholar]
- Gentile, B.; Twenge, J.M.; Freeman, E.C.; Campbell, W.K. The effect of social networking websites on positive self-views: An experimental investigation. Comput. Hum. Behav. 2012, 28, 1929–1933. [Google Scholar] [CrossRef]
- Gonzales, A.L.; Hancock, J.T. Mirror, mirror on my Facebook wall: Effects of exposure to Facebook on self-esteem. Cyberpsychol. Behav. Soc. Netw. 2011, 14, 79–83. [Google Scholar] [CrossRef]
- Toma, C.L.; Hancock, J.T. Self-affirmation underlies Facebook use. Personal. Soc. Psychol. Bull. 2013, 39, 321–331. [Google Scholar] [CrossRef]
- Cohen, G.L.; Sherman, D.K. The psychology of change: Self-affirmation and social psychological intervention. Annu. Rev. Psychol. 2014, 65, 333–371. [Google Scholar] [CrossRef]
- Steele, C.M. The psychology of self-affirmation: Sustaining the integrity of the self. In Advances in Experimental Social Psychology; Elsevier: Amsterdam, The Netherlands, 1988; Volume 21, pp. 261–302. [Google Scholar]
- Escobar-Viera, C.; Shensa, A.; Hamm, M.; Melcher, E.M.; Rzewnicki, D.I.; Egan, J.E.; Sidani, J.E.; Primack, B.A. “I Don’t Feel Like the Odd One”: Utilizing Content Analysis to Compare the Effects of Social Media Use on Well-Being Among Sexual Minority and Nonminority US Young Adults. Am. J. Health Promot. 2020, 34, 285–293. [Google Scholar] [CrossRef]
- Nesi, J.; Choukas-Bradley, S.; Maheux, A.J.; Roberts, S.R.; Sanzari, C.M.; Widman, L.; Prinstein, M.J. Selfie appearance investment and peer feedback concern: Multimethod investigation of adolescent selfie practices and adjustment. Psychol. Pop. Media 2021, 10, 488. [Google Scholar] [CrossRef]
- McCrae, R.R.; Costa, P.T., Jr. Personality trait structure as a human universal. Am. Psychol. 1997, 52, 509. [Google Scholar] [CrossRef]
- John, O.P.; Srivastava, S. The Big Five trait taxonomy: History, measurement, and theoretical perspectives. In Handbook of Personality: Theory and Research; Pervin, L.A., John, O.P., Eds.; Guilford Press: New York, NY, USA, 1999; pp. 102–138. [Google Scholar]
- Costa, P.T., Jr.; McCrae, R.R. The five-factor model of personality and its relevance to personality disorders. J. Personal. Disord. 1992, 6, 343–359. [Google Scholar] [CrossRef]
- Seidman, G. Self-presentation and belonging on Facebook: How personality influences social media use and motivations. Personal. Individ. Differ. 2013, 54, 402–407. [Google Scholar] [CrossRef]
- Ashton, M.C.; Lee, K.; Paunonen, S.V. What is the central feature of extraversion? Social attention versus reward sensitivity. J. Personal. Soc. Psychol. 2002, 83, 245. [Google Scholar] [CrossRef]
- Zywica, J.; Danowski, J. The faces of Facebookers: Investigating social enhancement and social compensation hypotheses; predicting Facebook™ and offline popularity from sociability and self-esteem, and mapping the meanings of popularity with semantic networks. J. Comput.-Mediat. Commun. 2008, 14, 1–34. [Google Scholar] [CrossRef]
- Correa, T.; Hinsley, A.W.; De Zuniga, H.G. Who interacts on the Web?: The intersection of users’ personality and social media use. Comput. Hum. Behav. 2010, 26, 247–253. [Google Scholar] [CrossRef]
- Sandercock, G.R.; Alibrahim, M.; Bellamy, M. Media device ownership and media use: Associations with sedentary time, physical activity and fitness in English youth. Prev. Med. Rep. 2016, 4, 162–168. [Google Scholar] [CrossRef]
- Carlson, S.A.; Fulton, J.E.; Lee, S.M.; Foley, J.T.; Heitzler, C.; Huhman, M. Influence of limit-setting and participation in physical activity on youth screen time. Pediatrics 2010, 126, e89–e96. [Google Scholar] [CrossRef] [PubMed]
- Buda, G.; Lukoševičiūtė, J.; Šalčiūnaitė, L.; Šmigelskas, K. Possible effects of social media use on adolescent health behaviors and perceptions. Psychol. Rep. 2021, 124, 1031–1048. [Google Scholar] [CrossRef]
- Kim, S.-E.; Kim, J.-W.; Jee, Y.-S. Relationship between smartphone addiction and physical activity in Chinese international students in Korea. J. Behav. Addict. 2015, 4, 200–205. [Google Scholar] [CrossRef] [PubMed]
- Hjetland, G.J.; Schønning, V.; Hella, R.T.; Veseth, M.; Skogen, J.C. How do Norwegian adolescents experience the role of social media in relation to mental health and well-being: A qualitative study. BMC Psychol. 2021, 9, 78. [Google Scholar] [CrossRef] [PubMed]
- Gosling, S.D.; Rentfrow, P.J.; Swann, W.B., Jr. A very brief measure of the Big-Five personality domains. J. Res. Personal. 2003, 37, 504–528. [Google Scholar] [CrossRef]
- Eisinga, R.; Grotenhuis, M.t.; Pelzer, B. The reliability of a two-item scale: Pearson, Cronbach, or Spearman-Brown? Int. J. Public Health 2013, 58, 637–642. [Google Scholar] [CrossRef]
- Selker, R.; Love, J.; Dropmann, D.; Moreno, V. The ‘jamovi’ Analyses. 2021. Available online: https://cran.r-project.org/web/packages/jmv/jmv.pdf (accessed on 12 June 2022).
- Rosseel, Y. Lavaan: An R package for structural equation modeling and more. Version 0.5–12 (BETA). J. Stat. Softw. 2012, 48, 1–36. [Google Scholar] [CrossRef]
- Weller, B.E.; Bowen, N.K.; Faubert, S.J. Latent class analysis: A guide to best practice. J. Black Psychol. 2020, 46, 287–311. [Google Scholar] [CrossRef]
- Porcu, M.; Giambona, F. Introduction to latent class analysis with applications. J. Early Adolesc. 2017, 37, 129–158. [Google Scholar] [CrossRef]
- Dziak, J.J.; Coffman, D.L.; Lanza, S.T.; Li, R.; Jermiin, L.S. Sensitivity and specificity of information criteria. Brief. Bioinform. 2020, 21, 553–565. [Google Scholar] [CrossRef]
- Linzer, D.A.; Lewis, J.B. poLCA: An R package for polytomous variable latent class analysis. J. Stat. Softw. 2011, 42, 1–29. [Google Scholar] [CrossRef]
- Muthén, L.K.; Muthén, B.O. Mplus User’s Guide, 8th ed.; Muthén & Muthén: Los Angeles, CA, USA, 2017. [Google Scholar]
- Venables, W.N.; Ripley, B.D. Modern Applied Statistics with S, 4th ed.; Springer: New York, NY, USA, 2002. [Google Scholar]
- Shaw, C.M.; Edwards, R. Self-concepts and self-presentations of males and females: Similarities and Differences. Commun. Rep. 1997, 10, 55–62. [Google Scholar] [CrossRef]
- Haferkamp, N.; Eimler, S.C.; Papadakis, A.-M.; Kruck, J.V. Men are from Mars, women are from Venus? Examining gender differences in self-presentation on social networking sites. Cyberpsychol. Behav. Soc. Netw. 2012, 15, 91–98. [Google Scholar] [CrossRef] [PubMed]
- Tifferet, S.; Vilnai-Yavetz, I. Gender differences in Facebook self-presentation: An international randomized study. Comput. Hum. Behav. 2014, 35, 388–399. [Google Scholar] [CrossRef]
- Tjora, T.; Skogen, J.C.; Sivertsen, B. Increasing similarities between young adults’ smoking and snus use in Norway: A study of the trends and stages of smoking and snus epidemic from 2010 to 2018. BMC Public Health 2020, 20, 1511. [Google Scholar] [CrossRef]
- Kyrrestad, H.; Mabille, G.; Adolfsen, F.; Koposov, R.; Martinussen, M. Gender differences in alcohol onset and drinking frequency in adolescents: An application of the theory of planned behavior. Drugs Educ. Prev. Policy 2022, 29, 21–31. [Google Scholar] [CrossRef]
- Weisberg, Y.J.; DeYoung, C.G.; Hirsh, J.B. Gender differences in personality across the ten aspects of the Big Five. Front. Psychol. 2011, 2, 178. [Google Scholar] [CrossRef]
- Watkins, M.W. Exploratory factor analysis: A guide to best practice. J. Black Psychol. 2018, 44, 219–246. [Google Scholar] [CrossRef]
- Brown, T.A.; Moore, M.T. Confirmatory factor analysis. In Handbook of Structural Equation Modeling; Oxford University Press: Oxford, UK, 2012; pp. 361–379. [Google Scholar]
- Lanza, S.T.; Rhoades, B.L. Latent class analysis: An alternative perspective on subgroup analysis in prevention and treatment. Prev. Sci. 2013, 14, 157–168. [Google Scholar] [CrossRef]
- Bargh, J.A.; McKenna, K.Y.; Fitzsimons, G.M. Can you see the real me? Activation and expression of the “true self” on the Internet. J. Soc. Issues 2002, 58, 33–48. [Google Scholar] [CrossRef]
- Campbell, A.J.; Cumming, S.R.; Hughes, I. Internet use by the socially fearful: Addiction or therapy? Cyberpsychol. Behav. 2006, 9, 69–81. [Google Scholar] [CrossRef]
- Valkenburg, P.M.; Peter, J. Preadolescents’ and adolescents’ online communication and their closeness to friends. Dev. Psychol. 2007, 43, 267. [Google Scholar] [CrossRef] [Green Version]
- Attrill, A. The Manipulation of Online Self-Presentation: Create, Edit, Re-Edit and Present; Palgrave Macmillan: London, UK, 2015. [Google Scholar]
- Reed, P.; Saunders, J. Sex differences in online assertive self-presentation strategies. Personal. Individ. Differ. 2020, 166, 110214. [Google Scholar] [CrossRef]
- Cyranowski, J.M.; Frank, E.; Young, E.; Shear, M.K. Adolescent onset of the gender difference in lifetime rates of major depression: A theoretical model. Arch. Gen. Psychiatry 2000, 57, 21–27. [Google Scholar] [CrossRef] [PubMed]
- Rudolph, K.D.; Hammen, C. Age and gender as determinants of stress exposure, generation, and reactions in youngsters: A transactional perspective. Child Dev. 1999, 70, 660–677. [Google Scholar] [CrossRef]
- Orben, A.; Dienlin, T.; Przybylski, A.K. Social media’s enduring effect on adolescent life satisfaction. Proc. Natl. Acad. Sci. 2019, 116, 10226–10228. [Google Scholar] [CrossRef] [PubMed]
- Sun, X.; Duan, C.; Yao, L.; Zhang, Y.; Chinyani, T.; Niu, G. Socioeconomic status and social networking site addiction among children and adolescents: Examining the roles of parents’ active mediation and ICT attitudes. Comput. Educ. 2021, 173, 104292. [Google Scholar] [CrossRef]
- Rideout, V.; Robb, M.B. The Common Sense Census: Media Use by Tweens and Teens; Common Sense Media: San Francisco, CA, USA, 2019. [Google Scholar]
- Fullwood, C.; James, B.M.; Chen-Wilson, C.-H. Self-concept clarity and online self-presentation in adolescents. Cyberpsychol. Behav. Soc. Netw. 2016, 19, 716–720. [Google Scholar] [CrossRef] [PubMed]
- Michikyan, M. Linking online self-presentation to identity coherence, identity confusion, and social anxiety in emerging adulthood. Br. J. Dev. Psychol. 2020, 38, 543–565. [Google Scholar] [CrossRef]
- Huang, C. Social network site use and Big Five personality traits: A meta-analysis. Comput. Hum. Behav. 2019, 97, 280–290. [Google Scholar] [CrossRef]
- Lönnqvist, J.-E.; große Deters, F. Facebook friends, subjective well-being, social support, and personality. Comput. Hum. Behav. 2016, 55, 113–120. [Google Scholar] [CrossRef]
- Gil de Zúñiga, H.; Diehl, T.; Huber, B.; Liu, J. Personality traits and social media use in 20 countries: How personality relates to frequency of social media use, social media news use, and social media use for social interaction. Cyberpsychol. Behav. Soc. Netw. 2017, 20, 540–552. [Google Scholar] [CrossRef] [Green Version]
- Liu, D.; Campbell, W.K. The Big Five personality traits, Big Two metatraits and social media: A meta-analysis. J. Res. Personal. 2017, 70, 229–240. [Google Scholar] [CrossRef]
- Meeus, A.; Beullens, K.; Eggermont, S. Like me (please?): Connecting online self-presentation to pre-and early adolescents’ self-esteem. New Media Soc. 2019, 21, 2386–2403. [Google Scholar] [CrossRef]
- Kim, J.; Lee, J.-E.R. The Facebook paths to happiness: Effects of the number of Facebook friends and self-presentation on subjective well-being. Cyberpsychol. Behav. Soc. Netw. 2011, 14, 359–364. [Google Scholar] [CrossRef]
- Hollenbaugh, E.E. Self-presentation in social media: Review and research opportunities. Rev. Commun. Res. 2021, 9, 80–98. [Google Scholar]
- Taber, L.; Whittaker, S. “On Finsta, I can say ‘Hail Satan’”: Being Authentic but Disagreeable on Instagram. In Proceedings of the 2020 CHI Conference on Human Factors in Computing Systems, Honolulu, HI, USA, 25–30 April 2020; pp. 1–14. [Google Scholar]
- Choi, S.; Williams, D.; Kim, H. A snap of your true self: How self-presentation and temporal affordance influence self-concept on social media. New Media Soc. 2020, 1461444820977199. [Google Scholar] [CrossRef]
- Knudsen, A.K.; Hotopf, M.; Skogen, J.C.; Øverland, S.; Mykletun, A. The health status of nonparticipants in a population-based health study: The Hordaland Health Study. Am. J. Epidemiol. 2010, 172, 1306–1314. [Google Scholar] [CrossRef]
- Statistics Norway. Nøkkeltall fra 2020 [Key Figures from 2020]; Statistics Norway: Oslo, Norway, 2022. [Google Scholar]
- Kolesnyk, D.; de Jong, M.G.; Pieters, R. Gender Gaps in Deceptive Self-Presentation on Social-Media Platforms Vary with Gender Equality: A Multinational Investigation. Psychol. Sci. 2021, 32, 1952–1964. [Google Scholar] [CrossRef]
- Hawes, T.; Zimmer-Gembeck, M.J.; Campbell, S.M. Unique associations of social media use and online appearance preoccupation with depression, anxiety, and appearance rejection sensitivity. Body Image 2020, 33, 66–76. [Google Scholar] [CrossRef]
- McLean, S.A.; Paxton, S.J.; Wertheim, E.H.; Masters, J. Photoshopping the selfie: Self photo editing and photo investment are associated with body dissatisfaction in adolescent girls. Int. J. Eat. Disord. 2015, 48, 1132–1140. [Google Scholar] [CrossRef]
- Maheux, A.J.; Roberts, S.R.; Nesi, J.; Widman, L.; Choukas-Bradley, S. Longitudinal associations between appearance-related social media consciousness and adolescents’ depressive symptoms. J. Adolesc. 2022, 94, 264–269. [Google Scholar] [CrossRef]


| Boys (N = 899, 44%) | Girls (N = 1124, 56%) | Total (N = 2023) | p-Value | |
|---|---|---|---|---|
| Age * | ||||
| Mean (SD) | 17.32 (0.85) | 17.38 (0.85) | 17.36 (0.85) | 0.133 |
| Study year§ | ||||
| 1 | 16 (1.8%) | 8 (0.7%) | 24 (1.2%) | 0.005 |
| 2 | 493 (55.2%) | 566 (50.5%) | 1059 (52.9%) | |
| 3 | 384 (43.0%) | 547 (48.8%) | 931 (45.2%) | |
| Type of study§ | ||||
| Study preparation | 674 (75.2%) | 966 (86.0%) | 1640 (81.2%) | <0.001 |
| Vocational | 222 (24.8%) | 157 (14.0%) | 379 (18.8%) | |
| Country of birth§ | ||||
| Norway | 819 (91.3%) | 1005 (89.4%) | 1824 (90.2%) | 0.154 |
| Other country | 78 (8.7%) | 119 (10.6%) | 197 (9.8%) | |
| Self-reported SES | ||||
| Mean (SD) | 7.43 (1.76) | 6.98 (1.75) | 7.18 (1.77) | <0.001 |
| Boys (N = 899) | Girls (N = 1124) | Total (N = 2023) | p-Value | |
|---|---|---|---|---|
| Frequency of use | ||||
| Daily or less | 226 (25.51%) | 190 (16.95%) | 416 (20.73%) | <0.001 |
| Many times a day | 439 (49.55%) | 582 (51.92%) | 1021 (50.87%) | |
| Almost constantly | 221 (24.94%) | 349 (31.13%) | 570 (28.40%) | |
| Duration of use | ||||
| <2 h | 320 (36.32%) | 246 (22.02%) | 566 (28.33%) | <0.001 |
| 2–4 h | 326 (37.00%) | 402 (35.99%) | 728 (36.44%) | |
| 4–5 h | 134 (15.21%) | 284 (25.43%) | 418 (20.92%) | |
| >5 h | 101 (11.46%) | 185 (16.56%) | 286 (14.31%) |
| Number of Classes | AIC | BIC | Relative Entropy | LMR-LR |
|---|---|---|---|---|
| 1 | 34,358.99 | 34,526.14 | - | - |
| 2 | 29,549.39 | 29,914.30 | 0.904 | p < 0.001 |
| 3 | 28,306.27 | 28,788.93 | 0.879 | p < 0.001 |
| 4 | 27,902.47 | 28,547.89 | 0.878 | p < 0.759 |
| 5 | 27,687.25 | 28,495.43 | 0.877 | p < 0.759 |
| Class 1 (n = 839, 42%) | Class 2 (n = 671; 33%) | Class 3 (n = 513; 25%) | |
|---|---|---|---|
| 7.5% | 38.3% | 80.4% |
| <1.0% | 38.7% | 98.8% |
| <1.0% | 24.0% | 94.5% |
| <1.0% | 5.7% | 50.4% |
| <1.0% | 5.1% | 29.3% |
| 20.9% | 46.0% | 81.1% |
| 8.6% | 27.7% | 76.5% |
Publisher’s Note: MDPI stays neutral with regard to jurisdictional claims in published maps and institutional affiliations. |
© 2022 by the authors. Licensee MDPI, Basel, Switzerland. This article is an open access article distributed under the terms and conditions of the Creative Commons Attribution (CC BY) license (https://creativecommons.org/licenses/by/4.0/).
Share and Cite
Hjetland, G.J.; Finserås, T.R.; Sivertsen, B.; Colman, I.; Hella, R.T.; Skogen, J.C. Focus on Self-Presentation on Social Media across Sociodemographic Variables, Lifestyles, and Personalities: A Cross-Sectional Study. Int. J. Environ. Res. Public Health 2022, 19, 11133. https://doi.org/10.3390/ijerph191711133
Hjetland GJ, Finserås TR, Sivertsen B, Colman I, Hella RT, Skogen JC. Focus on Self-Presentation on Social Media across Sociodemographic Variables, Lifestyles, and Personalities: A Cross-Sectional Study. International Journal of Environmental Research and Public Health. 2022; 19(17):11133. https://doi.org/10.3390/ijerph191711133
Chicago/Turabian StyleHjetland, Gunnhild Johnsen, Turi Reiten Finserås, Børge Sivertsen, Ian Colman, Randi Træland Hella, and Jens Christoffer Skogen. 2022. "Focus on Self-Presentation on Social Media across Sociodemographic Variables, Lifestyles, and Personalities: A Cross-Sectional Study" International Journal of Environmental Research and Public Health 19, no. 17: 11133. https://doi.org/10.3390/ijerph191711133