
Reliability Analysis of Observation-Based Exposure Assessment Tools for the Upper Extremities: A Systematic Review

 ,
,
Abstract
:1. Introduction
2. Methods
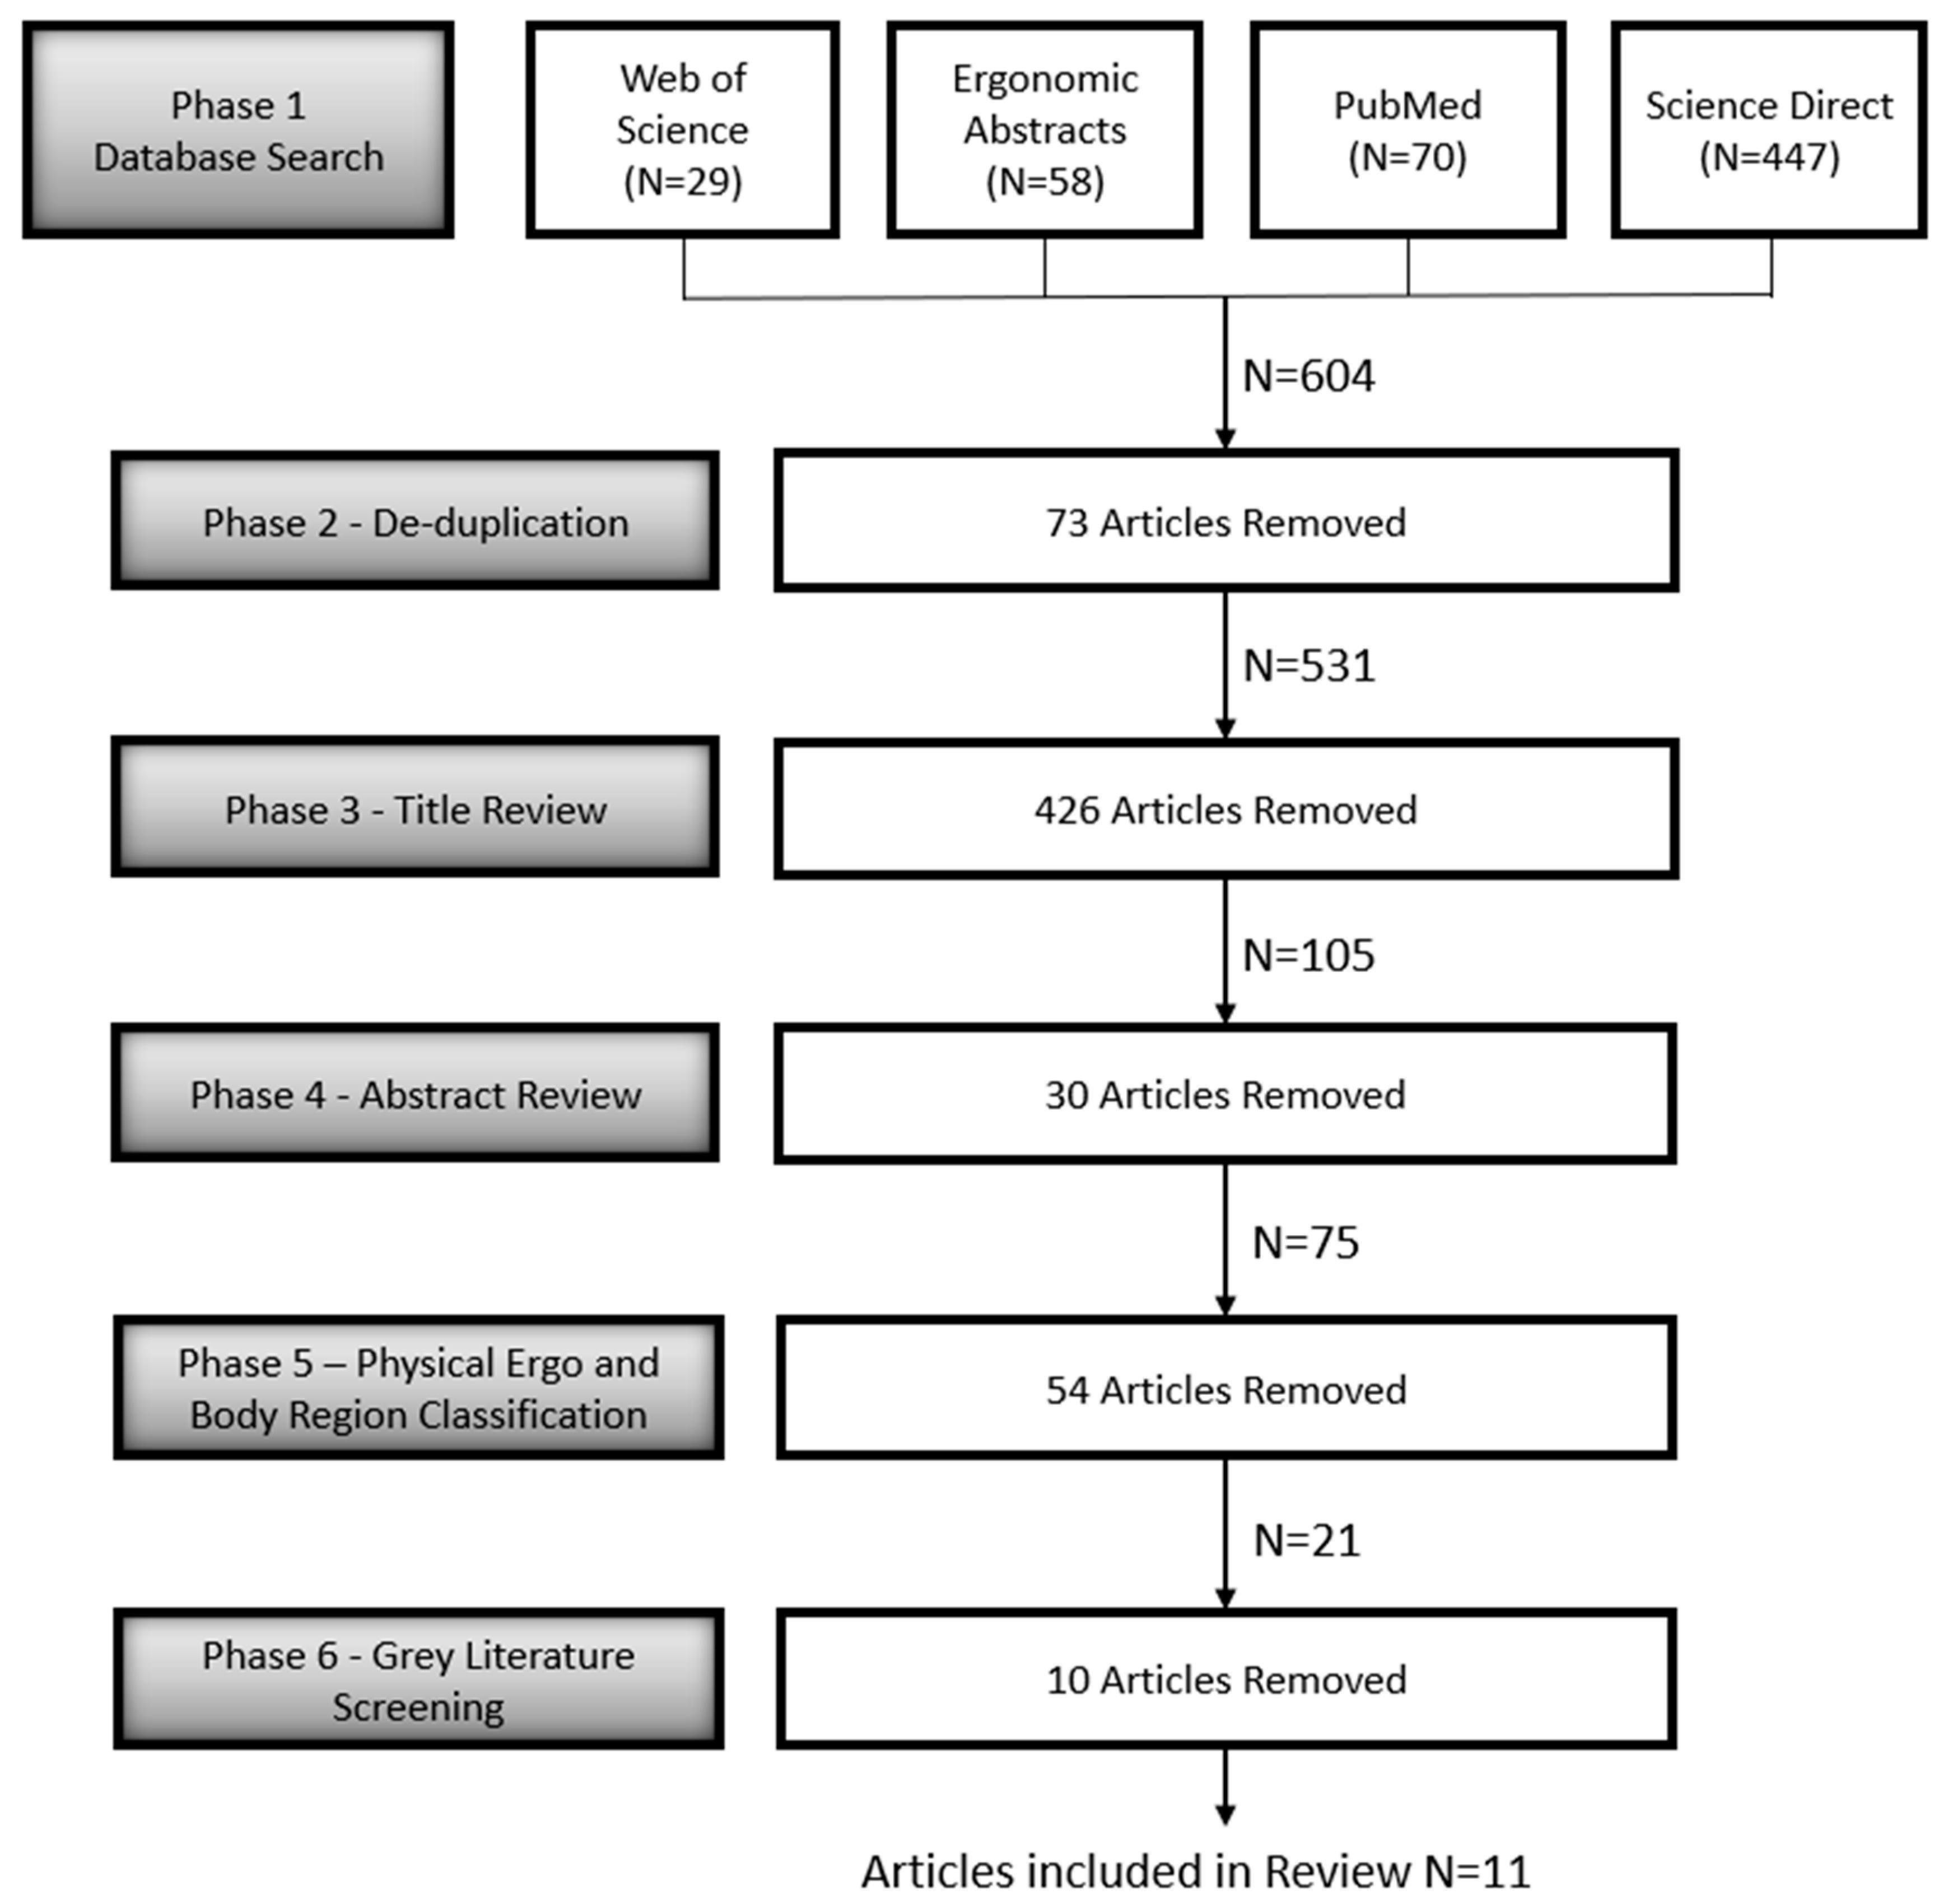
2.1. Article Database Selection and Search Strings
2.2. Article Review Process
3. Results
3.1. Observational Measurement Technique: Field Observations vs. Video Recordings
3.2. Sample Size and Raters
3.3. Reliability Coefficients

| Author (Year) | Title | Industry | Stated Objective |
|---|---|---|---|
| Neumann et al. (1998) [46] | A participative field study of the inter-rater reliability of a risk factor assessment checklist used by manufacturing plant personnel | Foam manufacturing. | The purpose of this study was to evaluate the inter-rater reliability of the Manufacturing Operation Risk Factor Checklist (MORF) in a realistic field implementation. |
| Dockrell et al. (2012) [38] | An investigation of the reliability of Rapid Upper Limb Assessment (RULA) as a method of assessment of children’s computing posture | Elementary school. | The objectives were to (1) to establish the inter-rater reliability of RULA in children (2) to establish intra-rater reliability of RULA in children (3) to investigate the association, if any, between child’s age and reliability of RULA. |
| Rhen and Forsman (2020) [34] | Inter- and intra-rater reliability of the OCRA checklist method in video-recorded manual work tasks | Grocery and cashier work, meat deboning and netting, engine assembly, lavatory and stair cleaning, post-sorting, and hairdressing. | The objectives were to, with respect to risk factors and calculated risk levels, study the consistency of (1) assessments performed by different ergonomists (inter-rater reliability) and (2) repeated assessments performed by each of the ergonomists (intra-rater reliability) of the Occupational Repetitive Actions (OCRA) checklist. |
| Paulsen et al. (2014) [40] | Inter-rater reliability of cyclic and non-cyclic task assessment using the hand activity level in appliance manufacturing | House appliance manufacturing. | The purpose of this study was to compare the inter-rater reliability of the HAL assessments used to estimate worker exposure to repetitive hand extensions during cyclic and non-cyclic task performance in the appliance manufacturing industry. |
| Stevens et al. (2004) [29] | Inter-rater reliability of the Strain Index | Videos were selected from an archive to provide a full spectrum of rating categories for the task variables of the Strain Index. | The purpose of this study was to evaluate the inter-rater reliability of the Strain Index. |
| Dartt et al. (2009) [37] | Reliability of assessing upper limb postures among workers performing manufacturing tasks | Appliance manufacturing. | The purpose of this study was to determine the inter- and intra-rater reliability of assessing neck, shoulder, and wrist postures by using the Multimedia Video Task Analysis (MVTA) |
| Valentim et al. (2018) [41] | Reliability, Construct Validity, and Interpretability of the Brazilian version of the Rapid Upper Limb Assessment (RULA) and Strain Index (SI) | Textile industry, electronics industry, assembling line, tinsmith and sawmills, self-employed workers (hairdresser, dentist, beautician, woodworker, butcher, bricklayer, etc.). | The study aimed to cross-culturally adapt and test the measurement properties of the RULA and the Strain Index. |
| Stephens et al. (2006) [26] | Test–retest repeatability of the Strain Index | Manufacturing, meat/poultry, manual material handling. | The purpose pf this study was to investigate the test-retest repeatability of the Strain Index. |
| Paulsen et al. (2015) [16] | The inter-rater reliability of Strain Index and OCRA Checklist task assessments in cheese processing | Cheese manufacturing. | The purpose of this study was to characterize the inter-rater reliability of two physical exposure assessment methods of the upper extremity, the Strain Index, and OCRA checklist. |
| Hollak et al. (2014) [39] | Towards a comprehensive Functional Capacity Evaluation for hand function | More than 180 different occupations. | The purpose of this study was to develop a more efficient (shortened) protocol for hand function capacity evaluation and to test the agreement of the protocol compared to the original protocol. |
| Coenen et al. (2014) [36] | Validity and inter-observer reliability of subjective hand-arm vibration assessments | Laboratory. | Measuring hand-arm vibration objectively is often difficult and expensive, while often used information provided by manufacturers lack detail. Therefore, this study aimed to test a subjective hand-arm vibration assessment method for validity and inter-observer reliability. |
| Author (Year) | Number of Participants | Participant Demographics | Rater Training | Rater Characteristics |
|---|---|---|---|---|
| Neumann et al. (1998) [46] | 8 | N.A. | 7–10 h of training on the use of the checklist. | Plant ergonomic committee members. |
| Dockrell et al. (2012) [38] | 24 | Children | Raters were given 45 min training sessions including a lecture and demonstration using PowerPoint on Rapid Upper Limb Assessment (RULA). It was followed by a practical session where they used the tool and compared and discussed their ratings. | Undergraduate physiotherapy students and experienced physiotherapists. Mean age of students = 22.2 years (range = 21–24. The mean age of therapists = 37.3 years (range = 31–45). |
| Rhen and Forsman (2020) [34] | One voluntary worker for each job filmed | N.A. | Raters were given a 25 min lecture and an Internet-based education on Occupational Repetitive Actions (OCRA), which included background, application, and a demonstration. | Licensed female physiotherapists with more than 4 years ergo experience as professional ergonomists |
| Paulsen et al. (2014) [40] | 385 workers | Mean age = 42.3 years (SD = 10.6). Average experience = 14.7 years (SD = 11.4); 91.5% were white, 51.3% were males. | Each faculty member at the University was thoroughly trained in the use of the Hand Activity Level (HAL). They thereafter trained their graduate students. | Two university faculty members with extensive experience and nine graduated students trained by the faculty. Mean age = 29.8 years (SD = 8.6) and roughly 54.5% were female. |
| Stevens et al. (2004) [29] | The research team used video files and did not include any participant information. | All raters participated in a 1-day training course given in their respective geographic location. Lasting approximately 8 h, it included a description of the principles and procedures of the Strain Index, applied examples using video of real-world examples, along with feedback and discussion regarding the choice of the appropriate ratings. | Nine raters were practicing ergonomists and six raters were students studying for advanced ergonomic degrees. | |
| Dartt et al. (2009) [37] | 20 | Mean age = 47.8 years (range = 34–62). Average experience = 19.7 years (range = 6–36; 50% were male. | Six months of software familiarity and two weeks of formal training sessions including (1) observing a professional (2) completing the same review as the professional (3) reviewing tasks and having the professional check their work afterwards (4) then completing analyses on their own. | Graduate students working in the Ergonomics Laboratory at Colorado State University. |
| Valentim et al. (2018) [41] | 116 assumed workers for each job | N.A. | Each rater received additional training which consisted of explanations of the methods and theoretical/practical application of the assessment tools. | Each rater was experienced with three to five years of biomechanical exposure assessments. |
| Stephens et al. (2006) [26] | Assumed one worker for each job on the video file | N.A. | Each rater regardless of experience was given an 8 h tutorial on using Strain Index which included background on Strain Index principles, Strain Index applications, video file examples of jobs, demonstrations on how to apply ratings to video files, and an open discussion of example results. | Six graduate students (three masters and three PhD’s) and nine ergonomic practitioners. No Certified Professional Ergonomists (CPEs). |
| Paulsen et al. (2015) [16] | Assumed one worker for each job on the video file | N.A. | Training sessions included instruction on the procedures of each method, practice applying the methods to video segments of manufacturing tasks, and feedback from an experienced rater. Training sessions continued until trainees achieved competency. Competency for each method was reached when trainees consistently (80% of time) assigned exposure ratings that were similar (within 20%) to the most experienced rater. | Members from occupational health research groups including three university faculty and four graduate students. Two were CPEs. |
| Hollak et al. (2014) [39] | 643 healthy working participants | 402 mean and 241 women. Mean age = 41.6 (SD = 10.4). | Two-day Functional Capacity Evaluation training given by a licensed WorkWell trainer specifically for the purpose of this study. | Physical therapy students. |
| Coenen et al. (2014) [36] | 2 | Two males aged 37 and 56 with substantial knowledge and experience with power tools. | Each rater had substantial knowledge in human kinematics and ergonomic risk assessments but not regarding vibration; therefore, all received verbal and written instructions on the hand-arm vibration assessment. | Students and employees of Vrije Universiteit Amsterdam, Faculty of Human Movement Sciences and TNO Healthy Living. Mean age = 30.2 (SD = 12.1). |
| Author (Year) | Number of Raters | Obs | What was Observed | Reliability Assessment | Interpretation |
|---|---|---|---|---|---|
| Neumann et al. (1998) [46] | 7 | 56 | Eight jobs. | Intraclass correlation coefficients (ICCs), similar index and comparable to the kappa coefficient, were calculated from 2 × 2 analysis of variance (ANOVA) | Poor-fair at ICC < 0.4, fair-good at 0.4 < ICC < 0.75, and excellent at ICC => 0.75 |
| Dockrell et al. (2012) [38] | 6 | 144 | Twenty-four school children based on Shoukri et al. (2004) recommendation of 18–29. | ICC (2,1), ICC (3,1) | ICC < 0.50 = Poor, 0.05 < ICC < 0.75 = Moderate, ICC > 0.5 = Good |
| Rhen and Forsman (2020) [34] | 11 | 220 | Ten video recordings were analyzed twice by each rater. | Cohens linearly weighted kappa, ICC (2,1), Kendall’s coefficient of concordance KCC, percentage agreement | kappa < 0.00 = Poor, 0.00–0.20 = Slight, 0.21–0.40 = Fair, 0.41–0.60 = Moderate, 0.61–0.80 = Substantial, 0.81–1.00 = Almost Perfect, Percent agreement > 80% = acceptable, (ICC < 0.50, “poor”, 0.50–0.75 “moderate”, 0.75–0.9 “good”, and >0.90 “excellent” reliability) |
| Paulsen et al. (2014) [40] | 11 working in pairs. Each person in each pair rated tasks individually, but each task was rated by one pair. | 1716 | 385 workers doing 858 tasks | For each rater pair, reliability was measured between the scores using Pearson Product Moment Correlation Coefficient (Streiner and Norman, 2006) [27] and Two-sample Student’s t-test using Satterhwaite’s method for unequal variance was used to investigate cyclic vs. non-cyclic tasks. | Weighted Mean Correlation Coefficients—negligible: 0.00–0.25; fair to moderate: 0.25–0.50; moderate to good: 0.50–0.75; good to excellent: 0.75–1.0 |
| Stevens et al. (2004) [29] | Fifteen raters and five teams. | 1095 | 61 videos for specific task variables of the Strain Index and 12 videos for complete analysis (73 total). | ICC (2,1) using single measure and absolute agreement were used to analyze the data, task variable ratings, and Strain Index score. The Kuder and Richardson’s Equation 20 (KR-20) and percent agreement was used to analyze the dichotomized hazard score. | Poor-fair at ICC < 0.4, fair-good at 0.4 < ICC < 0.75, and excellent at ICC => 0.75. The authors did not indicate what other interpretations they used for the other reliability coefficients. |
| Dartt et al. (2009) [37] | 2 | 80 | 20 jobs were analyzed twice by both raters | Generalizability theory paired with Pearson Product Moment Correlation Coefficients | Coefficients > 0.75 = good to excellent, 0.50 < Coefficients < 0.75 = fair to good, Coefficients < 0.50 = poor |
| Valentim et al. (2018) [41] | 2 | 464 | 116 recorded tasks were analyzed twice by each rater | Kappa, ICC (2,1), percentage agreement, standard error for measurement, Cronbach alpha Coefficient, Spearman’s Rho. | Kappa (k < 0.00 = Poor, 0.00–0.20 = Slight, 0.21–0.40 = Fair, 0.41–0.60 = Moderate, 0.61–0.80 = Substantial, 0.81–1.00 = Almost Perfect), ICC (poor <0.40, moderate 0.40–0.75, strong 0.75–0.90, excellent >0.90), agreement (very good <5%, 5% < good = 10%, 10% < doubtful = 20%, negative >20%), Cronbach alpha (positive = 0.70 and 0.95, low < 0.70, redundant > 0.95), Spearman rho (weak = 0–0.30, moderate = 0.30–0.70, strong = 0.70–1.0) |
| Stephens et al. (2006) [26] | 15 individual raters in 5 teams of 3 | 1854 | 73 job files (61 task variable and 12 Strain Index score files) | ICC (2,1) was used for most of the data while the tetrachoric correlation coefficient was used for the dichotomous hazard classification value | The authors of this study do not reference a single interpretation scale for either the ICC or the Tetrachoric Correlation Value. |
| Paulsen et al. (2015) [16] | 3 university faculty and 4 graduate students for a total of 7 raters | 448 | 21 cyclic U.E. tasks were to be analyzed; 11 were asymmetric and treated separately which increased the total tasks to 32 | ICC(2,1) | ICC < 0.40 = poor reliability; 0.40 < ICC < 0.75 = moderate to good reliability; and ICC > 0.75 = excellent reliability |
| Hollak et al. (2014) [39] | 1 of 15 physical therapy students | 643 | 643 | One-way random ICC(1,1) and Limits of Agreement (LoA) | 0.91 < ICC < 1.0 (Excellent Agreement), 0.75 < ICC < 0.90 (High Agreement), 0.50 < ICC < 0.75 (Moderate Agreement) The LoA were assumed to be acceptable for clinical interpretation at 16%. |
| Coenen et al. (2014) [36] | 16 in teams of 4 | 64 | 16 tasks | ICC, weighted Cohen’s kappa (k), and Percentage Agreement | For both ICCs and Ks >0.60 = good, 0.40–0.60 = agree moderately, <0.40 = limited agreement. To test for a learning effect, the percentage of agreement between subjective assessment and objective measurements in the first two tasks were compared to the last two tasks. |
| Author (Year) | Reliability Results |
|---|---|
| Neumann et al. (1998) [46] | Reliability, as assessed using the intra-class correlation coefficient (ICC), was found to be poor for the upper limb, moderate for the torso and lower limb, and good for the assessment of manual material handling. |
| Dockrell et al. (2012) [38] | Rapid Upper Limb Assessment (RULA) demonstrated higher intra-rater reliability than inter-rater reliability, although both were moderate to good. RULA was more reliable when used for assessing older children (8–12 years) than with younger children (4–7 years). RULA may prove useful as part of an ergonomic assessment, but its level of reliability warrants caution for its sole use when assessing children, and in particular, younger children. Action Limit—Mean = (0.60), Standard Deviation (SD) = (0.20), Range = (0.59); Grand Score—Mean = (0.68), SD = (0.15), Range = (0.37); Arm Score—Mean = (0.62), SD = (0.25), Range = (0.58); Trunk and Leg Score—Mean = (0.75), SD = (0.13), Range = (0.32). |
| Rhen and Forsman (2020) [34] | For the five risk levels, the inter-rater overall percentage agreement was 39% and Cohen’s linearly weighted kappa was 0.43. For the six risk factors, the linearly weighted kappa values were between 0.25 (Posture) and 0.40 (Duration and Force). As expected, a higher (however just slightly higher) reliability was found within raters than between raters, with an overall percentage agreement of 45% and a linearly weighted kappa of 0.52. The linearly weighted kappa values of the risk factors ranged from 0.41 (Recovery) to 0.61 (Duration). |
| Paulsen et al. (2014) [40] | Results indicated that the Hand Activity Level (HAL) is a reliable exposure assessment method for cyclic (-barw = 0.69) and non-cyclic work tasks (-barw = 0.68). When the two reliability scores were compared using a two-sample Student’s t-test, no significant difference in reliability (p = 0.63) between these work task categories was found. This study demonstrated that the HAL may be a useful measure of exposure to repetitive exertions during cyclic and non-cyclic tasks. |
| Stevens et al. (2004) [29] | For task variables and estimated data, ICC (2,1) varied between 0.66–0.84 for individuals and 0.48–0.93 for teams. The Strain Index score had an ICC (2,1) of 0.43 and 0.64 for individuals and teams, respectively. For the most important variable, hazard classification, the Kuder and Richardson’s Equation 20 (KR-20) was 0.91 for the individuals and 0.89 for the teams. |
| Dartt et al. (2009) [37] | The results demonstrated good to excellent inter-rater reliability for neck and shoulder postures and fair to excellent inter-rater reliability for wrist postures. Intra-rater posture assessment demonstrated good to excellent reliability for both raters in all postures of the neck, shoulder, and wrist. This study demonstrated that posture assessment of manufacturing workers using Multimedia Video Task Analysis (MVTA) is a reliable method. |
| Valentim et al. (2018) [41] | The intra-raters’ reliability for the RULA ranged from poor to almost perfect (kappa: 0.00–0.93), and Strain Index from poor to excellent (ICC2.1: 0.05–0.99). The inter-raters’ reliability was very poor for RULA (kappa: −0.12 to 0.13) and ranged from very poor to moderate for Strain Index (ICC2.1: 0.00–0.53). The agreement was good for RULA (75–100% intra-raters, and 42.24–100% inter-raters) and to Strain Index (EPM: −1.03% to 1.97%; intra-raters, and −0.17% to 1.51% inter-raters). The internal consistency was appropriate for RULA (a = 0.88), and low for Strain Index (a = 0.65). Moderate construct validity was observed between RULA and Strain Index, in wrist/hand-wrist posture (rho: 0.61) and strength/intensity of exertion (rho: 0.39). |
| Stephens et al. (2006) [26] | Intraclass correlation (ICC) coefficients for task variable ratings and accompanying data ranged from 0.66 to 0.95 for both individuals and teams. The Strain Index Score ICC (2,1) for individuals and teams were 0.56 and 0.82, respectively. Intra-rater reliability for the hazard classification (tetrachoric correlation) was 0.81 for individuals and 0.88 for teams. The results indicate that the Strain Index has good test–retest reliability. |
| Paulsen et al. (2015) [16] | Inter-rater reliability was characterized using a single-measure, agreement-based ICC. Interrater reliability of Strain Index assessments was moderate to good (ICC = 0.59, 95% Confident Interval (CI): 0.45–0.73), a similar finding to prior studies. Inter-rater reliability of Occupational Repetitive Actions (OCRA) checklist assessments was excellent (ICC = 0.80, 95% CI: 0.70–0.89). Task complexity had a small, but non-significant, effect on inter-rater reliability Strain Index and OCRA checklist scores. Both the Strain Index and OCRA checklist assessments possess adequate inter-rater reliability for the purposes of occupational health research and practice. |
| Hollak et al. (2014) [39] | The ICCs were excellent (ICC > 0.91) in all proposed protocols except for the one trial Purdue Pegboard test with ICCs of 0.80–0.82. In all tests, the ICCs were higher for the two-trial protocol than for the one trial protocol. For all tests, the Limits of Agreements (LoAs) were about twice as large for the one trial protocol compared to the two-trial protocol. All two trial protocols had a variability of the LoA of lower than 16% when compared to the criterion values. |
| Coenen et al. (2014) [36] | Inter-observer reliability can be expressed by an ICC of 0.708 (0.511–0.873). The concurrent validity of subjective hand-arm vibration assessment in comparison to the objective measurement can be expressed by a weighted kappa of 0.535 (0.285–0.785). As a comparison, the ICC depicting the validity of the vibration values provided by the manufacturers as compared to the objectively measured vibrations was calculated 0.505 (0.364–0.706). Exact agreement of the subjective assessment compared to the objective measurement occurred in 52% of the assessed tasks. The additional analysis to investigate a possible learning effect showed 44% agreement of the subjective and objective assessment during the first two tasks of each observer while there was 59% agreement during the last two tasks. |
4. Discussion
5. Conclusions
Author Contributions
Funding
Institutional Review Board Statement
Informed Consent Statement
Conflicts of Interest
References
- Bailey, T.S.; Dollard, M.F.; McLinton, S.S.; Richards, P.A.M. Psychosocial Safety Climate, Psychosocial and Physical Factors in the Aetiology of Musculoskeletal Disorder Symptoms and Workplace Injury Compensation Claims. Work Stress 2015, 29, 190–211. [Google Scholar] [CrossRef]
- Harcombe, H.; McBride, D.; Derrett, S.; Gray, A. Physical and Psychosocial Risk Factors for Musculoskeletal Disorders in New Zealand Nurses, Postal Workers and Office Workers. Inj. Prev. J. Int. Soc. Child Adolesc. Inj. Prev. 2010, 16, 96–100. [Google Scholar] [CrossRef] [PubMed]
- Case and Demographic Characteristics for Work-Related Injuries and Illnesses Involving Days Away from Work. Available online: https://www.bls.gov/iif/oshcdnew.htm (accessed on 6 December 2021).
- Shiri, R.; Miranda, H.; Heliövaara, M.; Viikari-Juntura, E. Physical Work Load Factors and Carpal Tunnel Syndrome: A Population-Based Study. Occup. Environ. Med. 2009, 66, 368–373. [Google Scholar] [CrossRef] [PubMed]
- Trillos-Chacón, M.-C.; Castillo-M, J.A.; Tolosa-Guzman, I.; Sánchez Medina, A.F.; Ballesteros, S.M. Strategies for the Prevention of Carpal Tunnel Syndrome in the Workplace: A Systematic Review. Appl. Ergon. 2021, 93, 103353. [Google Scholar] [CrossRef]
- Atroshi, I.; Gummesson, C.; Johnsson, R.; Ornstein, E.; Ranstam, J.; Rosén, I. Prevalence of Carpal Tunnel Syndrome in a General Population. JAMA 1999, 282, 153–158. [Google Scholar] [CrossRef]
- De Krom, M.C.; Knipschild, P.G.; Kester, A.D.; Thijs, C.T.; Boekkooi, P.F.; Spaans, F. Carpal Tunnel Syndrome: Prevalence in the General Population. J. Clin. Epidemiol. 1992, 45, 373–376. [Google Scholar] [CrossRef]
- Thomsen, J.F.; Gerr, F.; Atroshi, I. Carpal Tunnel Syndrome and the Use of Computer Mouse and Keyboard: A Systematic Review. BMC Musculoskelet. Disord. 2008, 9, 134. [Google Scholar] [CrossRef]
- Dale, A.M.; Harris-Adamson, C.; Rempel, D.; Gerr, F.; Hegmann, K.; Silverstein, B.; Burt, S.; Garg, A.; Kapellusch, J.; Merlino, L.; et al. Prevalence and Incidence of Carpal Tunnel Syndrome in US Working Populations: Pooled Analysis of Six Prospective Studies. Scand. J. Work. Environ. Health 2013, 39, 495–505. [Google Scholar] [CrossRef]
- Webster, B.S.; Snook, S.H. The Cost of Compensable Upper Extremity Cumulative Trauma Disorders. J. Occup. Med. Off. Publ. Ind. Med. Assoc. 1994, 36, 713–717. [Google Scholar]
- CPI Inflation Calculator. Available online: https://www.bls.gov/data/inflation_calculator.htm (accessed on 10 February 2021).
- Falkiner, S.; Myers, S. When Exactly Can Carpal Tunnel Syndrome Be Considered Work-Related? ANZ J. Surg. 2002, 72, 204–209. [Google Scholar] [CrossRef]
- Morse, T.; Dillon, C.; Kenta-Bibi, E.; Weber, J.; Diva, U.; Warren, N.; Grey, M. Trends in Work-Related Musculoskeletal Disorder Reports by Year, Type, and Industrial Sector: A Capture-Recapture Analysis. Am. J. Ind. Med. 2005, 48, 40–49. [Google Scholar] [CrossRef]
- Keir, P.J.; Farias Zuniga, A.; Mulla, D.M.; Somasundram, K.G. Relationships and Mechanisms Between Occupational Risk Factors and Distal Upper Extremity Disorders. Hum. Factors 2021, 63, 5–31. [Google Scholar] [CrossRef]
- Roquelaure, Y.; Ha, C.; Rouillon, C.; Fouquet, N.; Leclerc, A.; Descatha, A.; Touranchet, A.; Goldberg, M.; Imbernon, E.; Members of Occupational Health Services of the Pays de la Loire Region. Risk Factors for Upper-Extremity Musculoskeletal Disorders in the Working Population. Arthritis Rheum. 2009, 61, 1425–1434. [Google Scholar] [CrossRef] [PubMed]
- Paulsen, R.; Gallu, T.; Gilkey, D.; Reiser, R.; Murgia, L.; Rosecrance, J. The Inter-Rater Reliability of Strain Index and OCRA Checklist Task Assessments in Cheese Processing. Appl. Ergon. 2015, 51, 199–204. [Google Scholar] [CrossRef]
- Takala, E.-P.; Pehkonen, I.; Forsman, M.; Hansson, G.-Å.; Mathiassen, S.; Neumann, W.P.; Sjøgaard, G.; Veiersted, K.B.; Westgaard, R.H.; Winkel, J. Systematic Evaluation of Observational Methods Assessing Biomechanical Exposures at Work. Scand. J. Work. Environ. Health 2010, 36, 3–24. [Google Scholar] [CrossRef]
- ACGIH TLV for Hand Activity Level; CRC Press: Boca Raton, FL, USA, 2007; pp. 377–390. [CrossRef]
- American Conference of Governmental Industrial Hygienists. TLV/BEI Guidelines; ACGIH: Cincinnati, OH, USA, 2002. [Google Scholar]
- Latko, W.A.; Armstrong, T.J.; Foulke, J.A.; Herrin, G.D.; Rabourn, R.A.; Ulin, S.S. Development and Evaluation of an Observational Method for Assessing Repetition in Hand Tasks. Am. Ind. Hyg. Assoc. J. 1997, 58, 278–285. [Google Scholar] [CrossRef]
- Moore, S.; Garg, A. The Strain Index: A Proposed Method to Analyze Jobs For Risk of Distal Upper Extremity Disorders. Am. Ind. Hyg. Assoc. J. 1995, 56, 443–458. [Google Scholar] [CrossRef]
- Hignett, S.; McAtamney, L. Rapid Entire Body Assessment (REBA). Appl. Ergon. 2000, 31, 201–205. [Google Scholar] [CrossRef]
- McAtamney, L.; Nigel Corlett, E. RULA: A Survey Method for the Investigation of Work-Related Upper Limb Disorders. Appl. Ergon. 1993, 24, 91–99. [Google Scholar] [CrossRef]
- Fagarasanu, M.; Kumar, S. Measurement Instruments and Data Collection: A Consideration of Constructs and Biases in Ergonomics Research. Int. J. Ind. Ergon. 2002, 30, 355–369. [Google Scholar] [CrossRef]
- Sanders, M.; McCormick, E.J. Human Factors in Engineering Design, 7th ed.; McGray-Hill: New York, NY, USA, 1993. [Google Scholar]
- Stephens, J.-P.; Vos, G.A.; Stevens, E.M.; Moore, J.S. Test–Retest Repeatability of the Strain Index. Appl. Ergon. 2006, 37, 275–281. [Google Scholar] [CrossRef]
- Streiner, D.; Norman, G. Health Measurement Scales, A Practical Guide to Their Development and Use, 2nd ed.; Oxford University Press: Oxford, NY, USA, 1995. [Google Scholar]
- Essendrop, M.; Schibye, B.; Hansen, K. Reliability of Isometric Muscle Strength Tests for the Trunk, Hands and Shoulders. Int. J. Ind. Ergon. 2001, 28, 379–387. [Google Scholar] [CrossRef]
- Stevens, E.M.J.; Vos, G.A.; Stephens, J.-P.; Moore, J.S. Inter-Rater Reliability of the Strain Index. J. Occup. Environ. Hyg. 2004, 1, 745–751. [Google Scholar] [CrossRef]
- Andersen, K.S.; Christensen, B.H.; Samani, A.; Madeleine, P. Between-Day Reliability of a Hand-Held Dynamometer and Surface Electromyography Recordings during Isometric Submaximal Contractions in Different Shoulder Positions. J. Electromyogr. Kinesiol. 2014, 24, 579–587. [Google Scholar] [CrossRef]
- Abobakr, A.; Nahavandi, D.; Hossny, M.; Iskander, J.; Attia, M.; Nahavandi, S.; Smets, M. RGB-D Ergonomic Assessment System of Adopted Working Postures. Appl. Ergon. 2019, 80, 75–88. [Google Scholar] [CrossRef]
- Levanon, Y. The Advantages and Disadvantages of Using High Technology in Hand Rehabilitation. J. Hand Ther. 2013, 26, 179–183. [Google Scholar] [CrossRef]
- Manghisi, V.M.; Uva, A.E.; Fiorentino, M.; Bevilacqua, V.; Trotta, G.F.; Monno, G. Real Time RULA Assessment Using Kinect v2 Sensor. Appl. Ergon. 2017, 65, 481–491. [Google Scholar] [CrossRef]
- Rhen, I.-M.; Forsman, M. Inter- and Intra-Rater Reliability of the OCRA Checklist Method in Video-Recorded Manual Work Tasks. Appl. Ergon. 2020, 84, 103025. [Google Scholar] [CrossRef]
- Morrow, J.R.; Jackson, A.W. How “Significant” Is Your Reliability? Research Quarterly for Exercise and Sport. Available online: https://pubmed.ncbi.nlm.nih.gov/8235058/ (accessed on 1 December 2020).
- Coenen, P.; Formanoy, M.; Douwes, M.; Bosch, T.; de Kraker, H. Validity and Inter-Observer Reliability of Subjective Hand-Arm Vibration Assessments. Appl. Ergon. 2014, 45, 1257–1262. [Google Scholar] [CrossRef]
- Dartt, A.; Rosecrance, J.; Gerr, F.; Chen, P.; Anton, D.; Merlino, L. Reliability of Assessing Upper Limb Postures among Workers Performing Manufacturing Tasks. Appl. Ergon. 2009, 40, 371–378. [Google Scholar] [CrossRef]
- Dockrell, S.; O’Grady, E.; Bennett, K.; Mullarkey, C.; Mc Connell, R.; Ruddy, R.; Twomey, S.; Flannery, C. An Investigation of the Reliability of Rapid Upper Limb Assessment (RULA) as a Method of Assessment of Children’s Computing Posture. Appl. Ergon. 2012, 43, 632–636. [Google Scholar] [CrossRef]
- Hollak, N.; Soer, R.; van der Woude, L.H.; Reneman, M.F. Towards a Comprehensive Functional Capacity Evaluation for Hand Function. Appl. Ergon. 2014, 45, 686–692. [Google Scholar] [CrossRef]
- Paulsen, R.; Schwatka, N.; Gober, J.; Gilkey, D.; Anton, D.; Gerr, F.; Rosecrance, J. Inter-Rater Reliability of Cyclic and Non-Cyclic Task Assessment Using the Hand Activity Level in Appliance Manufacturing. Int. J. Ind. Ergon. 2014, 44, 32–38. [Google Scholar] [CrossRef]
- Valentim, D.P.; de Sato, T.O.; Comper, M.L.C.; da Silva, A.M.; Boas, C.V.; Padula, R.S. Reliability, Construct Validity and Interpretability of the Brazilian Version of the Rapid Upper Limb Assessment (RULA) and Strain Index (SI). Braz. J. Phys. Ther. 2018, 22, 198–204. [Google Scholar] [CrossRef]
- Hays, W. Statistics for the Social Sciences, 2nd ed.; Holt, Rinehart and Winston: New York, NY, USA, 1973. [Google Scholar]
- Cohen, J. A Coefficient of Agreement for Nominal Scales. Educ. Psychol. Meas. 1960, 20, 37–46. [Google Scholar] [CrossRef]
- Fleiss, J.L.; Levin, B.; Paik, M.C. Statistical Methods for Rates and Proportions; John Wiley & Sons: Hoboken, NJ, USA, 2013. [Google Scholar]
- Warrens, M.J. Conditional Inequalities between Cohen’s Kappa and Weighted Kappas. Stat. Methodol. 2013, 10, 14–22. [Google Scholar] [CrossRef]
- Neumann, P.; Wells, R.; Norman, R. A Participative Field Study of the Inter-Rater Reliability of a Risk Factor Assessment Checklist Used by Manufacturing Plant Personnel. Adv. Occup. Ergon. Saf. 1998, 2, 47–50. [Google Scholar]
- Berk, R.A. An Analysis of Variance Model for Assessing Reliability of Naturalistic Observations. Percept. Mot. Skills 1978, 47, 271–278. [Google Scholar] [CrossRef]
- Ebel, R.L. Estimation of the Reliability of Ratings. Psychometrika 1951, 16, 407–424. [Google Scholar] [CrossRef]
- Medley, D.M.; Mitzel, H.E. Measuring Classroom Behavior by Systematic Observation. In Handbook of Research on Teaching; Rand McNally: Chicago, IL, USA, 1963; pp. 247–328. [Google Scholar]
- Brown, M.B. Algorithm AS 116: The Tetrachoric Correlation and Its Asymptotic Standard Error. J. R. Stat. Soc. Ser. C Appl. Stat. 1977, 26, 343–351. [Google Scholar] [CrossRef]
- Hutchinson, T.P. Focus on Psychometrics. Kappa Muddles Together Two Sources of Disagreement: Tetrachoric Correlation Is Preferable. Res. Nurs. Health 1993, 16, 313–316. [Google Scholar] [CrossRef]
- Riffenburgh, R.H.; Gillen, D.L. 27-Techniques to Aid Analysis. In Statistics in Medicine, 4th ed.; Riffenburgh, R.H., Gillen, D.L., Eds.; Academic Press: Cambridge, MA, USA, 2020; pp. 631–649. [Google Scholar] [CrossRef]
- Martin Bland, J.; Altman, D. Statistical methods for assessing agreement between two methods of clinical measurement. Lancet 1986, 327, 307–310. [Google Scholar] [CrossRef]
- Giavarina, D. Understanding Bland Altman Analysis. Biochem. Medica 2015, 25, 141–151. [Google Scholar] [CrossRef]
- Schober, P.; Boer, C.; Schwarte, L.A. Correlation Coefficients: Appropriate Use and Interpretation. Anesth. Analg. 2018, 126, 1763–1768. [Google Scholar] [CrossRef]
- Correlation. Available online: http://www.psychology.emory.edu/clinical/bliwise/Tutorials/SCATTER/scatterplots/corr.htm (accessed on 7 December 2021).
- Garg, A.; Moore, J.S.; Kapellusch, J.M. The Revised Strain Index: An Improved Upper Extremity Exposure Assessment Model. Ergonomics 2017, 60, 912–922. [Google Scholar] [CrossRef]
- Garg, A.; Moore, J.S.; Kapellusch, J.M. The Composite Strain Index (COSI) and Cumulative Strain Index (CUSI): Methodologies for Quantifying Biomechanical Stressors for Complex Tasks and Job Rotation Using the Revised Strain Index. Ergonomics 2017, 60, 1033–1041. [Google Scholar] [CrossRef]
- Gibson, M.; Potvin, J. An Equation to Calculate the Recommended Cumulative Rest Allowance across Multiple Subtasks; Association of Canadian Ergonomists: Renfrew, ON, Canada, 2016. [Google Scholar]
- Gallagher, S.; Schall, M.C., Jr.; Sesek, R.F.; Huangfu, R. An upper extremity risk assessment tool based on material fatigue failure theory: The distal upper extremity tool (DUET). Human Factors 2018, 60, 1146–1162. [Google Scholar] [CrossRef]
- Kerlinger, F.N.; Howard, B.L. Foundations of Behavioral Research, 4th ed.; Harcourt College Publishers: Fort Worth, TX, USA, 1992. [Google Scholar]
- Salerno, D.F.; Franzblau, A.; Armstrong, T.J.; Werner, R.A.; Becker, M.P. Test-Retest Reliability of the Upper Extremity Questionnaire among Keyboard Operators. Am. J. Ind. Med. 2001, 40, 655–666. [Google Scholar] [CrossRef]
- Trask, C.; Mathiassen, S.E.; Rostami, M.; Heiden, M. Observer Variability in Posture Assessment from Video Recordings: The Effect of Partly Visible Periods. Appl. Ergon. 2017, 60, 275–281. [Google Scholar] [CrossRef]


Publisher’s Note: MDPI stays neutral with regard to jurisdictional claims in published maps and institutional affiliations. |
© 2022 by the authors. Licensee MDPI, Basel, Switzerland. This article is an open access article distributed under the terms and conditions of the Creative Commons Attribution (CC BY) license (https://creativecommons.org/licenses/by/4.0/).
Share and Cite
Graben, P.R.; Schall, M.C., Jr.; Gallagher, S.; Sesek, R.; Acosta-Sojo, Y. Reliability Analysis of Observation-Based Exposure Assessment Tools for the Upper Extremities: A Systematic Review. Int. J. Environ. Res. Public Health 2022, 19, 10595. https://doi.org/10.3390/ijerph191710595
Graben PR, Schall MC Jr., Gallagher S, Sesek R, Acosta-Sojo Y. Reliability Analysis of Observation-Based Exposure Assessment Tools for the Upper Extremities: A Systematic Review. International Journal of Environmental Research and Public Health. 2022; 19(17):10595. https://doi.org/10.3390/ijerph191710595
Chicago/Turabian StyleGraben, Preston Riley, Mark C. Schall, Jr., Sean Gallagher, Richard Sesek, and Yadrianna Acosta-Sojo. 2022. "Reliability Analysis of Observation-Based Exposure Assessment Tools for the Upper Extremities: A Systematic Review" International Journal of Environmental Research and Public Health 19, no. 17: 10595. https://doi.org/10.3390/ijerph191710595