
Government Trust, Environmental Pollution Perception, and Environmental Governance Satisfaction

Abstract
:1. Introduction
2. Theoretical Backgrounds and Hypothesis Development
2.1. Government Trust and Satisfaction with Environmental Governance
2.2. Perception of Environmental Pollution and Satisfaction with Environmental Governance
3. Materials and Methods
3.1. Data Sources
3.2. Measurements
3.2.1. Satisfaction with Environmental Governance
3.2.2. Government Trust
3.2.3. Environmental Pollution Perception
3.2.4. Control Variables
3.3. Analytical Methods
4. Results
4.1. Describe Statistical Analysis
4.2. Regression Analysis of Environmental Governance Satisfaction
5. Discussion
6. Limitation
7. Conclusions
Author Contributions
Funding
Institutional Review Board Statement
Informed Consent Statement
Data Availability Statement
Acknowledgments
Conflicts of Interest
References
- Mujtaba, G.; Shahzad, S. Air pollutants, economic growth and public health: Implications for sustainable development in OECD countries. Environ. Sci. Pollut. Res. 2021, 28, 12686–12698. [Google Scholar] [CrossRef]
- Palani, G.; Arputhalatha, A.; Kannan, K.; Lakkaboyana, S.; Hanafiah, M.; Kumar, V.; Marella, R. Current Trends in the Application of Nanomaterials for the Removal of Pollutants from Industrial Wastewater Treatment—A Review. Molecules 2021, 26, 2799. [Google Scholar] [CrossRef]
- Akhtar, N.; Ishak, M.; Bhawani, S.; Umar, K. Various Natural and Anthropogenic Factors Responsible for Water Quality Degradation: A Review. Water 2021, 13, 2660. [Google Scholar] [CrossRef]
- World Health Organization. Ambient Air Pollution: A global Assessment of Exposure and Burden of Disease; World Health Organization: Geneva, Switzerland, 2016; Available online: https://apps.who.int/iris/handle/10665/250141 (accessed on 1 August 2022).
- Sharma, P.; Dutta, D.; Udayan, A.; Kumar, S. Industrial wastewater purification through metal pollution reduction employing microbes and magnetic nanocomposites. J. Environ. Chem. Eng. 2021, 9, 106673. [Google Scholar] [CrossRef]
- Chen, L.; You, Y. How does environmental pollution erode political trust in China? A multilevel analysis. Environ. Impact Assess. Rev. 2021, 88, 106553. [Google Scholar] [CrossRef]
- Wu, C.; Shi, Z.; Wilkes, R.; Wu, J.; Gong, Z.; He, N.; Xiao, Z.; Zhang, X.; Lai, W.; Zhou, D.; et al. Chinese Citizen Satisfaction with Government Performance during COVID-19. J. Contemp. China 2021, 30, 930–944. [Google Scholar] [CrossRef]
- Liu, H.; Hu, T. How does air quality affect residents’ life satisfaction? Evidence based on multiperiod follow-up survey data of 122 cities in China. Environ. Sci. Pollut. Res. 2021, 28, 61047–61060. [Google Scholar] [CrossRef]
- Liu, M.; Tan, R.; Zhang, B. The costs of “blue sky”: Environmental regulation, technology upgrading, and labor demand in China. J. Dev. Econ. 2021, 150, 102610. [Google Scholar] [CrossRef]
- Zhao, Y.; Zhang, X.; Wang, Y. Evaluating the effects of campaign-style environmental governance: Evidence from Environmental Protection Interview in China. Environ. Sci. Pollut. Res. 2020, 27, 28333–28347. [Google Scholar] [CrossRef]
- Ernst, A. Review of factors influencing social learning within participatory environmental governance. Ecol. Soc. 2019, 24, 1–29. [Google Scholar] [CrossRef]
- Su, S.; Li, X.; Huang, A.; Sun, X. Public Participation in Rural Environmental Governance around the Water Source of Xiqin Water Works in Fujian. J. Resour. Ecol. 2018, 9, 66–77. [Google Scholar] [CrossRef]
- Zhan, D.; Kwan, M.; Zhang, W.; Fan, J.; Yu, J.; Dang, Y. Assessment and determinants of satisfaction with urban livability in China. Cities 2018, 79, 92–101. [Google Scholar] [CrossRef]
- Geng, M.; He, L. Environmental Regulation, Environmental Awareness and Environmental Governance Satisfaction. Sustainability 2021, 13, 3960. [Google Scholar] [CrossRef]
- Du, Y.; Liu, P.; Ravenscroft, N.; Su, S. Changing community relations in southeast China: The role of Guanxi in rural environmental governance. Agric. Hum. Values 2020, 37, 833–847. [Google Scholar] [CrossRef]
- Tang, F.; Liu, X.; Li, B.; Du, X. Government environmental image, Internet Use and public satisfaction with environmental governance: An empirical analysis based on CGSS2015. China’s Popul. Resour. Environ. 2021, 31, 107–115. [Google Scholar]
- Leng, X.; Zhong, S.; Kang, Y. Citizen participation and urban air pollution abatement: Evidence from environmental whistle-blowing platform policy in Sichuan China. Sci. Total Environ. 2022, 816, 151521. [Google Scholar] [CrossRef]
- Yin, H.; Huang, Y.; Wang, K. How Do Environmental Concerns and Governance Performance Affect Public Environmental Participation: A Case Study of Waste Sorting in Urban China. Int. J. Environ. Res. Public Health 2021, 18, 9947. [Google Scholar] [CrossRef]
- Wu, L.; Ma, T.; Bian, Y.; Li, S.; Yi, Z. Improvement of regional environmental quality: Government environmental governance and public participation. Sci. Total Environ. 2020, 717, 137265. [Google Scholar] [CrossRef] [PubMed]
- Gao, X.; Teets, J. Civil society organizations in China: Navigating the local government for more inclusive environmental governance. China Inf. 2021, 35, 46–66. [Google Scholar] [CrossRef]
- Guo, J.; Bai, J. The Role of Public Participation in Environmental Governance: Empirical Evidence from China. Sustainability 2019, 11, 4696. [Google Scholar] [CrossRef]
- Wang, H.; Yang, G.; Ouyang, X.; Tan, Z. Does environmental information disclosure promote the supply of environmental public goods? Evidence based on a dynamic spatial panel Durbin model. Environ. Impact Assess. Rev. 2022, 93, 106725. [Google Scholar] [CrossRef]
- Li, M.; Zhao, P.; Wu, L.; Chen, K. Effects of Value Perception, Environmental Regulation and Their Interaction on the Improvement of Herdsmen’s Grassland Ecological Policy Satisfaction. Int. J. Environ. Res. Public Health 2021, 18, 3078. [Google Scholar] [CrossRef]
- Chu, X.; He, Z.; Fan, X.; Zhang, L.; Wen, H.; Huang, W.; Wang, T. The influencing factors of Harbin (China) residents’ satisfaction with municipal solid waste treatment. Waste Manag. Res. 2021, 39, 83–92. [Google Scholar] [CrossRef]
- Xu, S.; Ge, J. Sustainable shifting from coal to gas in North China: An analysis of resident satisfaction. Energy Policy 2020, 138, 11296. [Google Scholar] [CrossRef]
- Wang, L.; Xia, Q.; Li, H.; Ma, Y. Factors Influencing Sustainability of Public-Private Partnership Projects in Water Environmental Governance Based on Structural Equation Modeling. J. Yangtze River Sci. Res. Inst. 2020, 37, 15. [Google Scholar] [CrossRef]
- Yang, Y.; Shen, L.; Li, Y.; Li, Y. The Impact of Environmental Information Disclosure on Environmental Governance Satisfaction. Sustainability 2022, 14, 7888. [Google Scholar] [CrossRef]
- Ainali, N.M.; Kalaronis, D.; Evgenidou, E.; Kyzas, G.Z.; Bobori, D.; Kaloyianni, M.; Yang, X.; Bikiaris, D.N.; Lambropoulou, D.A. Do poly (lactic acid) microplastics instigate a threat? A perception for their dynamic towards environmental pollution and toxicity. Sci. Total Environ. 2022, 832, 155014. [Google Scholar] [CrossRef]
- Kersting, E.; Kilby, C. Do domestic politics shape US influence in the World Bank? Rev. Int. Organ. 2021, 16, 29–58. [Google Scholar] [CrossRef]
- Cashore, B.; Knudsen, J.; Moon, J.; van der Ven, H. Private authority and public policy interactions in global context: Governance spheres for problem solving. Regul. Gov. 2021, 15, 1166–1182. [Google Scholar] [CrossRef]
- Zhang, D.; Zheng, M.; Feng, G.; Chang, C. Does an environmental policy bring to green innovation in renewable energy? Renew. Energy 2022, 195, 1113–1124. [Google Scholar] [CrossRef]
- Bidwell, D.; Schweizer, P. Public values and goals for public participation. Environ. Policy Gov. 2021, 31, 257–269. [Google Scholar] [CrossRef]
- Salazar, S.; Pérez, L. Exploring the Differential Effect of Life Satisfaction on Low and High-Cost Pro-Environmental Behaviors. Int. J. Environ. Res. Public Health 2022, 19, 277. [Google Scholar] [CrossRef]
- Boon, S.; Holmes, J. The Dynamics of Interpersonal Trust: Resolving Uncertainty in the Face of Risk; Cambridge University Press: Cambridge, UK, 1985; pp. 190–211. [Google Scholar]
- Miller, A.; Listhaug, O. Political-Parties and Confidence in Government—A Comparison of Norway, Sweden and the United-States. Br. J. Political Sci. 1990, 20, 357–386. [Google Scholar] [CrossRef]
- Walther, F.; Weber, P.; Kabst, R. Analyzing Influencing Factors on Citizens’ Trust and Satisfaction. Int. J. Public Adm. Digit. Age 2018, 5, 40–51. [Google Scholar] [CrossRef]
- Liu, H.; Gao, H.; Huang, Q. Better Government, Happier Residents? Quality of Government and Life Satisfaction in China. Soc. Indic. Res. 2019, 147, 971–990. [Google Scholar] [CrossRef]
- Plessis, A. Public participation, good environmental governance and fulfilment of environmental rights. Potchefstroom Electron. Law J. 2008, 11, 1–34. [Google Scholar] [CrossRef]
- Juan, M.; Revilla, M. Support for mitigation and adaptation climate change policies: Effects of five attitudinal factors. Mitig. Adapt. Strateg. Glob. Chang. 2021, 26, 1–22. [Google Scholar] [CrossRef]
- Schmelz, K. Enforcement may crowd out voluntary support for COVID-19 policies, especially where trust in government is weak and in a liberal society. Proc. Natl. Acad. Sci. USA 2021, 118, e2016385118. [Google Scholar] [CrossRef]
- Gao, L.; Jiang, J.; He, H.; Zhou, Q.; Wang, S.; Li, J. Uncertainty or trust? Political trust, perceived uncertainty and public acceptance of personal carbon trading policy. Environ. Geochem. Health 2022, 1–15. [Google Scholar] [CrossRef]
- Coulibaly, T.; Du, J.; Diakite, D.; Abban, O.; Kouakou, E. A Proposed Conceptual Framework on the Adoption of Sustainable Agricultural Practices: The Role of Network Contact Frequency and Institutional Trust. Sustainability 2021, 13, 2206. [Google Scholar] [CrossRef]
- Wang, S.; Zhou, H.; Hua, G.; Wu, Q. What is the relationship among environmental pollution, environmental behavior, and public health in China? A study based on CGSS. Environ. Sci. Pollut. Res. 2021, 28, 20299–20312. [Google Scholar] [CrossRef]
- Ju, Y.; Lee, J.; Lee, S. Perceived environmental pollution and subjective cognitive decline (SCD) or SCD-related functional difficulties among the general population. Environ. Sci. Pollut. Res. 2021, 28, 31289–31300. [Google Scholar] [CrossRef]
- Gold, J. An Introduction to Behavioural Geography; Oxford University Press: New York, NY, USA, 1980; p. 42. [Google Scholar]
- Han, B. Associations between perceived environmental pollution and health-related quality of life in a Chinese adult population. Health Qual. Life Outcomes 2020, 18, 198. [Google Scholar] [CrossRef] [PubMed]
- Ju, Y.; Lee, J.; Choi, D.; Han, K.; Lee, S. Association between perceived environmental pollution and poor sleep quality: Results from nationwide general population sample of 162,797 people. Sleep Med. 2021, 80, 236–243. [Google Scholar] [CrossRef]
- Zhou, C.; Zhang, D.; He, X. Transportation accessibility evaluation of educational institutions conducting field environmental education activities in ecological protection areas: A case study of Zhuhai City. Sustainability 2021, 13, 9392. [Google Scholar] [CrossRef]
- Liu, H.; Zhu, G.; Li, Y. Research on the impact of environmental risk perception and public participation on evaluation of local government environmental regulation implementation behavior. Environ. Chall. 2021, 5, 100213. [Google Scholar] [CrossRef]
- Ngoc, N.; Binh, N.; Ha, N. Environmental Issues at Seafood Processing Villages in the North Region, Vietnam: Perception and Behaviour of Business Owners. Asian J. Water Environ. Pollut. 2022, 19, 79–87. [Google Scholar] [CrossRef]
- Chen, L.; Zhang, J.; You, Y. Air pollution, environmental perceptions, and citizen satisfaction: A mediation analysis. Environ. Res. 2020, 184, 109287. [Google Scholar] [CrossRef]
- Wang, J.; Tang, D.; Boamah, V. Environmental Governance, Green Tax and Happiness—An Empirical Study Based on CSS Data. Sustainability 2022, 14, 8947. [Google Scholar] [CrossRef]
- Li, H.; Yang, L.; Chen, W. Fitting CSS2019 Data with Normal Distribution for Examining the Public Sense of Gain of the Yellow River Basin in China. Eng. Lett. 2022, 30, 380–391. [Google Scholar]
- Wei, R.; Reynolds, B.; Kong, M.; Liu, Z. Is bilingualism linked to national identity? Evidence from a big data survey. J. Multiling. Multicult. Dev. 2022, 1–15. [Google Scholar] [CrossRef]
- Johnson, D.; Creech, J. Ordinal Measures in Multiple Indicator Models—A Simulation Study of Categorization Error. Am. Sociol. Rev. 1983, 48, 398–407. [Google Scholar] [CrossRef]
- Perrone, V.; Zaheer, A.; Mcevily, B. Free to Be Trusted? Organizational Constraints on Trust in Boundary Spanners. Organ. Sci. 2003, 14, 422–439. [Google Scholar] [CrossRef]
- Lu, X.; Zhang, S.; Xing, J.; Wang, Y.; Chen, W.; Ding, D.; Wu, Y.; Wang, S.; Duan, L.; Hao, J. Progress of Air Pollution Control in China and Its Challenges and Opportunities in the Ecological Civilization Era. Engineering 2020, 6, 1423–1431. [Google Scholar] [CrossRef]
- Abdulkareem, M.; Havukainen, J.; Nuortila-Jokinen, J.; Horttanainen, M. Life cycle assessment of a low-height noise barrier for railway traffic noise. J. Clean. Prod. 2021, 323, 129169. [Google Scholar] [CrossRef]
- Zhang, W.; Zhong, Y. IBM SPSS Data Analysis and Mining Case Summaries; Tsinghua University Press: Beijing, China, 2013; pp. 209–214. [Google Scholar]
- Jing, Y.; Zhang, X.; Yu, X. Understanding Chinese Politics: Key Words; China Social Sciences Press: Beijing, China, 2012; pp. 197–205. [Google Scholar]
- Lanin, D.; Hermanto, N. The effect of service quality toward public satisfaction and public trust on local government in Indonesia. Int. J. Soc. Econ. 2019, 46, 377–392. [Google Scholar] [CrossRef]
- Zhang, Q.; Gao, T.; Liu, X.; Zheng, Y. Exploring the influencing factors of public environmental satisfaction based on socially aware computing. J. Clean. Prod. 2020, 266, 121774. [Google Scholar] [CrossRef]
- Pu, S.; Shao, Z.; Fang, M.; Yang, L.; Liu, R.; Bi, J.; Ma, Z. Spatial distribution of the public’s risk perception for air pollution: A nationwide study in China. Sci. Total Environ. 2019, 655, 454–462. [Google Scholar] [CrossRef]
- Liu, H.; Chen, Y.; Ma, L. Effect of time-varying exposure to air pollution on subjective well-being. J. Clean. Prod. 2021, 281, 125364. [Google Scholar] [CrossRef]
- Noel, C.; Vanroelen, C.; Gadeyne, S. Qualitative research about public health risk perceptions on ambient air pollution. A review study. Ssm-Popul. Health 2021, 15, 100879. [Google Scholar] [CrossRef] [PubMed]
- Tang, X.; Chen, W.; Wu, T. Do Authoritarian Governments Respond to Public Opinion on the Environment? Evidence from China. Int. J. Environ. Res. Public Health 2018, 15, 266. [Google Scholar] [CrossRef]
- Luo, J.; Shuai, M.; Yang, K. A Sociological Analysis of the “Strong Central, Weak Local” Pattern of Trust in Government: Based on Three Stage Tracking Data after the Wenchuan Earthquake. Soc. Sci. China 2018, 39, 5–25. [Google Scholar] [CrossRef]
- Lee, H.; Kim, M.; Park, S.; Robertson, P. Public Service Motivation and Innovation in the Korean and Chinese Public Sectors: Exploring the Role of Confucian Values and Social Capital. Int. Public Manag. J. 2020, 23, 496–534. [Google Scholar] [CrossRef]
- Venugopalan, M.; Bastian, B.; Viswanathan, P. The Role of Multi-Actor Engagement for Women’s Empowerment and Entrepreneurship in Kerala, India. Adm. Sci. 2021, 11, 31. [Google Scholar] [CrossRef]
- Frederickson, H. The Spirit of Public Administration; China Renmin University Press: Beijing, China, 2003; p. 163. [Google Scholar]
- Kim, J.; Stern, R.; Liebman, B.; Wu, X. Closing Open Government: Grassroots Policy Conversion of China’s Open Government Information Regulation and Its Aftermath. Comp. Political Stud. 2022, 55, 319–347. [Google Scholar] [CrossRef]
- Ye, L.; Peng, X.; Aniche, L.; Scholten, P.; Ensenado, E. Urban renewal as policy innovation in China: From growth stimulation to sustainable development. Public Adm. Dev. 2021, 41, 23–33. [Google Scholar] [CrossRef]
- Ruan, H. Political attitudes, election efficacy and farmers’ political participation: Based on the survey data of 3133 farmers. J. Hunan Agric. Univ. (Soc. Sci.) 2021, 22, 41–49. [Google Scholar] [CrossRef]


| Characteristics of the Indicators | Classification | Frequency | The Proportion (%) | The Standard Deviation |
|---|---|---|---|---|
| Gender | Female | 2121 | 54.78 | 0.50 |
| Male | 1751 | 45.22 | ||
| Nationality | The Han nationality | 3530 | 91.17 | 0.28 |
| Minority | 342 | 8.83 | ||
| Household registration | Urban | 2203 | 56.90 | 0.50 |
| Rural area | 1669 | 43.10 | ||
| Age | Under the age of 30 | 469 | 12.11 | 1.33 |
| 30–39 | 630 | 16.27 | ||
| 40–49 | 772 | 19.94 | ||
| 50–59 | 1039 | 26.83 | ||
| 60 and above | 962 | 24.85 | ||
| Education level | Illiteracy | 283 | 7.31 | 1.19 |
| Primary school | 824 | 21.28 | ||
| Junior high school | 1257 | 32.46 | ||
| High school | 758 | 19.58 | ||
| Junior college or above | 750 | 19.37 | ||
| Marital status | Unmarried | 473 | 12.22 | 0.56 |
| Married | 3130 | 80.84 | ||
| Divorced | 116 | 3.00 | ||
| Widowed | 153 | 3.95 | ||
| Politics status | Member of Communist Party of China | 441 | 11.39 | 1.05 |
| Member of communist youth league of China | 314 | 8.11 | ||
| The democratic parties | 11 | 0.28 | ||
| The masses | 3106 | 80.22 | ||
| In total | 3872 | 100 | ||
| Variable Type | Variable Name | Variable Definition | Mean Value | Variable Definition |
|---|---|---|---|---|
| The dependent variable | Environmental governance satisfaction | Very poor = 1; Not so good = 2; Better = 3; Very good = 4 | 2.94 | 0.78 |
| Control variable | Gender | Female = 1; Male = 2 | 1.45 | 0.50 |
| Age | Under 30 = 1; 30–39 = 2; 40–49 = 3; 50 to 59 = 4; 60 and above = 5 | 3.36 | 1.33 | |
| Education level | Illiteracy = 1; Primary school = 2; Junior high school = 3; High school = 4; Junior College or above = 5 | 3.22 | 1.19 | |
| Personal income level | Low income = 1; Low and middle income = 2; Middle income = 3; Middle and high income = 4; High income = 5 | 2.69 | 1.55 | |
| Household income level | 3.07 | 1.55 | ||
| Socioeconomic status | Low status = 1; The middle and lower = 2; The middle = 3; Above middle = 4; High status = 5 | 2.40 | 0.92 | |
| Life ideal degree | Strongly disagree = 1; Disagree = 2; Comparative agreement = 3; Strongly agree = 4 | 2.80 | 0.86 | |
| Life happiness degree | 3.18 | 0.79 | ||
| Social tolerance degree | Very intolerant = 1; Less tolerant = 2; General = 3; More tolerant = 4; Very tolerant = 5 | 3.68 | 0.90 | |
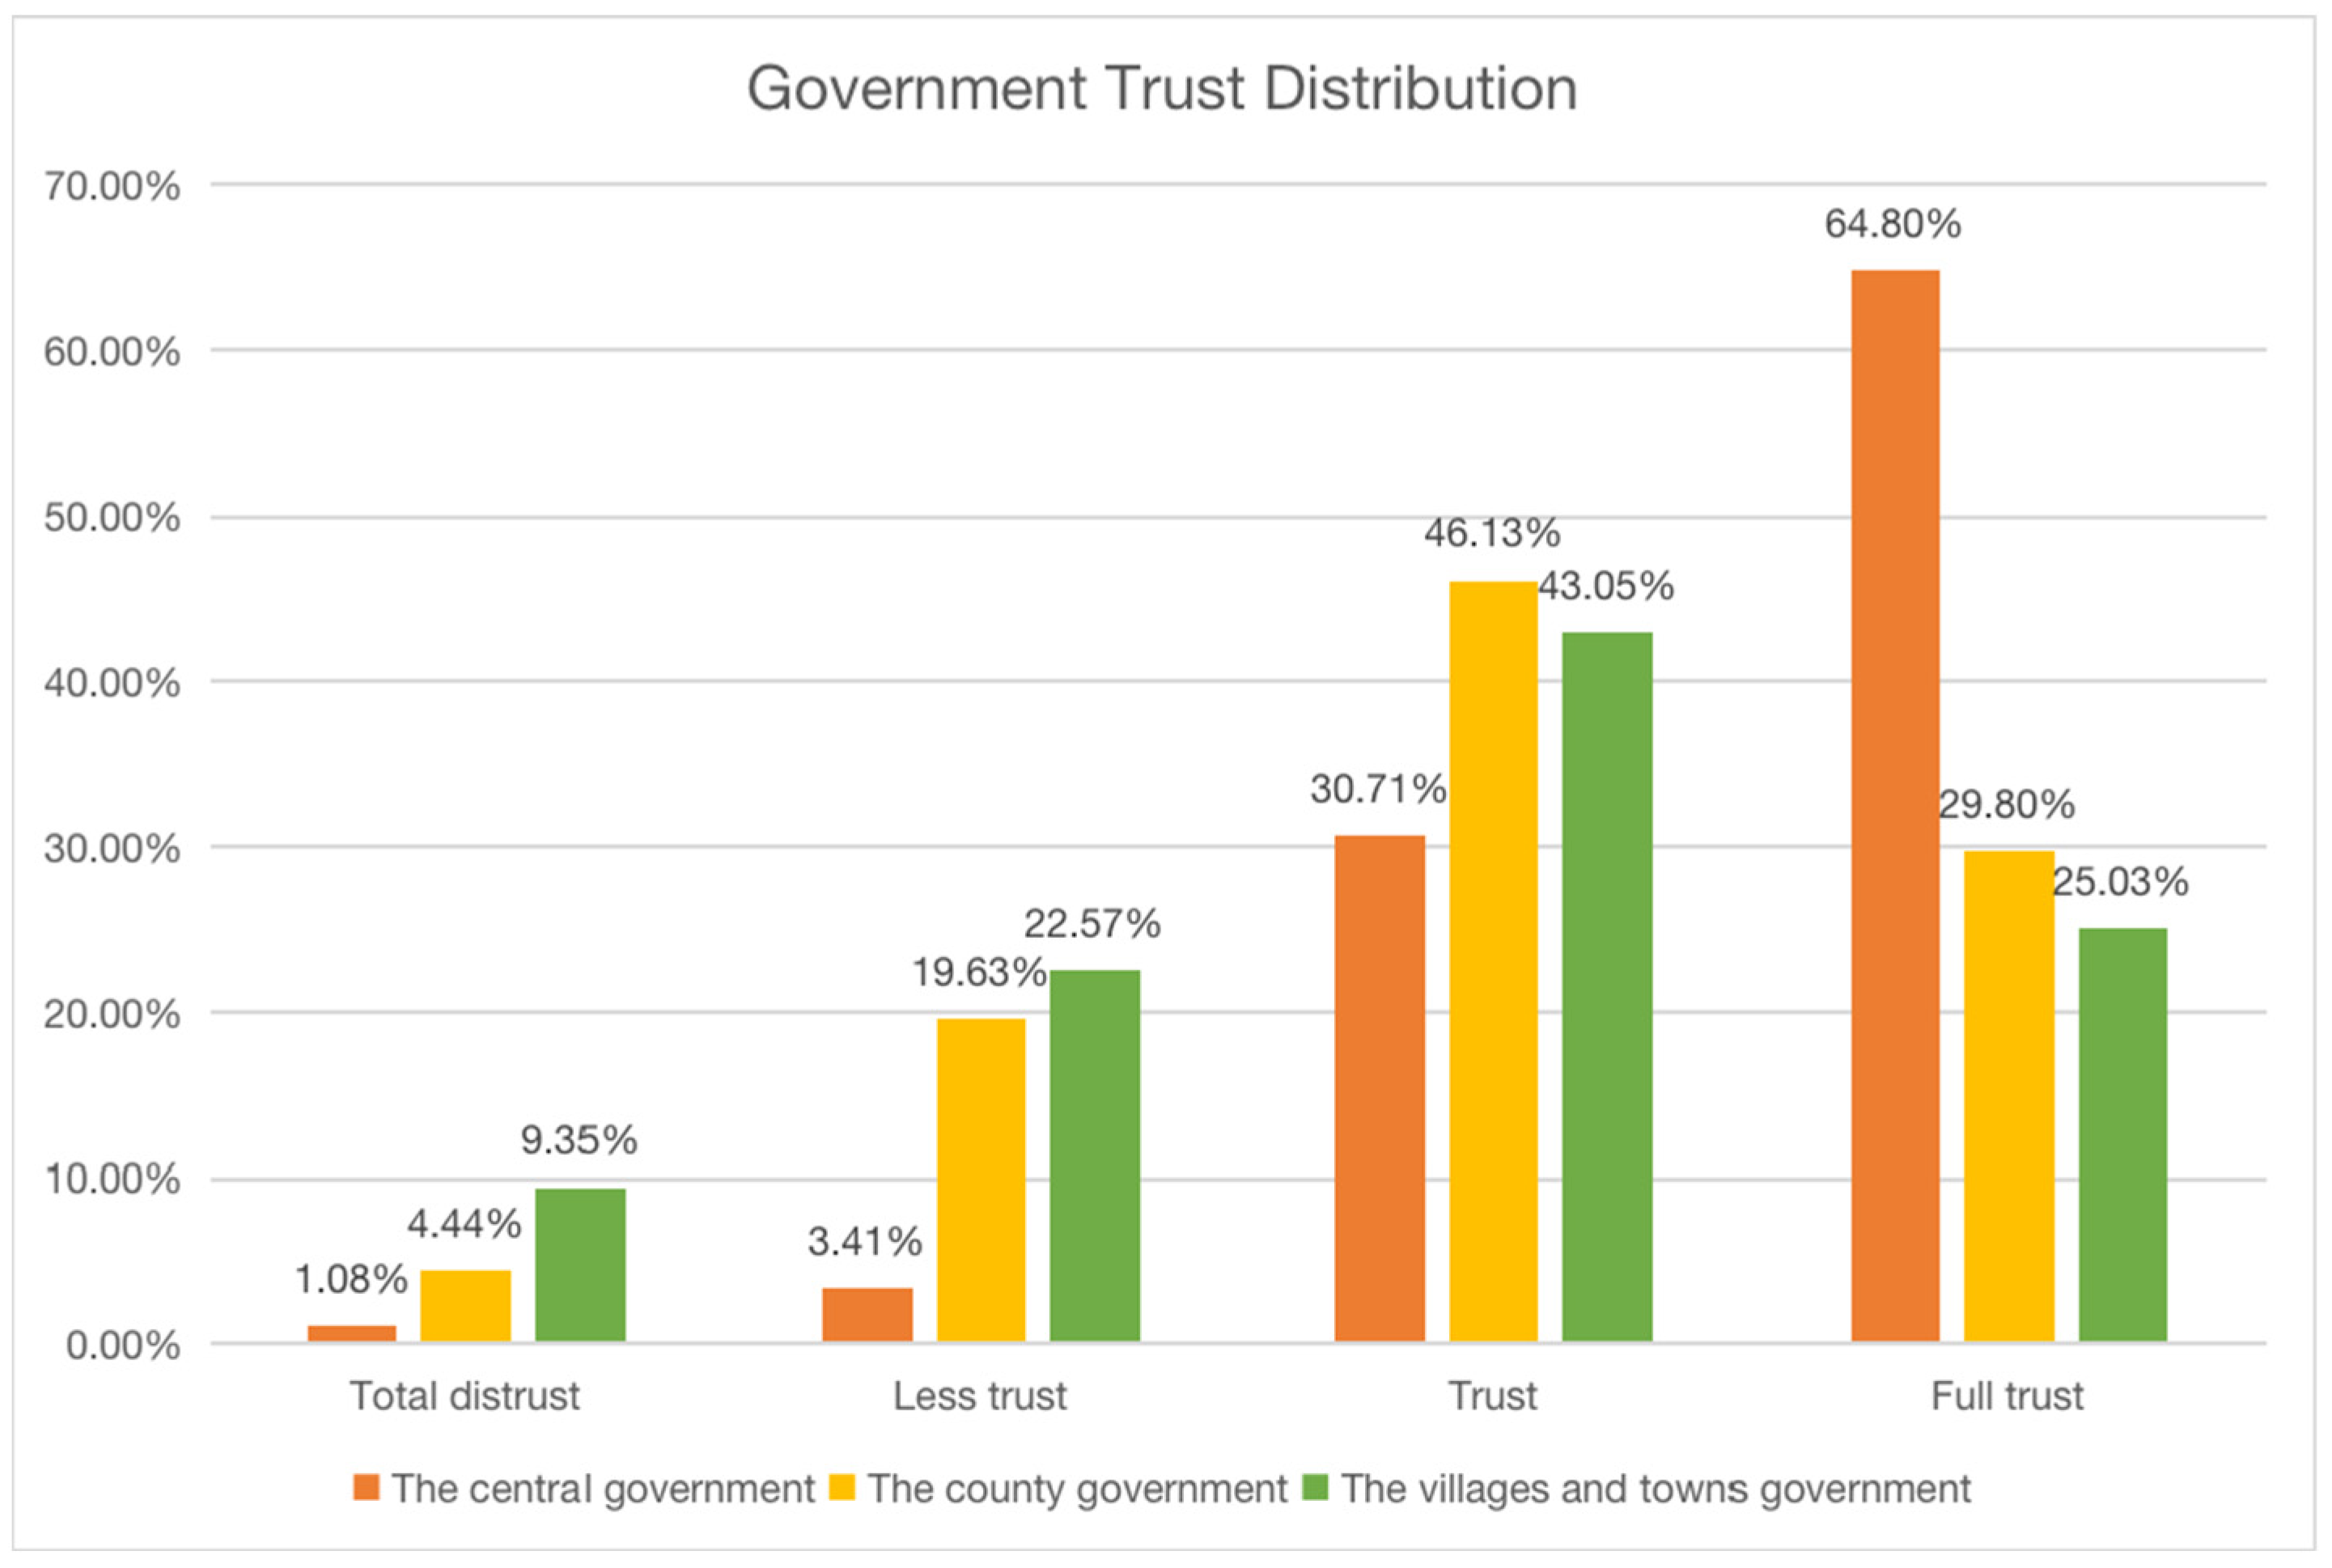
| The government trust | The central government | Total distrust = 1; Less trust = 2; Trust = 3; Full confidence = 4 | 3.59 | 0.61 |
| County level government | 3.01 | 0.82 | ||
| Township government | 2.84 | 0.91 | ||
| Environmental pollution perception | Air pollution | Very serious = 1; More serious = 2; Not too serious = 3; No such phenomenon = 4 | 2.93 | 0.93 |
| Water pollution | 2.91 | 0.96 | ||
| Noise pollution | 3.07 | 0.94 |
| Air Pollution | Frequency | Proportion | Water Pollution | Frequency | Proportion | Noise Pollution | Frequency | Proportion |
|---|---|---|---|---|---|---|---|---|
| Very serious | 422 | 10.90 | Very serious | 451 | 11.65 | Very serious | 348 | 8.99 |
| More serious | 544 | 14.05 | More serious | 635 | 16.40 | More serious | 531 | 13.71 |
| Not too serious | 1801 | 46.51 | Not too serious | 1593 | 41.14 | Not too serious | 1501 | 38.77 |
| There is no such phenomenon | 1105 | 28.54 | There is no such phenomenon | 1193 | 30.81 | There is no such phenomenon | 1492 | 38.53 |
| Sample: 3,872,100 | ||||||||
| Variable | Model 1 | Model 2 | Model 3 | |||
|---|---|---|---|---|---|---|
| β | Standard Error | β | Standard Error | β | Standard Error | |
| Control variable | ||||||
| Gender | 0.017 | 0.013 | 0.017 | 0.013 | 0.010 | 0.011 |
| Age | 0.056 *** | 0.016 | 0.078 *** | 0.017 | 0.071 *** | 0.016 |
| Education level | 0.097 *** | 0.020 | 0.045 *** | 0.016 | 0.047 *** | 0.015 |
| Personal income level | 0.017 | 0.013 | 0.027 * | 0.014 | 0.029 *** | 0.014 |
| Household income level | 0.075 *** | 0.017 | 0.059 *** | 0.018 | 0.050 *** | 0.016 |
| Socioeconomic status | 0.070 *** | 0.017 | 0.065 *** | 0.016 | 0.055 *** | 0.016 |
| Life ideal degree | 0.100 *** | 0.020 | 0.074 *** | 0.020 | 0.045 *** | 0.016 |
| Life happiness degree | 0.100 *** | 0.019 | 0.074 *** | 0.018 | 0.059 *** | 0.016 |
| Social tolerance degree | 0.155 *** | 0.018 | 0.109 *** | 0.018 | 0.064 *** | 0.016 |
| Environmental pollution perception | ||||||
| Air pollution | 0.185 *** | 0.027 | 0.167 *** | 0.024 | ||
| Water pollution | 0.138 *** | 0.021 | 0.119 *** | 0.021 | ||
| Noise pollution | 0.060 *** | 0.018 | 0.052 *** | 0.018 | ||
| The government trust | ||||||
| The central government | 0.025 * | 0.015 | ||||
| County-level government | 0.086 *** | 0.028 | ||||
| Township government | 0.207 *** | 0.029 | ||||
| F | 15.881 | 21.185 | 24.881 | |||
| Sig. | 0.000 | 0.000 | 0.000 | |||
| R squared | 0.114 | 0.181 | 0.242 | |||
| Adjusted R square | 0.106 | 0.173 | 0.232 | |||
| Sample | 3872 | 3872 | 3872 | |||
Publisher’s Note: MDPI stays neutral with regard to jurisdictional claims in published maps and institutional affiliations. |
© 2022 by the authors. Licensee MDPI, Basel, Switzerland. This article is an open access article distributed under the terms and conditions of the Creative Commons Attribution (CC BY) license (https://creativecommons.org/licenses/by/4.0/).
Share and Cite
Ruan, H.; Qiu, L.; Chen, J.; Liu, S.; Ma, Z. Government Trust, Environmental Pollution Perception, and Environmental Governance Satisfaction. Int. J. Environ. Res. Public Health 2022, 19, 9929. https://doi.org/10.3390/ijerph19169929
Ruan H, Qiu L, Chen J, Liu S, Ma Z. Government Trust, Environmental Pollution Perception, and Environmental Governance Satisfaction. International Journal of Environmental Research and Public Health. 2022; 19(16):9929. https://doi.org/10.3390/ijerph19169929
Chicago/Turabian StyleRuan, Haibo, Li Qiu, Jun Chen, Shuo Liu, and Zhiyuan Ma. 2022. "Government Trust, Environmental Pollution Perception, and Environmental Governance Satisfaction" International Journal of Environmental Research and Public Health 19, no. 16: 9929. https://doi.org/10.3390/ijerph19169929